
94% of researchers rate our articles as excellent or good
Learn more about the work of our research integrity team to safeguard the quality of each article we publish.
Find out more
ORIGINAL RESEARCH article
Front. Environ. Sci., 15 July 2022
Sec. Freshwater Science
Volume 10 - 2022 | https://doi.org/10.3389/fenvs.2022.892268
This article is part of the Research TopicRiver and Watershed Restoration, Rehabilitation and Conservation: Challenges, Actions, and PerspectivesView all 6 articles
 Rebecca L. Flitcroft1*
 William R. Brignon2
 Brian Staab2
 J. Ryan Bellmore3Jonathan Burnett1Paul Burns4
 Brian Cluer5Guillermo Giannico6Joseph M. Helstab7Jeremy Jennings6Christopher Mayes4Celeste Mazzacano8Lauren Mork9
 Kate Meyer7
 Jay Munyon1Brooke E. Penaluna1
 Paul Powers10Daniel N. Scott11,12,13Steven M. Wondzell1
Degraded floodplains and valley floors are restored with the goal of enhancing habitat for native fish and aquatic-riparian biota and the protection or improvement of water quality. Recent years have seen a shift toward “process-based restoration” that is intended to reestablish compromised ecogeomorphic processes resulting from site- or watershed-scale degradation. One form of process-based restoration has developed in the Pacific Northwest, United States, that is intended to reconnect rivers to their floodplains by slowing down flows of sediment, water, and nutrients to encourage lateral and vertical connectivity at base flows, facilitating development of dynamic, self-forming, and self-sustaining river-wetland corridors. Synergies between applied practices and the theoretical work of Cluer and Thorne in 2014 have led this form of restoration to be referred to regionally as restoration to a Stage 0 condition. This approach to rehabilitation is valley scale, rendering traditional monitoring strategies that target single-thread channels inadequate to capture pre- and post-project site conditions, thus motivating the development of novel monitoring approaches. We present a specific definition of this new type of rehabilitation that was developed in collaborative workshops with practitioners of the approach. Further, we present an initial synthesis of results from monitoring activities that provide a foundation for understanding the effects of this approach of river rehabilitation on substrate composition, depth to groundwater, water temperature, macroinvertebrate richness and abundance, secondary macroinvertebrate production, vegetation conditions, wood loading and configuration, water inundation, flow velocity, modeled juvenile salmonid habitat, and aquatic biodiversity.
Floodplain restoration targets areas that have been degraded as a result of land use, water management, or other causes, and is generally intended to enhance habitat for native fish and aquatic-riparian biota and to protect or restore water quality as well as natural flows (Ebersole et al., 1997; Roni et al., 2014). The objectives, design and implementation strategies for floodplain restoration have changed substantially over time owing to the integration of new information from monitoring, coupled with research that has evaluated the effectiveness of restoration actions (Roni et al., 2014) and frameworks (Angelopoulos et al., 2017). In recent years, “process-based restoration”, intended to reestablish compromised ecological processes resulting from site- or watershed-scale degradation, has been recognized as ecologically beneficial (Beechie et al., 2010; Powers et al., 2019; Wohl et al., 2021). Innovative approaches to process-based restoration may target restoration of ecohydraulic characteristics such as the magnitude, duration and frequency of floodplain inundation (e.g., Leopold and Wolman, 1957), connection at base flow, and native biotic recovery (e.g., Cluer and Thorne, 2014; Hauer et al., 2016; Wohl et al., 2021), requiring consideration of a suite of site-specific metrics (Sear et al., 2009).
Disconnection of floodplains from their rivers leads to degradation. Globally, only one third of large rivers remain free-flowing (Grill et al., 2019) and over a million dams of varying sizes have been identified in European rivers (Belletti et al., 2020). This disconnection reduces the resilience of river systems by altering food webs, stream habitat availability, and seasonal habitat complexity (Bellmore et al., 2015). Disconnection and reduction in accessible floodplain area results from a variety of human actions including the construction of dams, dikes, levees, and ditches that force rivers into a single-thread channel, inhibiting flooding and channel avulsion and migration (Poff et al., 1997; Wohl, 2011; Polvi and Wohl, 2013). Floodplain modifications from initial channelization are further exacerbated by incision associated with altered hydrologic regimes and the modification of sediment-transport processes (Poff et al., 1997). Process-based rehabilitation and restoration practitioners (hereafter “practitioners”) hypothesize that restoring ecological process and floodplain connectivity will reestablish the capacity of streams and wetlands to be resilient against environmental stochasticity and natural disturbances with minimal human intervention (Sear, 1994; Ebersole et al., 1997; Wohl et al., 2005). However, a potential limitation for process-based restoration is the modification of flow regimes through water control infrastructure such as dams that limit the ability of a river to be connected with the floodplain.
The goal of restoring river valleys to be self-forming, dynamic complexes that facilitate the return of ecological processes to within their natural range of variability (i.e., Ward et al., 2001; Brown et al., 2018), has led to the development of novel valley-scale approaches. In the western United States, mechanical manipulation of floodplains to restore processes at the valley scale has been implemented (i.e., Powers et al., 2019). Contrary to more traditional methods, this approach may actively or passively fill incised single-thread channels with native materials (boulder, gravel, wood, etc.), effectively elevating the channel bed and reconnecting valley floor surfaces (Figure 1). As practitioners of these methods began focusing on valley-wide processes, Cluer and Thorne (2014) were refining classic channel-evolution models (e.g., Schumm et al., 1984; Simon and Hupp, 1986) to incorporate a new stage of river-valley development called “Stage 0”. Cluer and Thorne (2014) described a Stage 0 valley as a “pre-disturbance, dynamically meta-stable network of anabranching channels and floodplain with vegetated islands supporting wet woodland or grassland”. True pre-disturbance condition is often unknown, or may never be realized due to watershed-scale modifications to disturbance processes, vegetation age and composition, soil stability and hydrologic regime (Dufour and Piégay, 2009). Rather, the goal is to restore ecological processes associated with a dynamically stable anabranching floodplain network. Hence, the hydrologic regime of a Stage 0 valley is characterized by attenuated peak floods with water diffused over a large portion of the valley floor and an elevated water table. This maximizes lateral and vertical hydrologic connectivity while reducing, but not eliminating, longitudinal connectivity (Wohl et al., 2021). Multiple channels, including smaller and sometimes ephemeral anabranching waterways, and abundant flow-exposed wood should maximize hydraulic diversity (i.e., a wide range of flow velocities and depths). In turn, these conditions are predicted to give rise to a mosaic of diverse and shifting aquatic and terrestrial habitat patches that promote the establishment, succession, and persistence of aquatic, riparian, and wetland vegetation. Collectively, these physical attributes of a valley floor at Stage 0 are posited to provide a shifting habitat template that supports ecosystem productivity and resilience, benefiting a wide range of aquatic and terrestrial species (Stanford et al., 2005; Beechie et al., 2010; Cluer and Thorne, 2014).
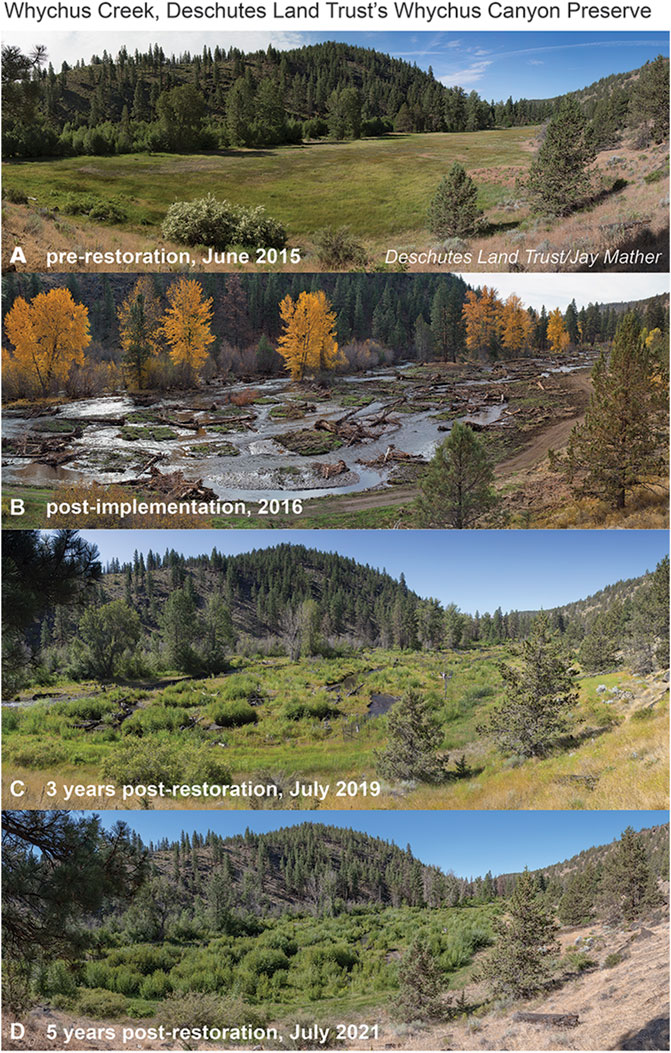
FIGURE 1. At Whychus Creek, at the Whychus Canyon Preserve, restoration to a stage 0 condition was implemented and documented with photos of: (A) pre-restoration condition; (B) immediately post implementation condition; (C) 3 years post restoration, and; (D) 5 years post restoration.
The similarity between the process-based restoration that practitioners were developing in the western United States and elsewhere, and the stream evolution model of Cluer and Thorne (2014) was compelling enough to integrate theory and practice. Hence, projects with a goal of restoration to the Stage 0 condition have come to be associated with valley scale, rather than channel or habitat scale, restoration actions intended to restore physical, chemical, and biological processes needed to promote dynamic stream and valley-floor ecosystems (Powers et al., 2019). Process-based, valley-scale restoration such as Stage 0 is hypothesized to support complex ecological interactions that occur over varying temporal and spatial scales (Beechie et al., 2010), leading to considerable uncertainty about the timeline and outcomes of this approach, as well as the necessary restoration techniques. For example, in locations with minimal anthropogenic disturbance, it may be possible to reach a Stage 0 condition quickly with less human intervention using beaver (Castor canadensis) dam analogs or post-assisted log structures (Wheaton et al., 2019). In other areas where significant human disturbance forced streams into a state of extreme degradation (i.e., Stage 3s; Cluer and Thorne, 2014), more time or substantial human intervention, such as redistribution of alluvial sediments, may be necessary to reach a Stage 0 condition (Powers et al., 2019). The projects that require substantial human intervention may also be controversial because they often require manual sediment placement in the degraded stream channel and excavation in adjacent riparian areas affecting stream sediment, configuration of stream habitats (such as deeper pools and gravel bars), and existing riparian vegetation. A better understanding of how this intervention affects water quality (e.g., sediment mobilization, stream temperatures) and ultimately habitat quality for aquatic biota including fishes is needed.
Owing to the novelty of process-based, valley-scale restoration to a Stage 0 condition, robust evaluation of its outcomes across a range of settings and through time is limited. Further, lack of a clear definition of this applied restoration approach is not currently available, complicating evaluations of outcomes and confounding comparisons with other approaches to floodplain restoration that may have different goals and objectives and/or different methods to achieve them. As such, the objectives of this synthesis were to: 1) define restoration to a Stage 0 condition; 2) inventory available physical and biological monitoring information collected by practitioners and researcher of process-based, valley-scale restoration projects targeting a Stage 0 condition; and 3) synthesize these data to describe the short-term effects (i.e., 1–5 years post-implementation) of the restoration related to questions of interest (Supplementary Table S1.2-1).
To define restoration to Stage 0, practitioners with experience in floodplain and valley-scale restoration convened a workshop in Corvallis, Oregon from 3 to 5 December 2019. A total of 24 invited participants included hydrologists and biologists from the USDA Forest Service, Oregon Department of Fish and Wildlife, multiple watershed councils, Oregon State University, and the US Geological Survey. The group developed a definition of restoration to a Stage 0 condition by consensus.
In another effort separate from the above described workshop, restoration practitioners identified the location, monitoring data, and planning documents pertaining to process-based, valley-scale restoration projects with a restoration goal of Stage 0. Projects varied from smaller, headwater areas, to large-scale projects on mid-sized rivers (Figure 2; Table 1). Practitioners provided information on project design, existing reports, monitoring data, and research questions. From these sources, an analysis of the early outcomes of restoration to a Stage 0 condition was conducted, including metrics of stream substrate composition, depth to groundwater, water temperature, aquatic macroinvertebrate richness and abundance, secondary macroinvertebrate production, vegetation condition, wood loading and configuration, inundation area, flow velocity linked to salmonid rearing habitat, and aquatic biodiversity from eDNA metabarcoding (see research questions Supplementary Table S1.2-1).
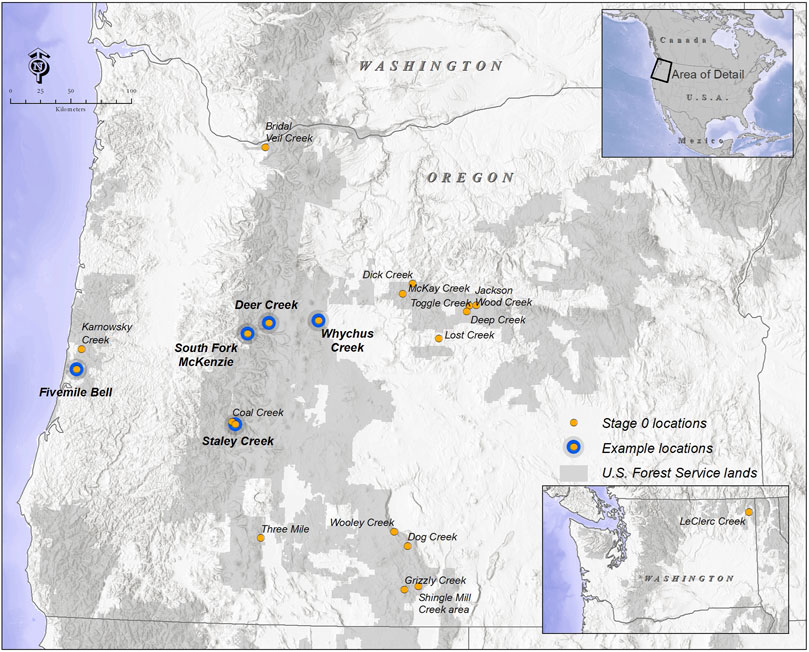
FIGURE 2. Restoration projects targeting a Stage 0 condition were identified in the Pacific Northwest, United States, and primarily in Oregon. Projects were identified based on project goals to restore reconnect rivers to their floodplain at a valley scale allowing for the development of longitudinal, lateral, and vertical hyrologic connectivity.
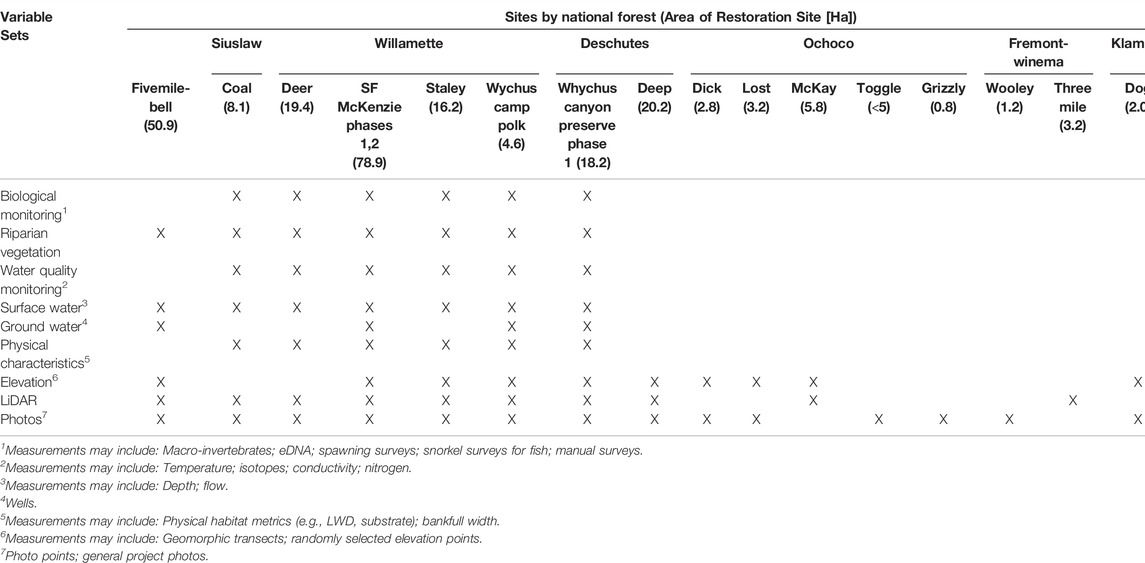
TABLE 1. Restoration sites targeting Stage 0 floodplain conditions in Oregon and Washington, United States and a summary of available monitoring data. Area of restoration site in hectares in parentheses after site name.
In naturally functioning river-wetland corridors, gravel, sand, and fine sediments are transported from sources in high-gradient headwater streams and adjacent riparian areas to be deposited on low-gradient river valleys (Fryirs et al., 2007). In many valley-floor environments, especially arable ones, these processes of deposition and aggradation have been disrupted through channel simplification or confinement, transforming slow-water depositional reaches into higher-velocity transport reaches. Restoration to a Stage 0 condition returns the fundamental valley-scale deposition process by deliberately filling or eradicating the channel and reorganizing surface and subsurface material, thus allowing for the natural development of complex river configurations. Monitoring data capturing pre- and post-restoration or an unrestored and post-restoration condition were compiled from four sites in the state of Oregon: Whychus Creek at Camp Polk (WCPolk) (Supplementary Figure S1-1b), Staley Creek (Supplementary Figure S1-6), and Deer Creek (Supplementary Figure S1-5), and South Fork McKenzie River (SFMR) (Supplementary Figure S1-4) (Supplementary Table S2-1; for additional methods and results see Supplementary Section S2). Frequency histograms were constructed for each site and year to explore these data (Supplementary Figure S2-1). Five candidate models (Supplementary Table S2-2) were then developed and compared using generalized linear modeling (GLM) in statistical software R (v1.0; R Core Team 2020) to describe the frequency of substrate types comparing unrestored with post-restoration metrics across all sites. Akaike’s information criterion corrected for small sample sizes (AICc) was used for model selection (Burnham and Anderson, 2002). Frequency histograms were constructed representing unrestored and post-restoration substrate composition using parameter coefficients from the top ranked generalized linear model.
A goal of restoration to a Stage 0 condition is to recover lateral and vertical connectivity by reconnecting surface water and groundwater across the valley floor, while sustaining or restoring longitudinal connectivity. By filling incised channels, slowing mean river flow, and spreading water across the valley floor by adding roughness elements, restoration of Stage 0 conditions is anticipated to affect groundwater depth (sensu Cluer and Thorne, 2014). At Whychus Canyon Preserve (WCPreserve) Phase 1, 12 wells were installed and instrumented with HOBO U20L water level dataloggers (Supplementary Figure S1-1a), with one datalogger installed for the whole site as a barometric datalogger recording pressure above sea level, necessary for water-level calibration. On two occasions when the barometric datalogger located at ground level inside a well vault was found submerged, pressure data from the closest weather station at the Sisters, OR, airport were substituted to calibrate water level. The above-ground datalogger was moved to another location for data collection for 2017–2019. December 2014–August 2016 represented pre-restoration water-table elevations, whereas data after September 2016 represent post-restoration conditions. Figures were generated of pre- and post-restoration depth from the surface plane to the water table at well monitoring locations.
At Fivemile-Bell, 13 groundwater monitoring wells were originally installed using HOBO water-level dataloggers (Supplementary Figure S1-2) in the floodplain corresponding with the different phases of restoration work completed at this site. Elevation above sea level of each groundwater well was determined using LiDAR, and the distance from the top of the well to the water level was manually measured monthly to verify water level measurements. Five groundwater wells have been maintained at the upper ends of each phase of restoration, and at the lower end of the project with data collected continuously from November 2013 through December 2021. Monthly data from these 5 wells from January 2017 to February 2019 were plotted to evaluate pre- and post-restoration groundwater depth in relation to surface elevations.
Water temperature is a key environmental variable linked to stream primary productivity, macroinvertebrate trait-based sensitivities, and growth rates for fishes (for primary productivity Bernhardt et al., 2022; for macroinvertebrates Poff et al., 2006; in fishes Bjornin and Reiser, 1991). Cold-water fishes are of particular management concern at restoration sites in the Pacific Northwest because many species of salmon and trout listed under the U.S. Endangered Species Act. Two sites, WCPreserve Phase 1 and Fivemile-Bell, monitored temperature pre- and post-restoration using spatially distributed temperature sensors (Supplementary Figures S1-1a and S1-2 respectively). One site, SFMR, had post-restoration temperature monitoring completed using imagery that characterized surface thermal conditions throughout the site.
To investigate the rate of stream heating, water temperature was monitored at up to 11 locations along WCPreserve Phase 1 from April through October from 2006 to 2015 (pre-restoration), and 2017–2019 (post-restoration) using Onset HOBO Water Temp Pro v2 Data Loggers and VEMCo Minilog-II-T Data Loggers (Supplementary Figure S1-1a). July represents the warmest month of the year at this site, with the most complete data across years. The maximum rate of temperature change per kilometer was calculated by comparing temperature at the upstream and downstream locations. Rate of change and surface water temperature for pre and post-restoration datasets were plotted against daily discharge recorded for Whychus Creek at the Oregon Water Resources Department (OWRD) gage in Sisters, OR.
Water temperature was monitored at up to 8 locations along Fivemile and Bell Creeks from June through September 2005–2012 (pre-restoration), from 2012 to 2020 (during phases or restoration), and 2021 (post-restoration) using Onset UTBI-001 HOBO Tidbit v1 and v2 Water Temperature Data Loggers (Supplementary Figure S1-2). Loggers were suspended above the stream bed, and were deployed out of direct sunlight in water up to 1 m in depth. The intent was to monitor the effect of the stream restoration on mean water temperature at this site, therefore we graphed average daily water temperature between 1 July and 15 September at each logger location.
Water temperature was monitored post-restoration at the SFMR to explore the use of thermal imagery from unpersonned aircraft systems (UAS; hereafter drones) to augment traditional monitoring approaches across the wide spatial extent of the restored reach. Drone surveys were flown twice each year, targeting a spring flight at high flows before leaf-out and a late-summer flight under low-flow conditions. Thermal-infrared imagery can be limited because the sensor only records the surface temperature of objects in its view, thus the thermal imagery may not accurately reflect temperatures throughout the water column unless the water is well mixed. To validate the imagery, HOBO U22 temperature data loggers were deployed at the site. Here we illustrate our results with data collected by the temperature loggers over the summer of 2020 and the thermal imagery from the drone surveys on 4 September 2020 between 20:46–22:18 UTC.
To identify the influence of the restoration on water temperature, we needed an estimate of the expected temperature of the reach if it had not been restored. We used data from the USGS gage below Cougar Dam and a logger located above the restoration reach to estimate of the rate of heating (or cooling) with distance from the USGS gage. Then, we used the rate of heating (or cooling), along with the distance to the middle of the Phase 1 restoration reach, to estimate the expected un-restored temperature, for comparison with temperatures actually observed within the reach. However, with only a single-point measurement of the temperature above the restored reach, we have no way of quantifying spatial heterogeneity in water temperature prior to restoration. Therefore, we used the portion of the mainstem McKenzie River visible in the drone imagery as a surrogate for pre-treatment spatial variation because both it and the pre-restoration SFMR had simple, single-threaded, boulder and cobble bedded channels so we assumed they would have exhibited similar trends in spatial variation. We calculated summary statistics from the thermal imagery for two zones: the mainstem McKenzie and the restored SFMR. Note that we focus on spatial variability in this analysis because the mainstem McKenzie is predominantly a spring-fed river with markedly cold water temperatures, whereas water temperatures in the SFMR are controlled by dam operations and the mixing of water from different depths in the reservoir. Also note that calibration of the thermal imagery with the temperature logger data has not yet been conducted. Therefore, we evaluate relative differences and patterns as is appropriate with this data, rather than presenting absolute values (for additional sample design, analysis and results see Supplementary Materials Section S3).
Stream productivity and biodiversity are important characteristics of functioning aquatic ecosystems. Monitoring of macroinvertebrates and overall aquatic biodiversity provides an opportunity to characterize the diversity of habitats and species that occupy a site before and after restoration. At SFMR, aquatic macroinvertebrates were evaluated with two different projects and aquatic biodiversity was assessed with eDNA metabarcoding. The first macroinvertebrate project included pre- and post-restoration sampling of macroinvertebrate abundance, biomass, and assemblage composition. The second focused on secondary productivity.
Stage 0 restoration is expected to create a diversity of aquatic habitat types and the spatial distribution of samples should represent physiochemically distinct strata (hydraulics, substrate, temperature, light, etc.), that are likely to have distinct biological communities. Therefore, pre- and post-restoration aquatic macroinvertebrate and eDNA sampling at SFMR followed a transect-based approach (Supplementary Figure S1-4) which allowed for the sampling of different habitat types as they developed over time. Transects directly associated with earth movement and levee deconstruction, and that also contain both mainstem (pre-restoration) and floodplain habitats were targeted for sampling (restored Phase 1–Transect 1 (T1), Transect 2 (T2); restored Phase 2–Transect 5 (T5); unrestored Phase 3–Transect 8 (T8)).
For eDNA, three transects (1, 2, and 5) at SFMR were evaluated to understand aquatic biodiversity changes in response to restoration activities using eDNA surveys during pre- and post-restoration (detailed sampling methods in Supplementary Materials Section S4). We targeted fishes, amphibians, mussels, crayfishes, and beaver with eDNA metabarcoding. Although transects remained in the same geospatial position over time, the number and types of strata present on a transect changed in response to restoration (strata details above; Supplementary Table S4-1). To ensure that sampling effort remained the same over time, duplicate eDNA samples were evaluated from each strata and pooled within their respective transect for each time period. Accordingly, the eDNA data was evaluated by summing species richness across strata for each transect during spring of 2018–2021.
For macroinvertebrates, sample collection began in the autumn of 2017 and continued every spring (May/June) and autumn (September/October) through 2021 with the exception of autumn 2018 (immediately after restoration was completed). Surface-water habitats of a minimum size (at least 10 cm in depth and 10 m2 in area) were sampled along each of these transects (detailed sampling methods in Supplementary Materials Section S4). Samples were compared between pre- and post-restoration sites along transects T1, T2, and T5; and unrestored, T8, sites located upstream of the restored area. Restoration occurred in summer of 2018 in the Phase 1 area encompassing T1 and T2; and in summer of 2019 in Phase 2 area including T5. Thus, results were presented in terms of months post-restoration for all restored-site samples, and all pre-restoration or unrestored samples were combined regardless of collection year. Response metrics of macroinvertebrate taxa richness, density (number/m2, ln-transformed), and biomass (drymass mg/m2, ln-transformed) were compared between habitat-treatment types with ANOVA (n = 94 samples; pre, post, or ref) using statistical software R (v. 4.1.2; R Core Team 2020). Tukey’s HSD post-hoc multiple comparisons test was used to identify significant contrasts when treatment type was significant. Linear regression was then used on each response metric to test for a change over time among post-restoration samples only (n = 54; 1.5–33 months).
In 2019 and 2020, secondary production of aquatic macroinvertebrates was evaluated in response to Stage 0restoration using a control-impact study design (Jennings, 2021). Average annual biomass of individual invertebrate taxa (g AFDM m−2) was quantified from seasonal sampling of benthic substate and submerged wood surfaces using a modified Surber sampler in the restored reach, and an unrestored upstream reach. Seasonal sampling was conducted using a stratified-random sampling design, with sampling stratified by the unique patch types found in the restored reach, including the main-channel, perennial side channels, flooded forests, and submerged wood surfaces. Monthly aquatic invertebrate samples were also collected from a single riffle location, just upstream of the restoration location, to examine the annual growth or turnover rate of each taxon using the size-frequency approach (Benke and Huryn, 2017). Annual production (g AFDM m−2 y−1) was then calculated by multiplying average taxon biomass by the annual growth rate of each taxon, and total secondary macroinvertebrate production was calculated by summing taxon-specific estimates.
Shallow groundwater has potential to influence emergent vegetation conditions that can be assessed using remotely sensed imagery. At WCPreserve Phase 1, we used publicly available 1-m resolution imagery collected as part of the National Agricultural Imagery Program (NAIP) to evaluate land-cover changes using an isocluster unsupervised classification method in ArcMap 10.5.1. Imagery analyzed included 2009, 2014, and 2020 (restoration occurred in 2016). Six layers were used as inputs for each year, including all 4 NAIP image bands (red, green, blue, and near infrared), a normalized-difference vegetation index (NDVI) layer calculated using NAIP bands 1 and 4, and a segmented image that used spectral weighting of 15.5, spatial weighting of 15, and a minimum segment size of 20. After isocluster unsupervised classification, the resulting image was reclassified as either Bare Ground, Sparse Vegetation, Dense Vegetation, Water, or Shadow, as compared with the original NAIP image modified to be viewed as color infrared. A confusion matrix was generated based on at least 300 stratified random points per image and compared to the CIR image for groundtruthing. Percent overall accuracies were calculated and reported.
Wood roughens stream channels, influencing the development of complex habitats, altering river hydrology, and leading to resilience in populations of native species (in fishes Quinn and Peterson, 1996; in macroinvertebrates O’Connor, 1991). Introduction of wood is a key component of restoration to Stage 0 across the sites in this assessment. Wood load was computed as the ratio of wood-covered area to valley-bottom area (i.e., channels, floodplains, and terraces) within the project reach. Wood mapping in imagery was supplemented by qualitative assessment of 1-h interval timelapse imagery collected during high flows at two locations in the project area. At Deer Creek in the central Oregon Cascades, wood movement was monitored in detail by mapping all visible pieces in orthomosaics generated from aerial imagery (Scott et al., 2022). Orthomosaics were created by collecting images from drone flights at low altitude over the site, then processing images using structure-from-motion photogrammetry with a ground resolution on the order of 1 cm. In ArcGIS Pro, polygons were drawn around all visible wood, including any wood that could be inferred to be present beneath obstructions such as canopy cover (e.g., when a log appeared to disappear under canopy but was visible on either end of the obstruction). Ground observations and geolocated photos helped refine imagery mapping.
An outcome of restoration to a Stage 0 condition is the increased distribution of water across the valley floor. This changes the overall wetted area and patterns of floodplain inundation, with implications for the area of aquatic habitat, as well as vegetation response, thermal conditions, and groundwater elevations. Inundated area and wetted edge were estimated by mapping based on multi-spectral orthoimagery at the SFMR restoration site and from hydraulic model results at Whychus Creek Preserve Phase 1.
At the SFMR site, pre-restoration data was derived from the 2016 Oregon State Imagery Program data collected in early summer 2016 (discharge 8.78 m3 s−1), and post restoration data in late summer 2020 (discharge 14.22 m3 s−1) by drone. Analysis was completed using ArcGIS Pro (ver. 2.4). Inundated area was estimated using the supervised classification tool and a NDVI derived from the imagery for each year. Follow-up processing was required for the post-treatment estimate, owing to the presence of narrow inundated channels that were occluded in the imagery. Occluded inundation area was estimated by using digital elevation models (DEMs) derived from Light Detection and Ranging (LiDAR) data collected in early-summer 2020 to create a Height Above Nearest Drainage (HAND; Nobre et al., 2011) surface. A maximum vertical change of 0.3 m was heuristically determined to best capture inundated area in the occluded areas, based on congruence to inundated area estimated from imagery and analyst’s recollection of conditions in occluded channels. The result was combined with the non-overlapping components of the inundated area estimate to create a more complete estimate of inundated area post-treatment. Pre- and post-restoration wetted edge was estimated by calculating the perimeter of the respective inundated area using ArcGIS. Finally, wetted edge complexity was quantified with a ratio index where the denominator is the perimeter of a hypothetical circle having a given inundated area and the numerator is the wetted edge associated with the given inundated area.
At WCPreserve Phase 1, total inundation area was estimated pre- and post-restoration, and further analyzed to estimate suitable juvenile salmonid rearing habitat area (see modeling methods in velocity section following).
Changes in surface elevations and water routing across the valley floor may change inundation patterns and diversity of water velocity when restoration to Stage 0 is implemented, altering quantity and patterns of suitable fish habitat. At the WCPreserve Phase 1 site (completed in 2016), LiDAR was flown before the restoration project (2009) and after (2017), each generating a DEM with 0.9-m grid resolution. The US Army Corps of Engineers, Hydrologic Engineering Center—River Analysis System (HEC RAS), software was used to create two-dimensional hydraulic models from each DEM to represent pre- and post-restoration conditions. Each grid cell was assigned the same spatially uniform roughness coefficient for the pre- and post-restoration models, 0.05 and 0.12 respectively. The model boundary conditions were set for an input flow boundary at the upstream end and a normal depth boundary at the downstream end.
The models were run to convergence for 14 different flows ranging from summer base flow (0.51 m3 s−1) to the 100-years event (58 m3 s−1). Wetted area and velocity results for each flow were exported to ArcGIS software where the areas meeting specific velocity ranges were tallied. Model verification was satisfied by visually comparing modeled wetted areas to aerial photographs taken at the same flow (Supplementary Material Section S5).
Off-channel fish rearing habitat is a primary goal for floodplain reconnection projects. Model results were interpreted to describe suitable juvenile salmonid rearing habitat at the WCPreserve Phase I restoration site. Juvenile salmonid rearing habitat was defined by the single parameter of velocity—any wetted area with flow velocity ≤0.3 m s−1. This study did not use the common multi-metric habitat suitability indices because: 1) vegetation cover undergoes rapid successional growth following restoration to Stage 0, 2) juvenile fish were found using all substrate areas (ranging from cobble to silt) in a post-restoration survey, and 3) recent studies have shown that juvenile coho salmon (Oncorhynchus kisutch) utilize even the shallowest water (< body height) at night (Hines et al., 2017) in settings similar to each of the multiple channels at the WCPreserve Phase I.
Workshop participants defined restoration to Stage 0 as “a valley-scale, process-based (hydrologic, geologic, and biological) approach that aims to reestablish depositional environments to maximize longitudinal, lateral, and vertical connectivity at base flows, and facilitate development of dynamic, self-forming, and self-sustaining wetland-stream complexes”. Through additional discussions and a review of the literature, the group further developed, refined, and integrated descriptions of various components of this definition and how restoration Stage 0 addresses those components. Underlined terms are defined in greater detail in the following paragraphs.
The valley-scale component defines the spatial extent of the restoration action as an unconfined valley floor. Valleys floors include comparatively flatter, lower-lying portions of the valley (i.e., excluding hillslopes), generally including the channel, floodplains, and floodplain-adjacent terraces (Gallant and Dowling, 2003; Nagel et al., 2014). Unconfined valley floors are wider, depositional features that often have finer-grained sediment than confined valleys, and may contain extensive alluvial fill. These valleys, often defined as having a ratio of valley width to bankfull width of greater than or equal to four (Grant and Swanson, 1995; Nagel et al., 2014), are conducive to channel migration, meandering, and island-braiding when not artificially confined or starved of flow, sediment, wood, or biota (Beechie et al., 2006; Hall et al., 2007; Wohl, 2011; Beechie and Imaki, 2014; Wohl et al., 2021). Restoration to Stage 0 is principally planned and designed at the extent of the valley (1–10 s km longitudinally; 0.1–1 km laterally), rather than at the scale of the channel or a stream reach (0.1–1 km longitudinally, 1–10 s m laterally). Ultimately, conditions and processes occurring at broader and finer scales also inform the restoration process (Powers et al., 2019).
Process-based restoration is the implementation of actions to recreate physical, chemical, and biological processes at natural or desired magnitudes that support river and floodplain ecosystems over time. Actions are designed to ameliorate human impacts and enable ecosystems to develop over time, eventually becoming self-sustaining. Processes (e.g., erosion and sediment transport) involve the movement of, or changes to, ecosystem components and features and are expressed at multiple hierarchical scales (Beechie and Bolton, 1999; Beechie et al., 2010; Powers et al., 2019).
Process-based restoration focuses on reestablishing the dynamic interaction among the hydrologic, geologic, and biological processes that provide long-term ecosystem resilience (Castro and Thorne, 2019). This contrasts with deterministic, form-based restoration that seeks to create specific, static habitat characteristics perceived to be “good” for targeted aquatic organisms (Wohl et al., 2005; Beechie et al., 2010; Powers et al., 2019).
Depositional environments are areas of the landscape, such as unconfined or partially confined valleys, where sediment and other materials are deposited. Disturbance processes, including flooding and debris flows, occurring over various timeframes are inherently dynamic. Restoration to Stage 0 targets historically depositional environments that have been transformed into transport environments via land use (Castro and Thorne, 2019; Powers et al., 2019; Wohl et al., 2021).
Connectivity refers to hydrologic connectivity, the water-controlled exchanges of matter and energy within and among features of the valley floor (Kondolf et al., 2006). Connectivity is considered in longitudinal, lateral, and vertical dimensions and over time (Ward, 1989). The degradation of formerly unconfined, depositional valley floors generally leads to an increase in longitudinal connectivity (i.e., greater conveyance of flow, sediment, etc.) and a decrease in lateral and vertical connectivity. Stage 0 valley floors, in contrast, tend to have lower longitudinal connectivity and higher lateral and vertical connectivity than surrounding stream segments (Wohl et al., 2021). Restoration to Stage 0 focuses on eliminating or reducing anthropogenic constraints, to restore lateral and vertical connectivity as needed to recreate or sustain dynamic wetland-stream complexes in places where they naturally occurred.
Self-formed and self-sustaining means that configurations of micro and macro-habitats arise and adjust themselves naturally over time in response to evolving interactions among hydrologic, geologic, and biological processes (Castro and Thorne, 2019). Stage 0 restoration is intended to facilitate interactions between processes so that a range of habitat expression and configuration occurs over time.Where dynamic wetland-stream complexes historically occurred, they are integrated systems of wetlands and streams wherein the complexity and heterogeneity of micro and macro-habitats for native species develop and change over time in response to hydrologic, geologic, and biological processes. In restoration to Stage 0, as native flora and fauna interact with water and sediment, initial configurations of habitat immediately after restoration are anticipated to change along non-linear trajectories that are not predetermined (Castro and Thorne, 2019; Wohl, 2019).
Stream restoration practitioners identified over 20 sites where process-based, valley-scale intervention was intended to restore dynamic river systems (Figure 2). Some of these projects were completed before the advent of the term “Stage 0”. Recent projects are that larger in spatial extent tended to have more focused monitoring completed than earlier, smaller projects (Table 1). These results helped identify those sites to be included in this synthesis.
Model coefficients describing the interaction between substrate type and treatment identify a negative relationship with the frequency of cobble, boulder, and bedrock substrates after restoration, and a positive relationship with the frequency of fines and gravel (Supplementary Table S2-3). This is reflected in the frequency histogram of grain sizes in the combined analysis of all sites (Figure 3).
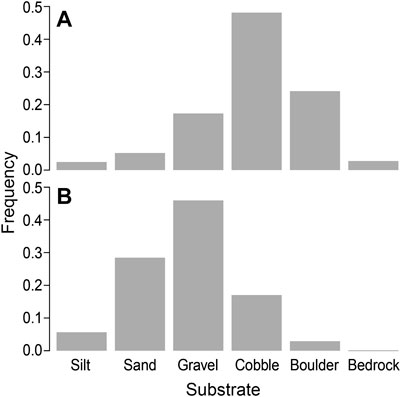
FIGURE 3. Substrate composition sizes across (A) pre-restoration or unrestored sites compared with (B) post-restoration at four sites restored to a Stage 0 condition (Staley Creek, Deer Creek (phase 1), South Fork Mckenzie River (phase 1), Whychus Creek at Camp Polk).
At both WCPreserve Phase 1 and Fivemile-Bell, depth to groundwater decreased post-restoration. This pattern was particularly pronounced during summer low-flow periods (Figures 4A,B).
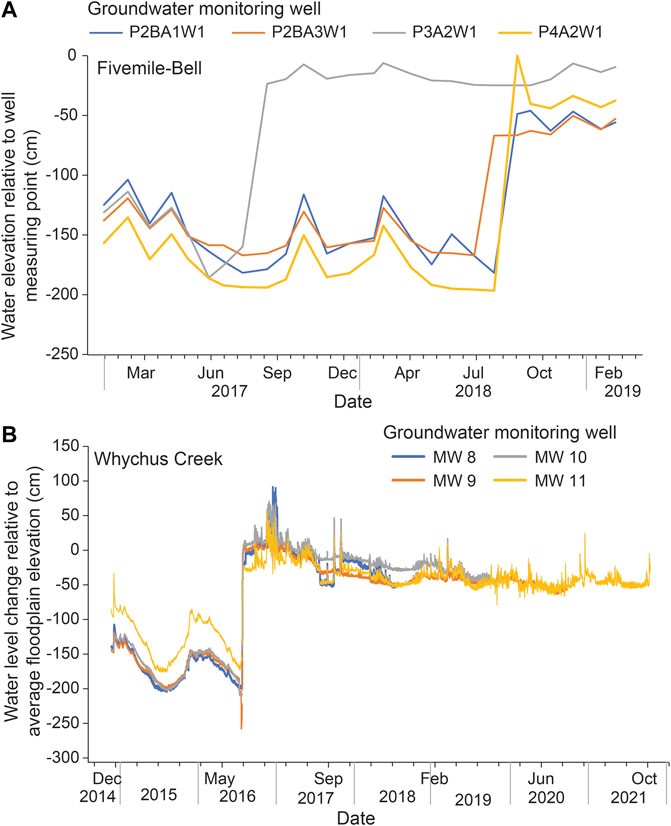
FIGURE 4. Surface and water table depth at (A) Fivemile-Bell Creek; and (B) Whychus Canyon.
At WCPreserve Phase 1, maximum groundwater depths pre-restoration occurred in August, ranging from −2.5 m to −1.7 m. Minimum groundwater depths occurred between late December and mid-February, at −1.2 m to −0.3 m. Maximum groundwater depths post-restoration occurred between late July and mid-September, ranging from −0.6 m to −0.1 m. In contrast to pre-restoration conditions, these post-implementation groundwater levels are within the range needed to support hydrophytic vegetation at this site. Minimum groundwater depths occurred between late October and April, at −0.6 to 0 m.
At Fivemile-Bell, pre-restoration, minimum groundwater depths occurred in the wet-season months between November and February, ranging from −1.29 m to −1.03 m depending on the site. Maximum groundwater depths occurred between June and September, at −2.05 m to −1.93 m. Post-restoration, minimum groundwater depths occurred between October and February, ranging from −0.1 to 0 m. Maximum groundwater depths occurred between late July and October, at −0.24 m to −0.65 m.
At the WCPreserve Phase 1 site, higher variability in thermal change per kilometer was apparent at low-flows pre-restoration (−0.07°–0.26°C km−1), while the rate of change at all flows post-restoration remained relatively steady (0–0.13°C km−1). Rate of change at higher flows appeared lower post-restoration than pre-restoration (Figure 5A). July surface temperature remained within the same range of variation present in the pre-restoration data (Figure 5B).
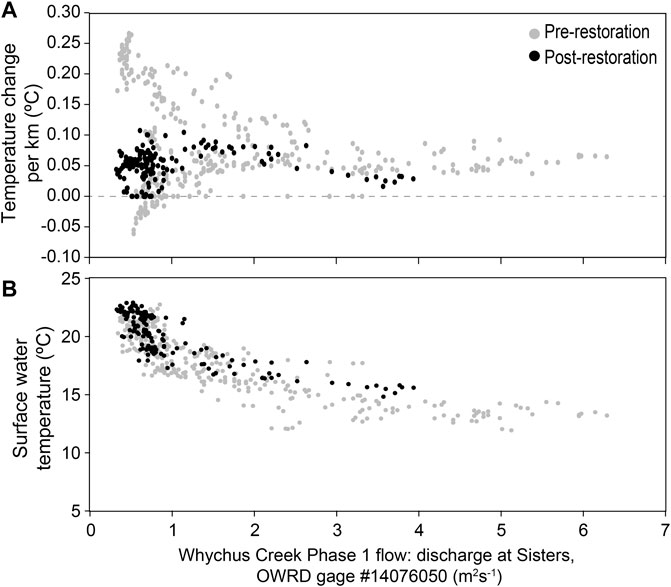
FIGURE 5. Water temperature pre- and post-restoration to a Stage 0 condition at Whychus Creek at Whychus Canyon: (A) rate of change per kilometer, and; (B) surface temperature (°C).
At Fivemile-Bell, the lowest temperature observed was 5.79°C in November 2007. Minimum temperatures across all sites typically occurred between October and December (5.79–10.58°C). From 2003 through 2013, maximum temperatures occurred from July through September (16.33–18.52°C), with an outlier extreme of 20.1°C in July 2003. Post-restoration maximum temperatures ranged from 20.75 to 29.92°C. However, daily average temperatures did not exceed 23°C during the same time period (Figure 6C). Despite the intial temperature increase following restoration activities, the distribution of daily average temperatures began to trend cooler in subsequent years (Supplementary Figure S1-3).
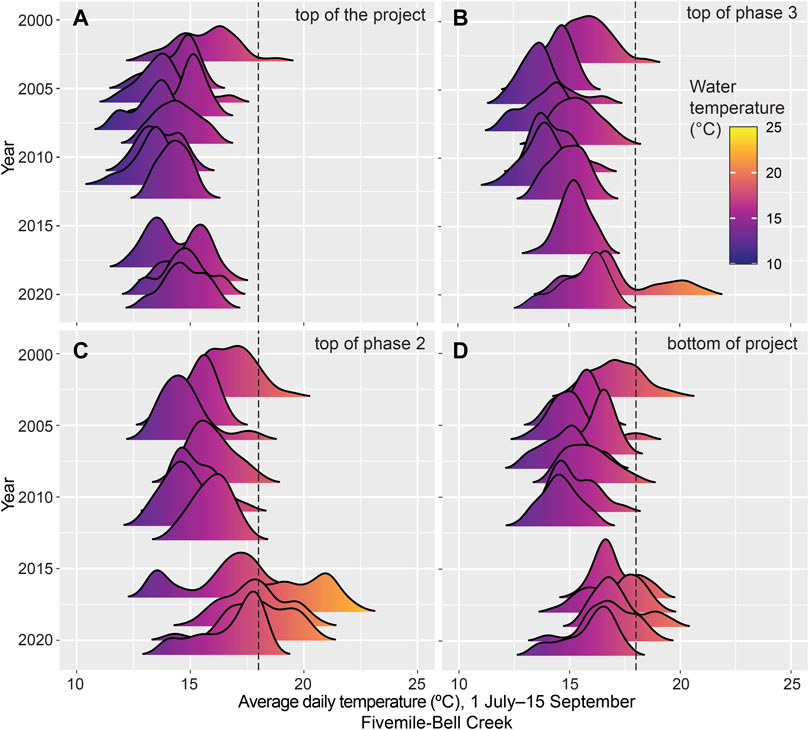
FIGURE 6. Stream temperature over time at Fivemile Bell site that drains into Tahkenitch Lake on the south coast of Oregon, United States.
At the SFMR, water temperatures in the restored reach were warmer than the expected water temperature if the reach had not been restored, as shown by measurements from the temperature data loggers (Supplementary Table S3-3). In general, more warming occured in midsummer than in late summer or early autumn because days are longer and daily solar radiation is considerably greater, although these relationships are confounded by changing discharge resulting from dam operations. During a 2-week mid-summer period (6–19 July 2020) temperature increases were largest for daily maximum temperature (+0.75°C), intermediate for daily mean temperature (0.40°C), and very small for daily minimum temperature (0.01°C; Supplementary Table S3-3). The comparison between the expected pre-restoration temperature and the average observed temperature masks potentially interesting responses. In the most extreme case, one data logger recorded a two-week-long average of the daily maximum temperature more than 4°C above the expected temperature. Over the same interval, the logger with the coolest daily average temperature recorded an average daily maximum 0.06°C cooler than the expected pre-restoration temperature (Supplementary Table S3-3). Temperature changes of a few 100ths of a degree should be considered as “no change” when considering the overall accuracy of the data loggers. However, the huge range in temperatures measured in just 6 loggers located in the Phase 1 restored reach demonstrates the high degree of spatial and temporal variability in thermal regimes after restoration.
The thermal imagery (Figures 7A–C) shows temperatures from 4 September 2020 surveyed between 1:46 to 3:18 p.m. PDT, with average water temperatures at the USGS gage of 13.88°C. Based on the rate of heating with distance, the expected pre-restoration average water temperature would have been 15.82°C. In contrast, no point location on the thermal imagery was colder than 14.0°C (Figure 7C; Supplementary Table S3-4), and the median temperature of the surface of the water was 20.4°C. The imagery (Figure 7A) also shows higher spatial variation in temperatures in the restored SFMR than in the mainstem McKenzie River. The surface temperature of the mainstem had a standard deviation of 0.9°C and a range of 4.2°C (Supplementary Table S3-4), with visibly warmer water evident along channel edges and a patch west of the Phase 1 outlet. Phase 1 appears more heterogeneous, having surface temperature standard deviation of 1.6°C and a range of 6.1°C (Supplementary Table S3-4), with warmer water present near accumulated woody material and the stream edge. These differences are clearly shown in the width and shape of the frequency distributions of the surface water temperatures (Figure 7B vs Figure 7C).
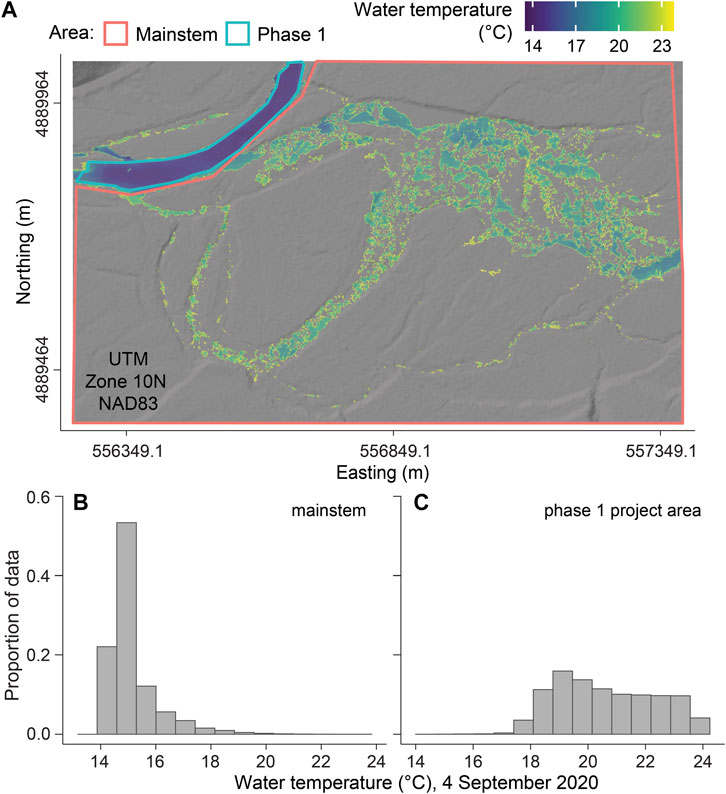
FIGURE 7. Water temperature derived from UAS imagery of: (A) the mainstem McKenzie River, and in the phase 1 restoration reach of the South Fork McKenzie River; (B) temperature distribution of mainstem on 4 September 2020; and (C) temperature distribution of Phase 1 of Stage 0 restoration reach on 4 September 2020.
Generally, similar values of aquatic macroinvertebrate richness, abundance, and biomass were found among pre-restoration, post-restoration, and unrestored sites in the SFMR (Figures 8A–C). Invertebrate richness and biomass were not significantly different pre-restoration, whereas density was significantly lower (Supplementary Table S4-2). However, all metrics increased over time following restoration (Supplementary Table S4-2). Samples collected approximately the first year after restoration (1.5–14 months) have richness, density, and biomass values within the range of pre-restoration. Samples collected approximately 2–3 years after restoration (21–33 months) have higher values compared to pre-restoration, but within the range of unrestored samples. Comparisons of overall taxa richness, density, and biomass did not account for changes in assemblage compositions. That said, qualitative differences in community assemblages were observed. The snail Juga (Juga hemphilli maupinensis), for instance, comprised an average of 22 and 24% of the biomass in unrestored and pre-restoration samples, but only 5% of the biomass post-restoration.
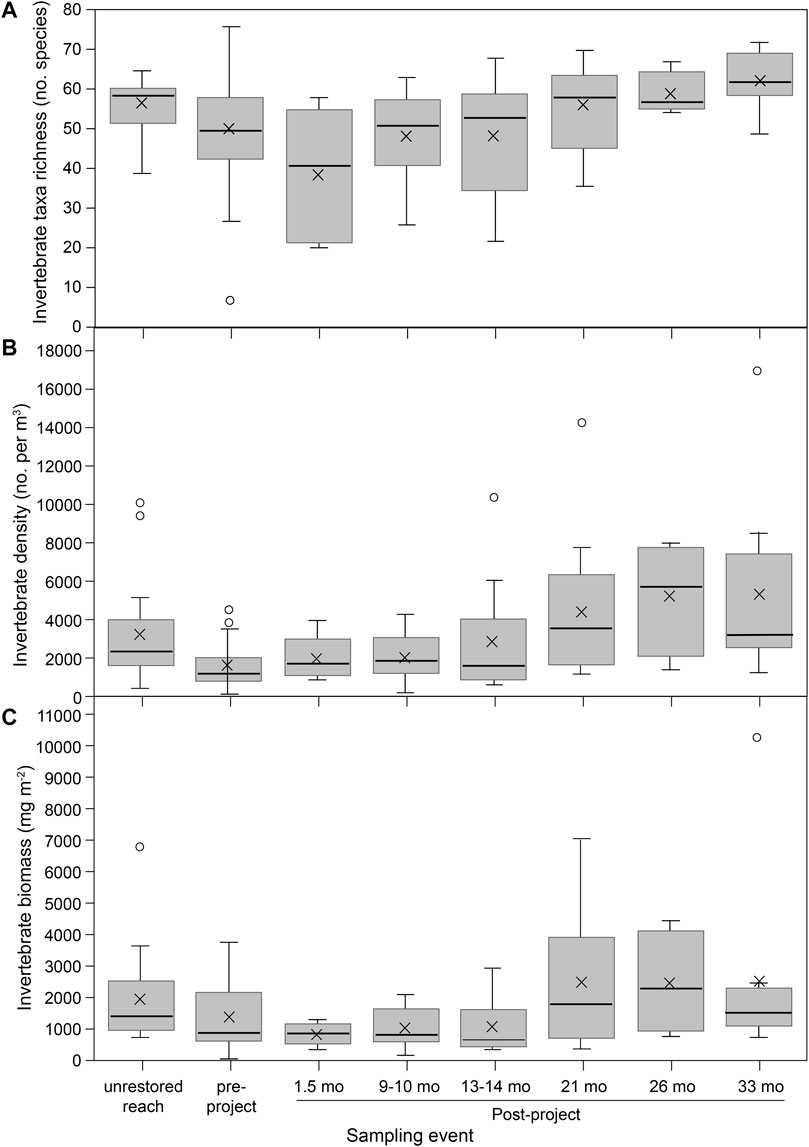
FIGURE 8. South Fork McKenzie River benthic macroinvertebrates from reference (unrestored) habitats, pre-restoration, and in the months post-restoration for: (A) invertebrate taxa richness; (B) invertebrate density; and (C) invertebrate biomass. Boxplot center line is the median, and X is the data mean.
Secondary macroinvertebrate production in the restored reach of the SFMR was lower than unrestored reaches on a per-square-meter basis from July 2019 to July 2020 (9.8 g AFDM m−2 y−1 in unrestored vs. 29.6 g m−2 y−1 in restored, on average (Figure 9A; Jennings 2021). However, when scaled to the greater area of wetted habitat available (Supplementary Table S4-1), the restored reach had ∼3x as much macroinvertebrate production. Per kilometer of valley length, the restored reach produced 2,750 kg (AFDM km−1 yr−1) over the year, whereas unrestored reaches supported only 802.3 kg of macroinvertebrate production (Figure 9B).
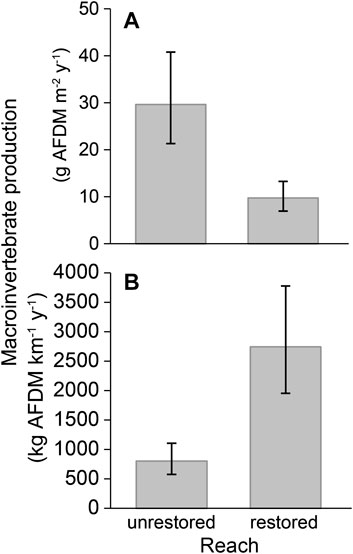
FIGURE 9. Macroinvertebrate production on the South Fork McKenzie River, OR: (A) on a persquare-meter basis, and; (B) per kilometer of valley length.
Aquatic biodiversity changed in species richness across taxa post-restoration relative to pre-restoration at SFMR across fishes, amphibians, mussels, crayfishes, and beaver (Table 2; for species presence/absence list see Supplementary Material Table S4-3). Species richness was orders of magnitude higher post-restoration in Transects 2 and 5, while for Transect 1 pre-restoration richness was higher. There were more amphibians, crayfishes, and mussels post-restoration at Transects 2 and 5, whereas these taxa went undetected pre-restoration. Transects 1 and 5 showed an increase in number of species post-restoration over time, whereas Transect 2 had relatively equal species detections across years post-restoration. Overall, eDNA surveys detected 1 to 12 species per family across taxa. However, eDNA is an emerging tool and some inaccuracies in species identification is likely.
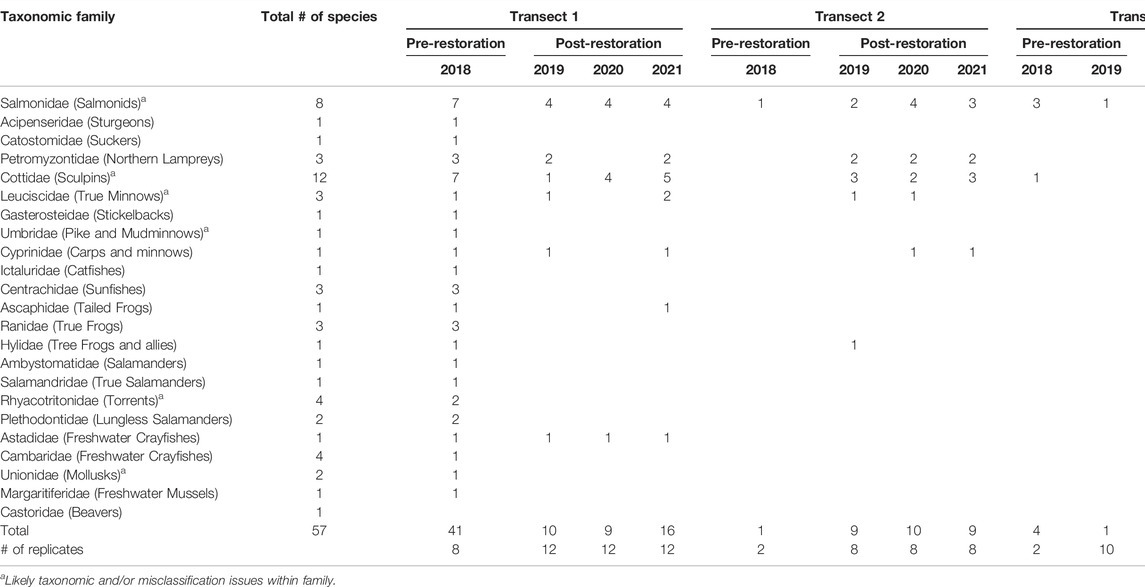
TABLE 2. Aquatic Biodiversity richness from eDNA metabarcoding of species detections grouped within their taxonomic family during spring at three transects that underwent restoration activities at the South Fork McKenzie River. Post-restoration started spring of 2019 at Transects 1 and 2 and in spring of 2020 at Transect 5 (grayed cells). Duplicate samples were analyzed from each strata along a transect for each time period and pooled within their respective transect/time period.
At WCPreserve, supervised vegetation classifications (of NAIP imagery) from 2009, 2014, and 2020 were mapped, and areas summarized for comparisons (Figure 10). Sparse vegetation increased from 14 to 27% of the total area after restoration, whereas dense vegetation decreased from approximately 50% of the total study are to 34%. The amount of bare earth remained constant pre- and post-restoration at approximately 22%. The amount of water coverage increased from 2 to 14% of the total study area. From 2009 to 2014 to 2020, the percent cover by shadow decreased from 19 to 9%–3%, respectively. Overall accuracy for 2009, 2014, and 2020 classifications were determined to be 87.9, 84.2, and 82.4%, respectively.
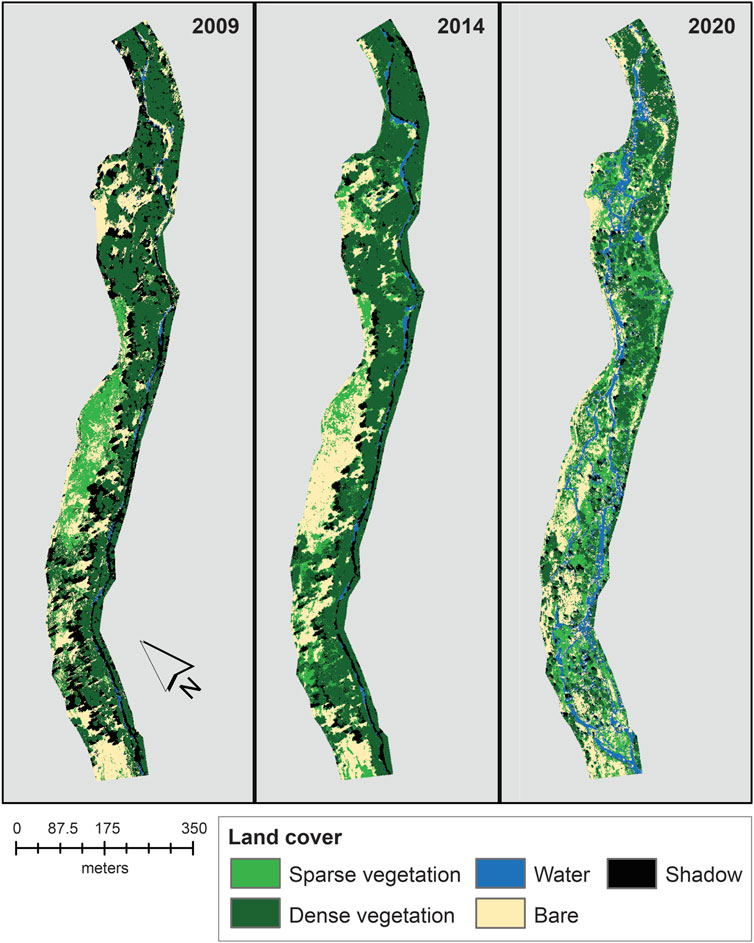
FIGURE 10. Isocluster unsupervised classification of surface vegetation at Whychus Canyon Preserve Phase 1 site using National Agricultural Imagery Program NDVI datasets. Restoration occurred at this site in 2016.
The presence of shadows from imagery collected at different times of day presents difficulties for attaining the most accurate classifications possible. The shadows caused an underestimation of percent coverage for all classification categories. Without ground truthing vegetation surveys, it is not possible to determine the exact extent of underestimation for each classification category, but the extent of underestimation would be less than or equal to the percent coverage associated with shadows. This highlights the importance of using imagery collected at or near solar noon to reduce the effect of shadows in classifying images. However, the high overall accuracy suggests that this cost-effective method is useful for monitoring vegetation change in dryland environments where funding for intensive field methods may not be available.
At Deer Creek, the first high-flow post-restoration moved wood from a dispersed matrix, or wood lattice, to form more discrete wood jams (Figures 11A,B). The flow event transported logs downstream, where they racked on other logs that either extended out of the flow, were buried in sediment, were already racked on living vegetation, or were simply large enough in diameter or rootwad size to resist floating. This generated more discrete wood jams, as opposed to a dispersed wood assemblage (Figures 11C,E). The aggregation of wood into jams formed backwaters and constructions that created pools, diverted flow into newly carved floodplain channels, increased baseflow floodplain inundation, and created numerous forced gravel bars.
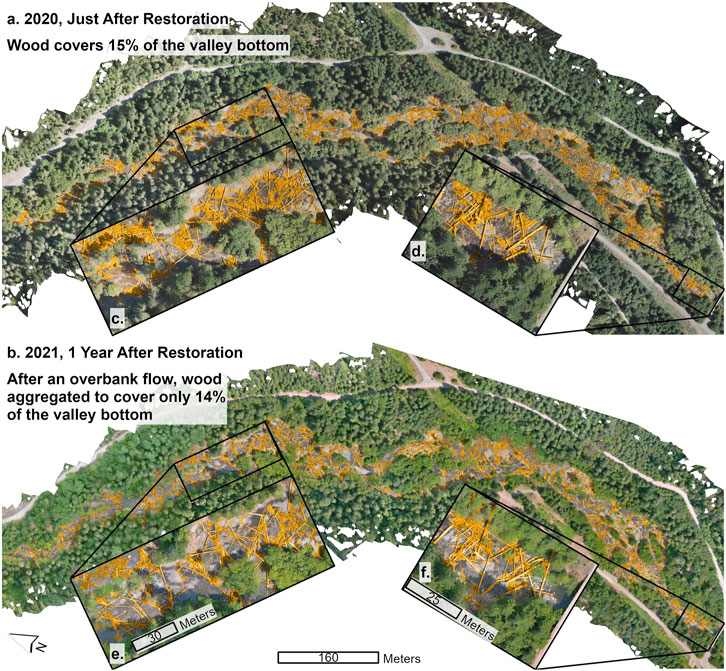
FIGURE 11. Wood (colored in yellow) on the valley floor of the Deer Creek, Oregon site: (A) shortly after restoration was completed; (B) 1 year post-restoration; (c,d) insets showing placement of wood latices; and (e,f) insets of parallel locations showing accumulation of wood material after overbank flow events of the winter months.
This post-restoration high-flow event, and the wood aggregation it caused, resulted in a loss of wood coverage from 15 to 14% of the valley bottom area. However, this reduction in coverage was likely due to aggregation, not the export of wood from the project site. We infer this based on observations that the jam at the downstream end of the reach is taller than the flood-flow depth and did not move substantially during the flood or noticeably lose wood (compare Figure 11D with Figure 11F). This jam likely caught any wood that made it near the downstream end of the reach, preventing downstream mobilization.
At the SFMR, the post-restoration inundated area (153,719 m2) was nearly four times larger than pre-treatment area (41,144 m2) and likely increased the water table elevation in the 400,000 m2 of area that is encapsulated by, or adjacent to, the expanded channel area (Figure 12). Additionally, the spatial arrangement of the post-treatment inundated area is so widely dispersed that wetted edge increases from approximately 5,559 m pre-restoration to over 32,000 m post-restoration. In terms of complexity, the pre-restoration wetted edge complexity index was 7.8 compared 23.1 in the post-restoration area.
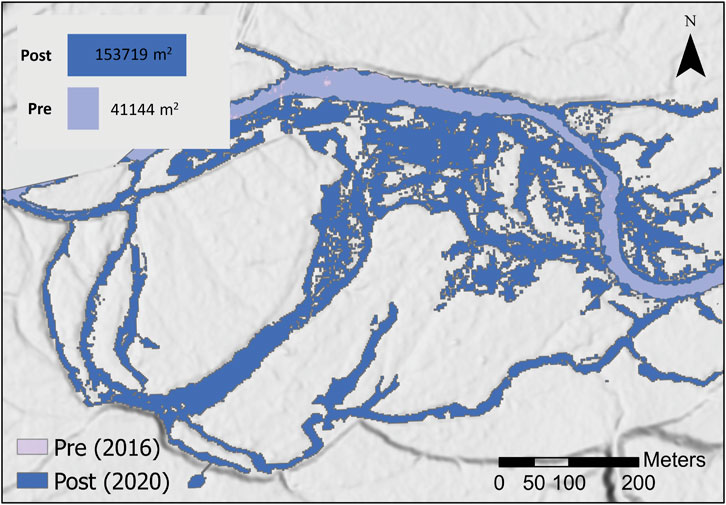
FIGURE 12. Inundated area comparison pre- and post-restoration to a Stage 0 condition at the South Fork McKenzie River, OR. Visual overlay of the pre-treatment wetted area, based on early-summer 2016 imagery, compared to post-treatment wetted area, based on late-summer base-flow imagery. The background image is the LIDAR-derived DEM from 2020. Prior to restoration, the channel occupied only 41,114 m2 of area, as depicted on the northern edge of the image. In contrast, the post-restoration channel occupies not only a greater area, approximately 153,719 m2, but encompasses a landscape of over 400,000 m2 in area.
Inundation area modeled at WCPreserve Phase 1 shows an increase in water inundation of the valley at all flow levels, ranging from a 300% increase at summer base-flow (SBF), over 450% increase during normal winter freshets, and over 150% increase for a modeled 100-years flood (Figure 13B).
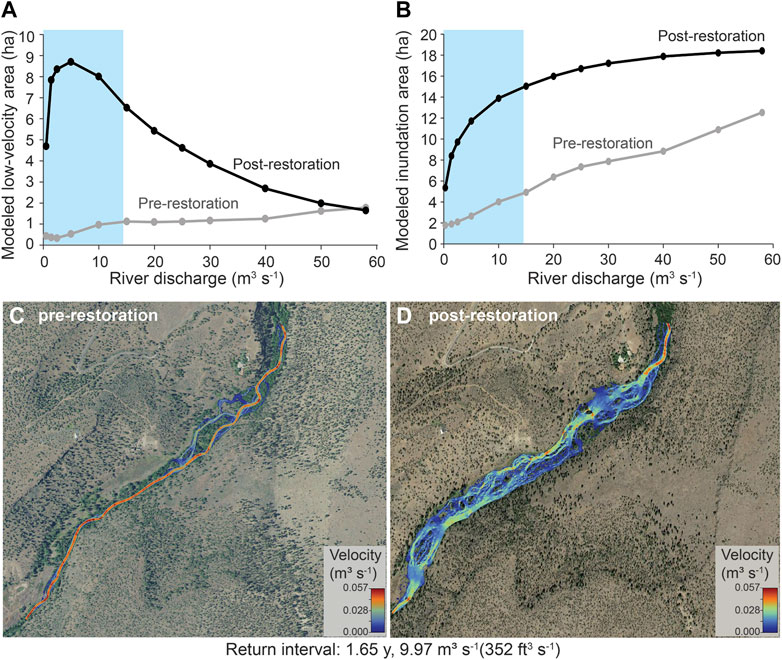
FIGURE 13. Velocity modeling at the Whychus Creek at Whychus Canyon restoration site show: (A) suitable juvenile salmonid rearing habitat for the pre- and post-restoration conditions (blueshaded area delineates flow conditions for rearing); (B) modeled inundation area across river discharge levels for pre and post-restoration valley configurations; (C) mapped pre-restoration velocity for one commonly occurring winter flow of 10 cms, and; (D) mapped post-restoration velocity for one commonly occurring winter flow of 10 cms.
Model results of velocity patterns from the restoration of WCPreserve Phase 1 to a Stage 0 condition showed substantially increased low-velocity habitat suitable for rearing juvenile salmonids over a broad range of discharge (Figure 13A). Suitable rearing habitat is plotted over the range from summer base-flow to the 100-years event (Figure 13A). Pre-restoration juvenile rearing habitat was low overall and decreased to minimum values when common winter and spring storm flows occurred (Figure 13C), evidence of potential for juveniles to be flushed downstream by these events. In the post-restoration environment, the suitable rearing habitat increased substantially and reached maximum values up to 27 times greater during juvenile rearing flows (Figures 13A,D). The two curves converge at the highest flows (e.g., Q100) because the narrow floodplain is confined between steep canyon walls and is filled to capacity (Figure 13A).
Degradation of freshwater environments has led to a biodiversity crisis, with aquatic biota declining at rates that exceed both marine and terrestrial ecosystems (Tickner et al., 2020). For decades, practitioners have worked to develop restoration and rehabilitation methods and approaches to reverse the loss of stream habitat and associated biological diversity, often with limited success (Palmer et al., 2010). Co-development of project design through practitioner-researcher collaboration and active learning via effective monitoring is critical to the development of approaches that have more predictable outcomes in the short and long term, and ultimately support the goal of conservation and species recovery (Roni et al., 2019). Recent decades have marked a shift away from form-based approaches to river rehabilitation (sensu Rosgen, 1997), toward methods aligned with the hypothesis that enhancement of compromised physical, chemical, and ecological processes will confer resilience to streams and biota (Beechie et al., 2010). Importantly, to be effective, these process-based restoration techniques must target the root cause of ecosystem change, tailor restoration actions to local potential, match the scale of the problem and specify expected outcomes (Beechie et al., 2010). Such approaches can include restoration of the ecohydraulic processes that create and sustain anabranching and anastomosing rivers in depositional environments when those processes have been compromised via conversion into single-threaded, erosion and transport channels (Wohl et al., 2021). Process-based restoration and effectiveness monitoring of that restoration is challenging, which reflects the interconnected nature of physical, chemical, and biological processes and the multiple scales at which they are expressed.
Floodplain restoration in Europe has provided foundational information to inform monitoring, design, and anticipated timelines for results that are relevant for work in the Western U.S. Biodiversity assessments of aquatic species were shown to be linked to complex and connected floodplain habitats of the Danube River resulting in calls for restoration designed to enhance biodiversity resilience that targeted fluvial dynamics and floodplain habitat rather than single species-specific targets (Tockner et al., 1999). Floodplain habitat connectivity on the Danube has been used as a model for design and evaluation of other large river restoration including the Rhine (Buijse et al., 2002) that have demonstrated the role of the floodplain in longitudinal and lateral connectivity. A diversity of other small and large-scale restoration projects in Europe are focused on ecosystem processes (a subset of Stage 0 Process-based examples is summarized in Supplementary Table S6-1) (e.g., Restoring Europe’s Rivers wiki - https://restorerivers.eu/wiki/index.php?title=Main_Page) and are associated with cross-boundary goals identified from objectives such as the European Commission’s Biodiversity Strategy 2030 that focuses on barrier removal and floodplain restoration (Bastino et al., 2021). From these projects, European studies have demonstrated the importance of understanding the historic template of the river and current drivers of geomorphic processes in developing restoration designs (Campana et al., 2014; Brown et al., 2021), the varying timelines present for physical habitat development (Kristensen et al., 2014), biological community responses to floodplain restoration (Lorenz et al., 2018), and fish assemblage relationships to flow velocity and seasonal floodplain habitats (Grift et al., 2003).
Restoration to a Stage 0 condition involves the entire valley floor and production of highly complex sites, both of which hamper traditional monitoring methods. Here, we learned about restoration to a Stage 0 condition by clearly defining it and identifying a diverse set of sites that met this definition. From these sites, we report monitoring results that captured the scale and complexity of valley-wide restoration to Stage 0 and advanced our understanding of the effects of this restoration approach. We found changes in habitat composition as floodplain material interacts with high flows to rework the building blocks of complex habitat that were made available by the restoration action. It follows that we also found that initial post-restoration biological responses include increased species composition and site-scale production which are consistent with post-disturbance ecology (for macroinvertebrates and wildfire see Minshall, 2003; for macroinvertebrate composition post-forest harvest see Johnson et al., 2022).
From the available data, the objectives of increasing low-flow inundated area, decreased depth to groundwater, increased wetted edge, and complexity were achieved at least in the short-term via restoration to Stage 0. Although the long-term persistence of these conditions is uncertain, preliminary qualitative observations from Deer Creek that show naturally rearranged wood forming new, more abundant, and more complex habitat features hint that self-sustaining geomorphic processes were reactivated at that site. Newly reestablished hydrogeomorphic processes are also likely to persist at WCPreserve and Fivemile-Bell, given the dense vegetation that has been established there and its critical role in controlling valley floor processes in these systems (Polvi and Wohl, 2013). Increased inundation area at the SFMR and WCPreserve implies increased instream habitat for aquatic species such as macroinvertebrates which are important food sources for rearing salmonids (Rosenfeld et al., 2008). Increased length of wetted edge and increased complexity provide more nooks and protrusions that alter flow velocity and direction, creating shear zones, slack water, and eddies, resulting in more diverse hydraulic conditions and higher quantity of aquatic habitat (Hafs et al., 2014). Beechie et al. (2005) found that edge microhabitats tended to be occupied by rearing juvenile salmonids, with different species favoring these environments seasonally. Additionally Hall et al. (2018) found higher subyearling Chinook productivity associated with floodplain restoration of complex braided channels in Puget Sound, WA.
The response of stream temperature post-restoration varied across sites. A potential concern about this type of restoration is an increase in stream temperature resulting from potentially shallower surface water that could be more sensitive to solar radiation. At WCPreserve Phase 1, peak temperatures after restoration were within the range documented in pre-restoration data collection. A pattern of reduced variability of thermal heating at low flows was detected and could be the result of rapid vegetation growth and shading, and/or the interaction between surface and higher groundwater levels at this site. In lowland streams in Netherlands, Kaandorp et al. (2019) found that stream temperatures were buffered where significant mixing of groundwater with surface water occurred, providing potential resilience to future climate effects. Thermal results at WCPreserve Phase 1 contrast with Fivemile-Bell, where initial increases in maximum stream temperature were recorded, although higher groundwater levels were also recorded. Of interest, and requiring ongoing monitoring was the observation of a decline in maximum stream temperatures at this site in 2021. It is possible that this site required several years for vegetation to re-grow to a size necessary to provide shade, pointing to the need to track the timing of vegetation growth as the valley floor stabilizes post-restoration. D’Souza et al. (2011) found that it took several years for vegetation regrowth to alter stream temperature in two western Oregon watersheds that had experienced extreme debris torrents, which are in some ways similar to the disturbance of streams that experience restoration to Stage 0. The high thermal loading expected at Fivemile-Bell in response to record heat was not realized in 2021. Instead, 2021 was the coolest water year post-restoration at Fivemile-Bell, perhaps because of the dense, extensive willow galleries that have established at the site and densely shaded surface water in most locations (Supplementary Figure S1-3). The interaction between shallow subsurface flow and vegetation regrowth might also influence the response of stream temperatures to Stage 0 restoration at Fivemile-Bell. However, our network of monitoring wells and temperature data loggers is insufficient to capture these effects.
At SFMR, complexity in stream temperature in response to thermal and discharge regulation at Cougar Dam complicated detection of patterns associated with the restoration work. In general, more warming occured in midsummer than in late summer or early autumn because days are longer and daily solar radiation is considerably greater, although these relationships are confounded by changing discharge resulting from changes in dam operations. At a daily scale, temperature increases were largest for daily maximum temperature, intermediate for daily mean temperature, and very small for daily minimum temperature. High spatial variability in thermal conditions was evident at the SFMR site, with warmer water near the edge of accumulated woody material and the water’s edge. In addition, moderate to large patches of cold water were connected or in close proximity to one another. These patterns were detectable by the drone-based data collection. The utility of drones to collect informative temperature values for large rivers was also demonstrated by Dugdale et al. (2019), who found that thermal-infrared sensors on drones were effective at capturing variability in surface-water temperatures. At the SFMR, additional study and analysis are needed to understand the persistence of thermal heterogeneity within and between years to evaluate the effect of restoration at this site over time.
Sediments and large wood were deliberately unsorted immediately post-restoration, with the expectation that the river would rework those materials into complex habitat configurations (Powers et al., 2019). Restoration reduced unit stream power by dispersing flows across a broader area and increased flow resistance via increased roughness. Flows thus far were sufficient to rearrange wood within the project area but not to export it to downstream reaches. Placed wood racked onto stable pieces along Deer Creek, forming larger and denser accumulations, which in turn significantly altered geomorphic patterns. Wohl et al. (2018) posited that such processes can create multi-thread channels in low-gradient, unconfined stream segments. In addition, a shift in surface sediment composition toward finer particle sizes was observed across four sites monitored for stream substrate. Across all sites, larger particles present before restoration were replaced with smaller size classes that are more conducive to salmon (Riebe et al., 2014) and lamprey spawning (Hogg et al., 2014). The shift in substrate size likely reflects both the mechanical reorganization of material during restoration, as well as fluvial deposition and sorting of finer particles over time as the restored reach became a slower-water, depositional environment (for relevant sedimentation and fluvial processes see Hudson, 2017). Additional monitoring to document changes in sediment and wood distribution, and resulting effects on available aquatic habitat complexity will elucidate how placed and subsequently rearranged materials alter stream habitats for native biota including fish. Notably, long-term monitoring of wood transport distance in hydraulically rough, multi-channel, Stage 0 systems will help inform both the potential for long-term benefits from placed wood and the effects of restoration to Stage 0 on the wood regime.
Research that demonstrates the hypothesis that habitat complexity begets biological diversity is commonly used to support management actions, including restoration (Penaluna et al., 2018), even if results associated with this hypothesis are mixed (Palmer et al., 2010). However, biological monitoring is typically expensive, results can be inconclusive, and many years of pre- and post-restoration data collection are necessary to generate robust and informative results. The need to demonstrate linkages between changes in the physical environment and aquatic biota following restoration to Stage 0 necessitated the incorporation of biological monitoring. A new mosaic of physical habitat conditions from pre-to post-restoration likely supported a shift in community metrics for aquatic biodiversity, aquatic macroinvertebrates, and secondary macroinvertebrate production at SFMR. The greatly increased surface-water area across the SFMR project provides more aquatic habitat available to biota, including increases in wetted area post-restoration that were 2.2x–3.8x greater compared to pre-restoration (Supplementary Table S4-1). Remote sensing of floodplain vegetation at WCPreserve in Phase 1 illuminated likely interactions between groundwater and surface vegetation that resulted in greener vegetation in the valley floor during peak periods of summer thermal stress and lower streamflow conditions; whereas flow velocity modeling at this site predicted expanded rearing habitat for salmonids during the winter.
A compelling range of aquatic biodiversity was detected with eDNA metabarcoding following restoration activities in two of three transects at SFMR, including more detections of fishes, amphibians, mussels, crayfishes, and beaver suggesting that as a mosaic of habitats became available, a broader community of species occupied them. Transect 1 had higher diversity pre-restoration likely owing to its location close to the confluence with the mainstem McKenzie River, as areas around river confluences have more diversity (Kiffney et al., 2006). As time passes post-restoration, it is possible that species detections will continue to increase at Transect 1 potentially matching pre-restoration numbers as it is possible that this area is still recovering. Of the species detected, rare, common, threatened, and invasive species were all identified. As an example, invasive American Bullfrog were detected at Transect 5 post-restoration as they likely moved upstream from Transect 1 as habitats were created and became available. Although the eDNA metabarcoding results are descriptive and from only a few restored reaches, they provide a line of evidence that habitat complexity begets biological diversity. As freshwater biomonitoring increasingly moves toward an ecosystem-based approach to understanding the effects of human impacts, such as restoration activities, eDNA data provides a more holistic survey than traditional approaches.
A transition towards generalist species with strong larval dispersal such as chironomids occurred at SFMR, with the loss of longer-living and stable substrate-dependent macroinvertebrates such as juga snails. This transition is consistent with other work focusing on the response of stream biota to extreme disturbance events such as landslides or earthflows (for earth movement post-wildfire effects on macroinvertebrate taxa richness and abundance see Minshall et al., 2001; Vieira et al., 2004). However, Smith et al. (2019) detected no signal in the composition of the macroinvertebrate community using a BACI study approach at a stream-rehabilitation project designed to restore the system to an anabranching wet-meadow habitat that typified anthropogenic development conditions in Pennsylvania, United States.
The role of inundation area in the increased site-scale estimate of stream productivity was a key driver of observed increases in aquatic macroinvertebrate secondary production at SFMR. Jennings, (2021) found that the primary taxa that contributed to secondary macroinvertebrate production were statistically different between the restored and unrestored reaches, driven by a greater prevalence of Chironomidae midges and other lentic-adapted taxa in the restored reach. This finding suggests that the prey resources and associated food webs that support fish production may differ between restored and unrestored reaches. Jennings’ (2021) results in the SFMR suggest that enhanced production may largely be driven by increased wetted area of sites restored to Stage 0, at least initially. Although macroinvertebrate production on a per-square-meter basis was lower in the restored reach, the area of water inundation made cumulative production higher than the unrestored areas. These findings suggest that restoration may have increased the energetic capacity for the restored reach to sustain higher trophic-level production of organisms that feed on macroinvertebrates such as salmonids, even though the amount of fish production that could be supported per-unit-area would likely be lower. These findings reflect those of Bellmore and Baxter (2014), who showed that naturally confined river segments can support as much or more primary and secondary production than intact river-floodplain segments. That said, the stream-productivity analysis presented here was conducted only 1 year after restoration, and it is possible that the system was still recovering. In addition, preliminary surveys hint that juvenile fish densities may also be higher post-restoration (despite lower per-unit-area food production), which could mean that fishes are better able to track macroinvertebrate availability, owing to more suitable physical habitat or perhaps because of a greater prevalence of smaller macroinvertebrate prey (e.g., Chironomidae). Given the high effort and cost of estimating secondary macroinvertebrate production, alternative approaches should be considered for examining longer-term production dynamics. For example, primary production of attached algae and macrophytes could be estimated by monitoring dissolved oxygen dynamics of restored habitats.
High total secondary production and macroinvertebrate biomass may translate into growth and survival benefits for fishes. Low velocity habitats found in seasonally flooded environments can be highly productive for rearing juvenile salmonids. Jeffres et al. (2008) found the highest growth among juvenile Chinook salmon that reared in seasonally inundated floodplain habitats compared with perennial floodplain ponds, or the river channel. However, time periods of high growth were also evident in perennially flooded floodplain habitats and the river main-channel during lower flows, indicating the critical importance of habitat connectivity among riverine habitats in supporting mobile fish consumers (Jeffres et al., 2008). Benefits in production of wild coho salmon (Oncorhynchus kisutch) were also described in the Chilliwack River, British Columbia where Ogston et al. (2015) showed that floodplain restoration areas contributed disproportionately to the production of out-migrating smolts. Relatedly, Sommer et al. (2001) found higher growth in rearing juvenile Chinook salmon in floodplain areas of the lower Sacramento River, CA, even though these areas were warmer. Greater availability of drift invertebrates compensated for the bioenergetic cost of the warmer river resulting in higher survival and growth. These linkages between fish growth, temperature and food sources are a natural next step in evaluation of Stage 0 restoration.
Development of interconnected floodplain wet-meadow vegetation relies on shallow groundwater depth that supports emergent plant biodiversity (Mouw et al., 2008). Linkages between groundwater depth and rooting depth of native floodplain vegetation were evident at the WCPreserve Phase 1 site. There was a higher proportion of living vegetation during the summer on the valley floor post-restoration, probably due to the increased elevation of the groundwater table. Importantly, terrestrial invertebrate inputs from this vegetation and other sources can be a significant food source for fish, providing about 50% of their annual energy in some systems (Saunders and Fausch, 2007). The role of a higher water table in enhanced vegetation colonization and succession has been established through assessments of the role of beavers, which are instrumental in creating river-meadow sequences (Westbrook et al., 2011). Absence of beaver has strongly altered meadow configuration and channel-complexity patterns in the western U.S. (Webb and Leake, 2006). Restoration to Stage 0 may mimic these patterns and facilitate the restoration of the processes needed to sustain them, namely repopulation by beaver, which was shown at SFMR Transect 5 with eDNA results. Beaver and/or beaver activity have been observed at many of the restoration sites described herein.
Watersheds and streams operate as integrated systems (Fausch et al., 2002), and no single indicator can accurately characterize their condition. Miller et al. (2017) acknowledged that reliance on a single biological metric to understand conditions in a broader area can lead to erroneous conclusions about biological conditions (e.g., Barbour et al., 1999), and recommended using multiple response variables as lines of evidence needed to explore holistic trends. To capture the interrelationship among variables post-restoration requires considering biological and physical variables jointly. Synchrony among metrics, as well as lack of concordance, point to different relationships between patterns of post-restoration development in terms of physical characteristics of the stream, and associated biological responses. This has been observed in response to dam removal on formation of floodplain habitats (Bellmore et al., 2019). Our results suggest that in some places, we may see immediate and predictable relationships between physical and biological responses, as we observe at the WCPreserve Phase 1 site, where a higher groundwater table appears to be linked to surface vegetation greening and possible buffering of stream temperatures. However, at Fivemile-Bell, summer low-flow conditions in the low-gradient stream valley allowed for increased thermal heating, and the role of groundwater in reducing surface-water temperature appears more limited. These variable patterns in terms of immediate responses to valley-floor restoration to a Stage 0 condition may become less pronounced over time, but may also reflect different underlying geologic, hydrologic, and climate characteristics that make every site unique.
The strongest link that we can currently make between biological productivity and stream characteristics post-restoration is associated with inundation area. Linkages to substrate and habitat composition are less clear. This may reflect the more uniform nature of distributed substrates and wood in the early years post-restoration prior to reorganization by subsequent high flows. As habitat differentiation occurs, we hypothesize that we will see a gradual increase in species richness, and possibly productivity. This hypothesis is currently supported by the gradual and positive relationship between species richness and time since restoration that we have documented post-restoration at the SFMR. However Paillex et al. (2009) found colonization by invasive species increased richness in large valley-scale reconnection projects. This suggests that evaluation of native and non-native taxa must be considered in species-richness evaluations.
Salmonids in the Pacific Northwest are adapted to disturbances such as wildfire or landslides and exploit newly enriched habitats that result from these processes (Reeves et al., 1995). The high degree of connectivity among complex habitats in restored valleys is anticipated to afford high-quality environments for multiple life stages of aquatic and riparian species over the long term. Chinook salmon (Oncorhynchus tshawytscha) spawning in the South Fork McKenzie project area increased dramatically immediately following restoration. It is likely that juvenile life stages of salmonids will be able to rear through the year in these productive and diverse stream habitats as well, which is supported by flow-velocity models from WCPreserve. Such models predicted a comprehensive expansion of juvenile Chinook salmon rearing habitat in the winter, a known limiting factor for populations (Nickelson et al., 1992). This modeled result is consistent with observed results from modeling of restoration sites in the Puget Sound by Hall et al. (2018) who found enhanced productivity in subyearing Chinook salmon associated with floodplain restoration. Additional monitoring over time that allows for the quantification of the effect of restoration to a Stage 0 condition on native fish species is ongoing and holds promise to further enrich discussions of the effects of this method.
The capacity of streams that have been restored to a Stage 0 condition to support diverse as well as complex habitats may be a critical buffer for native biota in response to changing environmental conditions. Ebersole et al. (1997) hypothesized that framing restoration as a mechanism for reactivation of stream resilience through the capacity to support diverse habitats fundamentally changes the design and approach to stream restoration, broadening the scope and perspective. Historically, naturally dynamic rivers and floodplains of the Pacific Northwest provided refugia for biota in response to disturbance events such as landslides and wildfires (Sedell et al., 1990). Ultimately, restoring the capacity of floodplains to function as they did historically should allow native species to better persist under current disturbance regimes, and those predicted with climate change.
What exactly is restoration to a Stage 0 condition? With the critical involvement of practitioners of process-based restoration, we were able to define this term, drawing particular attention to the goal of restoring physical and biological processes at a valley scale. The novelty of this type of process-based, valley-scale restoration has led to questions about the potential adverse impacts on threatened aquatic species through the introduction of fine sediment, mobilization of large wood, shallowing of water, and temperature responses. Our work here begins to respond to these concerns by summarizing early results of monitoring studies documenting the biological and physical effects of valley-scale restoration to a Stage 0 condition. The variability at a site-scale between physical and biological responses to this type of restoration is worthy of note. Some sites may take longer to develop organized stream-habitat forms, likely owing to unique characteristics of geology, stream configuration, and hydrology. River morphology changes take place over decades, especially in large valley-bottom system like some of those that have been monitored here and are targeted for restoration to Stage 0. Sites such as the SFMR may take even longer where the upstream dam impedes sediment delivery and buffers the stream from influences of high-flow events. High flow events consistent with a rivers natural flow regime (e.g., Poff et al., 1997) are critical for successful process-based restoration actions. To understand the long-term trajectory of all of these restoration sites, continued monitoring is necessary, but could be done less frequently (e.g., such as only after high-magnitude flow events). In addition, much of our current regional understanding of valley-bottom and stream processes is built on studies that evaluated habitats well after the European expansion and settlement of the Pacific Northwest, when streams had already been altered.
A limitation of this synthesis was the lack of a comprehensive and consistently applied monitoring strategy across all restoration sites. As such, for the nine different topics for which monitoring data is reported, a combination of sites and methods are present. Although this limits cross-site comparisons at a regional scale, we were able to evaluate results within the context of individual sites. This need to contextualize observed effects of restoration to Stage 0 provides important insights into the different expectations that should be considered whenever one of these projects is implemented. Similarly, there is a need for more standardized sampling methods and protocols when evaluating a restoration program across a valley bottom as compared to a stream-reach scale, however this is difficult given the complexity of these types of projects. Although the suite of monitoring metrics varied among sites, all showed evidence of enhancement following restoration.
Ongoing development and refinement of monitoring tools, as well as the creation of a Programmatic Regional Monitoring Strategy by Region 6 of the U.S. Forest Services (covering Oregon and Washington) is underway seeking integrated monitoring planning (sensu Angelopoulos et al., 2017) that targets specific restoration goals (e.g., Lamouroux et al., 2015). Additional analysis and more detailed assessments of each of the 9 categories of data metrics reported here are also ongoing to capture seasonal variability in conditions, rather than focusing primarily on summer conditions as reported here. The post-restoration results we present represent a snapshot of the relatively immediate effects of process-based, valley-scale restoration to Stage 0, which we anticipate will affect stream condition and resilience for many decades to come.
The raw data supporting the conclusions of this article will be made available by the authors, without undue reservation.
RF led development of paper, wrote the majority of content. WB edited paper, completed sediment analysis and wrote that section. BS edited paper, wrote definition of restoration to Stage 0 condition. JBe led secondary productivity section and co-wrote that with JJ. BC completed and wrote up the inundation and velocity modeling for the Whychus site, and edited the entire paper. PB and CM collected all Fivemile-Bell datasets, oversaw analysis, edited the paper. GG facilitated workshops and edited the paper. MH and KM collected data for several sites and edited the paper. CM and LM co-wrote much of the temperature analysis and methods for Whychus Canyon site. LM also edited the paper. JM developed the analysis for groundwater and temperature for multiple sites, completed and wrote the vegetation composition section. BP edited the paper and led the eDNA analysis. JBu and SW completed and wrote the surface temperature and inundation modeling at South Fork McKenzie River, as well as writing the extensive supplementary material section on this topic. DS completed and wrote the wood accumulation section, and revised the entire paper.
Funding and support for monitoring along Deer Creek was provided by the United States Forest Service National Stream Aquatic Ecology Center and Pacific Northwest Research Station, as well as the McKenzie Watershed Council. Mickey Means-Brous, Logan Bodiford, Kiara McAdams, Alex Scagliotti, Carla Rothenbuecher, and Alex Meyers of the US Forest Service for collection of much of the SFMR data. Grant funding supporting monitoring and data collection of several elements of work presented in this publication were provided by the Oregon Watershed Enhancement Board Grant number 220-7000-17342. The institutions that each co-author worked for provided their time for this effort.
CM was employed by CASM Environmental.
The remaining authors declare that the research was conducted in the absence of any commercial or financial relationships that could be construed as a potential conflict of interest.
All claims expressed in this article are solely those of the authors and do not necessarily represent those of their affiliated organizations, or those of the publisher, the editors and the reviewers. Any product that may be evaluated in this article, or claim that may be made by its manufacturer, is not guaranteed or endorsed by the publisher.
RedCastle Resources, USFS GTAC, Matt Barker, Oregon State University AIS Lab for assistance with drone data collection and processing. Rich Cronn provided insights at all phases of eDNA development, Laura Hauck developed eDNA metabarcoding primers, Kevin Weitemier developed the eDNA data pipeline, and Lucas Longway completed extractions. Mickey Means-Brous and Doni McKay of the USFS for assistance in early data compilation across projects. Kathryn Ronnenberg of the USFS provided editorial review and assistance with graphics. Kelly Christiansen of the USFS developed study site and overall maps. Mathias Perle of the Upper Deschutes Watershed Council, for contributions to all aspects of monitoring at the Whychus Canyon Preserve, and Colin Thorne for his advisory role for monitoring at the Whychus Canyon Preserve. Jim Capurso of the USFS for his ongoing commitment and support of novel restoration approaches in Oregon and Washington. The Oregon Watershed Enhancement Board has supported both stream restoration and monitoring to better understand the effects of Stage 0 on the biological and physical stream environment. Johan Hogervorst of the US Forest Service for his continual involvement in the theory and practice of restoration to Stage 0, including the design, implementation, and outreach of many Stage 0 projects throughout the region. Additional thanks to Colin Thorne for coordinating development of the list of European Stage 0 projects with collaborators David Sear, Nicola Surian, Tony Brown, and Martin Janes.
The Supplementary Material for this article can be found online at: https://www.frontiersin.org/articles/10.3389/fenvs.2022.892268/full#supplementary-material
Angelopoulos, N. V., Cowx, I. G., and Buijse, A. D. (2017). Integrated Planning Framework for Successful River Restoration Projects: Upscaling Lessons Learnt from European Case Studies. Environ. Sci. Policy 76, 12–22. doi:10.1016/j.envsci.2017.06.005
Barbour, M. T., Gerritsen, J., Snyder, B. D., and Stribling, J. B. (1999). Rapid Bioassessment Protocols for Use in Streams and Wadeable Rivers: Periphyton, Benthic Macroinvertebrates and Fish. Washington, DC: U.S. Environmental Protection Agency, Office of Water.
Bastino, V., Boughaba, J., and van de Bund, W. (2021). Biodiversity Strategy 2030 Barrier Removal for River Restoration. Brussels: European Commission. B-1049.
Beechie, T., and Bolton, S. (1999). An Approach to Restoring Salmonid Habitat-Forming Processes in Pacific Northwest Watersheds. Fisheries 24 (4), 6–15. doi:10.1577/1548-8446(1999)024<0006:aatrsh>2.0.co;2
Beechie, T., and Imaki, H. (2014). Predicting Natural Channel Patterns Based on Landscape and Geomorphic Controls in the Columbia River Basin, USA. Water Resour. Res. 50 (1), 39–57. doi:10.1002/2013wr013629
Beechie, T. J., Liermann, M., Beamer, E. M., and Henderson, R. (2005). A Classification of Habitat Types in a Large River and Their Use by Juvenile Salmonids. Trans. Am. Fish. Soc. 134 (3), 717–729. doi:10.1577/t04-062.1
Beechie, T. J., Liermann, M., Pollock, M. M., Baker, S., and Davies, J. (2006). Channel Pattern and River-Floodplain Dynamics in Forested Mountain River Systems. Geomorphology 78 (1-2), 124–141. doi:10.1016/j.geomorph.2006.01.030
Beechie, T. J., Sear, D. A., Olden, J. D., Pess, G. R., Buffington, J. M., Moir, H., et al. (2010). Process-based Principles for Restoring River Ecosystems. BioScience 60 (3), 209–222. doi:10.1525/bio.2010.60.3.7
Belletti, B., Garcia de Leaniz, C., Jones, J., Bizzi, S., Börger, L., Segura, G., et al. (2020). More Than One Million Barriers Fragment Europe's Rivers. Nature 588, 436–441. doi:10.1038/s41586-020-3005-2
Bellmore, J. R., and Baxter, C. V. (2014). Effects of Geomorphic Process Domains on River Ecosystems: A Comparison of Floodplain and Confined Valley Segments. River Res. Applic. 30 (5), 617–630. doi:10.1002/rra.2672
Bellmore, J. R., Baxter, C. V., and Connolly, P. J. (2015). Spatial Complexity Reduces Interaction Strengths in the Meta‐food Web of a River Floodplain Mosaic. Ecology 96 (1), 274–283. doi:10.1890/14-0733.1
Bellmore, J. R., Pess, G. R., Duda, J. J., O’Connor, J. E., East, A. E., Foley, M. M., et al. (2019). Conceptualizing Ecological Responses to Dam Removal: If You Remove it, What's to Come? BioScience 69 (1), 26–39. doi:10.1093/biosci/biy152
Benke, A. C., and Huryn, A. D. (2017). “Secondary Production and Quantitative Food Webs,” in Methods in Stream Ecology. Editors G. A. Lamberti, and F. R. Hauer. 3rd Edition (Academic Press), 235–254. doi:10.1016/b978-0-12-813047-6.00013-9
Bernhardt, E. S., Savoy, P., Vhah, M. J., Appling, A. P., Koenig, L. E., Hall, R. O., et al. (2022). Light and Flow Regimes Regulate the Metabolism of Rivers. Proc. Natl. Acad. Sci. 119 (8), e2121976119. doi:10.1073/pnas.2121976119
Bjornin, J. R., and Reiser, D. W. (1991). “Habitat Requirements of Salmonids in Streams,” in Influence of Forest and Rangeland Management on Salmonids Fishes and Habitats. Editor W. R. Meehan (American Fisheries Society, Special Publication), 19, 83–138.
Brown, A. G., Lespez, L., Sear, D. A., Macaire, J.-J., Houben, P., Klimek, K., et al. (2018). Natural vs Anthropogenic Streams in Europe: History, Ecology and Implications for Restoration, River-Rewilding and Riverine Ecosystem Services. Earth-Sci. Rev. 180, 185–205. doi:10.1016/j.earscirev.2018.02.001
Brown, A. G., Rhodes, E. J., Davis, S., Zhang, Y., Pears, B., Whitehouse, N. J., et al. (2021). Later Quaternary Evolution of a Lowland Anastomosing River System: Geological-Topographic Inheritance, Non-uniformity and Implications for Biodiversity and Management. Quat. Sci. Rev. 260, 106929. doi:10.1016/j.quascirev.2021.106929
Buijse, A. D., Coops, H., Staras, M., Jans, L. H., Van Geest, G. J., Grift, R. E., et al. (2002). Restoration Strategies for River Floodplains along Large Lowland Rivers in Europe. Freshw. Biol. 47, 889–907. doi:10.1046/j.1365-2427.2002.00915.x
Burnham, K. P., and Anderson, D. R. (2002). Model Selection and Multimodel Inference: A Practical Information-Theoretic Approach. 2nd Edition. New York, NY: Springer-Verlag.
Campana, D., Marchese, E., Theule, J. I., and Comiti, F. (2014). Channel Degradation and Restoration of an Alpine River and Related Morphological Changes. Geomorphology 221, 230–241. doi:10.1016/j.geomorph.2014.06.016
Castro, J. M., and Thorne, C. R. (2019). The Stream Evolution Triangle: Integrating Geology, Hydrology, and Biology. River Res. Applic. 35 (4), 315–326. doi:10.1002/rra.3421
Cluer, B., and Thorne, C. (2014). A Stream Evolution Model Integrating Habitat and Ecosystem Benefits. River Res. Applic. 30, 135–154. doi:10.1002/rra.2631
D’Souza, L. E., Reiter, M., Six, L. J., and Bilby, R. E. (2011). Response of Vegetation, Shade and Stream Temperature to Debris Torrents in Two Western Oregon Watersheds. For. Ecol. Manag. 261 (11), 2157–2167. doi:10.1016/j.foreco.2011.03.015
Dufour, S., and Piégay, H. (2009). From the Myth of a Lost Paradise to Targeted River Restoration: Forget Natural References and Focus on Human Benefits. River Res. Applic. 25, 568–581. doi:10.1002/rra.1239
Dugdale, S. J., Kelleher, C. A., Malcolm, I. A., Caldwell, S., and Hannah, D. M. (2019). Assessing the Potential of Drone‐based Thermal Infrared Imagery for Quantifying River Temperature Heterogeneity. Hydrol. Process. 33 (7), 1152–1163. doi:10.1002/hyp.13395
Ebersole, J. L., Liss, W. J., and Frissell, C. A. (1997). Restoration of Stream Habitats in the Western United States: Restoration as Reexpression of Habitat Capacity. Environ. Manag. 21 (1), 1–14. doi:10.1007/s002679900001
Fausch, K. D., Torgersen, C. E., Baxter, C. V., and Li, H. W. (2002). Landscapes to Riverscapes: Bridging the Gap between Research and Conservation of Stream Fishes. BioScience 52, 483–498. doi:10.1641/0006-3568(2002)052[0483:ltrbtg]2.0.co;2
Fryirs, K. A., Brierley, G. J., Preston, N. J., and Kasai, M. (2007). Buffers, Barriers and Blankets: The (Dis)connectivity of Catchment-Scale Sediment Cascades. CATENA 70 (1), 49–67. doi:10.1016/j.catena.2006.07.007
Gallant, J. C., and Dowling, T. I. (2003). A Multiresolution Index of Valley Bottom Flatness for Mapping Depositional Areas. Water Resour. Res. 39 (12), 1347. doi:10.1029/2002wr001426
Grant, G. E., and Swanson, F. J. (1995). Morphology and Processes of Valley Floors in Mountain Streams, Western Cascades, Oregon. Geophys. Mongraph-American Geophys. Union 89, 83–101. doi:10.1029/gm089p0083
Grift, R. E., Buijse, A. D., Van Densen, W. L. T., Machiels, M. A. M., Kranenbarg, J., Klein Breteler, J. G. P., et al. (2003). Suitable Habitats for 0-Group Fish in Rehabilitated Floodplains along the Lower River Rhine. River Res. applic. 19, 353–374. doi:10.1002/rra.711
Grill, G., Lehner, B., Thieme, M., Geenen, B., Tickner, D., Antonelli, F., et al. (2019). Mapping the World's Free-Flowing Rivers. Nature 569, 215–221. doi:10.1038/s41586-019-1111-9
Hafs, A. W., Harrison, L. R., Utz, R. M., and Dunne, T. (2014). Quantifying the Role of Woody Debris in Providing Bioenergetically Favorable Habitat for Juvenile Salmon. Ecol. Model. 285, 30–38. doi:10.1016/j.ecolmodel.2014.04.015
Hall, J. E., Holzer, D. M., and Beechie, T. J. (2007). Predicting River Floodplain and Lateral Channel Migration for Salmon Habitat Conservation. J. Am. Water Resour. Assoc. 43 (3), 786–797. doi:10.1111/j.1752-1688.2007.00063.x
Hall, J. E., Greene, C. M., Stefankiv, O., Anderson, J. H., Timpane-Padgham, B., Beechie, T. J., et al. (2018). Large River Habitat Complexity and Productivity of Puget Sound Chinook Salmon. PloS one 13 (11), e0205127. doi:10.1371/journal.pone.0205127
Hauer, F. R., Locke, H., Dreitz, V. J., Hebblewhite, M., Lowe, W. H., Muhlfeld, C. C., et al. (2016). Gravel-bed River Floodplains Are the Ecological Nexus of Glaciated Mountain Landscapes. Sci. Adv. 2, e1600026. doi:10.1126/sciadv.1600026
Hines, D., Liermann, M., Seder, T., Cluer, B., Pess, G., and Schoenebeck, C. (2017). Diel Shifts in Microhabitat Selection of Steelhead and Coho Salmon Fry. North Am. J. Fish. Manag. 37 (5), 989–998. doi:10.1080/02755947.2017.1339648
Hogg, R. S., Coghlan, S. M., Zydlewski, J., and Simon, K. S. (2014). Anadromous Sea Lampreys (Petromyzon marinus) Are Ecosystem Engineers in a Spawning Tributary. Freshw. Biol. 59 (6), 1294–1307. doi:10.1111/fwb.12349
Hudson, P. F. (2017). “Fluvial Depositional Processes and Landforms,” in International Encyclopedia of Geography: People, the Earth, Environment and Technology (Oxford, UK: John Wiley & Sons). doi:10.1002/97811187863562.wbleg087
Jeffres, C. A., Opperman, J. J., and Moyle, P. B. (2008). Ephemeral Floodplain Habitats Provide Best Growth Conditions for Juvenile Chinook Salmon in a California River. Environ. Biol. Fish. 83 (4), 449–458. doi:10.1007/s10641-008-9367-1
Jennings, J. C. (2021). Effects of Stage 0 Stream Restoration on Aquatic Macroinvertebrate Production. Corvallis, OR: Oregon State University. master’s thesis.
Johnson, S. L., Li, J. L., Sobota, J. B., Ashkenas, L. R., Pollock, A. M., Meleason, M. A., et al. (2022). Macroinvertebrate Responses to Differing Riparian Treatments Following Forest Harvest in the Headwaters of Trask River Watershed. For. Ecol. Manag. 508 (15), 119999. doi:10.1016/j.foreco.2021.119999
Kaandorp, V. P., Doornenbal, P. J., Kooi, H., Peter Broers, H., and de Louw, P. G. B. (2019). Temperature Buffering by Groundwater in Ecologically Valuable Lowland Streams under Current and Future Climate Conditions. J. Hydrol. X 3, 100031. doi:10.1016/j.hydroa.2019.100031
Kiffney, P. M., Greene, C. M., Hall, J. E., and Davies, J. R. (2006). Tributary Streams Create Spatial Discontinuities in Habitat, Biological Productivity, and Diversity in Mainstem Rivers. Can. J. Fish. Aquat. Sci. 63 (11), 2518–2530. doi:10.1139/f06-138
Kondolf, G. M., Boulton, A. J., O'Daniel, S., Poole, G. C., Rahel, F. J., Stanley, E. H., et al. (2006). Process-based Ecological River Restoration: Visualizing Three-Dimensional Connectivity and Dynamic Vectors to Recover Lost Linkages. Ecol. Soc. 11 (2), 5. doi:10.5751/es-01747-110205
Kristensen, E. A., Kronvang, B., Wiberg-Larsen, P., Thodsen, H., Nielsen, C., Amor, E., et al. (2014). 10 Years after the Largest River Restoration Project in Northern Europe: Hydromorphological Changes on Multiple Scales in River Skjern. Ecol. Eng. 66, 141–149. doi:10.1016/j.ecoleng.2013.10.001
Lamouroux, N., Gore, J. A., Lepori, F., and Statzner, B. (2015). The Ecological Restoration of Large Rivers Needs Science-Based, Predictive Tools Meeting Public Expectations: an Overview of the Rhône Project. Freshw. Biol. 60, 1069–1084. doi:10.1111/fwb.12553
Leopold, L. B., and Wolman, M. G. (1957). River Flood Plains: Some Observations on Their Formation. Washington, DC: U.S. Geological Survey.
Lorenz, A. W., Haase, P., Januschke, K., Sundermann, A., and Hering, D. (2018). Revisiting Restored River Reaches - Assessing Change of Aquatic and Riparian Communities after Five Years. Sci. Total Environ. 613-614, 1185–1195. doi:10.1016/j.scitotenv.2017.09.188
Miller, S. A., Gordon, S. N., Eldred, P., Beloin, R. M., Wilcox, S., Raggon, M., et al. (2017). Northwest Forest Plan—The First 20 Years (1994–2013): Watershed Condition Status and Trend. Gen. Tech. Rep. PNW-GTR-932. Portland, OR: U.S. Department of Agriculture, Forest Service.
Minshall, G. W., Robinson, C. T., Lawrence, D. E., Andrews, D. A., and Brock, J. T. (2001). Benthic Macroinvertebrate Assemblages in Five Central Idaho (USA) Streams over a 10-year Period Following Disturbance by Wildfire. Int. J. Wildland Fire 10 (2), 201–213. doi:10.1071/wf01018
Minshall, G. W. (2003). Responses of Stream Benthic Macroinvertebrates to Fire. For. Ecol. Manag. 178 (1-2), 155–161. doi:10.1016/s0378-1127(03)00059-8
Mouw, J. E. B., Stanford, J. A., and Alaback, P. B. (2008). Influences of Flooding and Hyporheic Exchange on Floodplain Plant Richness and Productivity. River Res. Appl. 25 (8), 929–945.
Nagel, D. E., Buffington, J. M., Parkes, S. L., Wenger, S., and Goode, J. R. (2014). A Landscape Scale Valley Confinement Algorithm: Delineating Unconfined Valley Bottoms for Geomorphic, Aquatic, and Riparian Applications. Gen. Tech. Rep. RMRS-GTR-321. Bozeman, MT: U.S. Department of Agriculture, Forest Service. doi:10.2737/rmrs-gtr-321
Nickelson, T. E., Rodgers, J. D., Johnson, S. L., and Solazzi, M. F. (1992). Seasonal Changes in Habitat Use by Juvenile Coho Salmon (Oncorhynchus kisutch) in Oregon Coastal Streams. Can. J. Fish. Aquat. Sci. 49, 783–789.
Nobre, A. D., Cuartas, L. A., Hodnett, M., Rennó, C. D., Rodrigues, G., Silveira, A., et al. (2011). Height above the Nearest Drainage—A Hydrologically Relevant New Terrain Model. J. Hydrol. 404 (1-2), 13–29. doi:10.1016/j.jhydrol.2011.03.051
O’Connor, N. A. (1991). The Effects of Habitat Complexity on the Macroinvertebrates Colonizing Wood Substrates in a Lowland Stream. Oecologia 85, 504–512.
Ogston, L., Gidora, S., Foy, M., and Rosenfeld, J. (2015). Watershed-scale Effectiveness of Floodplain Habitat Restoration for Juvenile Coho Salmon in the Chilliwack River, British Columbia. Can. J. Fish. Aquat. Sci. 72 (4), 479–490. doi:10.1139/cjfas-2014-0189
Paillex, A., Dolédec, S., Castella, E., and Mérigoux, S. (2009). Large River Floodplain Restoration: Predicting Species Richness and Trait Responses to the Restoration of Hydrological Connectivity. J. Appl. Ecol. 46 (1), 250–258. doi:10.1111/j.1365-2664.2008.01593.x
Palmer, M. A., Menninger, H. L., and Bernhardt, E. (2010). River Restoration, Habitat Heterogeneity and Biodiversity: A Failure of Theory or Practice? Freshw. Biol. 55 (1), 205–222. doi:10.1111/j.1365-2427.2009.02372.x
Penaluna, B. E., Reeves, G. H., Barnett, Z. C., Bisson, P. A., Buffington, J. M., Dolloff, C. A., et al. (2018). Using Natural Disturbance and Portfolio Concepts to Guide Aquatic-Riparian Ecosystem Management. Fisheries 43 (9), 406–422. doi:10.1002/fsh.10097
Poff, N. L., Allan, J. D., Bain, M. B., Karr, J. R., Prestegaard, K. L., Richter, B. D., et al. (1997). The Natural Flow Regime. BioScience 47 (11), 769–784. doi:10.2307/1313099
Poff, N. L. R., Olden, J. D., Vieira, N. K. M., Finn, D. A., Simmons, M. P., and Dondratieff, B. C. (2006). Functional Trait Niches of North American Lotic Insects: Trait-Based Ecological Applications in Light of Phylogenetic Relationships. J. North Am. Benthol. Soc. 25 (5), 730–755. doi:10.1899/0887-3593(2006)025[0730:ftnona]2.0.co;2
Polvi, L. E., and Wohl, E. (2013). Biotic Drivers of Stream Planform: Implications for Understanding the Past and Restoring the Future. BioScience 63 (6), 439–452. doi:10.1525/bio.2013.63.6.6
Powers, P. D., Helstab, M., and Niezgoda, S. L. (2019). A Process‐based Approach to Restoring Depositional River Valleys to Stage 0, an Anastomosing Channel Network. River Res. Applic. 35 (1), 3–13. doi:10.1002/rra.3378
Quinn, T. P., and Peterson, N. P. (1996). The Influence of Habitat Complexity and Fish Size on Over-winter Survival and Growth of Individually Marked Juvenile Coho Salmon (Oncorhynchus kisutch) in Big Beef Creek, Washington. Can. J. Fish. Aquat. Sci. 53, 1555–1564. doi:10.1139/f96-092
R Core Team (2020). R: A Language and Environment for Statistical Computing. Vienna, Austria: R Foundation for Statistical Computing. Available at: http://www.R-project.org.
Reeves, G. H., Benda, L. E., Burnett, K. M., Bisson, P. A., and Sedell, J. R. (1995). A Disturbance-Based Ecosystem Approach to Maintaining and Restoring Freshwater Habitats of Evolutionarily Significant Units of Anadromous Salmonids in the Pacific Northwest. Am. Fish. Soc. Symp. 17, 334–349.
Riebe, C. S., Sklar, L. S., Overstreet, B. T., and Wooster, J. K. (2014). Optimal Reproduction in Salmon Spawning Substrates Linked to Grain Size and Fish Length. Water Resour. Res. 50 (2), 898–918. doi:10.1002/2013wr014231
Roni, P., Pess, G. R., Beechie, T. J., and Hanson, K. M. (2014). Fish-habitat Relationships and the Effectiveness of Habitat Restoration. NOAA Tech. Memo NMFS-NWFSC-127. Seattle, WA: National Oceanic and Atmospheric Administration.
Roni, P., Hall, J. E., Drenner, S. M., and Arterburn, D. (2019). Monitoring the Effectiveness of Floodplain Habitat Restoration: A Review of Methods and Recommendations for Future Monitoring. WIRES Water 6, e1355. doi:10.1002/wat2.1355
Rosenfeld, J. S., Raeburn, E., Carrier, P. C., and Johnson, R. (2008). Effects of Side Channel Structure on Productivity of Floodplain Habitats for Juvenile Coho Salmon. North Am. J. Fish. Manag. 28 (4), 1108–1119. doi:10.1577/m07-027.1
Rosgen, D. L. (1997). “A Geomorphological Approach to Restoration of Incised Rivers,” in Proceedings of the Conference on Management of Landscapes Disturbed by Channel Incision. Editors S. S. Y. Wang, W. J. Langendoen, and F. D. Shields, 12–29.ISBN 0-937099-05-8
Saunders, W. C., and Fausch, K. D. (2007). Improved Grazing Management Increases Terrestrial Invertebrate Inputs that Feed Trout in Wyoming Rangeland Streams. Trans. Am. Fish. Soc. 136 (5), 1216–1230. doi:10.1577/t06-260.1
Schumm, S. A., Harvey, M. D., and Watson, C. C. (1984). Incised Channels: Morphology, Dynamics, and Control. U.S.: Water Resources Publications.
Scott, D., Shahverdian, S., Flitcroft, R., and Wohl, E. (2022). Refining Geomorphic Heterogeneity as a Framework for Assessing River Corridor Processes and Characteristics. Authorea Preprint. Available at: https://www.authorea.com/doi/full/10.22541/au.164458261.19144124 (Accessed March 1, 2022). doi:10.22541/au.164458261.19144124/v1
Sear, D., Newson, M., Hill, C., Old, J., and Branson, J. (2009). A Method for Applying Fluvial Geomorphology in Support of Catchment-Scale River Restoration Planning. Aquat. Conserv. Mar. Freshw. Ecosyst. 19, 506–519. doi:10.1002/aqc.1022
Sear, D. A. (1994). River Restoration and Geomorphology. Aquat. Conserv. Mar. Freshw. Ecosyst. 4 (2), 169–177. doi:10.1002/aqc.3270040207
Sedell, J. R., Reeves, G. H., Hauer, F. R., Stanford, J. A., and Hawkins, C. P. (1990). Role of Refugia in Recovery from Disturbances: Modern Fragmented and Disconnected River Systems. Environ. Manag. 14, 711–724. doi:10.1007/bf02394720
Simon, A., and Hupp, C. R. (1986). “Channel Evolution in Modified Tennessee Channels,” in Proceedings of the Fourth Federal Interagency Sedimentation Conference, Las Vegas, Nevada, March 24–27, 1986, 5–71.
Smith, R. F., Neideigh, E. C., Rittle, A. M., and Wallace, J. R. (2019). Assessing Macroinvertebrate Community Response to Restoration of Big Spring Run: Expanded Analysis of Before‐after‐control‐impact Sampling Designs. River Res. Applic. 36 (1), 79–90. doi:10.1002/rra.3556
Sommer, T. R., Nobriga, M. L., Harrell, W. C., Batham, W., and Kimmerer, W. J. (2001). Floodplain Rearing of Juvenile Chinook Salmon: Evidence of Enhanced Growth and Survival. Can. J. Fish. Aquat. Sci. 58 (2), 325–333. doi:10.1139/f00-245
Stanford, J. A., Lorang, M. S., and Hauer, F. R. (2005). The Shifting Habitat Mosaic of River Ecosystems. SIL Proc. 29 (1), 123–136. doi:10.1080/03680770.2005.11901979
Tickner, D., Opperman, J. J., Abell, R., Acreman, M., Arthington, A. H., Bunn, S. E., et al. (2020). Bending the Curve of Global Freshwater Biodiversity Loss: An Emergency Recovery Plan. BioScience 70 (4), 330–342. doi:10.1093/biosci/biaa002
Tockner, K., Schiemer, F., Baumgartner, C., Kum, G., Weigand, E., Zweimüller, I., et al. (1999). The Danube Restoration Project: Species Diversity Patterns across Connectivity Gradients in the Floodplain System. Regul. Rivers Res. Manage. 15, 245–258. doi:10.1002/(sici)1099-1646(199901/06)15:1/3<245::aid-rrr540>3.0.co;2-g
Vieira, N. K. M., Clements, W. H., Guevara, L. S., and Jacobs, B. F. (2004). Resistance and Resilience of Stream Insect Communities to Repeated Hydrologic Disturbances after a Wildfire. Freshw. Biol. 49, 1243–1259. doi:10.1111/j.1365-2427.2004.01261.x
Ward, J. V., Tockner, K., Uehlinger, U., and Malard, F. (2001). Understanding Natural Patterns and Processes in River Corridors as the Basis for Effective River Restoration. Regul. Rivers Res. Mgmt. 17, 311–323. doi:10.1002/rrr.646
Ward, J. V. (1989). The Four-Dimensional Nature of Lotic Ecosystems. J. North Am. Benthol. Soc. 8 (1), 2–8. doi:10.2307/1467397
Webb, R. H., and Leake, S. A. (2006). Ground-water Surface-Water Interactions and Long-Term Change in Riverine Riparian Vegetation in the Southwestern United States. J. Hydrol. 320 (3-4), 302–323. doi:10.1016/j.jhydrol.2005.07.022
Westbrook, C. J., Cooper, D. J., and Baker, B. W. (2011). Beaver Assisted River Valley Formation. River Res. Appl. 27 (20), 247–256. doi:10.1002/rra.1359
J. M. Wheaton, S. N. Bennett, N. Bouwes, J. D. Maestas, and S. M. Shahverdian (Editors) (2019). Low-Tech Process-Based Restoration of Riverscapes: Design Manual. Version 1.0 (Logan, UT: Utah State University Restoration Consortium). doi:10.13140/RG.2.2.19590.63049/2
Wohl, E., Angermeier, P. L., Bledsoe, B., Kondolf, G. M., MacDonnell, L., Merritt, D. M., et al. (2005). River Restoration. Water Resour. Res. 41, 10–W10301. doi:10.1029/2005wr003985
Wohl, E., Lininger, K. B., and Scott, D. N. (2018). River Beads as a Conceptual Framework for Building Carbon Storage and Resilience to Extreme Climate Events into River Management. Biogeochemistry 141 (3), 365–383. doi:10.1007/s10533-017-0397-7
Wohl, E., Castro, J., Cluer, B., Merritts, D., Powers, P., Staab, B., et al. (2021). Rediscovering, Reevaluating, and Restoring Lost River-Wetland Corridors. Front. Earth Sci. 9, 511. doi:10.3389/feart.2021.653623
Wohl, E. (2011). Threshold-induced Complex Behavior of Wood in Mountain Streams. Geology 39 (6), 587–590. doi:10.1130/g32105.1
Keywords: process-based restoration, valley-scale restoration, monitoring, multiple metrics, ecohydraulic design
Citation: Flitcroft RL, Brignon WR, Staab B, Bellmore JR, Burnett J, Burns P, Cluer B, Giannico G, Helstab JM, Jennings J, Mayes C, Mazzacano C, Mork L, Meyer K, Munyon J, Penaluna BE, Powers P, Scott DN and Wondzell SM (2022) Rehabilitating Valley Floors to a Stage 0 Condition: A Synthesis of Opening Outcomes. Front. Environ. Sci. 10:892268. doi: 10.3389/fenvs.2022.892268
Received: 08 March 2022; Accepted: 27 May 2022;
Published: 15 July 2022.
Edited by:
Carlos Frankl Sperber, Universidade Federal de Viçosa, BrazilReviewed by:
Teresa Ferreira, University of Lisbon, PortugalCopyright © 2022 Flitcroft, Brignon, Staab, Bellmore, Burnett, Burns, Cluer, Giannico, Helstab, Jennings, Mayes, Mazzacano, Mork, Meyer, Munyon, Penaluna, Powers, Scott and Wondzell. This is an open-access article distributed under the terms of the Creative Commons Attribution License (CC BY). The use, distribution or reproduction in other forums is permitted, provided the original author(s) and the copyright owner(s) are credited and that the original publication in this journal is cited, in accordance with accepted academic practice. No use, distribution or reproduction is permitted which does not comply with these terms.
*Correspondence: Rebecca L. Flitcroft, cmViZWNjYS5mbGl0Y3JvZnRAdXNkYS5nb3Y=
Disclaimer: All claims expressed in this article are solely those of the authors and do not necessarily represent those of their affiliated organizations, or those of the publisher, the editors and the reviewers. Any product that may be evaluated in this article or claim that may be made by its manufacturer is not guaranteed or endorsed by the publisher.
Research integrity at Frontiers
Learn more about the work of our research integrity team to safeguard the quality of each article we publish.