- 1School of Earth Resources, China University of Geosciences, Wuhan, China
- 2International Research Center of Big Data for Sustainable Development Goals, Beijing, China
- 3Key Laboratory of Digital Earth Science, Aerospace Information Research Institute, Chinese Academy of Sciences, Beijing, China
- 4College of Resources and Environment, University of Chinese Academy of Sciences, Beijing, China
Precipitation is an important part of the atmospheric circulation in the Arctic and is of great significance to the energy budget and hydrological characteristics of the Arctic region. The distribution of precipitation affects the exchange of energy, which then affects the Arctic sea ice indirectly. Arctic precipitation impacts the sea surface albedo, which leads to changes in the sea ice concentration (SIC) and the energy exchange between the sea, ice, and air. In this study, GPM IMERG precipitation data, which have a spatial resolution of 0.1°, were used to analyze the characteristics of precipitation in the Northeast Passage (NEP) from May to December during the period 2011–2020. This analysis of the amount of precipitation and its distribution were performed for the Barents Sea, Kara Sea, Laptev Sea, and East Siberian Sea. The relationship between precipitation and sea ice was also explored. The results show that, during the study period, the average precipitation over the Barents Sea from May to December was 57–561 mm/year and that this area had the highest precipitation in the NEP. For the Kara Sea, the average precipitation for May to December was 50–386 mm/year and for the East Siberian Sea and the Laptev Sea it was 48–303 mm/year and 53–177 mm/year, respectively. For the NEP as a whole, September was found to be the month with the highest average precipitation. An analysis of the correlation between the precipitation and the SIC gave a correlation coefficient of −0.792 for the study period and showed that there is a 15-day delay between the precipitation increase and the decrease in SIC. The analysis of the precipitation data in these areas thus showed that precipitation is related to SIC and is of great importance to understanding and predicting the navigable capacity of the NEP.
1 Introduction
As a result of global warming, the surface temperature of the Arctic has risen two to three times faster than the global mean temperature—a phenomenon known as Arctic Amplification (Serreze and Francis, 2006). Among climate change indicators, the long-term decline in the annual average extent of sea ice is one of the clearest indicators of climate change and has generated much concern in the scientific community as well as more widely in society (IPCC et al., 2013). The warming of the Arctic climate will lead to an acceleration of the hydrological cycle as the melting of sea ice leads to increased interaction between the sea, ice, and air (Kopec et al., 2016). In addition, the transport of moisture from low latitudes into the Arctic can affect atmospheric humidity and precipitation (Vihma et al., 2016). In the Arctic, precipitation is expected to increase by 50% by 2100, and most of the precipitation will then be in the form of rain (Kattsov et al., 2007; Perovich et al., 2009; Screen and Simmonds, 2012; Bintanja and Selten, 2014). The influence of moisture transport in the Arctic is variable because changes in precipitation are related to patterns in atmospheric circulation and depend on the moisture (Gimeno-Sotelo et al., 2018; Gimeno-Sotelo et al., 2019). The transfer of moisture from the temperate zone to the polar regions in spring is increasing, and the increase in radiation emitted by moisture contributes to the melting of the sea ice (Kapsch et al., 2013) Arctic precipitation has a significant effect on navigation monitoring, sea ice, and climate cycles, and can be used to analyze and forecast the environmental status of the Arctic (Francis et al., 2009).
The annual mean extent of Arctic sea ice has decreased significantly in the past 40 years, with the most significant decline occurring in late summer and early autumn since the beginning of the 21st century (Lee et al., 2017; Serreze and Meier, 2019). Sea ice melting is a complex physical process that is affected by factors such as temperature, the size of the heat flux, and water transport (Screen et al., 2018; Webster et al., 2018). These factors can change the length of the melting season and determine the when the sea ice begins to melt (Perovich and Polashenski, 2012; Stroeve et al., 2014; Mortin et al., 2016). The Arctic sea ice melting season begins in spring and ends in autumn (Hegyi and Deng, 2017; Huang et al., 2019). Some studies have confirmed the relationship between the melting of Arctic sea ice and precipitation (Higgins and Cassano, 2009; Screen et al., 2015). In recent years, the Arctic has become warmer and wetter, and the amount of evaporation has gradually increased along with the melting of sea ice (Boisvert et al., 2015; Boisvert and Stroeve, 2015)—the decrease in the amount of sea ice leads to an increase in the atmospheric moisture content because the melting of the ice exposes the surface of the sea to the atmosphere, which leads to a sharp increase in evaporation (Barry and Serreze, 1998; Zhong et al., 2018). The loss of sea ice is thus leading to more intense local evaporation in the Arctic, which, in turn, is leading to increased precipitation (Kopec et al., 2016).
However, some studies have found that external moisture contributes 70%–90% of the water in the Arctic hydrological cycle (Singh et al., 2017). Arctic snowfall does not change the albedo of sea ice because both ice and snow already have a high albedo (Bintanja et al., 2018). In a warmer climate, however, most Arctic precipitation would be in liquid form (Bintanja and Andry, 2017); this would reduce the albedo of the snow- and ice-covered surfaces. Therefore, rainfall in the Arctic causes sea ice to melt. When rainfall occurs, the snow melts rapidly, its thickness decreases, and the snow grains become larger; the liquid water content of the snow layer also increases, and the albedo decreases by 10% (Dou et al., 2019; Dou et al., 2021). Thus, it can be seen that Arctic precipitation has an impact on sea ice.
In the past, the Arctic Ocean was covered by ice all year round, the navigable area was smaller, and no reliable route through the ocean was available (Melia et al., 2016; Chen et al., 2020). As a result of climate change, the extent and thickness of the sea ice has decreased. These trends have accelerated over recent decades, providing favorable conditions for navigation in the Northeast Passage (NEP) (Comiso et al., 2008; Kerr, 2009; Parkinson and Cavalieri, 2012; Kwok, 2018). The NEP starts in the North Atlantic Ocean and passes through the Barents Sea, Kara Sea, Laptev Sea, East Siberian Sea, and Bering Sea (Zeng et al., 2020). The NEP is an important shipping route connecting Northern Europe and East Asia. Compared with traditional shipping routes, using the NEP can reduce the length of the voyage by one third and save 10 days’ travel time, greatly reducing the cost of shipping (Verny and Grigentin, 2009; Schoyen and Brathen, 2011; Eguiluz et al., 2016). The Northeast Passage is also an important part of China’s Belt and Road initiative (Qiu et al., 2017).
The study area that was used included the Barents Sea (65°N‒80°N, 20°E‒65°E), Kara Sea (70°N‒80°N, 65°E‒100°E), Laptev Sea (70°N‒80°N, 100°E‒145°E), and East Siberian Sea (70°N‒80°N, 145°E‒180°E) (Figure 1). These are mainly areas close to the northern coast of Russia and Norway and include the main Arctic shipping routes. During the navigable period, there is still a large amount of ice cover in this region, particularly in the Kara Sea and Laptev Sea near to the island of Severnaya Zemlya. Therefore, the study of this area is of great significance to shipping (Eguiluz et al., 2016).
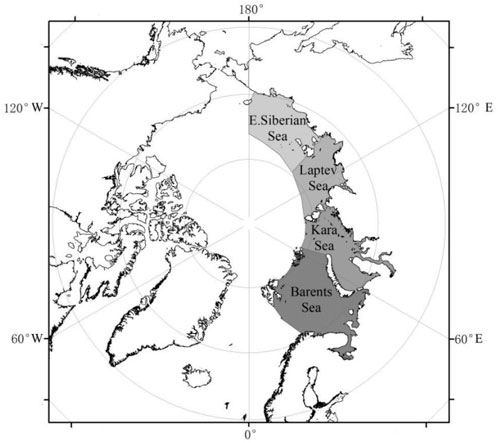
FIGURE 1. Map of the NEP including the location of the Barents Sea, Kara Sea, Laptev Sea, and East Siberian Sea.
The sea ice in the NEP starts to melt in early May and does not completely freeze until December (Higgins and Cassano, 2009; Screen et al., 2015). The coverage of ground stations in the region is limited and it is difficult to obtain accurate information on the distribution of precipitation in the NEP (Bosilovich et al., 2011). Therefore, in this study, high-precision GPM IMERG precipitation data and sea ice concentration data were used to analyze the characteristics of precipitation and the relationship between precipitation and sea ice in each part of the study area during the NEP’s navigable period—May–December—for each year from 2011 to 2020. It was found that there is a negative correlation as well as a time lag between precipitation and the sea ice density. It is concluded, therefore, that Arctic precipitation can affect the navigability of the NEP.
2 Data and methodology
2.1 Dataset
2.1.1 Precipitation
Usually, precipitation measurements are made at meteorological ground stations, but it is difficult to obtain precipitation measurements for the Arctic directly due to the lack of ground stations and their uneven distribution; the windy conditions experienced in the Arctic are an additional problem (Bosilovich et al., 2011). GPM IMERG is a precipitation product produced by a multi-satellite integration algorithm based on passive microwave and infrared data obtained by NASA (https://gpm.nasa.gov/). The algorithm combines passive microwave data from all of the GPM satellites with infrared data from geostationary satellites as well as data obtained from ground rainfall gauges. GPM IMERG has the ability to detect moderate and heavy precipitation as well as light and solid precipitation. Data for May–December for the years 2011–2020 were selected. These data were in NETCDF4 format and had a temporal resolution of 1 day and a spatial resolution of 0.1 × 0.1. This spatial resolution corresponds to that of the GPM IMERG Final-Run product, which was chosen because of the limited size of the study area and because it could more accurately display the distribution of the precipitation.
2.1.2 Sea ice concentration
The SIC data that were used consisted of the daily real-time SIC product released by the Institute of Environmental Physics (IUP) of the University of Bremen, Germany (https://seaice.unibremen.de/start/data-archive/), which uses AMSR2 and AMSR-E brightness temperature data as source data and then produces results calculated by the ASI (ARTIST Sea Ice) SIC algorithm. The Bremen SIC product provides long-term series of SIC data with spatial resolution of 3.125 km. The area covered by this product includes the North and South poles. The ASI algorithm makes use of the clear difference in brightness temperature between sea ice and seawater in horizontally polarized high-frequency (89-GHz) data to determine the SIC. SIC data for the period May–December for each year from 2011 to 2020 were selected for use (however, data for the months November 2011, December 2011, May 2012, and June 2016 were missing.
2.2 Correlation and linear regression
An analysis of the degree of linear correlation between the precipitation and SIC was carried out for the study area. This analysis was based on calculations of the Pearson correlation coefficient, R. R has a value in the range [‒1, 1]. If R > 0, the two variables are positively correlated, whereas if R < 0, the two variables are negatively correlated; the larger the absolute value of R, the stronger the correlation between the two. R can be calculated as
where R is the correlation coefficient, Si is the ith value of variable S, and
From a linear fitting of the monthly precipitation in the study area, the characteristics of the regional precipitation could be found. The linear fitting was described by the following equations:
and
where b is the constant in the equation of linear fit, n is the total number of data, xi is the value of the ith data, yi is the value of the ith data,
The time lag between the precipitation and SIC was determined using the daily precipitation data for May–August and the daily SIC data for May–September for each year during the period 2011–2020. The length of the delay (in days) was found by comparing the correlation coefficients for different time lags:
Here Ra is the time lag correlation coefficient, a is the length of the time lag (in days), Si is the ith value of variable S, and
3 Spatiotemporal analysis of precipitation
3.1 Time-series analysis
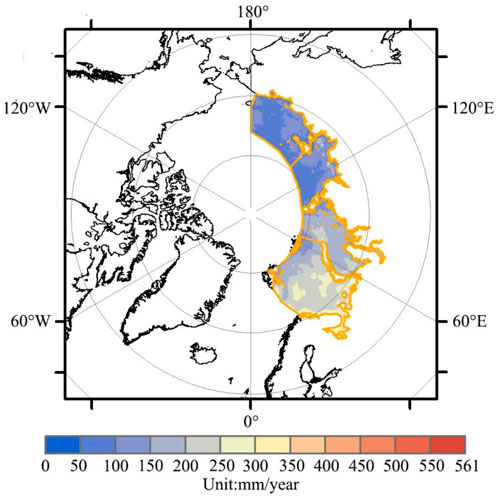
Although previous studies of Arctic precipitation have provided a preliminary understanding of the characteristics of precipitation in the region, there have been few studies specifically on precipitation in the NEP. In this study, GPM IMERG precipitation data were used to analyze the average precipitation during the period May–December for 2011–2020 (Figure 2). It was found that the average precipitation in the four sea areas of the NEP varied wildly. As shown previously (Boisvert et al., 2018), these sea areas could be ordered Barents Sea, Kara Sea, Laptev Sea, and East Siberian Sea, with the Barents Sea having the highest precipitation and the East Siberian Sea the lowest. The relatively high precipitation in the Barents Sea and Kara Sea may be related to the warm and humid air that enters the region from the North Atlantic (Behrangi and Wen, 2017). In contrast, the Laptev Sea and East Siberian Sea are less affected by the North Atlantic and receive less precipitation on average. The average May–December precipitation varies greatly from 57 to 561 mm/year in the Barents Sea to 50–386 mm/year in the Kara Sea, 48–303 mm/year in the Laptev Sea, and 53–177 mm/year in the East Siberian Sea. The average precipitation decreases with latitude.
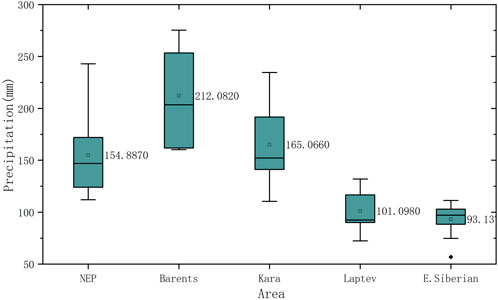
FIGURE 2. The average precipitation from May to December in the Northeast Passage, with corresponding individual averages for the Barents Sea, Kara Sea, Laptev Sea, and East Siberian Sea.
Using the GPM IMERG precipitation data, the monthly average precipitation in the study area during the study period was also analyzed (Figure 3). It was found that the monthly average precipitation first increases during the period May–September and then decreases from September onwards. In the Barents Sea, there is abundant precipitation throughout the year. In the Barents Sea, there is also slightly more precipitation in December than in November; this may be related to the occurrence of winter storms in the North Atlantic (Serreze and Barrett, 2008; Simmonds et al., 2008). In the Kara Sea, the monthly average precipitation also gradually increases from May to September; it then decreases during the period October to December. In the Laptev Sea and the East Siberian Sea, the amount of precipitation remains fairly constant from July to October; however, the amount of precipitation is still less than in the Barents Sea and Kara Sea.
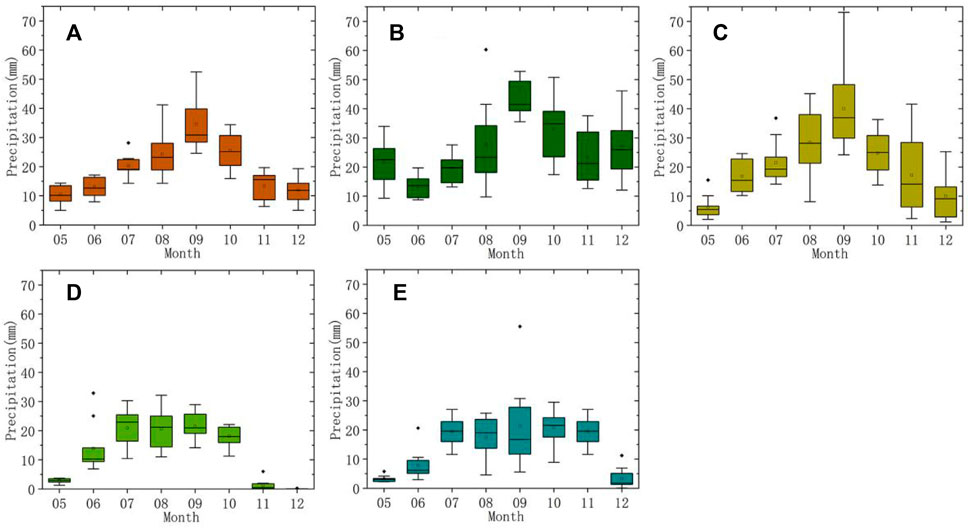
FIGURE 3. The monthly average precipitation in (A) the Northeast Passage, (B) Barents Sea, (C) Kara Sea, (D) Laptev Sea, and (E) East Siberian Sea.
The linear fitting of the monthly precipitation in the NEP, Barents Sea, Kara Sea, Laptev Sea, and East Siberian Sea shows how the precipitation in the NEP changed over the decade 2011–2020 (Figure 4). Overall, the precipitation in the NEP shows an increasing trend, with the precipitation in the Barents Sea and Kara Sea also increasing and the precipitation in the Laptev Sea and East Siberian Sea slowly decreasing. As more warm, moist subtropical air enters the Arctic, the amount of precipitation in the Barents Sea and Kara Sea is gradually increasing (Serreze and Barrett, 2008; Simmonds et al., 2008); the amount of precipitation in the Laptev Sea and East Siberian Sea is also affected by the presence of the Central Siberian Plateau and the island of Severnaya Zemlya.
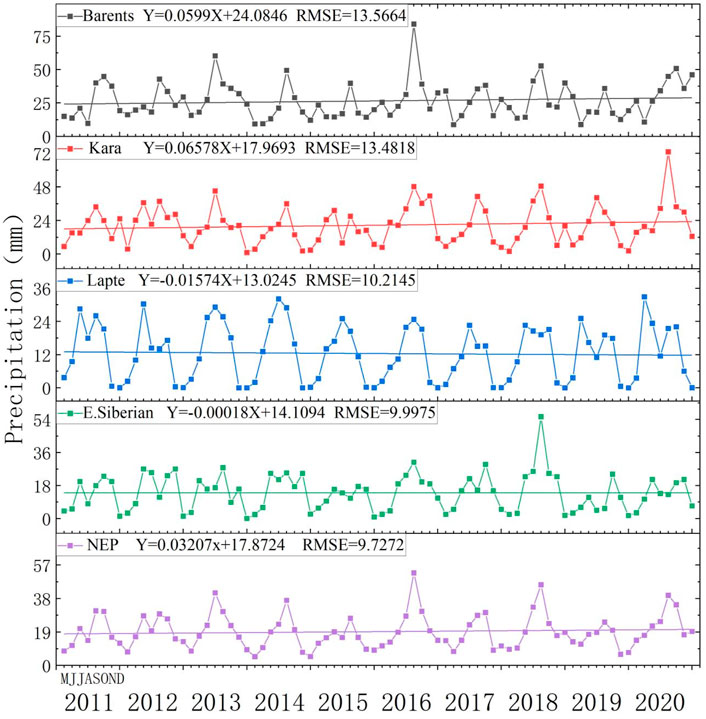
FIGURE 4. Results of linear regression of monthly precipitation from May to December for the period 2011–2020. It can be seen that, overall, the amount of precipitation in the NEP is increasing. Among the divisions of the NEP, the precipitation is increasing in the Barents Sea and Kara Sea, whereas in the Laptev Sea and East Siberian Sea it is decreasing.
3.2 Spatial analysis of precipitation
A spatial analysis of the average precipitation in the NEP during the period May–December for the years 2011–2020 shows that precipitation varies across the region (Figure 5). In the Barents Sea, the precipitation is concentrated near to river estuaries and the coastline. This is also the case for the precipitation in the Kara Sea; in this case, there also areas to the Northeast and South of Novaya Zemlya that receive a relatively large amount of precipitation as a result of the interaction between the island’s mountainous terrain and the moisture that is being transported into the region (Boisvert et al., 2015; Boisvert et al., 2018). The precipitation in the Laptev Sea is also concentrated near to the coast, whereas in the East Siberian Sea it is concentrated to the West of the Liakhov Islands and the East of Wrangel Island.
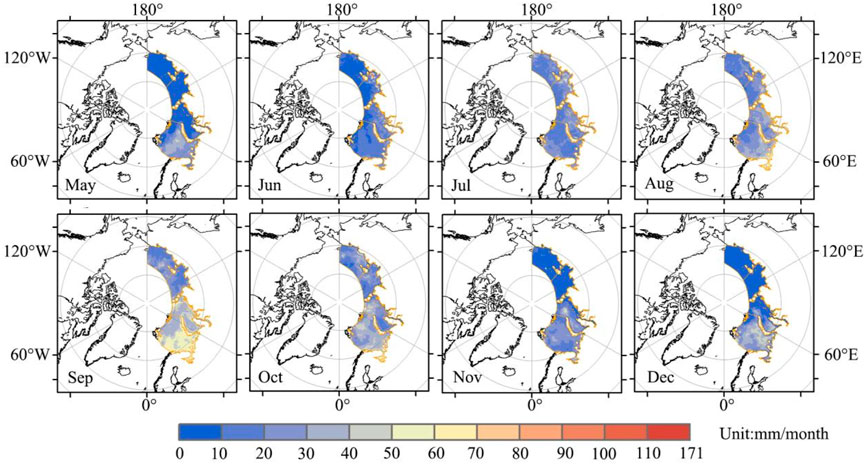
A spatial analysis of the monthly average precipitation in the NEP for May–December for the period 2011–2020 shows that, in May, the precipitation is concentrated in the Barents Sea (Figure 6). In June, the precipitation is mainly concentrated in the Barents Sea and Kara Sea as well as near to estuaries and the coastline throughout the NEP. From July to October, significant precipitation falls across the NEP, but the amount of precipitation in the Barents Sea and Kara Sea is still greater than in other regions. In November and December, the precipitation is again concentrated in the Barents Sea and Kara Sea. It can be seen, therefore, that, among the marginal seas that constitute the NEP, the Barents Sea and Kara Sea receive relatively large amounts of precipitation. These regions receive relatively abundant precipitation from May to December, which may be related to the moisture that enters the Arctic (Serreze and Barrett, 2008; Simmonds et al., 2008). In the Laptev Sea and East Siberian Sea, the precipitation has a distinct seasonal pattern with most precipitation falling in the period June–November.
4 Analysis of the correlation between precipitation and sea ice
4.1 The spatiotemporal relationship between precipitation and sea ice concentration
Most studies of changes in the Arctic water cycle have focused on the assessment of precipitation trends, while less research has been done on the magnitude of climate change in the Arctic or on the relationships between the ocean, ice, and atmosphere (Holland et al., 2007; Pendergrass et al., 2017). Precipitation that falls onto sea ice has a great effect on the thickness of the ice: snowfall can cause snow to accumulate on top of the ice, increasing its thickness, whereas rainfall reduces the albedo of the ice surface and promotes melting. Snow melts rapidly when it rains, resulting in a sharp drop in snow thickness (Dou et al., 2019; Dou et al., 2021). A linear regression and Pearson correlation analysis was carried out for the monthly precipitation and monthly average SIC for May–December for 2011–2020 (Figure 7). It was found that, overall in the NEP, there is a strong negative correlation—correlation coefficient −0.792—between the monthly precipitation and the SIC. In the Barents Sea, however, there is only a weak negative correlation with a correlation coefficient of −0.348. The melting of sea ice is affected by many factors, such as the air temperature, sensible heat flux, moisture, and precipitation. The Barents Sea may be impacted by factors such as moisture that is transported from the North Atlantic, and the effect of precipitation on sea ice in the region is weaker. In the Kara Sea, the monthly precipitation and SIC have a strong negative correlation giving a correlation coefficient of −0.769. In the Laptev Sea, there is also a strong negative correlation with a correlation coefficient of −0.838. In the East Siberian Sea, the monthly precipitation and SIC are also negatively correlated, and the correlation coefficient is −0.5226. Thus, it can be seen that there is a negative correlation between precipitation and SIC in the NEP, and that this correlation is strongest in the Laptev Sea.
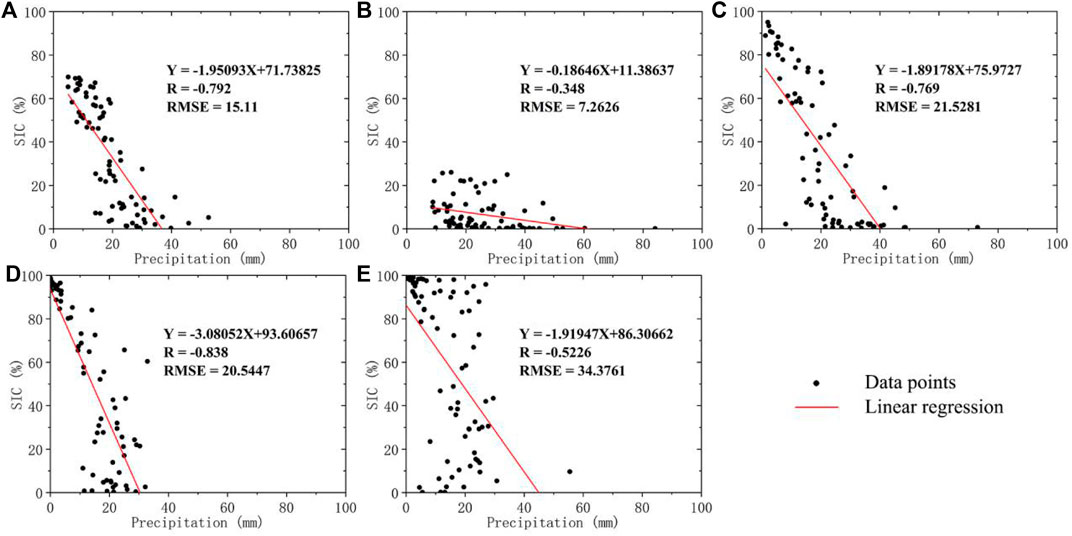
FIGURE 7. Linear regression of SIC against monthly precipitation in (A) the NEP, (B) Barents Sea, (C) Kara Sea, (D) Laptev Sea, and (E) East Siberian Sea for the period May–December for 2011–2020. All of the correlation coefficients passed the significance test (p < 0.01).
A Pearson correlation analysis was also carried out between the monthly precipitation and the monthly average SIC for the months May–December for the years 2011–2020. The spatial patterns in the correlation coefficient were then obtained and are shown in Figure 8. It can be seen from the figure that there is a region including the northern part of the Kara Sea and the northern part of the Laptev Sea, around Severnaya Zemlya, where the correlation is strongly negative. For parts of the Barents Sea, in contrast, the correlation did not pass the significance test, and the overall correlation is weak.
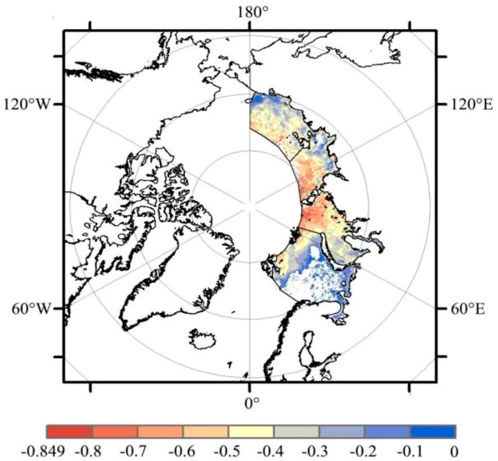
FIGURE 8. The spatial distribution of the correlation between precipitation and SIC in the NEP for May–December for the years 2011–2020. (The data for November 2011, December 2011, May 2012, and June 2016 are missing).
4.2 Hysteresis of precipitation and sea ice concentration
There have been many studies on the relationship between precipitation and sea ice melt in the Arctic (Higgins and Cassano, 2009; Screen, et al., 2015; Kopec et al., 2016), but there has been very little research on the direct effect of changes in precipitation on SIC. The effect of precipitation on sea ice varies because the effect depends on the mechanism producing the precipitation (Gimeno-Sotelo et al., 2018; Gimeno-Sotelo et al., 2019). Some moisture entering the Arctic from other regions accelerates the hydrological cycle in the Arctic, thus leading to an increase in precipitation (Singh et al., 2017). There are also several studies on the future of the Arctic climate that have found that increased evaporation leads to increased precipitation (Kattsov et al., 2007; Rawlins et al., 2010) and that more precipitation will occur in the form of rain (Vihma, 2014). Arctic precipitation can energize the Arctic Ocean surface, promote the melting of sea ice, and affect the mass balance of high-latitude glaciers and ice sheets (Bintanja et al., 2018). However, there are time lags associated with these processes. The analysis of monthly precipitation and monthly average SIC for the period May–December described above shows that the SIC decreases as the precipitation increases. These results also show that there is a delay between the precipitation increase and the decrease in SIC, and this was found to be the case for the different individual sea areas within the NEP (Figure 9).
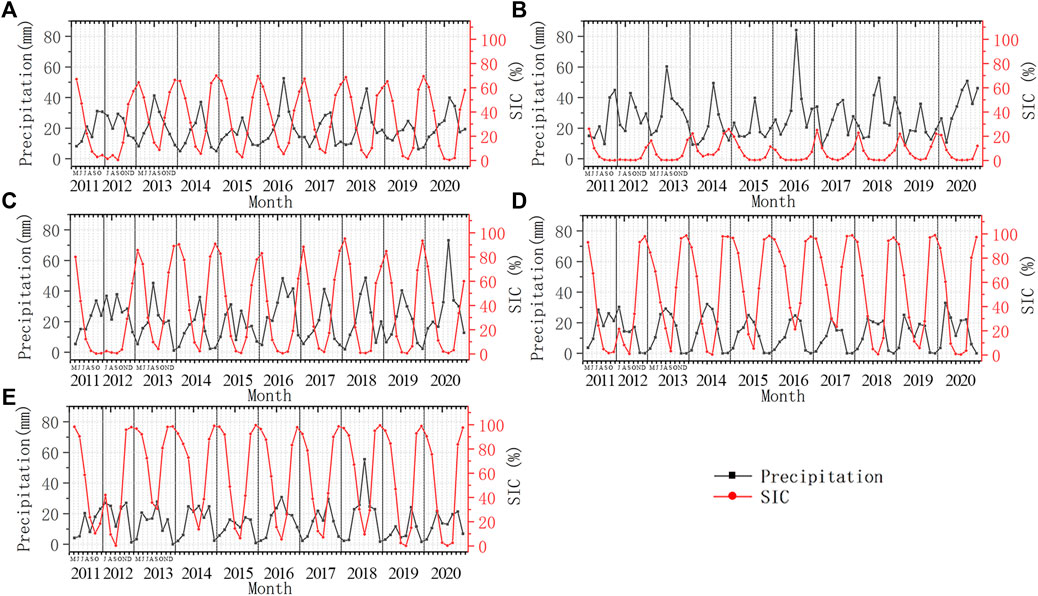
FIGURE 9. Time-series showing the variations in monthly precipitation and monthly average SIC in (A) the NEP, (B) Barents Sea, (C) Kara Sea, (D) Laptev Sea, and (E) East Siberian Sea for May–December for the years 2011–2020. (Data for November 2011, December 2011, May 2012, and June 2016 data are missing).
The type of precipitation also affects the thinning of snow on sea ice in different ways (Dou et al., 2021). Since the 1990s, the amount of rainfall in the Arctic has increased significantly as temperatures have risen (Han et al., 2018; Pan et al., 2020). As the rainfall has increased, the melt pools on the surface of the sea ice have grown, and these melt ponds promote further ice loss due to their low albedo; there is a time lag associated with this process however (Webster et al., 2018). In addition, rainfall leads to the rapid melting of snow, a sharp reduction in the thickness of the snow, and increase in snow particles, and an increase in the liquid water content of the snow layer. The result is a decrease in albedo of 10%, which again contributes to the melting of sea ice (Dou et al., 2019; Dou et al., 2021). The time lag correlation coefficient was analyzed for each sea area in the NEP, and it was found that the correlation coefficient first decreased and then increased as the number of days since the precipitation increase and the decrease in SIC. The correlation coefficient reaches its maximum (negative) value of −0.54597 on day 15. From the graphs plotting the time lag correlation coefficient against the length of delay for each sea area (Figure 10), it can be seen that the time lag correlation is particularly weak in the Barents Sea area. For all four sea areas, the correlation coefficient first decreases and then increases. The maximum values of the correlation coefficients for the Barents Sea, Kara Sea, Laptev Sea, and East Siberian Sea are −0.0803, −0.49707, −0.55976, and −0.47291, respectively. These values correspond to delays of 5, 10, 25, and 25 days, respectively. The time lag thus increases from West to East.
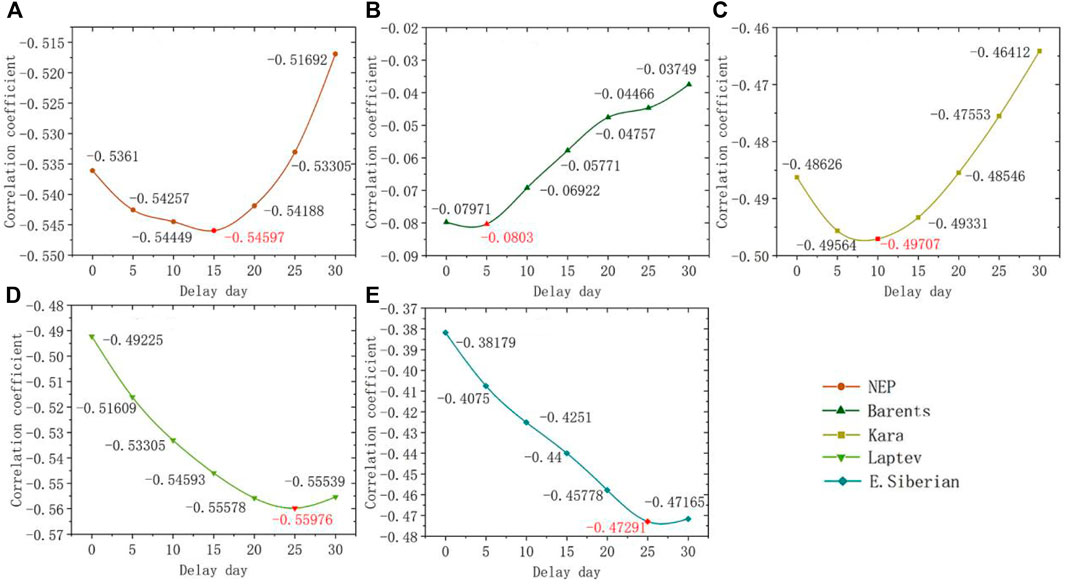
FIGURE 10. Graphs showing the correlation coefficient between the precipitation increase and the decrease in SIC plotted against the length of delay in days for (A) the NEP, (B) Barents Sea, (C) Kara Sea, (D) Laptev Sea, and (E) East Siberian Sea. All of the correlation coefficients passed the significance test (p < 0.01).
5 Discussion
Compared with other precipitation products, GPM IMERG has a higher spatial and temporal resolution and a greater detection ability; however, very little verification of the accuracy of GPM IMERG has been carried out for the Arctic. In the Arctic, passive microwave data are masked out over areas of snow and ice, which means that only microwave-adjusted IR-based estimates are available for these areas. These microwave adjustments to the IR data depend on interpolations based on areas surrounding the masked-out areas. As a result, GPM IMERG contains errors at high latitudes. Nevertheless, some studies based on GPM IMERG have been carried out at high latitudes. One study in which GPM IMERG was evaluated found that it had a great performance at high latitudes in Finland (Mohammed et al., 2021). A study of global precipitation in which GPM IMERG and ERA5 were compared showed that the accuracy of GPM IMERG is poorer than that of ERA5 but that IMERG has a better spatial resolution (Xiong et al., 2022). It should be noted that the calibration reference for GPM IMERG is based on a small number of GPM precipitation estimates at high latitudes (Skofronick-Jackson et al., 2017, 2019). It is also possible that the methodology introduced in V6 of the IMERG product to mitigate the radar sensitivity-related deficiencies in the combined product (Freitas et al., 2020) overcompensates for this problem, resulting in precipitation overestimates in some areas. The IMERG product can also detect extreme precipitation more accurately than the reanalysis product (Boisvert et al., 2021).
By analyzing the correlation between precipitation and SIC, it was found that the correlation is very different in the different sea areas within the NEP. As the melting of sea ice is affected by many factors (Webster et al., 2018), the influence of precipitation on the melting of sea ice is different in each sea area. The Barents Sea has the lowest correlation coefficient among the four sea areas studies because the Barents Sea ice is greatly affected by other factors that cause the melting of sea ice (Arthun and Schrum, 2010; Sando et al., 2014), which means that the impact of precipitation on sea ice is weakened. For some areas of the Barents Sea, the degree of correlation between the precipitation and SIC did not pass the significance test. This is due to the flow of energy from the open water in the Barents Sea into the Arctic Ocean, which means that there is no linear relationship between the two variables (Arthun and Schrum, 2010; Sando et al., 2014). The time lag between the precipitation and sea ice concentration was found to have a particular spatial pattern, with the time lag increasing from the Barents Sea in the West to the East Siberian Sea in the East. In the Barents Sea, this correlation was very weak and negative; for the other sea areas it was moderately negative. For the Laptev Sea and the East Siberian Sea, the time lag was 25 days; this was quite different from the time lag for the Barents Sea and Kara Sea. This difference may be due to the greater snowfall in the Laptev Sea and East Siberian Sea (Boisvert et al., 2018). The amount of snow on the surface of Arctic sea ice is a decisive factor in its growth and decay (Maykut and Untersteiner, 1971).
In this study, the relationship between the distribution of precipitation and sea ice was analyzed during melting and freezing periods. However, seasonal anomalies were not taken into account. Taking seasonal anomalies in the precipitation and SIC data into consideration might have produced better results. In addition, the Arctic Oscillation and Atlantic Oscillation have an impact on Arctic precipitation and sea ice (Aanes et al., 2002). The relationships between precipitation and the Arctic Oscillation (AO), North Atlantic Oscillation (NAO), and dipole anomaly (DA), are very important; analysis of the correlation between precipitation and these factors may be of help to making predictions of precipitation in the Arctic.
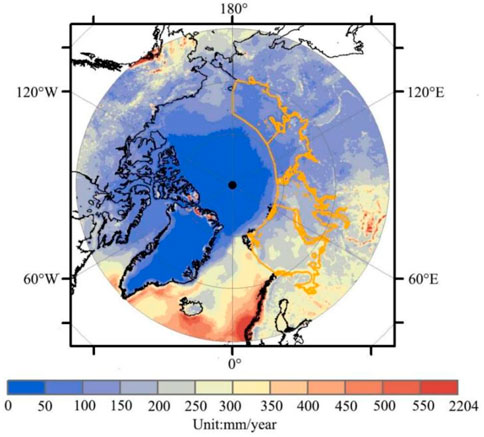
An analysis of the distribution of precipitation in the land areas bordering the NEP (Figure 11) shows that the Western Siberian Plain has the highest average precipitation; this is followed, in order, by the Eastern European Plain, Eastern Siberian Mountains, and Central Siberian Plateau. Within the Central Siberian Plateau and the Eastern Siberian Mountains, areas near the Lena River have the highest average precipitation; within the Western Siberian Plain, the precipitation is greatest in the Yenisei and Ob River basins. In general, the precipitation over the land areas is greater than in the NEP. The relationship between the distribution of precipitation over the Arctic Ocean, over the land precipitation, and environmental change is a possible topic for future study.
6 Conclusion
Within the NEP, average precipitation from May–December was found to be highest in the Barents Sea, followed, in order, by the Kara Sea, Laptev Sea, and East Siberian Sea. For the Barents Sea and Kara Sea, the total precipitation is within the range 200–300 mm, whereas for the Laptev Sea and East Siberian Sea it is within the range 50–150 mm. Overall, the monthly average precipitation increases from May onwards, reaches a maximum in September and then decreases. In the Barents Sea and Kara Sea, most of the precipitation falls in summer; in the Laptev Sea and East Siberian Sea, there is not much variation from month to month. Linear fitting of the monthly precipitation in the NEP for the period 2011–2020 shows that the precipitation has increased slightly. The amount of precipitation in the Barents Sea and Kara Sea is increasing, whereas in the Laptev Sea and Kara Sea there has been a decrease.
Based on an analysis of the correlation between the precipitation and SIC for the period 2011–2020, a negative correlation with a correlation coefficient of −0.792 was found. The correlation in the Barents Sea is weak and negative with a correlation coefficient of −0.348. In the Kara Sea and Laptev Sea, in contrast, the correlation is very strong, with correlation coefficients of −0.769 and −0.838, respectively. In the East Siberian Sea, the correlation is moderately negative with a correlation coefficient of −0.5226.
An analysis of the time lag between the precipitation and sea ice concentration indicates a moderate correlation except for the Barents Sea, where the correlation was found to be very weak and negative. Overall for the NEP, a delay of 15 days was found; for the Barents Sea and Kara Sea, delays of 5 and 10 days, respectively, were found, and for both the Laptev Sea and the East Siberian Sea, the delay was 25 days. Thus, from West to the East across the NEP, the time lag increases. By studying the time lag for each sea area within the NEP, the navigable capacity of the different areas can be predicted to a certain extent. This can provide assistance to ships traversing the NEP.
Data availability statement
Publicly available datasets were analyzed in this study. This data can be found here: The datasets of the precipitation and sea ice concentration for this study can be found in the GPM (https://disc.gsfc.nasa.gov/datasets/GPM_3IMERGDF_06/summary?keywords=%22IMERG%20final%22) and the IUP (https://seaice.uni-bremen.de/start/data-archive/).
Author contributions
MC and YQ designed the study. MC wrote the text with support from YQ. MC, MY, and LH analyzed the precipitation data and sea ice concentration data. YL provided technical support. All of the authors contributed to improving the quality of the manuscript.
Funding
This study was funded by the National Key Research and Development Program of China (Grant No. 2019YFE0105700) and the Strategic Priority Research Program of the Chinese Academy of Sciences (Grant Nos XDA19070201 and XDA19070102).
Acknowledgments
The authors wish to thank the producers of the data for providing the satellite precipitation data and sea ice concentration data. The GPM-IMERG data were provided by the NASA/Goddard Space Flight Center’s science team, which develops and computes the IMERG Final Run as a contribution to the GPM mission. The IMERG Final Run is archived at the NASA GES DISC. Both AMSR2-ASI and AMSR2-Bootstrap SIC data were downloaded from the archive at the University of Bremen. We wish to acknowledge the Digital Belt and Road (DBAR) program working group on the High Mountain and Cold Regions (HiMAC), fruitful discussion under the project collaboration with the Nansen Environmental and Remote Sensing Center (NERSC), the EU-H2020 Integrated Arctic observation system (INTAROS) Project managed by Dr./Prof. Stein Sandven and Digital Arctic Shipping—New data products and visualisation services(DARC-SERV) managed by Dr. Torill Hamre.
Conflict of interest
The authors declare that the research was conducted in the absence of any commercial or financial relationships that could be construed as a potential conflict of interest.
Publisher’s note
All claims expressed in this article are solely those of the authors and do not necessarily represent those of their affiliated organizations, or those of the publisher, the editors and the reviewers. Any product that may be evaluated in this article, or claim that may be made by its manufacturer, is not guaranteed or endorsed by the publisher.
References
Aanes, R., Saether, B. E., Smith, F. M., Cooper, E. J., Wookey, P. A., Oritsland, N. A., et al. (2002). The Arctic Oscillation predicts effects of climate change in two trophic levels in a high-arctic ecosystem. Ecol. Lett. 5 (3), 445–453. doi:10.1046/j.1461-0248.2002.00340.x
Arthun, M., and Schrum, C. (2010). Ocean surface heat flux variability in the Barents Sea. J. Mar. Syst. 83 (1-2), 88–98. doi:10.1016/j.jmarsys.2010.07.003
Barry, R. G., and Serreze, M. C. (1998). “Atmospheric components of the Arctic Ocean freshwater balance and their interannual variability,” in Paper presented at the NATO Advanced Research Workshop on the Freshwater Budget of the Arctic Ocean (Tallinn, Estonia.
Behrangi, A., and Wen, Y. X. (2017). On the spatial and temporal sampling errors of remotely sensed precipitation products. Remote Sens. 9 (11), 1127. doi:10.3390/rs9111127
Bintanja, R., and Andry, O. (2017). Towards a rain-dominated Arctic. Nat. Clim. Chang., 7(4), 263-267. doi:10.1038/nclimate3240
Bintanja, R., Katsman, C. A., and Selten, F. M. (2018). Increased arctic precipitation slows down sea ice melt and surface warming. Oceanogr. Wash. D. C). 31 (2), 118–125. doi:10.5670/oceanog.2018.204
Bintanja, R., and Selten, F. M. (2014). Future increases in Arctic precipitation linked to local evaporation and sea-ice retreat. Nature, 509(7501), 479-482. doi:10.1038/nature13259
Boisvert, L., Grecu, M., and Shie, C. L. (2021). Investigating wintertime GPM-IMERG precipitation in the north atlantic. Geophys. Res. Lett. 48 (20), 12. doi:10.1029/2021gl095391
Boisvert, L. N., and Stroeve, J. C. (2015). The Arctic is becoming warmer and wetter as revealed by the Atmospheric Infrared Sounder. Geophys. Res. Lett. 42 (11), 4439–4446. doi:10.1002/2015gl063775
Boisvert, L. N., Webster, M. A., Petty, A. A., Markus, T., Bromwich, D. H., Cullather, R. I., et al. (2018). Intercomparison of precipitation estimates over the Arctic Ocean and its peripheral seas from reanalyses. J. Clim. 31 (20), 8441–8462. doi:10.1175/jcli-d-18-0125.1
Boisvert, L. N., Wu, D. L., and Shie, C. L. (2015). Increasing evaporation amounts seen in the Arctic between 2003 and 2013 from AIRS data. J. Geophys. Res. Atmos. 120 (14), 6865–6881. Retrieved from <Go to ISI>://WOS:000359804900009. doi:10.1002/2015jd023258
Bosilovich, M. G., Robertson, F. R., and Chen, J. Y. (2011). Global energy and water budgets in MERRA. J. Clim. 24 (22), 5721–5739. doi:10.1175/2011jcli4175.1
Chen, J., Kang, S., Chen, C., You, Q., Du, W., Xu, M., et al. (2020). Changes in sea ice and future accessibility along the Arctic Northeast Passage. Glob. Planet. Change 195, 103319. doi:10.1016/j.gloplacha.2020.103319
Comiso, J. C., Parkinson, C. L., Gersten, R., and Stock, L. (2008). Accelerated decline in the Arctic Sea ice cover. Geophys. Res. Lett. 35 (1), L01703. doi:10.1029/2007gl031972
Dou, T. F., Xiao, C. D., Liu, J. P., Han, W., Du, Z. H., Mahoney, A. R., et al. (2019). A key factor initiating surface ablation of Arctic sea ice: Earlier and increasing liquid precipitation. Cryosphere 13 (4), 1233–1246. doi:10.5194/tc-13-1233-2019
Dou, T. F., Xiao, C. D., Liu, J. P., Wang, Q., Pan, S. F., Su, J., et al. (2021). Trends and spatial variation in rain-on-snow events over the Arctic Ocean during the early melt season. Cryosphere 15 (2), 883–895. doi:10.5194/tc-15-883-2021
Eguiluz, V. M., Fernandez-Gracia, J., Irigoien, X., and Duarte, C. M. (2016). A quantitative assessment of Arctic shipping in 2010-2014. Sci. Rep. 6, 30682. doi:10.1038/srep30682
Francis, J. A., White, D. M., Cassano, J. J., Gutowski, W. J., Hinzman, L. D., Holland, M. M., et al. (2009). An arctic hydrologic system in transition: Feedbacks and impacts on terrestrial, marine, and human life. J. Geophys. Res. 114, G04019. doi:10.1029/2008jg000902
Freitas, E. D., Coelho, V. H. R., Xuan, Y. Q., Melo, D. D. D., Gadelha, A. N., Santos, E. A., et al. (2020). The performance of the IMERG satellite-based product in identifying sub-daily rainfall events and their properties. J. Hydrology 589, 125128. doi:10.1016/j.jhydrol.2020.125128
Gimeno-Sotelo, L., Nieto, R., Vazquez, M., and Gimeno, L. (2018). A new pattern of the moisture transport for precipitation related to the drastic decline in Arctic sea ice extent. Earth Syst. Dyn. 9 (2), 611–625. doi:10.5194/esd-9-611-2018
Gimeno-Sotelo, L., Nieto, R., Vazquez, M., and Gimeno, L. (2019). The role of moisture transport for precipitation in the inter-annual and inter-daily fluctuations of the Arctic sea ice extension. Earth Syst. Dyn. 10 (1), 121–133. doi:10.5194/esd-10-121-2019
Han, W., Xiao, C. D., Dou, T. F., and Ding, M. H. (2018). Changes in the proportion of precipitation occurring as rain in northern Canada during spring-summer from 1979-2015. Adv. Atmos. Sci. 35 (9), 1129–1136. doi:10.1007/s00376-018-7226-3
Hegyi, B. M., and Deng, Y. (2017). Dynamical and thermodynamical impacts of high- and low-frequency atmospheric eddies on the initial melt of Arctic sea ice. J. Clim. 30 (3), 865–883. doi:10.1175/jcli-d-15-0366.1
Higgins, M. E., and Cassano, J. J. (2009). Impacts of reduced sea ice on winter Arctic atmospheric circulation, precipitation, and temperature. J. Geophys. Res. 114, D16107. doi:10.1029/2009jd011884
Holland, M. M., Finnis, J., Barrett, A. P., and Serreze, M. C. (2007). Projected changes in arctic ocean freshwater budgets. J. Geophys. Res. 112 (G4), 13. doi:10.1029/2006jg000354
Huang, Y. Y., Dong, X. Q., Xi, B. K., and Deng, Y. (2019). A survey of the atmospheric physical processes key to the onset of Arctic sea ice melt in spring. Clim. Dyn. 52 (7-8), 4907–4922. doi:10.1007/s00382-018-4422-x
Kapsch, M. L., Graversen, R. G., and Tjernstrom, M. (2013). Springtime atmospheric energy transport and the control of Arctic summer sea-ice extent. Nat. Clim. Chang. 3 (8), 744–748. doi:10.1038/nclimate1884
Kattsov, V. M., Walsh, J. E., Chapman, W. L., Govorkova, V. A., Pavlova, T. V., Zhang, X. D., et al. (2007). Simulation and projection of arctic freshwater budget components by the IPCC AR4 global climate models. J. Hydrometeorol. 8 (3), 571–589. doi:10.1175/jhm575.1
Kerr, R. A. (2009). Arctic summer sea ice could vanish soon but not suddenly. Science 323, 1655. doi:10.1126/science.323.5922.1655
Kopec, B. G., Feng, X. H., Michel, F. A., and Posmentier, E. S. (2016). Influence of sea ice on Arctic precipitation. Proc. Natl. Acad. Sci. U. S. A. 113 (1), 46–51. doi:10.1073/pnas.1504633113
Kwok, R. (2018). Arctic sea ice thickness, volume, and multiyear ice coverage: Losses and coupled variability (1958–2018). Environ. Res. Lett. 13 (10), 105005. doi:10.1088/1748-9326/aae3ec
Lee, H. J., Kwon, M. O., Yeh, S. W., Kwon, Y. O., Park, W., Park, J. H., et al. (2017). Impact of poleward moisture transport from the north pacific on the acceleration of sea ice loss in the arctic since 2002. J. Clim. 30 (17), 6757–6769. doi:10.1175/jcli-d-16-0461.1
Maykut, G. A., and Untersteiner, N. (1971). Some results from A time-dependent thermodynamic model of sea ice. J. Geophys. Res., 76(6), 1550-1575. doi:10.1029/JC076i006p01550
Melia, N., Haines, K., and Hawkins, E. (2016). Sea ice decline and 21st century trans-Arctic shipping routes. Geophys. Res. Lett. 43 (18), 9720–9728. doi:10.1002/2016gl069315
Mortin, J., Svensson, G., Graversen, R. G., Kapsch, M. L., Stroeve, J. C., Boisvert, L. N., et al. (2016). Melt onset over Arctic sea ice controlled by atmospheric moisture transport. Geophys. Res. Lett. 43 (12), 6636–6642. doi:10.1002/2016gl069330
Pan, S. F., Dou, T. F., Lin, L., Yang, J., Zhang, F., Duan, M. K., et al. (2020). Larger sensitivity of arctic precipitation phase to aerosol than greenhouse gas forcing. Geophys. Res. Lett. 47 (23), 11. doi:10.1029/2020gl090452
Parkinson, C. L., and Cavalieri, D. J. (2012). Antarctic sea ice variability and trends, 1979–2010. Cryosphere 6 (4), 871–880. doi:10.5194/tc-6-871-2012
Pendergrass, A. G., Knutti, R., Lehner, F., Deser, C., and Sanderson, B. M. (2017). Precipitation variability increases in a warmer climate. Sci. Rep. 7, 17966. doi:10.1038/s41598-017-17966-y
Perovich, D. K., Grenfell, T. C., Light, B., Elder, B. C., Harbeck, J., Polashenski, C., et al. (2009). Transpolar observations of the morphological properties of Arctic sea ice. J. Geophys. Res. 114, C00A04. doi:10.1029/2008jc004892
Perovich, D. K., and Polashenski, C. (2012). Albedo evolution of seasonal Arctic sea ice. Geophys. Res. Lett. 39, 6. doi:10.1029/2012gl051432
Qiu, Y., Massimo, M., Li, X., Birendra, B., Joni, K., Narantuya, D., et al. (2017). Observing and understanding high mountain and cold regions using big Earth data. Bull. Chin. Acad. Sci. 32, 82–94.
Rawlins, M. A., Steele, M., Holland, M. M., Adam, J. C., Cherry, J. E., Francis, J. A., et al. (2010). Analysis of the arctic system for freshwater cycle intensification: Observations and expectations. J. Clim. 23 (21), 5715–5737. doi:10.1175/2010jcli3421.1
Sando, A. B., Gao, Y., and Langehaug, H. R. (2014). Poleward ocean heat transports, sea ice processes, and Arctic sea ice variability in NorESM1-M simulations. J. Geophys. Res. Oceans 119 (3), 2095–2108. doi:10.1002/2013jc009435
Schoyen, H., and Brathen, S. (2011). The northern sea route versus the suez canal: Cases from bulk shipping. J. Transp. Geogr. 19 (4), 977–983. doi:10.1016/j.jtrangeo.2011.03.003
Screen, J. A., Deser, C., Smith, D. M., Zhang, X., Blackport, R., Kushner, P. J., et al. (2018). Consistency and discrepancy in the atmospheric response to Arctic sea-ice loss across climate models. Nat. Geosci. 11 (3), 155–163. doi:10.1038/s41561-018-0059-y
Screen, J. A., Deser, C., and Sun, L. T. (2015). Projected changes in regional climate extremes arising from Arctic sea ice loss. Environ. Res. Lett. 10 (8), 084006. doi:10.1088/1748-9326/10/8/084006
Screen, J. A., and Simmonds, I. (2012). Declining summer snowfall in the arctic: Causes, impacts and feedbacks. Clim. Dyn. 38 (11-12), 2243–2256. doi:10.1007/s00382-011-1105-2
Serreze, M. C., and Barrett, A. P. (2008). The summer cyclone maximum over the central Arctic Ocean. J. Clim. 21 (5), 1048–1065. doi:10.1175/2007jcli1810.1
Serreze, M. C., and Francis, J. A. (2006). The arctic amplification debate. Clim. Change 76 (3-4), 241–264. doi:10.1007/s10584-005-9017-y
Serreze, M. C., and Meier, W. N. (2019). The arctic's Sea ice cover: Trends, variability, predictability, and comparisons to the antarctic. Ann. N. Y. Acad. Sci. 1436 (1), 36–53. doi:10.1111/nyas.13856
Simmonds, I., Burke, C., and Keay, K. (2008). Arctic climate change as manifest in cyclone behavior. J. Clim. 21 (22), 5777–5796. doi:10.1175/2008jcli2366.1
Singh, H. K. A., Bitz, C. M., Donohoe, A., and Rasch, P. J. (2017). A source-receptor perspective on the polar hydrologic cycle: Sources, seasonality, and arctic-antarctic parity in the hydrologic cycle response to CO2 doubling. J. Clim. 30 (24), 9999–10017. doi:10.1175/jcli-d-16-0917.1
Skofronick-Jackson, G., Kulie, M., Milani, L., Munchak, S. J., Wood, N. B., Levizzani, V., et al. (2019). Satellite estimation of falling snow: A global precipitation measurement (GPM) core observatory perspective. J. Appl. Meteorol. Climatol. 58 (7), 1429–1448. doi:10.1175/jamc-d-18-0124.1
Skofronick-Jackson, G., Petersen, W. A., Berg, W., Kidd, C., Stocker, E. F., Kirschbaum, D. B., et al. (2017). The global precipitation measurement (gpm) mission for science and society. Bull. Am. Meteorol. Soc. 98 (8), 1679–1695. doi:10.1175/bams-d-15-00306.1
IPCC Stocker, T. F., Qin, D., Plattner, G. K., and Midgley, P. M. (2013). The physical science basis. contribution of working group i to the fifth assessment report of the intergovernmental panel on climate change. Comput. Geom. doi:10.1016/S0925-7721(01)00003-7
Stroeve, J. C., Markus, T., Boisvert, L., Miller, J., and Barrett, A. (2014). Changes in Arctic melt season and implications for sea ice loss. Geophys. Res. Lett. 41 (4), 1216–1225. doi:10.1002/2013gl058951
Verny, J., and Grigentin, C. (2009). Container shipping on the northern sea route. Int. J. Prod. Econ. 122 (1), 107–117. doi:10.1016/j.ijpe.2009.03.018
Vihma, T. (2014). Effects of Arctic sea ice decline on weather and climate: A review. Surv. Geophys. 35 (5), 1175–1214. doi:10.1007/s10712-014-9284-0
Vihma, T., Screen, J., Tjernstrom, M., Newton, B., Zhang, X. D., Popova, V., et al. (2016). The atmospheric role in the arctic water cycle: A review on processes, past and future changes, and their impacts. J. Geophys. Res. Biogeosci. 121 (3), 586–620. doi:10.1002/2015jg003132
Webster, M., Gerland, S., Holland, M., Hunke, E., Kwok, R., Lecomte, O., et al. (2018). Snow in the changing sea-ice systems. Nat. Clim. Chang., 8(11), 946-953. doi:10.1038/s41558-018-0286-7
Xiong, W., Tang, G., Wang, T., Ma, Z., and Wan, W. (2022). Evaluation of IMERG and ERA5 precipitation-phase partitioning on the global scale. Water 14 (7), 1122. doi:10.3390/w14071122
Zeng, Q. C., Lu, T. Y., Lin, K. C., Yuen, K. F., and Li, K. X. (2020). The competitiveness of Arctic shipping over Suez Canal and China-Europe railway. Transp. Policy 86, 34–43. doi:10.1016/j.tranpol.2019.11.005
Keywords: Arctic, precipitation, sea ice, the Northeast Passage, characteristics analysis
Citation: Cheng M, Qiu Y, Yang M, Huang L, Chen J and Li Y (2022) An analysis of the characteristics of precipitation in the Northeast passage and its relationship with sea ice. Front. Environ. Sci. 10:890787. doi: 10.3389/fenvs.2022.890787
Received: 06 March 2022; Accepted: 04 July 2022;
Published: 22 July 2022.
Edited by:
Lejiang Yu, Polar Research Institute of China, ChinaReviewed by:
Haibo Bi, Institute of Oceanology (CAS), ChinaXi Liang, National Marine Environmental Forecasting Center, China
Copyright © 2022 Cheng, Qiu, Yang, Huang, Chen and Li. This is an open-access article distributed under the terms of the Creative Commons Attribution License (CC BY). The use, distribution or reproduction in other forums is permitted, provided the original author(s) and the copyright owner(s) are credited and that the original publication in this journal is cited, in accordance with accepted academic practice. No use, distribution or reproduction is permitted which does not comply with these terms.
*Correspondence: Yubao Qiu, cWl1eWJAYWlyY2FzLmFjLmNu
 Maoce Cheng
 Yubao Qiu
 Meng Yang
 Lin Huang
 Jianguo Chen
 Yang Li