 Ruirui Liu
 Huafu Zhao
 Chun Yang
 Hongyi Yang
94% of researchers rate our articles as excellent or good
Learn more about the work of our research integrity team to safeguard the quality of each article we publish.
Find out more
ORIGINAL RESEARCH article
Front. Environ. Sci. , 05 May 2022
Sec. Land Use Dynamics
Volume 10 - 2022 | https://doi.org/10.3389/fenvs.2022.890571
This article is part of the Research Topic Towards Greener Urbanization: Resource Environmental Effects and Sustainable Land Use View all 16 articles
Urban renewal has increasingly become a hot topic in international urban sustainable development management, and many countries have also carried out a lot of practice. However, there is still a lack of fast and effective methods for how quickly identifying the spatial characteristics of urban renewal to dynamically grasp the renewal effect. The purpose of this study is to identify the renewal characteristics of urban industrial land based on the POI (Points of Interest) data and RS data of the Internet map, and to provide an innovative method for better understanding the renewal effect of urban industrial land and its spatiotemporal evolution characteristics. The results show that: 1) Since the decentralization of non-capital functions in Beijing, industrial development has spread from a high degree of agglomeration to the whole area. The number of high-density areas has decreased from nine to five, and the number of medium-density areas has increased significantly.2) Land-use types in the six districts of Beijing have changed, warehousing and logistics land and industrial land have been reduced greatly, and the number and area of park green space have greatly increased.3) The level of matching between RS image interpretation and POI data is uneven. RS interpretation is accurate for large-scale feature recognition, and POI data are sensitive to small-scale industries. In conclusion, In the process of identifying the renewal feature of urban industrial land, POI and RS data can respectively obtain certain results. The integration of POI and RS can better identify the temporal and spatial changes of the industry.
Throughout the development process of domestic and foreign metropolises, most developed cities have experienced the “big city disease”. The centrality of large cities occupies a dominant position, and radiation drives the flow of people, logistics, capital, and information in the region to form an obvious polarization effect. This condition presents the problems of a large population, overconcentration of industries, traffic congestion, and environmental pollution (Ewing et al., 2002). To alleviate the pressure on the city center and promote the coordinated development of the city, domestic and foreign scholars have investigated related issues such as decentralization of capital functions (June 2007; Kuang et al., 2018; Tian et al., 2019), polycentric development (Champion, 2001; Lan et al., 2019; Sporna and Krzysztofik, 2020), urban renewal (Hyra, 2012; Swensen, 2012; Krabben and Jacobs, 2013), industrial upgrading (Azadegan and Wagner, 2011; Pan and Song, 2017; Tian et al., 2019), old city reconstruction (Tolle, 2010; Wu, 2016), and brownfield development (Thomas, 2002; Frantal et al., 2015; Green, 2018). The urban renewal strategies of the United States (Clark et al., 2009; Hyra, 2012), Spain (Muiz and Garcí, 2017), Germany (Lang, 2012; Ahlfeldt et al., 2017), France (Duvernoy et al., 2018), Brazil (Costa and Lee, 2019), Britain (Longo and Campbell, 2017), Japan (Martinez-Fernandez et al., 2012), and other countries also have important reference significance for other countries.
As a part of urban renewal theory, industrial land renewal has been discussed in many Western academic circles. In many countries, industrial land is mainly provided by the public sector, not only in countries with public ownership of lands such as China, but also in some countries with private ownership of land such as the Netherlands, France, and Germany. As governments want to ensure an adequate supply of industrial land for employment opportunities and taxation of industrial development, some countries are even considering open leasing of industrial land rather than selling it as a way to solve the problem of industrial land development (Erwin and Buitelaar, 2011; Needham et al., 2013). For example, Canary Wharf in London has been transformed from a decaying port industry site to a world-renowned central business district through a public-private partnership (Zhou and Zhou, 2013). As one of the largest manufacturing countries in the world, China also has a very high proportion of industrial land. With the trend of economic transformation and industrial upgrading, a large amount of industrial land in China needs to be updated. Taking typical urban fringe areas such as Panyu District in Guangzhou as an example (Wang et al., 2018), the practice of industrial land redevelopment created by the three renewal policies is shown. In addition, based on the relevant data of all industrial land urban redevelopment projects from 2010 to 2018, some scholars use a spatial perspective to investigate the transformation of industrial land in Shenzhen (Lai et al., 2020). Based on qualitative research, questionnaire surveys and in-depth interviews, taking Shenyang Tiexi Workers Village as a case study (Dong et al., 2020), the characteristics and driving forces of community renewal in old industrial shantytowns were analyzed.
China is in a period of rapid urbanization. Cities in China have exploded in size, population, and impact during the last three decades (Schneider et al., 2015). This rapid expansion has caused frequent problems such as traffic congestion, environmental pollution, and urban development imbalance (Huang et al., 2016). Some related studies have shown that there is a positive correlation between the urbanization efficiency and agglomeration level of megalopolis (Jin et al., 2018). As the capital of China, Beijing has greatly increased its urbanization level and low-end industries. The population is rapidly agglomerated, and the scale of the city continues to expand, which has led to the occurrence of a series of urban diseases. Under realistic conditions that the intensity of land development and utilization has approached the resource ceiling, the decentralization of Beijing’s non-capital functions is the inevitable way to improve the quality of the capital’s development at this stage. Beijing’s non-capital function decentralization work started in 2014, in which industrial decentralization is the physical content and key support (Li et al., 2019). Beijing has gathered an excessive number of non-capital functions, such as housing manufacturing, regional logistics bases, and wholesale markets (Rao et al., 2015), which are the deep-seated causes of “big city disease”. Gao, Liu, and Dunford discussed that Beijing’s industries have gradually decentralized moving from the center, and the process of industrial decentralization involved not only relations between the government and firms but also between different levels of government (Gao et al., 2014). Escalona-Orcao analyzes the process of industrial relocation in Spain and introduces the impact of urban system structure and urban development policies on industrial decentralization (Escalona-Orcao and Climent-Lopez, 2012). Li identifies the decentralization industry category and potential decentralization undertaking place from the three dimensions of policy, economy, and resources and environment. He pointed out that a decentralization strategy is a promising approach for promoting regional sustainable development (Li et al., 2019). Although differences exist between domestic and foreign systems, the urban remediation experience of foreign developed countries can be a reference for China’s non-capital function decentralization strategy. Beijing’s decentralization path can also guide other areas facing big-city diseases.
The continuous emergence and development of Internet data and artificial intelligence methods have provided effective data and methods for the evacuation of urban industries and extraction of construction land, which has greatly helped identify the industrial reforms in Beijing. Satellite remote sensing and GIS technology have been increasingly used in examining land use and land cover change, especially change-related urban growth (Wu et al., 2006; Sarvestani et al., 2011). Using remote sensing technology to extract the scale of urban construction land is a more objective technical method to accurately grasp the current situation of urban construction, understand the direction of urban development, evaluate the implementation of urban planning, and guide urban development and construction. Many scholars have studied the expansion and extraction of urban built-up areas by employing remote sensing. Most of them use methods such as supervised classification, unsupervised classification, and cluster analysis. The imagery data used are mainly concentrated in traditional remote sensing, high-resolution remote sensing, and luminous remote sensing imagery data. (Masek et al., 2010), (Ma and Xu, 2010), (Zhang et al., 2018), (Al-Bilbisi, 2019), Shen and others used traditional remote-sensing data to qualitatively and quantitatively analyze the changing characteristics of urban expansion (Shen et al., 2020). (Sawaya et al., 2003), (Gray et al., 2018), (Li et al., 2016), (Huang et al., 2018), (Zeng et al., 2015), and others used high-resolution remote-sensing images to extract multiple types of urban construction land. Most studies rely on satellite imagery to analyze urban expansion on a large scale. The current automatic interpretation technology of remote sensing still encounters many problems in extracting the refined status of the construction land in the city. Due to their labor-intensive and costly nature in some cases, remote-sensing images cannot be easily applied to study urban expansion for all the cities in a timely manner (Liu et al., 2010). In addition, remote sensing analysis emphasizes the physical perspective of urban development without considering other dimensions (Long et al., 2018). Therefore, we need to find a method to make up for the limitations of these images on the basic of remote sensing analysis. With the rise of Internet big data, relevant scholars have conducted a series of studies and applications of urban development through POI, promoting the development and application of GIS, computers, and other fields. POI data have been widely used in studying of urban spatial structure, the spatial distribution of commercial facilities, the improvement of land use classification, division of urban functional areas, and the optimization of public services. Jiang demonstrated a complete process, including the collection, unification, classification, and verification of online points of interest (POI), and develop methods to utilize such POI data to estimate disaggregated land use (Jiang et al., 2015). Sparks, Thakur, and Pasarka used POI data combined with hierarchical clustering of temporal characteristics to establish geosocial temporal patterns for the business hours of retailers and restaurants in more than 100 cities in 90 countries around the world (Sparks et al., 2020). Xia et al. (2020) used POI data, night-time light data, and small catering business data to analyze the spatial relationship between urban land-use intensity and urban vitality. Xue et al. (2020) used the location information of manufacturing units and automobile sales outlets extracted from POI to perform spatial statistical analysis and analyze the spatial relationship between the two industries as spatial complementary integration, weak spatial correlation, and coordination with scale dependence and spatial heterogeneity.
The two kinds of data have been applied in the extraction of urban construction land and analysis of industrial changes. Related studies also combine remote sensing interpretation with POI data. Hu et al. (2016) developed a protocol that uses open street maps, POIs, and remote sensing images to identify large-scale urban land use functions, which showed an overall high accuracy of the land use maps generated. Liu et al. (2017) focused on urban land use classification with features extracted from high-resolution remote sensing images and social media data; they integrated probabilistic topic models and support vector machines to identify dominant urban land use types at the level of the traffic analysis zone. Song et al. (2019) integrated POI with social attributes and ultra-high-resolution remote sensing images with natural attributes to monitor the finer-scale population density in urban functional zones. Shi et al. (2020) combined nighttime light data, digital elevation model (DEM), normalized differential vegetation index (NDVI), and POI data to develop a comprehensive poverty index (CPI), thereby accurately and effectively identifying poverty-stricken areas to determine the spatial distribution of poverty. The traditional remote sensing interpretation to obtain LUCC changes can only capture some information on land use, especially land cover changes, but for urban industrial land, especially the functional update information of industrial land characterized by “vacating the air for birds”, it cannot be used effective extraction. Other researches based on poi put more emphasis on the spatial characteristics of various industries, which cannot be accurately matched to the actual space, and it is difficult to reflect the spatial scope and area of urban renewal. This research innovatively matches the two together effectively, and provides a new solution for more accurately revealing the functional transformation of LUCC and industrial land brought about by urban renewal. Studies on the spatial relationship and comparative analysis of the two types of data are also limited. Given the achievements and the direction of Beijing’s non-capital function decentralization, this study combines remote sensing information extraction technology with GIS spatial analysis technology by using POI data and high-resolution remote sensing images to conduct the fine extraction of urban construction land and description of industrial reform, to analyze the temporal and spatial changes of industrial decentralization and evacuation. The research idea is shown in Figure 1.
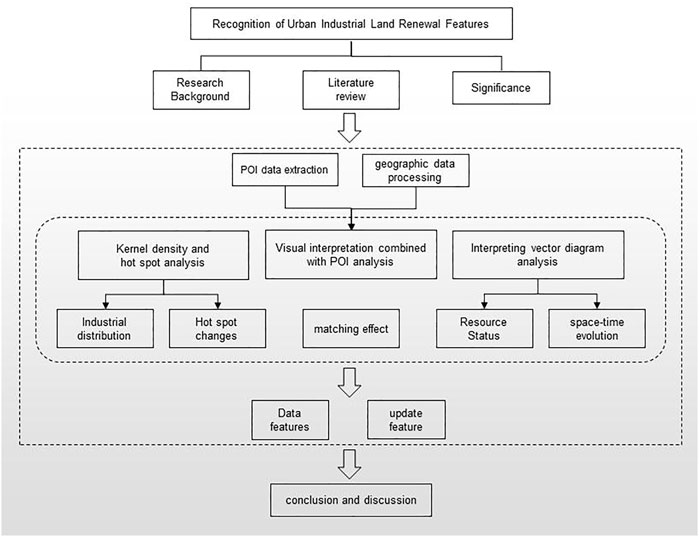
FIGURE 1. Technology roadmap.
Six districts of Beijing are selected as the study area, namely, Dongcheng, Xicheng, Haidian, Chaoyang, Fengtai, and Shijingshan. The concept of “City Six Districts” was formed after the fifth administrative division of Beijing in 2010. These districts have a total area of 1,381 sq. km., accounting for 8% of the total area of Beijing. As of 2019, their population was 12.828 million, and they accounted for 60% of the population, 70% of industries, 70% of grade 3A hospitals, and 70% of colleges and universities. The six districts of Beijing are shown in Figure 2. The six districts are not only the main bearing areas of the core functional areas of the capital, but are also important in the construction of an international first-class harmonious livable capital and are key areas for decentralizing non-capital functions. Evaluating this area is necessary to improve the service guarantee capacity of the six districts and decentralize their non-capital functions. This study selects the six districts as the analysis object and analyzes the changes in land types and industries through two phases of remote sensing images and POI data in 2013 and 2019.
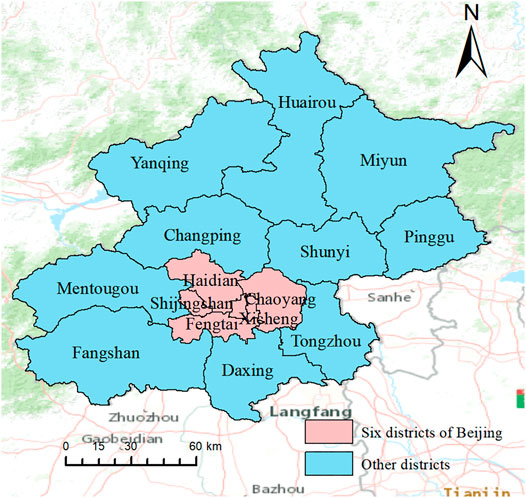
FIGURE 2. Study areas.
POI mainly refers to geographical entities that are closely related to people’s lives, such as educational institutions, financial service facilities, supermarkets, and others. In this study, the POI data are obtained by programming based on the electronic navigation data of Beijing produced by AutoNavi in July 2013 and September 2019. Combining the “Classification of Land Use Status in the Third National Land Survey” and “Urban Land Classification and Planning and Construction Land Standards” comprehensively integrate the types of non-capital functional decentralization in Beijing. In this study, nine types of POI data are extracted from industry, wholesale market, warehousing and logistics, education, medical and health, government agencies, park green space, cultural facilities, and transportation facilities as the research object. The initial data in the six districts of Beijing in 2013 and 2019 were 426,044 and 588,523, respectively. The data were cleaned by spatial matching and deduplication. After selecting according to the nine categories we needed, we collected 74,180 and 76,594 data points. Details are shown in Table 1.
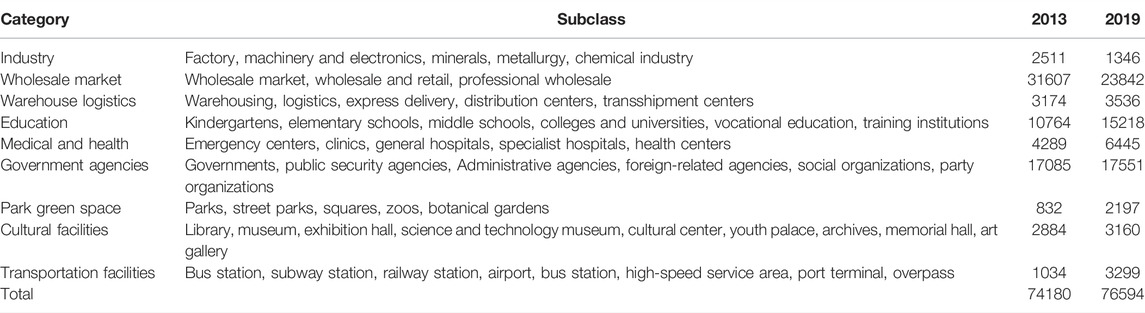
TABLE 1. POI data collection in 2013 and 2019.
Basic geographical data includes map data such as the boundaries of Beijing’s administrative divisions, and satellite images of the six districts. The data used is based on Google Earth imagery without satellite orbit information, and the imagery data were mainly obtained from the QuickBird satellite of DigitalGlobe and EarthSat in the United States. The spatial resolution of global geomorphic images can reach up to 0.5 m. The Google Earth imagery has a spatial resolution of 1.88 m, which includes the six districts of Beijing. Analysis and correction of multiple sampling points in the image were conducted to meet the requirements for the identification of various types of land. This study is based on “Urban Land Classification and Planning and Construction Land use Standard” combined with the “Beijing New Industry Prohibition and Restriction Catalog (2018 Edition)”. In response to research on Beijing’s non-capital function decentralization, the land division standards of the six districts of Beijing are determined according to the actual demand. These are divided into eight categories: residential, administration and public services, commercial and business facilities, industrial, road, street and transportation, green space and square, logistics and warehouse, and other land types. Using the ArcMap10.2 software platform, we compare the image features of the remote sensing imagery with Google Maps and AutoNavi Maps to determine the interpretation signs as shown in Table 2. Compared with the interpretation marks, the basic features of the satellite imageries were visually interpreted, and the vector map data of the six districts of Beijing in 2013 and 2019 were obtained.
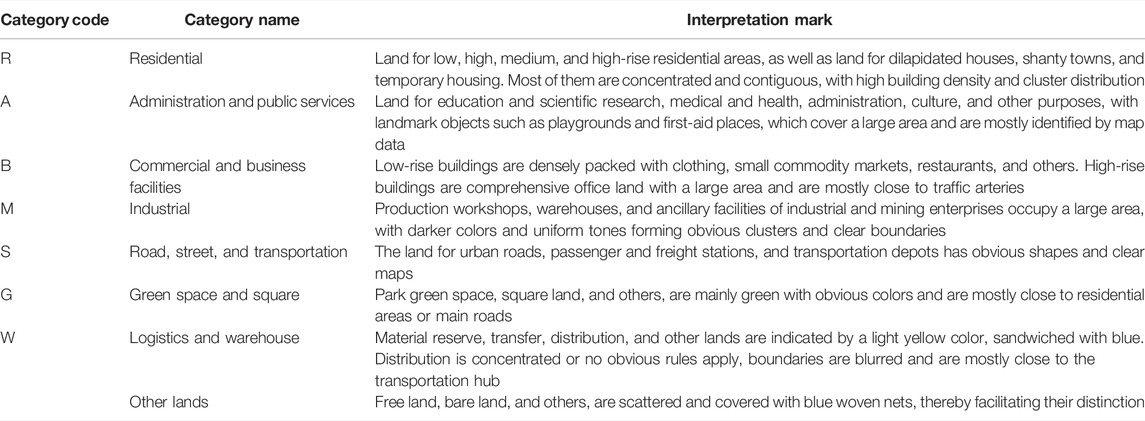
TABLE 2. Interpretation marks of different types of land under remote sensing imagery.
This study mainly uses spatial analysis method to analyze the distribution of POI data and interpretation of remote sensing images. Kernel density estimation (KDE) is performed to measure the spatial distribution density of nine industries in the six districts, and grid density method is used to analyze the hot spots. Based on the interpretation of the land class, the area of land class change is identified by using the ArcMap platform, SQL language, and Python code. The POI data are spatially connected with the interpreted vector graph and the data are counted.
KDE is used to calculate the density of elements in their surrounding fields. The density is largest at the center position and attenuates with distance, and the density is zero at the limit distance. KDE is used to express the distribution data of various network points in a continuous graph, and study the overall spatial distribution characteristics of various network points in service facilities. The expression is as follows:
where
Judging from the 2013 and 2019 data, the nine types of facilities used in the study have obviously increased or decreased, but their total number is not much different. We import the collected POI data into the GIS, use the WGS1984UTM projection, and merge the various POI data. The selected nine types of data are almost all over the districts of Beijing, in Dongcheng, Xicheng, southeast of Haidian, southwest of Chaoyang, northeast of Fengtai, and the east of Shijingshan show obvious agglomeration patterns. To effectively identify the spatial distribution structure of the six urban districts, KDE shows the distribution of POI data intuitively. The natural breakpoint method is used to reclassify the results of KDE. We selected four search radii of 500, 1,000, 1,500, and 2,000 m for display. After comparison, we found that the search radius of 1000 m can better identify spatial morphological changes. The results are presented in Figure 3.
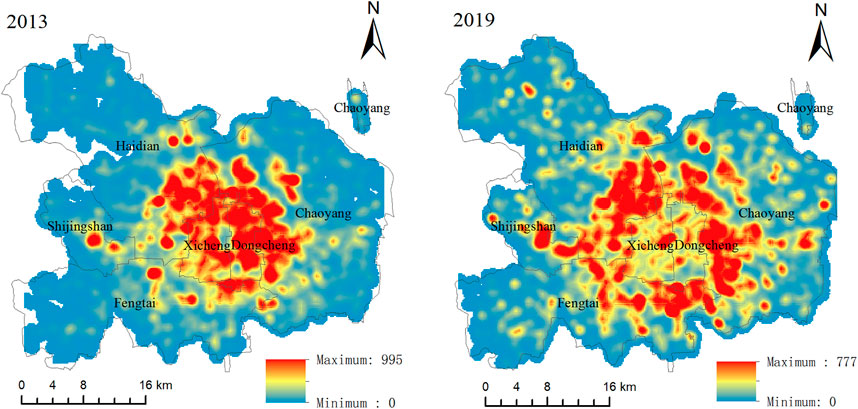
FIGURE 3. POI kernel density plots of 2013 and 2019.
As shown in Figure 3, the six districts of Beijing are in a state of agglomeration. Comparing the changes in kernel density in 2013 and 2019, we can observe that in 2013, the industries of the six districts were concentrated in Dongcheng and Xicheng, supplemented by the western part of Chaoyang and the southeast of Haidian, forming a central clustering state. In 2019, the agglomeration of industries in the six districts expanded to the surrounding area, and high-density agglomeration points showed a discrete state. Multiple small agglomeration points are formed throughout the six districts, and medium-density agglomeration points have increased significantly. Overall, after a series of decentralization and retreat policies, industries in the central urban area have been evacuated significantly. The kernel density across the six districts is more balanced and the industrial distribution is more extensive.
To show the distribution of POI data clearly and quantitatively, we evenly divided the entire area of the six districts into 500 m × 500 m fishing nets, and a total of 5,807 fishing nets were obtained. The overlap area is obtained by intersecting overlay analysis of POI data and fishing nets. The geometric interval method is used to reclassify by quantity, and a dBase (dbf) table is exported for statistical analysis. The results can be obtained as shown in Figure 4 and Figure 5.
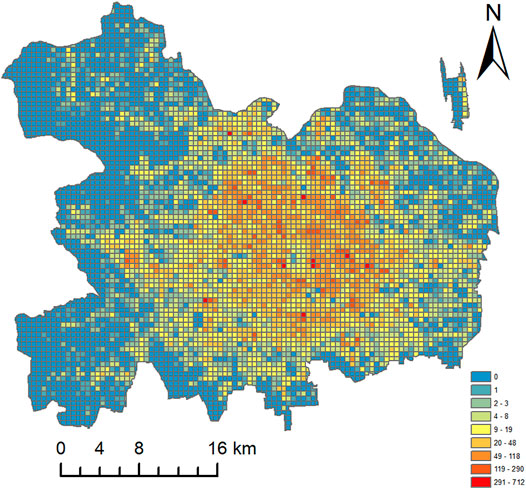
FIGURE 4. POI content in fishing nets in 2013.
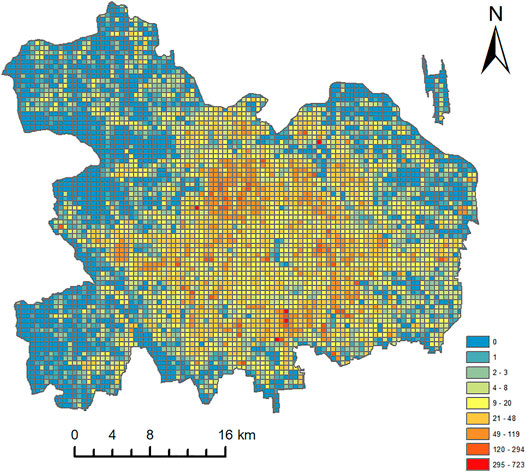
FIGURE 5. POI content in fishing nets in 2019.
The highest number of fishing nets contains 723 points, and the least contains no points. According to the statistical analysis of the frequency of point distribution in GIS, the average value in 2013 is 12.59, the standard deviation is 30.37, the average value in 2019 is 13.18, and the standard deviation is 27.10. These results show that the distribution of point data in 2019 was closer to the average value and less affected by the extreme value. We define different density areas according to the number of points contained in each fishing net, where 0–3 points are defined as low-density areas, 4–20 points are defined as medium-low density areas, and 21–119 points are defined as medium-density areas, 120–294 points are defined as medium-high density areas, and 295–723 points are defined as high-density areas. According to this standard, the number of fishing nets and number of POI points occupied in each density area in 2013 and 2019 were counted. The results shown in Table 3 were obtained.
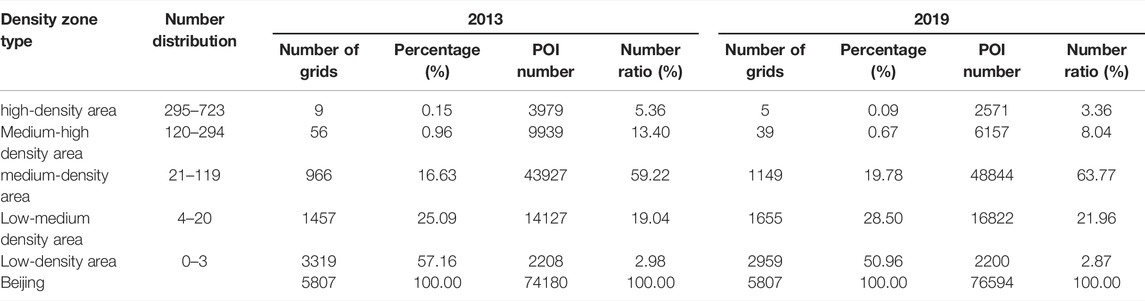
TABLE 3. Statistics of number of fishing nets and POI points in each density area.
According to Table 3, the number of fishing nets in high-density, medium-high-density, and low-density areas in 2013 was higher than that in 2019, while the number of fishing nets in medium-density and medium-low-density areas increased significantly in 2019. These results show that after decentralization, the extremely high-density or extremely low-density areas have decreased. The industry in the high-density area has been greatly improved through decentralization. Low-density areas have obtained development opportunities through industrial transfer. The number of medium-density districts most suitable for urban development has greatly increased. Urban development has spread from dot and cluster agglomerations to the periphery, and the phenomenon of industrial agglomeration has been improved.
Through location selection, we compared the corresponding geographical locations of fishing nets in high-density areas in 2013 and 2019. The nine high-density districts in 2013 correspond to Guanyuan Wholesale Market, Yuegezhuang Wholesale Market, Peking University, Renmin University of China, Peking University People’s Hospital, Xinglong Lighting Wholesale Market, Beijing Book Wholesale trading Market, Tsinghua University, and Beijing Foreign Studies University. The five high-density fishing nets in 2019 correspond to the geographical locations of Peking University, Renmin University of China, Beihang University, Haidian District People’s Hospital, and Peking Union Medical College Hospital. The four areas of Guanyuan Wholesale Market, Yuegezhuang Wholesale Market, Xinglong Lighting Wholesale Market, and Beijing Book Wholesale Trading Market no longer exhibit high-density agglomeration. This condition corresponds to the retreat of some tertiary industries such as regional logistics bases and regional professional markets in the decentralization strategy, which has significantly improved the phenomenon of industrial agglomeration in these regions.
According to the interpretation marks and methods introduced, this study visually interprets the 2013 and 2019 images of six districts in Beijing. The results are shown in Figure 6.
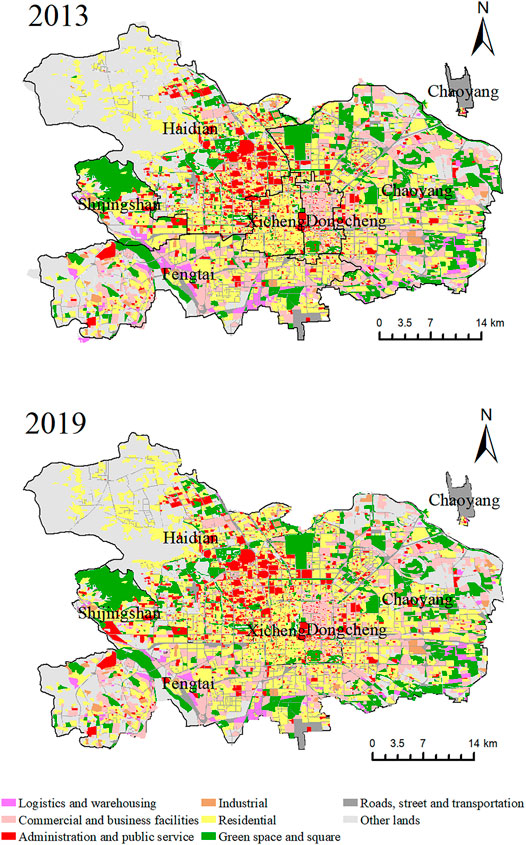
FIGURE 6. Interpretation vector diagram of eight types of land in six districts of Beijing in 2013 and 2019.
According to the vectorization results of the two phases of remote sensing images, small-scale land-use changes can be observed in the six districts. The reason is that the six districts have undergone mature development, and large-scale changes in land types cannot occur within a few years. However, according to Beijing’s strategic model of decentralizing and promoting development, there will be accompanied by renewal models such as industrial evacuation, demolition and new construction, and renovation and improvement. This condition will bring about small-scale or group-type land changes. We can observe from the data of the two periods that 10,673 visually interpreted plaques existed in 2013 and 10,518 in 2019. From the two issues of data, 10,673 plaques were visually interpreted in 2013 and 10,518 in 2019.
To test the accuracy of patch division results, a random point selection method is used to select points in GIS. Thus, 106 and 105 plaques were randomly selected from 2013 to 2019, respectively, and each plaque was assigned a number. The detailed spatial distribution is shown in Figure 7 (which takes 2019 as an example). Due to the impact of the COVID-19 epidemic, on-site calibration is dangerous and difficult, and the real scene function on the Baidu map can achieve a good 3D display. Therefore, this study uses the Baidu map to conduct inverse point query and real-time comparison and combines the field data in the process of previous research to test the accuracy of the results. The results show that 89 parcels are of the same type in 2013, and the accuracy of the division result is 84.0%. In 2019, 94 parcels had the same type, and the accuracy of the division result was 89.5%. The accuracy test result was good. Figure 4 shows some cases of the inspection area. No. 66 is Beijing 47 Middle School, and the patch type is administration and public services. No. 100 is a building materials company in Fengtai district, and the patch type is industrial land. No. 89 is Guta Park, and the patch type is green space and square.
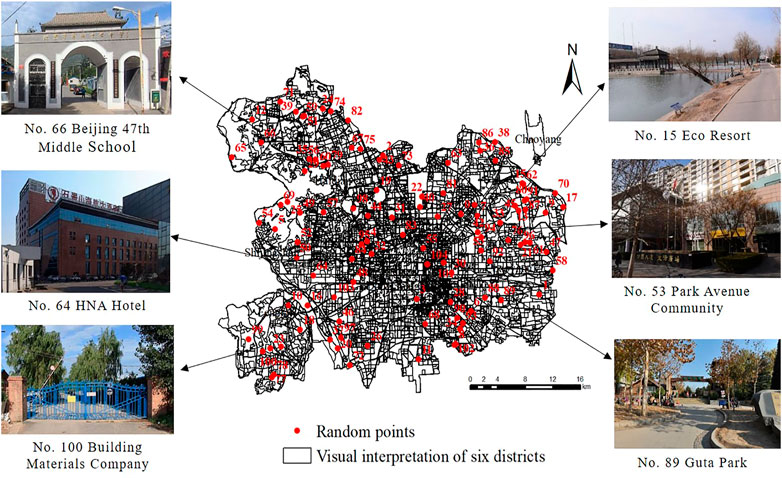
FIGURE 7. Accuracy detection of interpretation results and presentation of some cases.
To appropriately show the relationship between industrial and land type changes in the six districts, we gather statistics on the area and the quantity of all types of land patches. As most of the commercial service facilities are within the buildings, the land types can be easily confused with other types of land use, so we put commercial and business facilities aside for area and quantity statistics in this study. Finally, we selected seven types of land for residential, administration and public services, industrial, road, street and transportation, green space and square, logistics and warehouse, and other lands for statistical analysis. The results are presented in Table 4.
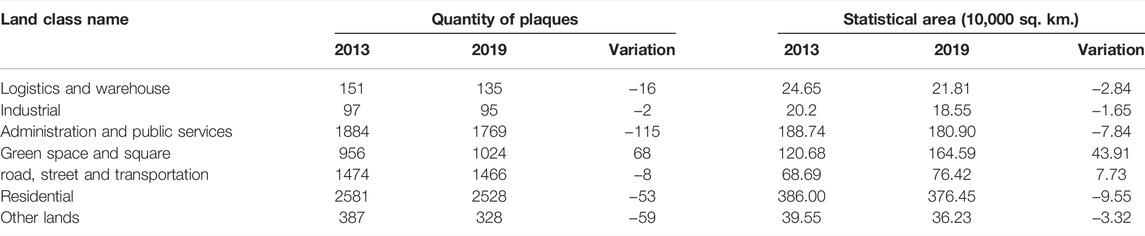
TABLE 4. Statistics of patch quantity and area of seven types of land.
As shown from the statistical results, the patches of warehousing and logistics land have decreased by 16, and the area has been reduced by 28,400 sq. km. The quantity and area of patches on both industrial and public land have decreased. The area of green space and square and transportation facilities has been increased. The quantity and area of patches of residential land and other lands changed minimally. This result shows that since Beijing’s decentralization strategy, the general manufacturing industry, especially the high-consumption industries (such as industrial land in this study), regional logistics bases, regional professional markets and other tertiary industries (such as logistics storage land in this study), and some social and public service institutions such as education, medical and training institutions (such as public land in this study) have been improved. Their distribution has become scattered and their area has been reduced. The number and area of patches of park green space have increased significantly, and they are more widely distributed and larger in area. However, the change of residential and other land types is not obvious in a mature city such as Beijing.
From the preceding analysis, we can observe that both the POI data and visual interpretation results can show the progress of decentralization work in the six districts of Beijing and the changes in the region. To better analyze the point-to-surface multi-dimensionality and ensure the authenticity and availability of the two types of data, this study overlays the POI data on the vector map to determine the relationship between various POI data and land types. Among them, the POI type is “wholesale market,” and “warehousing logistics” is equivalent to the “logistics and warehouse” land type. “Education,” “medical institutions,” “cultural facilities,” and “agency groups” are equivalent to “administration and public services” in land type. Thus, five types remain. In this paper, various POI data and interpretation vector diagrams are spatially connected, with point data as the target element, interpretation vector diagram as the connection element, and “intersect” as the matching option. The results are shown in Figure 8; Figure 9.
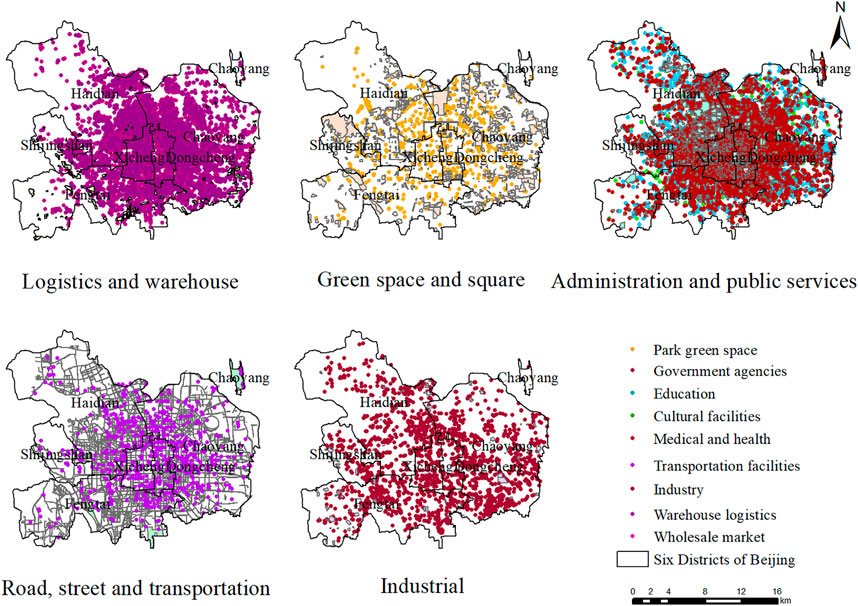
FIGURE 8. Combination of various types of POI and land type interpretation maps in 2013.
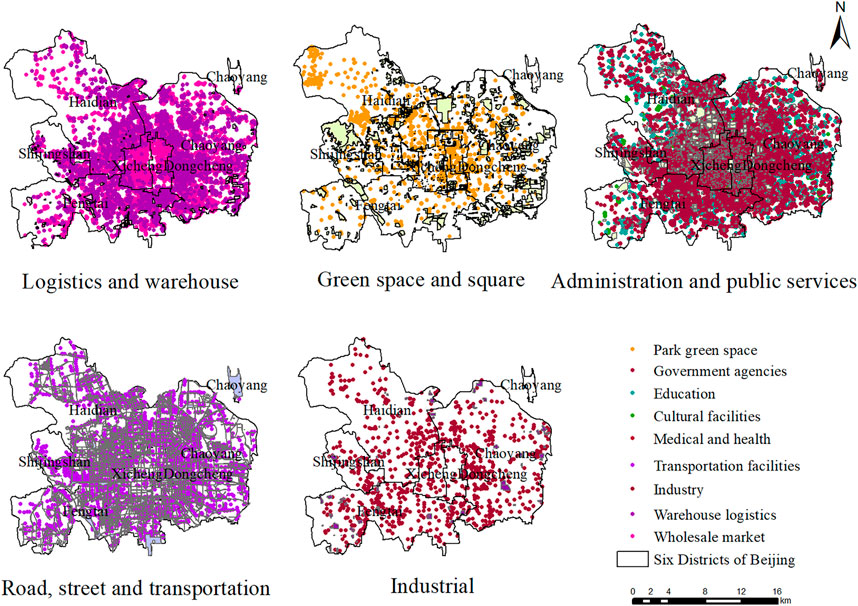
FIGURE 9. Combination of various types of POI and land type interpretation maps in 2019.
We open the attribute table after the spatial connection, and use SQL language to judge the POI and land types. According to the corresponding method, the similar parts of the POI type and land type are called “same” fields, and the different parts are called “different” fields. After selecting all kinds of POI data according to attributes, we count the number of “same” and “different” fields. The results are shown in Table 5.

TABLE 5. Comparison between POI data and interpreted land types.
As shown in Table 5, the matching effect between POI type and land type of warehousing and logistics land is poor at approximately 30%. The two types of data on park green space are well-matched, with the same amount accounting for approximately 70%. The matching effect of the two types of data between public management and public service facilities land is poor at approximately 35%. The matching effect of the two types of data for transportation facilities is high at approximately 80%, and the matching degree of industrial land is in an intermediate state. The reason is that the POI data in warehousing and logistics include not only large wholesale warehouses but also many small express points and post offices, most of which are located in residential and public land types, which are not easy to extract in the land interpretation process. By the same token, a large number of points are found in public management and public service facilities, including not only large hospitals, schools, and libraries but also many training institutions, clinics, and organizations. These structures occupy a small area and are easy to confuse with the image. The park green space is clear in the remote sensing image, which facilitates the land type interpretation and has a high accuracy rate. However, when POI is used to identify park green space, a certain area of this space often has only one or a few POIs to indicate that the area and scale cannot be effectively displayed. The accuracy of transportation facilities’ land in visual interpretation is also relatively high, but when expressed by POI, it often only shows the bus stop, subway station, and other parts, ignoring the content of the road section.
Another important factor that can explain the poor matching effect is that, since the decentralization policy, the decentralized area has been transformed from the original traditional manufacturing enterprise into a high-end industrial park. The nature of the original land has not changed but brought about an industry upgrade, which leads to no change in the land type but a change in the industry. For example, the BBMG Intelligent Manufacturing Factory is located in the Haidian district, and its predecessor was BBMG Tiantan Furniture Factory. After decentralization, the existing industrial plants were revitalized and upgraded, but their land properties and factory property rights did not change. However, the location has been built into an innovative science and technology industrial park with intelligent manufacturing as the core industry, thereby achieving an organic combination of transforming and upgrading the traditional manufacturing industry and replacing the industrial space.
This study uses POI data to analyze the distribution and changes of industries in Beijing. The current resource status and spatial and temporal evolution characteristics can be seen by using remote sensing image interpretation, and the combination of visual interpretation and POI can show the matching effect and the difference between the two data, so that we can deepen our understanding and application of the two data. In addition, this study also shows that the current status of the evacuation of Beijing has obvious changes in terms of industries and land types. These changes show the effectiveness of the evacuation, but at a deeper level, we also realize that the promotion work after the evacuation is not yet in place, and how to strengthen the reuse and optimization of the vacated space is the focus of future research.
Most studies in the past took remote sensing images mostly to study large scale land use changes or qualitative descriptions. In this paper, we use easily accessible remote sensing images and visual interpretation methods to quantitatively describe land use types on a qualitative basis, which has a more intuitive display of the quantity and area changes of various types of land, and is more convenient for land use and management. In addition, the random point selection function is used in GIS to determine the coordinates of the changing area, and the actual geographic attributes of the parcel are corresponded to by the method of coordinate inverse selection, and the changing area can correspond to the actual point location after the location selection is made, and the geographic location can be accurately identified. In the process of checking the accuracy of remote sensing image interpretation, due to the impact of the COVID-19 epidemic, it is not easy for us to conduct field research, and the real-world function of Baidu Map can achieve a good three-dimensional display, which brings us great convenience. As the current level of modern technology continues to develop, more and more data and resources can be accessed and used. In the face of the high cost of data unavailability, inconvenient field research due to unforeseen circumstances, and other uncontrollable reasons, the adoption of these open resources can bring greater benefits to our research. In future scientific research and social development, good use of Internet technology will increasingly become a skill. The method applied in this study can not only identify the spatial and temporal changes of urban industrial land, but also provide a great help for the fine-grained extraction of urban construction land. In addition, it also provides ideas for the rational layout of various public service facilities in cities.
In addition, visual interpretation is mainly used for vectorization in this study, which is subject to a certain degree of subjectivity and may cause data distortion. This study takes the evacuation of Beijing as the background, and only considers the land types and industries related to this, but does not explore and study other industries, these shortcomings will be further improved in future studies.
Urban renewal has increasingly become a hot topic in international urban sustainable development management, and many countries have also carried out a lot of practice. China has implemented a large number of urban renewal projects, but there is still a lack of fast and effective methods for how quickly identifying the spatial characteristics of urban renewal to dynamically grasp the renewal effect. This study effectively combines remote sensing imagery, GIS technology, and Internet POI data to closely delineate the land and industrial uses in the six districts of Beijing. This condition realizes the refined extraction of various urban land types and clarifies the temporal and spatial changes of industrial development. Based on the remote sensing image data and POI data in 2013 and 2019, the research carried out refined extraction of construction land in the six urban districts of Beijing and research on industrial temporal and spatial changes, and compared and analyzed the results generated by the two data. The results show:
(1) Since Beijing carried out the decentralization of non-capital functions, industrial development has spread from a highly concentrated state to the whole area, with the number of high-density areas decreasing from nine to five and the number of medium-density areas increased significantly. 2013 industries in Beijing’s six urban districts were concentrated in the east and west urban areas, supplemented by the western part of Chaoyang District and the southeastern part of Haidian District, forming a central agglomeration state, while in 2019 the industrial agglomeration state in the six urban districts expanded in all directions, with high-density The number of fishing nets in high-density, medium-density and low-density areas in 2013 is larger than that in 2019, while the number of fishing nets in medium-density and medium-low density areas in 2019 has increased significantly, and the phenomenon of industrial clusterings such as regional logistics bases and regional professional markets has improved significantly, and the number of too-high or too-low density areas have been reduced. The industries in the high-density areas have been greatly improved by the decentralization, which liberates part of the land in the central city and increases the opportunities for high and precise development in the central city. The low-density areas have been given development opportunities through industrial relocation, improving the utilization of land, which is also beneficial to the production and living standards of people in low-density areas. The number of medium-density areas is greatly increased, which can guarantee the production and living standards as well as protect the ecological health, which is conducive to the stable development of the region. Urban development from point and cluster clusters to the periphery of the spread of the industrial clustering phenomenon has been improved, which is important to alleviate the “big city disease” and promote the healthy and stable development of the city. In general, after a series of decentralization policies, the industry in the central city has been significantly decentralized, and the industry in the six districts is more balanced and widely distributed, which is also conducive to industrial upgrading and urban development;
(2) The type of land use in the six urban districts has changed significantly, with storage and logistics land and industrial land being significantly reduced and the number and area of park green areas greatly increased. The visual interpretation of remote sensing images of two phases in 2013 and 2019 has completed the fine extraction of various types of land use in the six urban districts of Beijing. From the extraction results, it can be clearly seen that the number and area of patches of storage and logistics land and industrial land have decreased, public land and park green space have been increased, and the number and area of patches of transportation facility land and residential land have changed less. This indicates that since the decommissioning of Beijing, general manufacturing industries, especially high-consumption industries (e.g., industrial land in this study), some tertiary industries such as regional logistics bases and regional professional markets (e.g., logistics and warehousing land in this study), and some social and public service institutions such as education, medical and training institutions (e.g., public land in this study) have been improved, and their distribution points have been reduced and dispersed, and their areas have also The distribution points and area have been reduced. In contrast, the change of land for transportation facilities and residential land is not obvious in cities with mature development. The number and area of parkland patches have increased significantly, which corresponds to the “increasing white and green” advocated since the evacuation;
(3) The combination of remote sensing interpretation and POI data can better identify the spatial and temporal changes of industrial land. Remote sensing interpretation is accurate in identifying large features, while POI data is sensitive to the perception of small industries. The combination of the two can show that the two kinds of data have better matching effects on park green areas and transportation facility sites, and poorer matching effects on small courier points, training institutions, clinics, etc., indicating that the two data have different research focuses. Remote sensing image visual interpretation has the disadvantage of strong subjectivity, and there are cases of small buildings being wrongly mentioned, omitted or incompletely extracted, but it has better recognition for park green areas, transportation facilities, large regional industries and large storage and wholesale bases. POI data has strong timeliness and redundant classification, often only a relatively small number of points are distributed in the same type of land in a certain area, which has a barrier for identifying area and the POI data are time-sensitive and categorically redundant, and often only a small number of points are distributed in the same type of land in a certain area, which is a barrier to the identification of area and scale. Combining remote sensing image interpretation with POI data can cover large, medium and small multi-level urban land type changes, which can provide quantitative descriptions of area and scale as well as analyze industrial changes and land type changes. At the same time, the two data can supervise each other as mutual correspondence, which ensures the authenticity and credibility of the results, and also enables qualitative and quantitative multidimensional analysis, which brings greater convenience to the research on urban development and evacuation and vacating. From the study, it can also be seen that some aggregated points with a poor matching degree are industries that are not completely evacuated and need further strengthening of evacuation, and some zones with a poor matching degree need spatial reuse and optimization for quality improvement according to the actual point situation.
The original contributions presented in the study are included in the article/Supplementary Material, further inquiries can be directed to the corresponding author.
ZH: The overall framework and ideas of this paper are proposed. LR: Process the data and complete the text. YC: Assist in data processing and paper revision and finalization. YH: He has made acertain contribution to the data processing of this article.
General Project of Beijing Social Science Foundation “Study on Rational Utilization of Decentralization Space in Beijing” (Grant No.18GLB043). Basic Business Expense Project of Central Universities “Typical Investigation and Reuse Model of Decentralization Space in Beijing” (Grant No. 2652018035).
The authors declare that the research was conducted in the absence of any commercial or financial relationships that could be construed as a potential conflict of interest.
All claims expressed in this article are solely those of the authors and do not necessarily represent those of their affiliated organizations, or those of the publisher, the editors and the reviewers. Any product that may be evaluated in this article, or claim that may be made by its manufacturer, is not guaranteed or endorsed by the publisher.
We especially would like to thank Hou Xinyue and Chen Xiangli for their valuable suggestions. We would also like to thank Yang Xin, Li Ting, and Huang Shiting for their assistance with data processing.
Ahlfeldt, G. M., Maennig, W., and Richter, F. J. (2017). Urban Renewal after the Berlin Wall: a Place-Based Policy Evaluation. J. Econ. Geogr. 17 (1), 129–156. doi:10.1093/jeg/lbw003
Al-Bilbisi, H. (2019). Spatial Monitoring of Urban Expansion Using Satellite Remote Sensing Images: a Case Study of Amman City, Jordan. Sustainability 11 (8), 2260. doi:10.3390/su11082260
Azadegan, A., and Wagner, S. M. (2011). Industrial Upgrading, Exploitative Innovations and Explorative Innovations. Int. J. Prod. Econ. 130 (1), 54–65. doi:10.1016/j.ijpe.2010.11.007
Champion, A. G. (2001). A Changing Demographic Regime and Evolving Polycentric Urban Regions: Consequences for the Size, Composition and Distribution of City Populations. Urban Stud. 38 (4), 657–677. doi:10.1080/00420980120035277
Clark, J. K., McChesney, R., Munroe, D. K., and Irwin, E. G. (2009). Spatial Characteristics of Exurban Settlement Pattern in the United States. Landsc. Urban Plan. 90 (3-4), 178–188. doi:10.1016/j.landurbplan.2008.11.002
Costa, C., and Lee, S. (2019). The Evolution of Urban Spatial Structure in Brasília: Focusing on the Role of Urban Development Policies. Sustainability 11 (2), 553. doi:10.3390/su11020553
Dong, L., Wang, Y., Lin, J., and Zhu, E. (2020). The Community Renewal of Shantytown Transformation in Old Industrial Cities: Evidence from Tiexi Worker Village in Shenyang, China. Chin. Geogr. Sci. 30 (6), 1022–1038. doi:10.1007/s11769-020-1164-6
Duvernoy, I., Zambon, I., Sateriano, A., and Salvati, L. (2018). Pictures from the Other Side of the Fringe: Urban Growth and Peri-Urban Agriculture in a Post-industrial City (Toulouse, France). J. Rural Stud. 57, 25–35. doi:10.1016/j.jrurstud.2017.10.007
Erwin, V. D. K., and Buitelaar, E. (2011). Industrial Land and Property Markets: Market Processes, Market Institutions and Market Outcomes: the Dutch Case. Eur. Plan. Stud. 19 (12), 2127–2146. doi:10.1080/09654313.2011.633822
Escalona-Orcao, A. I., and Climent-López, E. A. (2012). Factors and Limits of Interurban Industrial Decentralization the Case of Zaragoza (Spain). Eur. Urban Regional Stud. 19 (4), 420–433. doi:10.1177/0969776411428561
Ewing, R., Pendall, R., and Chen, D. (2002). Measuring Sprawl and its Impact: The Character and Consequences of Metropolitan Expansion. J. Plan. Educ. Res. 35, 35–50. doi:10.1177/0739456X14565247
Frantál, B., Greer-Wootten, B., Klusáček, P., Krejčí, T., Kunc, J., and Martinát, S. (2015). Exploring Spatial Patterns of Urban Brownfields Regeneration: The Case of Brno, Czech Republic. Cities 44, 9–18. doi:10.1016/j.cities.2014.12.007
Gao, B. Y., Liu, W. D., and Dunford, M. (2014). State Land Policy, Land Markets and Geographies of Manufacturing: The Case of Beijing, China. Land Use Policy 36, 1–12. doi:10.1016/j.landusepol.2013.06.007
Gray, P., Ridge, J., Poulin, S., Seymour, A., Schwantes, A., Swenson, J., et al. (2018). Integrating Drone Imagery into High Resolution Satellite Remote Sensing Assessments of Estuarine Environments. Remote Sens. 10 (8), 1257. doi:10.3390/rs10081257
Green, T. L. (2018). Evaluating Predictors for Brownfield Redevelopment. Land Use Policy 73, 299–319. doi:10.1016/j.landusepol.2018.01.008
Hu, T., Yang, J., Li, X., and Gong, P. (2016). Mapping Urban Land Use by Using Landsat Images and Open Social Data. Remote Sens. 8 (2), 151. doi:10.3390/rs8020151
Huang, L., Yan, L., and Wu, J. (2016). Assessing Urban Sustainability of Chinese Megacities: 35 Years after the Economic Reform and Open-Door Policy. Landsc. Urban Plan. 145, 57–70. doi:10.1016/j.landurbplan.2015.09.005
Huang, B., Zhao, B., and Song, Y. (2018). Urban Land-Use Mapping Using a Deep Convolutional Neural Network with High Spatial Resolution Multispectral Remote Sensing Imagery. Remote Sens. Environ. 214, 73–86. doi:10.1016/j.rse.2018.04.050
Hyra, D. S. (2012). Conceptualizing the New Urban Renewal: Comparing the Past to the Present. Urban Affairs Review. Urban Aff. Rev. 48 (4), 498–527. doi:10.1177/1078087411434905
Jiang, S., Alves, A., Rodrigues, F., Ferreira, J., and Pereira, F. C. (2015). Mining Point-Of-Interest Data from Social Networks for Urban Land Use Classification and Disaggregation. Comput. Environ. Urban Syst. 53, 36–46. doi:10.1016/j.compenvurbsys.2014.12.001
Jin, G., Deng, X., Zhao, X., Guo, B., and Yang, J. (2018). Spatiotemporal Patterns in Urbanization Efficiency within the Yangtze River Economic Belt between 2005 and 2014. J. Geogr. Sci. 28 (008), 1113–1126. doi:10.1007/s11442-018-1545-2
Jun, M.-J. (2007). Korea's Public Sector Relocation: Is it a Viable Option for Balanced National Development? Reg. Stud. 41 (1), 65–74. doi:10.1080/00343400601099664
Krabben, E., and Jacobs, H. M. (2013). Public Land Development as a Strategic Tool for Redevelopment: Reflections on the Dutch Experience. Land Use Policy 30 (1), 774–783. doi:10.1016/j.landusepol.2012.06.002
Kuang, W., Yang, T., and Yan, F. (2018). Examining Urban Land-Cover Characteristics and Ecological Regulation during the Construction of Xiong'an New District, Hebei Province, China. J. Geogr. Sci. 28 (1), 109–123. doi:10.1007/s11442-018-1462-4
Lai, Y., Chen, K., Zhang, J., and Liu, F. (2020). Transformation of Industrial Land in Urban Renewal in Shenzhen, China. Land 9 (10), 371. doi:10.3390/land9100371
Lan, F., Da, H., Wen, H., and Wang, Y. (2019). Spatial Structure Evolution of Urban Agglomerations and its Driving Factors in Mainland China: from the Monocentric to the Polycentric Dimension. Sustainability 11 (3), 610. doi:10.3390/su11030610
Lang, T. (2012). Shrinkage, Metropolization and Peripheralization in East Germany. Eur. Plan. Stud. 20 (10), 1747–1754. doi:10.1080/09654313.2012.713336
Li, M., Stein, A., Bijker, W., and Zhan, Q. (2016). Urban Land Use Extraction from Very High Resolution Remote Sensing Imagery Using a Bayesian Network. ISPRS J. Photogramm. Remote Sens. 122, 192–205. doi:10.1016/j.isprsjprs.2016.10.007
Li, T., Liu, Y., Wang, C., Olsson, G., Wang, Z., and Wang, H. (2019). Decentralization of the Non-capital Functions of Beijing: Industrial Relocation and its Environmental Effects. J. Clean. Prod. 224, 545–556. doi:10.1016/j.jclepro.2019.03.247
Liu, J., Zhang, Z., Xu, X., Kuang, W., Zhou, W., Zhang, S., et al. (2010). Spatial Patterns and Driving Forces of Land Use Change in China during the Early 21st Century. J. Geogr. Sci. 20 (4), 483–494. doi:10.1007/s11442-010-0483-4
Liu, X., He, J., Yao, Y., Zhang, J., Liang, H., Wang, H., et al. (2017). Classifying Urban Land Use by Integrating Remote Sensing and Social Media Data. Int. J. Geogr. Inf. Sci. 31 (8), 1675–1696. doi:10.1080/13658816.2017.1324976
Long, Y., Zhai, W., Shen, Y., and Ye, X. (2018). Understanding Uneven Urban Expansion with Natural Cities Using Open Data. Landsc. Urban Plan. 177, 281–293. doi:10.1016/j.landurbplan.2017.05.008
Longo, A., and Campbell, D. (2017). The Determinants of Brownfields Redevelopment in England. Environ. Resour. Econ. 67 (2), 261–283. doi:10.1007/s10640-015-9985-y
Ma, Y., and Xu, R. (2010). Remote Sensing Monitoring and Driving Force Analysis of Urban Expansion in Guangzhou City, China. Habitat Int. 34 (2), 228–235. doi:10.1016/j.habitatint.2009.09.007
Martinez-Fernandez, C., Audirac, I., Fol, S., and Cunningham-Sabot, E. (2012). Shrinking Cities: Urban Challenges of Globalization. Int. J. Urban Region. Res. 36 (2), 213–225. doi:10.1111/j.1468-2427.2011.01092.x
Masek, J. G., Lindsay, F. E., and Goward, S. N. (2010). Dynamics of Urban Growth in the Washington DC Metropolitan Area, 1973-1996, from Landsat Observations. Int. J. Remote Sens. 21 (18), 3473–3486. doi:10.1080/014311600750037507
Muiz, C. O., and García, F. F. (2017). Recent Urban Development in Gijon (Spain). Historic Aerial Photography as a Tool for Sustainability Assessment of the Process. Cities 67, 1–8. doi:10.1016/j.cities.2017.04.009
Needham, B., Louw, E., and Metzemakers, P. (2013). An Economic Theory for Industrial Land Policy. Land Use Policy 33, 227–234. doi:10.1016/j.landusepol.2013.01.005
Pan, M., and Song, H. (2017). Transformation and Upgrading of Old Industrial Zones on Collective Land: Empirical Study on Revitalization in Nanshan. Habitat Int. 65, 1–12. doi:10.1016/j.habitatint.2017.04.014
Rao, C., Goh, M., Zhao, Y., and Zheng, J. (2015). Location Selection of City Logistics Centers under Sustainability. Transp. Res. Part D Transp. Environ. 36, 29–44. doi:10.1016/j.trd.2015.02.008
Sarvestani, M. S., Ibrahim, A. L., and Kanaroglou, P. (2011). Three Decades of Urban Growth in the City of Shiraz, Iran: A Remote Sensing and Geographic Information Systems Application. Cities 28 (4), 320–329. doi:10.1016/j.cities.2011.03.002
Sawaya, K. E., Olmanson, L. G., Heinert, N. J., Brezonik, P. L., and Bauer, M. E. (2003). Extending Satellite Remote Sensing to Local Scales: Land and Water Resource Monitoring Using High-Resolution Imagery. Remote Sens. Environ. 88 (1-2), 144–156. doi:10.1016/j.rse.2003.04.006
Schneider, A., Chang, C., and Paulsen, K. (2015). The Changing Spatial Form of Cities in Western China. Landsc. Urban Plan. 135, 40–61. doi:10.1016/j.landurbplan.2014.11.005
Shen, Y., Shen, H., Cheng, Q., Huang, L., and Zhang, L. (2020). Monitoring Three-Decade Expansion of China's Major Cities Based on Satellite Remote Sensing Images. Remote Sens. 12 (3), 491. doi:10.3390/rs12030491
Shi, K., Chang, Z., Chen, Z., Wu, J., and Yu, B. (2020). Identifying and Evaluating Poverty Using Multisource Remote Sensing and Point of Interest (POI) Data: A Case Study of Chongqing, China. J. Clean. Prod. 255, 120245. doi:10.1016/j.jclepro.2020.120245
Song, J., Tong, X., Wang, L., Zhao, C., and Prishchepov, A. V. (2019). Monitoring Finer-Scale Population Density in Urban Functional Zones: A Remote Sensing Data Fusion Approach. Landsc. Urban Plan. 190, 103580. doi:10.1016/j.landurbplan.2019.05.011
Sparks, K., Thakur, G., Pasarkar, A., and Urban, M. (2020). A Global Analysis of Cities' Geosocial Temporal Signatures for Points of Interest Hours of Operation. Int. J. Geogr. Inf. Sci. 34 (4), 759–776. doi:10.1080/13658816.2019.1615069
Spórna, T., and Krzysztofik, R. (2020). ‘Inner’ Suburbanisation - Background of the Phenomenon in a Polycentric, Post-Socialist and Post-industrial Region. Example from the Katowice Conurbation, Poland. Cities 104, 102789. doi:10.1016/j.cities.2020.102789
Swensen, G. (2012). Integration of Historic Fabric in New Urban Development-A Norwegian Case-Study. Landsc. Urban Plan. 107 (4), 380–388. doi:10.1016/j.landurbplan.2012.07.006
Thomas, M. R. (2002). A GIS-Based Decision Support System for Brownfield Redevelopment. Landsc. Urban Plan. 58 (1), 7–23. doi:10.1016/s0169-2046(01)00229-8
Tian, K., Dietzenbacher, E., Jong-A-Pin, R., and Lenzen, M. (2019). Measuring Industrial Upgrading: Applying Factor Analysis in a Global Value Chain Framework. Econ. Syst. Res. 31 (4), 642–664. doi:10.1080/09535314.2019.1610728
Tölle, A. (2010). Urban Identity Policies in Berlin: From Critical Reconstruction to Reconstructing the Wall. Cities 27 (5), 348–357. doi:10.1016/j.cities.2010.04.005
Wang, B., Tian, L., and Yao, Z. (2018). Institutional Uncertainty, Fragmented Urbanization and Spatial Lock-In of the Peri-Urban Area of China: A Case of Industrial Land Redevelopment in Panyu. Land Use Policy 72, 241–249. doi:10.1016/j.landusepol.2017.12.054
Wu, Q., Li, H.-q., Wang, R.-s., Paulussen, J., He, Y., Wang, M., et al. (2006). Monitoring and Predicting Land Use Change in Beijing Using Remote Sensing and GIS. Landsc. Urban Plan. 78 (4), 322–333. doi:10.1016/j.landurbplan.2005.10.002
Wu, F. (2016). State Dominance in Urban Redevelopment: Beyond Gentrification in Urban China. Urban Affairs Review. Urban Aff. Rev. 52 (5), 631–658. doi:10.1177/1078087415612930
Xia, C., Yeh, A. G.-O., and Zhang, A. (2020). Analyzing Spatial Relationships between Urban Land Use Intensity and Urban Vitality at Street Block Level: A Case Study of Five Chinese Megacities. Landsc. Urban Plan. 193, 103669. doi:10.1016/j.landurbplan.2019.103669
Xue, B., Xiao, X., and Li, J. (2020). Identification Method and Empirical Study of Urban Industrial Spatial Relationship Based on Poi Big Data: a Case of Shenyang City, China. Geogr. Sustain. 1 (2), 152–162. doi:10.1016/j.geosus.2020.06.003
Zeng, C., Zhang, M., Cui, J., and He, S. (2015). Monitoring and Modeling Urban Expansion-A Spatially Explicit and Multi-Scale Perspective. Cities 43, 92–103. doi:10.1016/j.cities.2014.11.009
Zhang, Z., Liu, F., Zhao, X., Wang, X., Shi, L., Xu, J., et al. (2018). Urban Expansion in China Based on Remote Sensing Technology: a Review. Chin. Geogr. Sci. 28 (5), 727–743. doi:10.1007/s11769-018-0988-9
Keywords: non-capital function decentralization, industrial decentralization, RS interpretation, POI, construction land extraction, urban renewal
Citation: Liu R, Zhao H, Yang C and Yang H (2022) Feature Recognition of Urban Industrial Land Renewal Based on POI and RS Data: The Case of Beijing. Front. Environ. Sci. 10:890571. doi: 10.3389/fenvs.2022.890571
Received: 06 March 2022; Accepted: 22 April 2022;
Published: 05 May 2022.
Edited by:
Dingyang Zhou, Beijing Normal University, ChinaReviewed by:
Gui Jin, China University of Geosciences Wuhan, ChinaCopyright © 2022 Liu, Zhao, Yang and Yang. This is an open-access article distributed under the terms of the Creative Commons Attribution License (CC BY). The use, distribution or reproduction in other forums is permitted, provided the original author(s) and the copyright owner(s) are credited and that the original publication in this journal is cited, in accordance with accepted academic practice. No use, distribution or reproduction is permitted which does not comply with these terms.
*Correspondence: Huafu Zhao, aHVhZnV6aGFvQDE2My5jb20=
Disclaimer: All claims expressed in this article are solely those of the authors and do not necessarily represent those of their affiliated organizations, or those of the publisher, the editors and the reviewers. Any product that may be evaluated in this article or claim that may be made by its manufacturer is not guaranteed or endorsed by the publisher.
Research integrity at Frontiers
Learn more about the work of our research integrity team to safeguard the quality of each article we publish.