 Kai Liu
 Wenrui Liu1
 Zhongfei Chen
- 1College of Geography and Environment, Shandong Normal University, Ji’nan, China
- 2School of Economics, Jinan University, Guangzhou, China
- 3Institute of Environment and Ecology, Shandong Normal University, Ji’nan, China
- 4School of Public Administration, Shandong Normal University, Ji’nan, China
The purpose of urban water management is to improve urban water utilization efficiency (UWUE), which in turn addresses water shortages in urban areas. The present study aimed to evaluate the UWUE of 284 cities at the prefecture level in China between 2003 and 2018 by the slacks-based measure of super-efficiency, explore its spatial differences through exploratory spatial data analysis, and analyze the influencing factors using the statistical tool Geodetector. The results showed that the average value of UWUE in China was generally low but tended to rise gradually. There were significant spatial differences in UWUE across China, with considerable global and local spatial autocorrelation, and local spatial autocorrelation was characterized primarily by high-high and low-low regions. Industrial structure and urban population were the main influencing factors for UWUE. Finally, based on these findings, we offered policy implications for improving UWUE and coordinated development between cities.
1 Introduction
According to a report by the Food and Agriculture Organization of the United Nations, with the rapid growth of the global population, the per capita supply of freshwater resources has decreased by over 20% in the past 20 years (Cazcarro and Steenge 2021). Global water consumption has increased sixfold in the past 100 years and has grown at an annual rate of about 1%. It is estimated that by 2050, more than half of the world’s population will face water shortages (Liao et al., 2021). Affected by natural conditions and continued economic development, China also sustains a severe shortage of water resources (Deng et al., 2021). On the one hand, uneven spatial and temporal distributions, mismatches between supply and demand, the lack of public awareness of water conservation, and extensive use of water resources pose a massive challenge to the “ecological civilization” and sustainable development (Liu et al., 2022). On the other hand, China per se is extremely short of urban water resources, as evidenced by water shortages in nearly all provincial capitals. More than 400 out of the 660 cities in China are short of water, of which 110 are facing grievous situations (Huang Y. et al., 2021). Water utilization efficiency (WUE) refers to the ratio of the optimal input of water resources to their actual input required by economic and social demands, namely, the economic value of products manufactured per unit of water consumption (Sileshi et al., 2020). In the situation of water shortage, improving the WUE is of great significance in two aspects. First, the improvement of WUE means improving the intensive and economical utilization of water resources, which helps to reduce the waste of water resources and realize the sustainable utilization of water resources. Second, the improvement of WUE means increasing the economic output per unit of water consumption, which is helpful to further improve economic benefits. Therefore, improving China’s urban water utilization efficiency (UWUE) may be a pivotal solution to water shortages in cities.
Most previous studies have focused on WUE, while little attention has been directed to UWUE. These studies favor industry sectors and regions as the object of WUE evaluation, especially agriculture and industry. Since water plays a crucial role in maintaining agricultural security, improving agricultural WUE becomes an important means of promoting sustainable agricultural development (Namaalwa et al., 2020; Liu et al., 2021). The consumption of water resources has been increasing with industrialization, and improving WUE may play an essential part in developing a system of green industrial production. For this reason, researchers have made efforts to find a way to increase industrial WUE (Shang et al., 2017; Liu et al., 2020a; Liu et al., 2020b). Previous studies on the spatial differences in WUE have focused on provincial administrative units or the overall situation across China. In addition, attention has also been paid to the WUE in strategic regions, such as the Yellow River Basin (Guan et al., 2016), the Yangtze River Basin (Pan et al., 2020), and the Tibetan Plateau (Cheng et al., 2021).
Four methods have been used to calculate WUE in previous studies: 1) water footprint (Cao et al., 2021); 2) comprehensive indicator evaluation (Zhang et al., 2019; Song et al., 2020); 3) single factors (Li et al., 2008); and 4) the total factor of WUE (Hu et al., 2006; Shi et al., 2021; Liu et al., 2022), such as stochastic frontier analysis (SFA) and data envelopment analysis (DEA). The first three simple methods cannot reflect the dependency of the output of the production process on multiple factors. It is vital to take into consideration the inputs of factors other than investment in water resources when calculating WUE. Compared with SFA, DEA does not require the basic functional form and gives consideration to a variety of inputs and outputs. It thus has significant advantages in the measurement of efficiency.
WUE is the result of multiple factors. Some researchers have been concerned with single factors, such as environmental regulation (Wang and Wang 2021), the fattening period in animal husbandry (Huong et al., 2020), and national policies on WUE (Zhang et al., 2020; Zhang et al., 2021). Other researchers have examined the effects of multiple factors. According to them, positive factors included dependence on exports (Deng et al., 2016), technical progress and educational value (Wang G. et al., 2018), government behavior (Yang et al., 2020), economic growth, urbanization, and effective irrigation (Lu et al., 2021). Conversely, negative factors were agricultural added value, per capita water consumption, and unit output of sewage (Deng et al., 2016), industrial structure (Wang S. et al., 2018), population pressure (Yang et al., 2021), and per capita water resources (Lu et al., 2021). Some studies focused on the agricultural sector for resources utilization (Elahi et al., 2021a; Elahi et al. 2021b; Elahi et al.2022a; Elahi et al.2022b).
The above-referenced studies contribute knowledge to the spatial pattern and genesis of WUE at the provincial scale and provide a reference for policymaking. However, little attention has been paid to the WUE of cities (UWUE). Cities are highly populated and economically concentrated areas that consume large water volumes for both domestic and industrial purposes. In other words, the research on UWUE is of great significance. In the present study, we evaluated the UWUE of 284 cities at the prefecture level in China using the slacks-based measure (SBM) of super-efficiency based on unexpected output. On this basis, we also explored the spatial differences in UWUE by exploratory spatial data analysis (ESDA) as well as the influencing factors with the statistical tool Geodetector. The contributions of this study to the existing literature include: 1) The research object of cities rather than provinces can enrich the research content of WUE. 2) Cities are smaller than provinces, and the spatial differences in UWUE between them can reflect the spatial pattern of WUE more accurately. 3) The influencing factors of UWUE at the prefecture level can provide more empirical evidence for UWUE and offer a reference for policymaking.
2 Methods and Data
Methods
2.1.1 Slacks-Based Measure of Super-efficiency
Since DEA focuses only on the expected output of economic activities and ignores unexpected output, its results may be biased (Liu et al., 2010). As such, SBM based on unexpected output was used to calculate UWUE in China, which took into consideration the unexpected output in the production process (Tone 2001). The specific procedures are described as follows:
Suppose there are n decision-making units (DMUs) in the production system. Each unit is composed of three input–output vectors: 1) input, 2) an expected output, and 3) an unexpected output. The three input–output vectors can be expressed as:
Suppose
The actual expected output is lower than the ideal expected output of the frontier, while the actual unexpected output is higher than the unexpected output. Based on the set of production possibilities, the SBM model that considers the unexpected output in the DMU of evaluation (
In the formula,
Most indicators used to assess efficiency involve a common phenomenon that the DMUs have 100% efficiency. It is necessary to distinguish these DMUs and the factors affecting the efficiency ranking. To ensure that the efficiency analysis yields reasonable values, SBM of super-efficiency was used for calculation in the present study:
The value of the objective function
2.1.2 Exploratory Spatial Data Analysis
ESDA is a collection of spatial data analysis techniques used to describe the spatial distribution of data and express it visually. It can explain spatial differences in data and reveal the mechanism of spatial interaction between phenomena (Messner et al., 1999; Dong et al., 2021). ESDA takes use of global Moran’s I and local Moran’s I, and the former can express the spatial distribution of UWUE in an entire region. If global Moran’s I is >0, the research object has a positive spatial autocorrelation, and the larger the value, the stronger the spatial agglomeration. It was calculated as follows:
In the formula, n = the number of units in the research area; xi and yj = the UWUEs of units i and j;
Wherein, Z(I) = significance; E(I) = mathematical expectation; Var(I) = variance.
Local Moran’s I expresses the spatial heterogeneity of UWUE in subregions of a given region. Combined with the scatter diagram and local Moran’s I, the local indicators of spatial association (LISA) clustering map can directly show the types of clustering and significance levels of different elements, as given in Eq. 11:
The significance of local Moran’s I is given in Eq. 11. By comparing the signs of
2.1.3 Geodetector
The Geodetector makes no linear hypothesis and has an elegant form and a clear physical meaning (Wang et al., 2010). The q-statistic can be used to measure spatial differentiation, detect explanatory factors, and analyze the interaction between variables. It has been widely used to explore the influencing factors for resources and the environment (Zhou et al., 2019; Huang C. et al., 2021; Wei et al., 2021). In the present study, it was calculated as follows:
In the formula,
Indicators
Indicators need to be determined to assess UWUE in China from the perspectives of input, expected output, and unexpected output. Capital, resources, and labor force required in economic production yield not only expected outputs such as economic growth and income but also unexpected outputs such as resource consumption and environmental pollution. Some researchers have investigated the characteristics of water resources utilization in economic production (He et al., 2020). In light of the availability and comparability of data, capital, water resource, and labor force were taken into consideration as the input-related indicators of UWUE and were expressed as the investment in fixed assets, total water supply, and the number of employees in urban areas, respectively. Economic growth was regarded as an indicator of the expected output of UWUE and expressed as the gross domestic product (GDP). Wastewater discharge was deemed as an indicator of the undesirable outputs of UWUE and expressed as industrial wastewater discharge. Table 1 shows the descriptive statistics of the UWUE indicators.
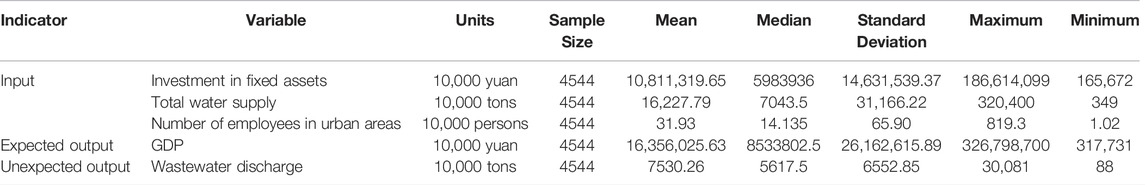
TABLE 1. Descriptive statistics of the indicators of UWUE.
Source of Data
The data of the five indicators were all derived from China’s Economic and Social Big Data Research Platform (https://data.cnki.net/). There are totally 333 cities above the prefecture level in China. Since the data of some cities in central and western China were unavailable, 284 of them were finally included in this study.
3 Results
The Evolution of UWUE in China
SBM of super-efficiency was employed to assess UWUE in China between 2003 and 2018, as shown in Figure 1, which showed two prominent characteristics. First, the overall UWUE of Chinese cities during this period was low. As previously described in Wang et al. (2020), 0.6 was used as the standard to gauge efficiency. The year of 2018 saw the maximum number of cities (82) with a UWUE >0.6, accounting for 28.9% of the 284 cities. 2006 and 2007 witnessed the minimum number of cities (10) with a UWUE >0.6, accounting for only 3% of the total. Only a few cities in China had high UWUEs, suggesting that there is considerable room for improvement in UWUE. This result was consistent with the results of other research on WUE efficiency (Liu et al., 2022). The fundamental reason for this is that the long-term rapid economic growth in China depends on the traditional growth model featuring extensive investment of resources, labor, and other factors. This inefficient model consumes huge water resources and produces large volumes of wastewater discharge, thereby resulting in a low overall UWUE in China.
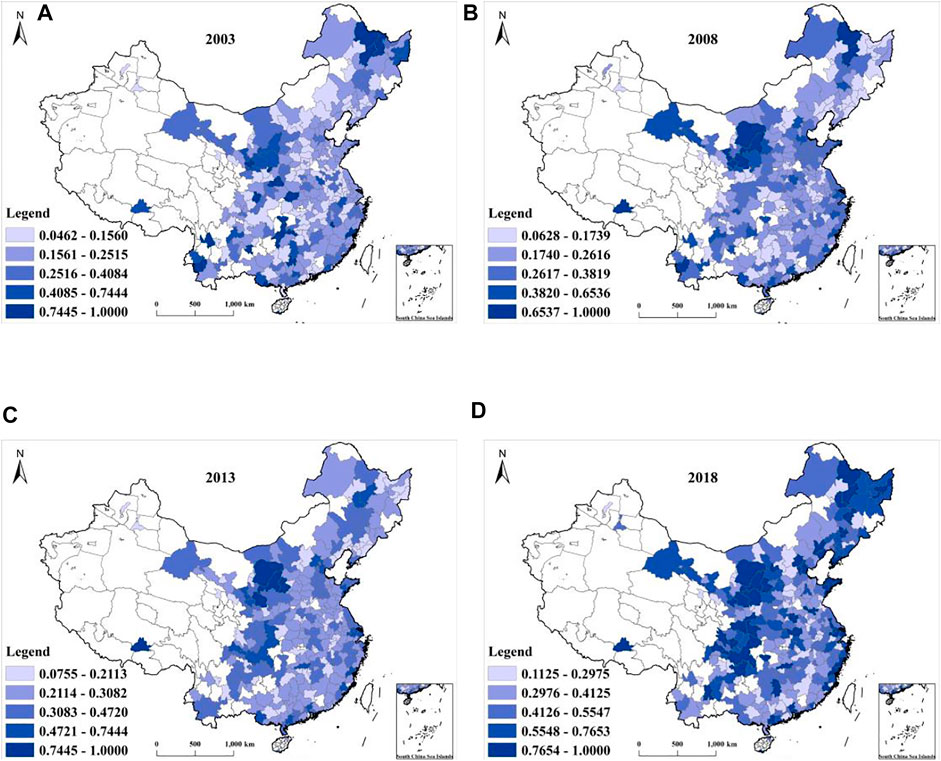
FIGURE 1. China’s UWUEs between 2003 and 2018. (A) 2003; (B) 2008; (C) 2013; (D) 2018. Note: This figure shows only the results of 4 years, and the others can be seen in Supplemental Materials.
Second, the overall UWUE appeared to be on the rise during the research period. This phenomenon can be described more concisely and directly by dividing the cities into regions and scales. China’s regional economic layout can be divided into four regions: eastern China, central China, western China, and Northeastern China (Table 2.) (Li and Liu 2020). The evolution of the average UWUEs in China and its four regions is illustrated in Figure 2, which shows a fluctuating upward trend from 2003 to 2015, with slight declines in some years. After 2015, UWUE rose significantly, possibly because the government decided to promote the “ecological civilization” ever since for resource conservation and environmental protection. According to the scale type of the resident population, Chinese cities can be divided into five types: super megacity, megacity, large-scale city, medium-scale city, and small-scale city (Qi et al., 2016). The city-size classification standard in China is listed in Table 3. The average UWUEs of different scales are illustrated in Figure 3, indicating that the UWUEs of different scales tended to increase. Since 2008, the UWUE in super megacities has maintained the highest level for a long time. The possible reasons are as follows: First, the developed technology of super megacities is conducive to improving the level of economical and intensive utilization of water resources; Second, super megacities have a higher degree of population and economic agglomeration, which can bring significant agglomeration benefits in the process of water resources utilization. The UWUE in large-scale cities has remained at the lowest level in recent years. The possible reason is that there is a high demand for water resources due to the large population and economic scale, but the technical level and agglomeration effect have not been brought into play, resulting in the low level of UWUE.
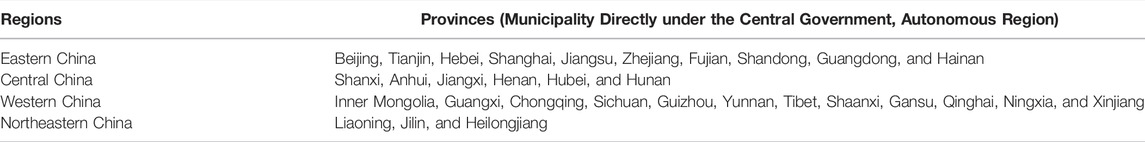
TABLE 2. Four regions in China.
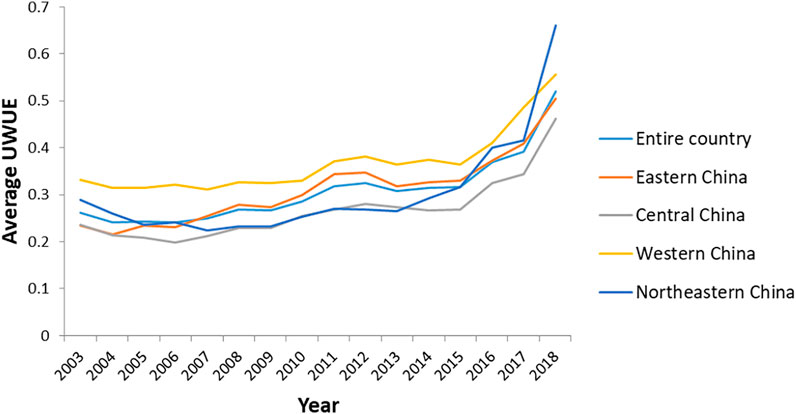
FIGURE 2. Average UWUEs in China and its four regions.
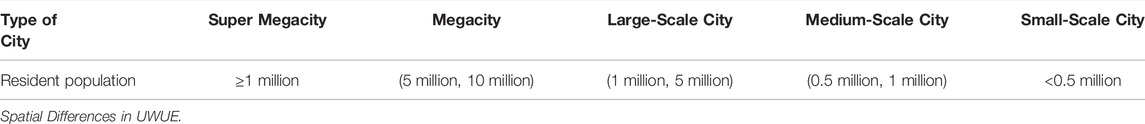
TABLE 3. City-size classification standard in China.
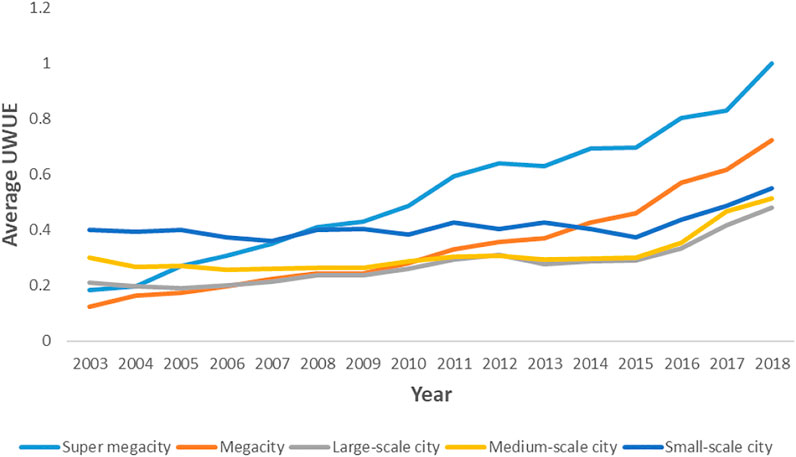
FIGURE 3. Average UWUEs of different scales of cities.
ArcGIS 10.2 was used to test global spatial agglomeration, which demonstrated that global Moran’s I was positive and passed the 1% significance test (Table 4). The UWUE across China was similarly characterized by spatial agglomeration, which could be used to identify hot and cold spots. The overall global Moran’s I increased, indicating that spatial agglomeration of UWUE in China was becoming increasingly prominent.
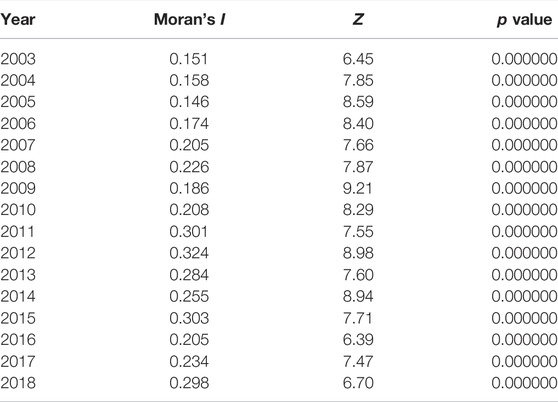
TABLE 4. Global spatial autocorrelation of UWUE in China.
ArcGIS 10.2 also demonstrated that UWUE was characterized by remarkable local spatial autocorrelation (Figure 4). This result was also consistent with the findings of other research on WUE efficiency (Liu et al., 2022). The relevant regions can be divided into the four types mentioned above. Together, the high-high and low-low regions accounted for more than 60% of all cities in each year and more than 70% throughout the research period. The high-high cities were distributed mainly in northwestern, northeastern, and southwestern China, while the urban agglomerations of Beijing-Tianjin-Hebei, the Yangtze River Delta, and the Pearl River Delta were scattered in individual years. The low-low cities were distributed mainly in northeastern and central China. The results of both global and local spatial autocorrelation showed that there were significant spatial differences in UWUE across China.
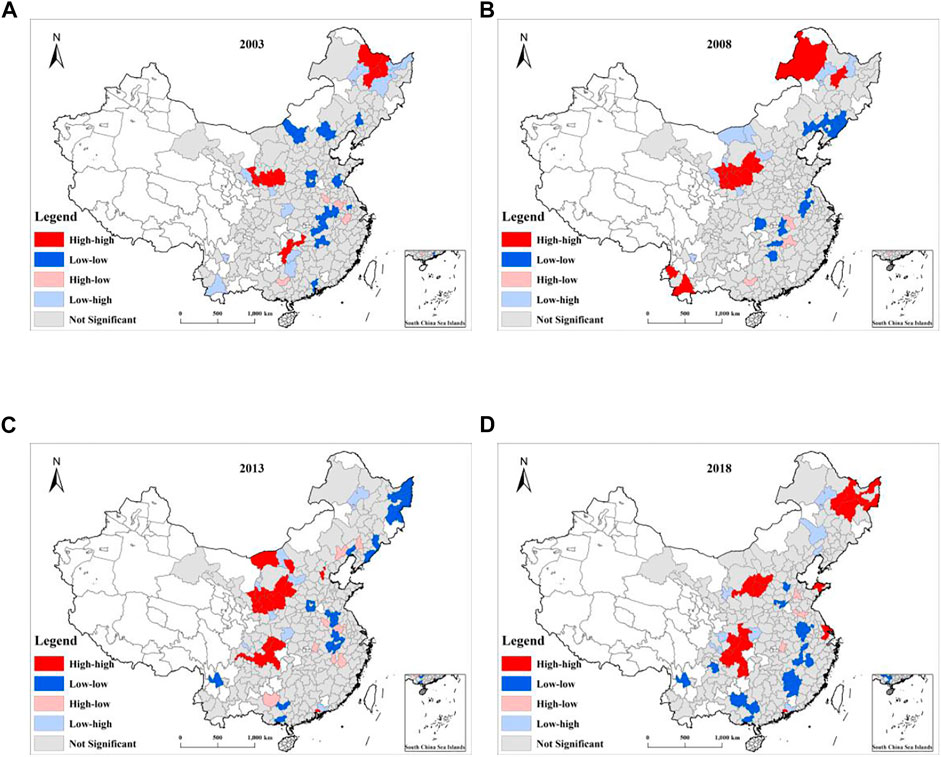
FIGURE 4. Local spatial autocorrelation of UWUE in China between 2003 and 2018. (A) 2003; (B) 2008; (C) 2013; (D) 2018. Note: This figure shows only the results of 4 years, and the others can be seen in Supplemental Materials.
Influencing Factors for UWUE
WUE is affected by various economic, social, and natural factors. With reference to a previous study (Babuna et al., 2020), in the present study, urban population, industrial structure, resident income, technological progress, the volume of surface water, and environmental regulation were selected as the potential influencing factors for UWUE and justified as follows.
1) Urban population. This is a frequently used indicator of urbanization. The larger the indicator, the higher it can drive the growth of urban consumption, which improves the input and output of the economy. However, a larger urban population also entails excessive consumption of water resources, which in turn affects UWUE (Meng et al., 2021). It is expressed as the number of people residing in a given urban area.
2) Industrial structure. The state of industrial structure is an important indicator of economic growth. Different industrial structures lead to significant differences in economic output, water consumption, and wastewater discharge, which in turn affect UWUE (Zhu and Zhang 2021). It is expressed as the share of the secondary industry.
3) Resident income. Resident income promotes the input and expected output of UWUE but may also impact the unexpected output. With increasing resident income, residents are more aware of the need to save water, which reduces the discharge of industrial wastewater. However, this also increases demand for products, which increases the discharge of industrial wastewater (Liu L. et al., 2020). Resident income is expressed as the per capita disposable income of urban residents.
4) Technological progress. This is not only the result of economic growth but also its cause, and affects the input and expected output of UWUE. Technological progress affects industrial wastewater discharge from two aspects: technological innovation in industrial production can reduce the amount of discharged wastewater, and technological progress may lead to expansion of production and an increase in wastewater discharge (Chen Z. et al., 2021). In this study, the number of patent applications was used to represent technological progress.
5) The volume of surface water. This is a natural factor affecting UWUE. Under the same conditions, the greater the volume of surface water, the greater the total volume of water supply in a city (Song et al., 2021). It is expressed as the volume of surface water in a given urban area.
6) Environmental regulation. The purpose of environmental regulation is to protect the environment, improvements in which can save water and thus improve UWUE (Fu et al., 2021). It is expressed as the amount of investment in environmental pollution control.
Table 5 shows the analysis results of the six indicators pertaining to UWUE in China with Geodetector. Industrial structure and urban population made significantly greater contributions to UWUE than the other four factors, hence the primary influencing factors for UWUE. Technological progress played a role, while resident income, the volume of surface water, and environmental regulation had little impact on UWUE. This differed from the influencing factors of agricultural WUE, namely, technological progress and farmers’ income (Liu et al., 2022).
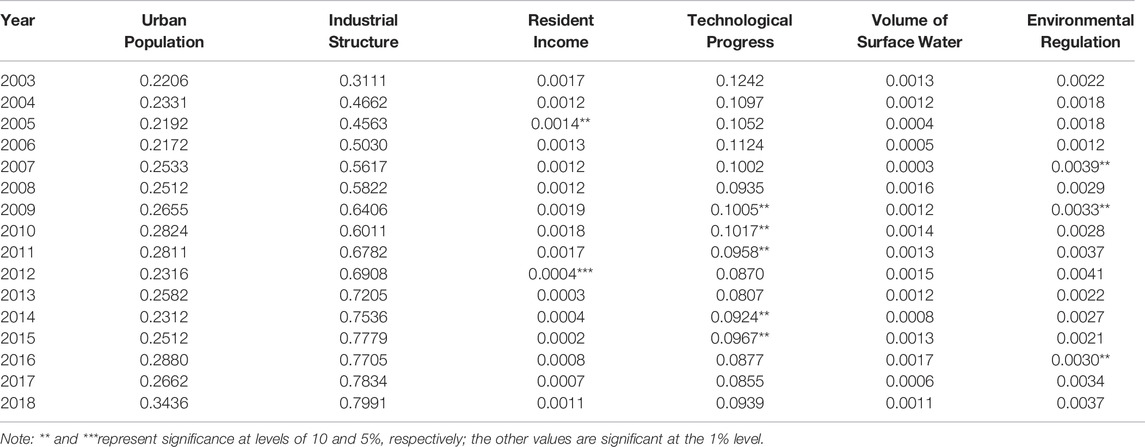
TABLE 5. Analysis of UWUE using Geodetector.
With respect to urban industrial structure in China, 125 out of the 284 cities studied were dominated by secondary industry in 2018. The structure of urban industry had been dominated by secondary industry for a long time and was in the middle of rapid industrialization. An inverted U-shaped relationship was observed between water consumption and economic growth in different stages of industrialization, where this was commonly known as the environmental Kuznets curve. Rapid industrialization with respect to industrial structure led to increased consumption and rising demand for water resources. Moreover, a large volume of wastewater discharge was inevitably the result of industrial production. Therefore, the industrial structure was the biggest factor affecting UWUE in China.
A clue to the impact of urban population on UWUE could be seen from Figure 3 mentioned above. UWUE in small-scale cities was highest between 2003 and 2007. This could be attributed to low water consumption and sewage discharge in small-scale cities, and therefore UWUE could be maintained at a high level compared with other types of cities. Since 2008, super megacities enjoyed the highest UWUE instead of small-scale cities. For a long time, there were only six super megacities in China: Beijing, Tianjin, Shanghai, Shenzhen, and Chongqing. The highest UWUE in these six cities could be attributed to the government’s promotion of national economic and environmental protection policies as well as the agglomeration effect produced by these huge urban populations. With the gradual agglomeration of populations and economies to form super megacities, in addition to the effect of technological progress improving UWUE, the various elements of agglomeration helped to reduce the consumption and pollution of water resources, thereby improving their utilization efficiency as a result of the building and utilization of water resource infrastructure. Therefore, the agglomeration of large-scale urban populations could improve UWUE.
4 Conclusions and Policy Implications
Conclusions
This study attempted to evaluate UWUE and exploring its spatial differences and influencing factors. We evaluated the UWUE of 284 cities at the prefecture level in China between 2003 and 2018 by SBM of super-efficiency, explored its spatial differences through ESDA, and analyzed the influencing factors using Geodetector. The findings were as follows: The average value of UWUE in China was generally low but tended to rise gradually. There were significant spatial differences in UWUE across China, with considerable global and local spatial autocorrelation, and local spatial autocorrelation was characterized primarily by high-high and low-low regions. Industrial structure and urban population were the main influencing factors for UWUE. This study has some limitations. We analyzed the spatial differences of UWUE by ESDA, which could reflect the spatial autocorrelation characteristics of UWUE but could not reflect the spatial differences of UWUE comprehensively. In the future, it is necessary to further study the spatial differences of UWUE using Dagum’s decomposition of the Gini coefficient and kernel density estimation.
Policy Implications
In view of the overall low UWUE in China, it is necessary for urban managers to comprehensively understand the nature and dynamics of their water usage, increase investment in water resources in terms of capital, technology, and talent, and reduce wastewater and sewage discharge. It is also important for industrial enterprises to improve water-saving and pollution control technologies for the improvement of UWUE. Citizens are expected to become aware of the importance of saving water and reducing waste. Efforts should also be made to coordinate industrial production, living demands, and ecological water use between all cities and build “green systems” to secure water supplies.
As for the substantial impact of industrial structure on UWUE, it is important for cities to build a modern industrial structure to cater to the use of green water resources. The industrial upgrade is an important means of improving UWUE. It is necessary to transform labor-intensive industries into new industrial clusters based on innovations in capital and technology. Moreover, it is also essential to keep abreast of structural adjustments and technological progress and transform traditional industries that consume large amounts of water.
With regard to the impact of urban population on UWUE, it is crucial to strengthen the effect of the population agglomeration of megacities and large-scale cities. The populations of these two types of cities have accounted for a large proportion but they have yet witnessed an agglomeration effect. In particular, the UWUE of large-scale cities has become the lowest since 2013. It is necessary to make specific action plans to improve UWUE in these cities. In addition, it is also important to give full play to the radiation effect of super megacities, so that medium- and small-scale cities can enjoy the benefits of technology transfer, thereby improving their UWUE.
In terms of the spatial differences in UWUE, it is necessary to establish a coordinated mechanism to strengthen regional technical cooperation and form contiguous, highly efficient regions for water resource use to improve the UWUE of all cities. Regions with high UWUE are expected to rely on their advantages of capital and technology to explore more channels for spillover. Regions with low UWUE are supposed to invest in science and technology and strengthen environmental monitoring and government supervision. This includes a joint supervision system and information sharing mechanism between local tax departments and water conservation departments.
Data Availability Statement
Publicly available datasets were analyzed in this study. This data can be found here: https://data.cnki.net/.
Author Contributions
All authors contributed to the study conception and design. Conceptualization, KL and ZC; methodology, WL and JW; software, WL and JW; validation, KL, WZ; formal analysis, KL, WZ; investigation, JW; resources, KL; data curation, JW; writing—original draft preparation, KL; writing—review and editing, ZC, FL; supervision, ZC; project administration, KL, FL. All authors read and approved the final manuscript.
Funding
This work was supported by the National Natural Science Foundation of China (Grant numbers 72004124 and 71704097).
Conflict of Interest
The authors declare that the research was conducted in the absence of any commercial or financial relationships that could be construed as a potential conflict of interest.
Publisher’s Note
All claims expressed in this article are solely those of the authors and do not necessarily represent those of their affiliated organizations, or those of the publisher, the editors and the reviewers. Any product that may be evaluated in this article, or claim that may be made by its manufacturer, is not guaranteed or endorsed by the publisher.
Acknowledgments
We would like to thank the National Natural Science Foundation of China.
Supplementary Material
The Supplementary Material for this article can be found online at: https://www.frontiersin.org/articles/10.3389/fenvs.2022.890187/full#supplementary-material
References
Babuna, P., Yang, X., and Bian, D. (2020). Water Use Inequality and Efficiency Assessments in the Yangtze River Economic Delta of China. Water 12 (6), 1709. doi:10.3390/w12061709
Cao, X., Zeng, W., Wu, M., Li, T., Chen, S., and Wang, W. (2021). Water Resources Efficiency Assessment in Crop Production from the Perspective of Water Footprint. J. Clean. Prod. 309, 127371. doi:10.1016/j.jclepro.2021.127371
Cazcarro, I., and Steenge, A. E. (2021). Theoretical and Empirical Characterization of Water as a Factor: Examples and Related Issues with the World Trade Model. Water 13 (4), 459. doi:10.3390/w13040459
Chen, Y., Yin, G., and Liu, K. (2021a). Regional Differences in the Industrial Water Use Efficiency of China: The Spatial Spillover Effect and Relevant Factors. Resour. Conservation Recycl. 167, 105239. doi:10.1016/j.resconrec.2020.105239
Chen, Z., Zhang, X., and Chen, F. (2021b). Do carbon Emission Trading Schemes Stimulate Green Innovation in Enterprises? Evidence from China. Technol. Forecast. Soc. Change 168, 120744. doi:10.1016/j.techfore.2021.120744
Cheng, M., Jin, J., and Jiang, H. (2021). Strong Impacts of Autumn Phenology on Grassland Ecosystem Water Use Efficiency on the Tibetan Plateau. Ecol. Indic. 126, 107682. doi:10.1016/j.ecolind.2021.107682
Deng, G., Li, L., and Song, Y. (2016). Provincial Water Use Efficiency Measurement and Factor Analysis in China: Based on SBM-DEA Model. Ecol. Indic. 69, 12–18. doi:10.1016/j.ecolind.2016.03.052
Deng, X., Jin, G., He, S., Wang, C., Li, Z., Wang, Z., et al. (2021). Research Progress and Prospect on Development Geography. J. Geogr. Sci. 31 (3), 437–455. doi:10.1007/s11442-021-1852-x
Dong, Y., Jin, G., Deng, X., and Wu, F. (2021). Multidimensional Measurement of Poverty and its Spatio-Temporal Dynamics in China from the Perspective of Development Geography. J. Geogr. Sci. 31 (1), 130–148. doi:10.1007/s11442-021-1836-x
Elahi, E., Khalid, Z., Tauni, M. Z., Zhang, H., and Lirong, X. (2021a). Extreme Weather Events Risk to Crop-Production and the Adaptation of Innovative Management Strategies to Mitigate the Risk: A Retrospective Survey of Rural Punjab, Pakistan, Technovation 4, 102255. doi:10.1016/j.technovation.2021.102255
Elahi, E., Khalid, Z., and Zhang, Z. (2022a). Understanding Farmers' Intention and Willingness to Install Renewable Energy Technology: A Solution to Reduce the Environmental Emissions of Agriculture. Appl. Energy 309, 118459. doi:10.1016/j.apenergy.2021.118459
Elahi, E., Zhang, H., Lirong, X., Khalid, Z., and Xu, H. (2021b). Understanding Cognitive and Socio-Psychological Factors Determining Farmers' Intentions to Use Improved Grassland: Implications of Land Use Policy for Sustainable Pasture Production. Land Use Policy 102, 105250. doi:10.1016/j.landusepol.2020.105250
Elahi, E., Zhang, Z., Khalid, Z., and Xu, H. (2022b). Application of an Artificial Neural Network to Optimise Energy Inputs: An Energy- and Cost-Saving Strategy for Commercial Poultry Farms. Energy 244, 123169. doi:10.1016/j.energy.2022.123169
Fu, R., Jin, G., Chen, J., and Ye, Y. (2021). The Effects of Poverty Alleviation Investment on Carbon Emissions in China Based on the Multiregional Input-Output Model. Technol. Forecast. Soc. Change 162, 120344. doi:10.1016/j.techfore.2020.120344
Guan, X.-j., Liang, S.-x., and Meng, Y. (2016). Evaluation of Water Resources Comprehensive Utilization Efficiency in the Yellow River Basin. Water Sci. Technol.-Water Supply 16 (6), 1561–1570. doi:10.2166/ws.2016.057
He, Y., Su, X., Ren, Y., Wang, X., and Ouyang, Z. (2020). Spatiotemporal Differentiation of Urban Water Resource Utilization Efficiency of Eco-Geographic Regions in China. Acta Ecol. Sin. 40 (20), 7464–7478. (in Chinese). doi:10.5846/stxb201909252010
Hu, J.-L., Wang, S.-C., and Yeh, F.-Y. (2006). Total-factor Water Efficiency of Regions in China. Resour. Policy 31 (4), 217–230. doi:10.1016/j.resourpol.2007.02.001
Huang, C., Liu, K., and Zhou, L. (2021b). Spatio-temporal Trends and Influencing Factors of PM2.5 Concentrations in Urban Agglomerations in China between 2000 and 2016. Environ. Sci. Pollut. Res. 28, 10988–11000. doi:10.1007/s11356-020-11357-z
Huang, Y., Huang, X., Xie, M., Cheng, W., and Shu, Q. (2021a). A Study on the Effects of Regional Differences on Agricultural Water Resource Utilization Efficiency Using Super-efficiency SBM Model. Sci. Rep. 11 (1), 9953. doi:10.1038/s41598-021-89293-2
Huong, L. T. T., Takahashi, Y., Nomura, H., Van Duy, L., Son, C. T., and Yabe, M. (2020). Water-use Efficiency of Alternative Pig Farming Systems in Vietnam. Resour. Conservation Recycl. 161, 104926. doi:10.1016/j.resconrec.2020.104926
Li, L., and Liu, B. L. (2020). Prospect for Major Issues of China’s Regional Economic Development during the 14th Five-Year pan Period. Manag. World 36 (5), 36–51. (in Chinese). doi:10.3969/j.issn.1002-5502.2020.05.004
Li, S., Cheng, J., and Wu, Q. (2008). Regional Difference of the Efficiency of Water Usage in China. China Popul. Resour. Environ. 18 (3), 215–220. (in Chinese). doi:10.3969/j.issn.1002-2104.2008.03.041
Liao, Z., Chen, Z., Xu, A., Gao, Q., Song, K., Liu, J., et al. (2021). Wastewater Treatment and Reuse Situations and Influential Factors in Major Asian Countries. J. Environ. Manag. 282, 111976. doi:10.1016/j.jenvman.2021.111976
Liu, K.-d., Yang, G.-l., and Yang, D.-g. (2020a). Industrial Water-Use Efficiency in China: Regional Heterogeneity and Incentives Identification. J. Clean. Prod. 258, 120828. doi:10.1016/j.jclepro.2020.120828
Liu, K.-d., Yang, G.-l., and Yang, D.-g. (2020b). Investigating Industrial Water-Use Efficiency in Mainland China: An Improved SBM-DEA Model. J. Environ. Manag. 270, 110859. doi:10.1016/j.jenvman.2020.110859
Liu, K., Xue, Y., Lan, Y., and Fu, Y. (2022). Agricultural Water Utilization Efficiency in China: Evaluation, Spatial Differences, and Related Factors. Water 14, 684. doi:10.3390/w14050684
Liu, L., Qu, J., Maraseni, T. N., Niu, Y., Zeng, J., Zhang, L., et al. (2020c). Household CO2 Emissions: Current Status and Future Perspectives. Int. J. Environ. Res. Public. Health. 17 (19), 7077. doi:10.3390/ijerph17197077
Liu, W. B., Meng, W., Li, X. X., and Zhang, D. Q. (2010). DEA Models with Undesirable Inputs and Outputs. Ann. Oper. Res. 173, 177–194. doi:10.1007/s10479-009-0587-3
Liu, Y., Zhuo, L., Varis, O., Fang, K., Liu, G., and Wu, P. (2021). Enhancing Water and Land Efficiency in Agricultural Production and Trade between Central Asia and China. Sci. Total Environ. 780, 146584. doi:10.1016/j.scitotenv.2021.146584
Lu, W., Liu, W., Hou, M., Deng, Y., Deng, Y., Zhou, B., et al. (2021). Spatial-Temporal Evolution Characteristics and Influencing Factors of Agricultural Water Use Efficiency in Northwest China-Based on a Super-DEA Model and a Spatial Panel Econometric Model. Water 13 (5), 632. doi:10.3390/w13050632
Meng, G., Guo, Z., and Li, J. (2021). The Dynamic Linkage Among Urbanisation, Industrialisation and Carbon Emissions in China: Insights from Spatiotemporal Effect. Sci. Total Environ. 760, 144042. doi:10.1016/j.scitotenv.2020.144042
Messner, S. F., Anselin, L., Baller, R. D., Hawkins, D. F., Deane, G., and Tolnay, S. E. (1999). The Spatial Patterning of County Homicide Rates: An Application of Exploratory Spatial Data Analysis. J. Quant. Criminol. 15, 423–450. doi:10.1023/A:1007544208712
Namaalwa, S., van Dam, A. A., Gettel, G. M., Kaggwa, R. C., Zsuffa, I., and Irvine, K. (2020). The Impact of Wastewater Discharge and Agriculture on Water Quality and Nutrient Retention of Namatala Wetland, Eastern Uganda. Front. Environ. Sci. 8, 148. doi:10.3389/fenvs.2020.00148
Pan, D., Hong, W., and Kong, F. (2020). Efficiency Evaluation of Urban Wastewater Treatment: Evidence from 113 Cities in the Yangtze River Economic Belt of China. J. Environ. Manag. 270, 110940. doi:10.1016/j.jenvman.2020.110940
Qi, W., Liu, S. H., and Jin, H. R. (2016). Applicability of the New Standard of City-Size Classification in China. Prog. Geogr. 35 (1), 47–56. (in Chinese). doi:10.18306/dlkxjz.2016.01.006
Shang, Y., Lu, S., Shang, L., Li, X., Shi, H., and Li, W. (2017). Decomposition of Industrial Water Use from 2003 to 2012 in Tianjin, China. Technol. Forecast. Soc. Change 116, 53–61. doi:10.1016/j.techfore.2016.11.010
Shi, C., Zeng, X., Yu, Q., Shen, J., and Li, A. (2021). Dynamic Evaluation and Spatiotemporal Evolution of China's Industrial Water Use Efficiency Considering Undesirable Output. Environ. Sci. Pollut. Res. 28, 20839–20853. doi:10.1007/s11356-020-11939-x
Sileshi, A., Awoke, A., Beyene, A., Stiers, I., and Triest, L. (2020). Water Purifying Capacity of Natural Riverine Wetlands in Relation to Their Ecological Quality. Front. Environ. Sci. 8, 39. doi:10.3389/fenvs.2020.00039
Song, M., Jin, G., and Yan, W. (2021). Which Pro-environmental Farming Behaviors Should Be Priorities for Funding? an Approach Based on Matching Ecosystem Services (ESs) Demand and Supply. J. Environ. Manag. 297, 113368. doi:10.1016/j.jenvman.2021.113368
Song, P., Wang, X., Wang, C., Lu, M., Chen, L., Kong, L., et al. (2020). Analysis of Agricultural Water Use Efficiency Based on Analytic Hierarchy Process and Fuzzy Comprehensive Evaluation in Xinjiang, China. Water 12 (11), 3266. doi:10.3390/w12113266
Tone, K. (2001). A Slacks-Based Measure of Efficiency in Data Envelopment Analysis. Eur. J. Operational Res. 130, 498–509. doi:10.1016/S0377-2217(99)00407-5
Wang, G., Lin, N., Zhou, X., Li, Z., and Deng, X. (2018a). Three-stage Data Envelopment Analysis of Agricultural Water Use Efficiency: A Case Study of the Heihe River Basin. Sustainability 10 (2), 568. doi:10.3390/su10020568
Wang, J. F., Li, X. H., Christakos, G., Liao, Y. L., Zhang, T., Gu, X., et al. (2010). Geographical Detectors‐Based Health Risk Assessment and its Application in the Neural Tube Defects Study of the Heshun Region, China. Int. J. Geogr. Inf. Sci. 24 (1), 107–127. doi:10.1080/13658810802443457
Wang, S., Gao, S., Huang, Y., and Shi, C. (2020). Spatiotemporal Evolution of Urban Carbon Emission Performance in China and Prediction of Future Trends. J. Geogr. Sci. 30 (5), 757–774. doi:10.1007/s11442-020-1754-3
Wang, S., Zhou, L., Wang, H., and Li, X. (2018b). Water Use Efficiency and its Influencing Factors in China: Based on the Data Envelopment Analysis (DEA)-Tobit Model. Water 10 (7), 832. doi:10.3390/w10070832
Wang, X. B., and Wang, Z. L. (2021). Research on the Impact of Environmental Regulation on Water Resources Utilization Efficiency in China Based on the SYS-GMM Model. Water Sci. Technol.-Water Supply 21, 3643–3656. doi:10.2166/ws.2021.126
Wei, J., Lei, Y., Yao, H., Ge, J., Wu, S., and Liu, L. (2021). Estimation and Influencing Factors of Agricultural Water Efficiency in the Yellow River Basin, China. J. Clean. Prod. 308, 127249. doi:10.1016/j.jclepro.2021.127249
Yang, F., Wang, D., Zhao, L., and Wei, F. (2021). Efficiency Evaluation for Regional Industrial Water Use and Wastewater Treatment Systems in China: A Dynamic Interactive Network Slacks-Based Measure Model. J. Environ. Manag. 279, 111721. doi:10.1016/j.jenvman.2020.111721
Yang, J., Liu, X., Ying, L., Chen, X., and Li, M. (2020). Correlation Analysis of Environmental Treatment, Sewage Treatment and Water Supply Efficiency in China. Sci. Total Environ. 708, 135128. doi:10.1016/j.scitotenv.2019.135128
Zhang, F., Jin, G., and Liu, G. (2021). Evaluation of Virtual Water Trade in the Yellow River Delta, China. Sci. Total Environ. 784, 147285. doi:10.1016/j.scitotenv.2021.147285
Zhang, H., Chen, H., Wu, M., Jin, W., Mao, G., and Long, R. (2020). Dynamic Evaluation and Internal Driving Factors of Water Resources Green Efficiency in China. Water 12 (9), 2360. doi:10.3390/w12092360
Zhang, W., Du, X., Huang, A., and Yin, H. (2019). Analysis and Comprehensive Evaluation of Water Use Efficiency in China. Water 11 (12), 2620. doi:10.3390/w11122620
Zhou, L., Zhou, C., Yang, F., Che, L., Wang, B., and Sun, D. (2019). Spatio-temporal Evolution and the Influencing Factors of PM2.5 in China between 2000 and 2015. J. Geogr. Sci. 29 (2), 253–270. doi:10.1007/s11442-019-1595-0
Keywords: urban water utilization efficiency, spatial difference, influencing factor, slacksbased measure of super-efficiency, exploratory spatial data analysis, geodetector
Citation: Liu K, Liu W, Wu J, Chen Z, Zhang W and Liu F (2022) Spatial Differences and Influencing Factors of Urban Water Utilization Efficiency in China. Front. Environ. Sci. 10:890187. doi: 10.3389/fenvs.2022.890187
Received: 05 March 2022; Accepted: 19 April 2022;
Published: 04 May 2022.
Edited by:
Jiashuo Li, Shandong University, ChinaReviewed by:
Xu Zhao, Shandong University, Weihai, ChinaEhsan Elahi, Shandong University of Technology, China
Copyright © 2022 Liu, Liu, Wu, Chen, Zhang and Liu. This is an open-access article distributed under the terms of the Creative Commons Attribution License (CC BY). The use, distribution or reproduction in other forums is permitted, provided the original author(s) and the copyright owner(s) are credited and that the original publication in this journal is cited, in accordance with accepted academic practice. No use, distribution or reproduction is permitted which does not comply with these terms.
*Correspondence: Zhongfei Chen, aG9uZ3llY3pmQDE2My5jb20=