
94% of researchers rate our articles as excellent or good
Learn more about the work of our research integrity team to safeguard the quality of each article we publish.
Find out more
ORIGINAL RESEARCH article
Front. Environ. Sci., 14 April 2022
Sec. Environmental Informatics and Remote Sensing
Volume 10 - 2022 | https://doi.org/10.3389/fenvs.2022.888901
This article is part of the Research TopicAdvanced Numerical and Spatial Analysis of Forest and Environmental ManagementView all 9 articles
 Sanja Manojlović1
 Mikica Sibinović1*Tanja Srejić1Ivan Novković1Marko V. Milošević2Dragica Gatarić1Ivana Carević1Natalija Batoćanin1
The intensity of soil erosion is the result of a combined action of natural factors and different human activities. This work aims to determine the factors controlling the change of soil erosion. Eleven watersheds from different parts of Serbia were used as the study area. An Erosion Potential Model was applied to estimate the soil erosion status of the watersheds in two periods, 1971 and 2010. The model indicated that the reduction of soil erosion intensity in the watersheds ranges from 12.4% to 82.7%. The statistical analysis examines quantitative relationships and combined effects between soil erosion and socio-economic and main physical-geographical determinants in watersheds. Watershed characteristics were divided into 5 classes, and within each class 22 variables were calculated: two variables relate to erosion, one to topography, two to land cover, seven to demographic and ten to agrarian variables. Correlation analysis and Principal Component Analysis (PCA) have been applied to understand the main variables that contribute to change soil erosion intensity. The PCA identified four components that can explain at least up to 79.06% of the variation of all variables. This study explores new indicators for correlations with changing soil erosion and provides decision makers with access to quantification for environmental impact assessment and decision-making for adequate soil conservation and management programs.
Soil erosion is one of the main components of global environmental change, affecting ecosystem, climate, water resources and agriculture. Soil erosion and degradation is recognized as a global problem of the 21st century, since 33% of earth’s land surface is affected by some type of soil degradation (Bini, 2009). The causes of soil erosion change are influenced by various physical factors including: topographical features such as slope characteristics, lithological composition, soil properties, as well as changes in climate (Lal, 2001; Sui et al., 2009). The impact of various socio-economic factors is also significant in reference to the sediment production and intensity of soil erosion and degradations. Agricultural expansion, excessive tillage, excessive grazing or crop residue removal, mining, construction and urban sprawl, and expansion of the road network have led to increased land degradation and soil erosion in different parts of the world (Karlen and Rice, 2015). Deforestation, long-term human settlement, overuse of agricultural lands without sustainable planning, cultural difficulties in accepting conservative land management practices, and wrong political decisions have increased the vulnerability of many soils to degradation and resulted in a serious decline in their functional capacity (Gunal et al., 2015). Therefore, changes in any of these factors across the landscape and/or over time will result in a change in the timing, magnitude, and the spatial distribution of soil erosion rates (Golosov et al., 2018). Soil is a non-renewable resource on human time scales with its vulnerability to degradation depending on complex interactions between processes, factors and causes occurring at a range of spatial and temporal scales (Lal, 2015). Sustainability of land resources is an important issue of modern times. Soil degradation can negatively impact agronomic production and also dampen economic growth, especially in countries where agriculture is the engine for economic development (Scherr, 2001). Therefore, it is increasingly emphasized that erosion control and sustainable water and land management require in-depth erosion studies (Ouallali et al., 2020), as well as recommendations to intensify the efforts to make citizens awareness of the impact of land degradation and the societal importance of soil conservation (Niacsu et al., 2021).
Soil erosion and degradations is one of the major threats to soils in the European Union, with a negative impact on ecosystem services, crop production, drinking water and carbon stocks. The European Commission’s Soil Thematic Strategy has identified soil erosion as a relevant issue for the European Union, and has proposed an approach to monitor soil erosion (Panagos et al., 2015). During the past decade, the problem of soil erosion has become part of the environmental agenda in the European Union (EU). Recent developmental policies in the European Commission (the Soil Thematic Strategy, the Common Agricultural Policy, Europe 2020) call for quantitative assessments of soil loss rates at the European level. The mean soil erosion rate in the EU is estimated to be 2.45 t/ha/yr. The modeling results suggest that, currently, ca. 25% of the EU land has erosion rates higher than the recommended sustainable threshold (2 t/ha/y) and more than 6% of agricultural lands suffer from severe erosion (11 t/ha/yr) (Panagos et al., 2020). Scientific and professional studies have identified many water-erosion models, classified into different spatial/temporal scales with various levels of complexity (Karydas et al., 2012). The Universal Soil Loss Equation–USLE (Wischmeier and Smith, 1978), Modified Universal Soil Loss Equation–MUSLE (Williams, 1975) and Revised Universal Soil Loss Equation–RUSLE (Renard et al., 1991) are most commonly used empirical models which estimate long-term average annual soil loss. Morgan-Morgan and Finney–MMF (Morgan et al., 1984), European Soil Erosion Model–EUROSEM (Morgan et al., 1994) and Pan–European Soil Erosion Risk Assessment–PESERA (Kirby et al., 2008) are the physical process-based models that are used to estimate soil loss. The Soil Erosion Model for the Mediterranean regions—SEMMED is also in use, whose main advantage lies in the fact that it simulates processes at the regional level (de Jong et al., 1999).
Globally recognized methods cannot be easily applied in different countries, most often due to inadequate monitoring of the parameters that appear in them. In order to analyze the changes, a widely used regional soil Erosion Potential model (EPM) was chosen to estimate the average loss of soil erosion. Erosion Potential Model (Gavrilović, 1972) and its modifications (Lazarevic, 1985; Tosić and Dragicevic, 2012), is still the most frequently used model at regional scales in Serbia. Numerous studies have confirmed the scientific verification of the EPM model. According to De Vente and Poesen’s research of eleven selected methods and models for soil erosion assessment (De Vente and Poesen, 2005), the EPM model was characterized as the most quantitative of all regional methods and models that were debated. Recent studies based on the integration of EPM, GIS and remote sensing have shown good results obtained from the modelling of soil loss (Stefanidis and Stathis, 2018; Elhag et al., 2019; Spalević et al., 2020; Mohammadi et al., 2021). For example, the IntErO model uses the EPM in its algorithm background (Chalise et al., 2019; Spalević et al., 2020). Also, the IntErO model based on the EPM and the MUSLE have been used to assess soil erosion in several basins (Ouallali et al., 2020). In a new approach to modeling, the G2 model adopts fundamental empirical equations from EPM and RUSLE (Karidas and Panagos 2018; Sakuno et al., 2020). The importance and achievements of erosion modeling are shown by many research works. Studies of different authors in the Balkans (Zorn and Komac, 2008; Tošić et al., 2012; Blinkov et al., 2013; Efthimiou et al., 2016; Manojlović et al., 2017; Dragičević et al., 2018; Lovrić and Tošić, 2018) and worldwide (Bazzoffi, 1985; Beyer, 1998; Fannetti and Vezzoli, 2007; Poggetti et al., 2019; Ouallali et al., 2020; Mohammadi et al., 2021) have shown that the results obtained by this model are very reliable and acceptable in a professional and scientific practice.
Considering that Serbia aspires to be an EU member, the studying of the factors that control changes in the soil erosion intensity should be an imperative for a national policy strategy. In this study, 11 mountain watersheds, located in different parts of Serbia, have been subjected to erosion studies. This review analyses the main natural components and human impacts associated with change in soil erosion intensity, and the main factors that explain the variability of indicators affecting soil erosion, particularly recent land use changes. In this context, the main objectives of this research are: 1) to determine the change in soil erosion intensity and 2) to investigate the main natural and socio-economic determinants of the change of soil erosion intensity for timely and better understanding of soil erosion rate in 11 mountain basins in Serbia and 3) to perform typological classification of watersheds based on dominant soil erosion control factors. In this study, a statistical approach was used to understand changes in the intensity of erosion of mountain basins in Serbia. Our approach is based on 22 variables used in the study. The relevance of our research is based on two statistical tools: Correlation analysis and Principal Component Analysis (PCA) performed on the considered variables contributing to the change of the soil erosion.
This study may provide an improved understanding of the influence of various factors on the change in soil erosion intensity and help guide the future research. Understanding of the main factors controlling soil erosion changes is essential in erosion control programs, ecological restoration and sustainable development of river geosystems. These analyses can be used therefore as a watershed erosion status estimator to prioritize land conservation initiatives and soils resources management. Also, the results of the study can be used for monitoring and evaluation of deagrarization and demographic processes through soil erosion protection indicators, that can be included in local, regional and national management plans.
The studied area of 11 mountain watersheds is located in Central Serbia, situated in the south of the Danube and the Sava river (Figure 1). The watersheds cover an area of 239–910 km2 (Table 1). These watersheds differ in terms of physical-geographical characteristics. The watersheds are all located in the Carpatho–Balkanides mountains, the Serbian-Macedonian mass, as well as parts of the Dinarides mountains. The topography of the watershed is characterized by mountain ranges, steep slopes, and deep valleys; and the average altitude ranges from 309 to 1145 m. These mountains regions have a typical continental climate. The average annual precipitation ranges between 600–1000 mm (Milovanović et al., 2017), with maximum precipitation in May and June (Gocić and Trajković, 2014). The highest clouds were recorded in February and May in these watersheds, especially in their highest parts (Valjarević et al., 2021).
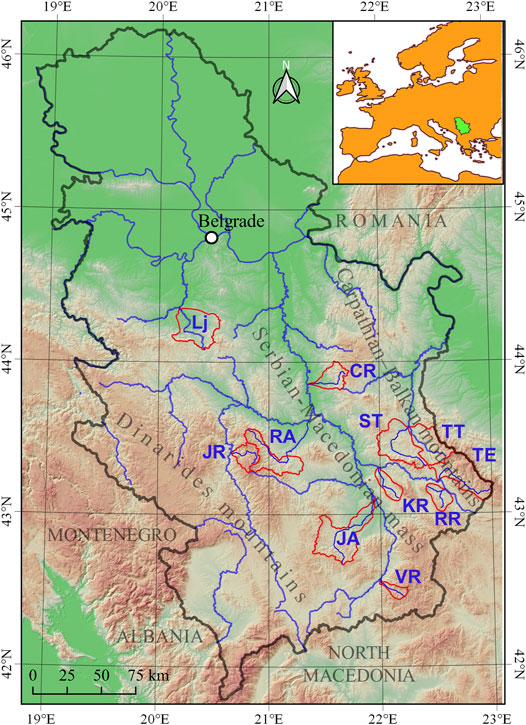
FIGURE 1. Location of mountains watershed in Serbia.
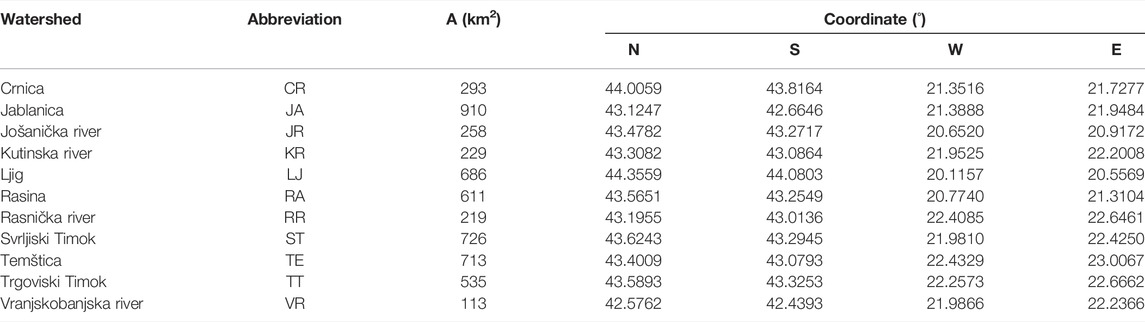
TABLE 1. Geographical position of 11 mountains watersheds ranked in alphabetical order.
Depending on the altitude, the average annual temperature ranges from 12°C in valley areas to 4°C on the highest parts of the mountains (Milovanović et al., 2018). According to the spatial distribution of specific runoff in Serbia, the value of specific runoff of the studied watershed is above the national average. The average specific runoff ranges from 5.4 L/s/km2 (Crnica river) to 10.7 L/s/km2 (Jošanica river) (Urošev et al., 2020). In general, according to hydrological characteristics, they belong to the category of torrent watersheds. Inventory of torrential floods in Serbia noted that largest number of floods was recorded in the Rasina, Crica, Ljig and Jablanica watersheds (Petrović, 2021).
Soil erosion is a process caused by the combined effect of physical and anthropogenic factors. Previous research has mainly focused on investigating the control factors of sediment transport. Research included geomorphic, hydrological studies, climate and lithological parameters, with or without any information on type of soils, vegetation or land use parameters (Restrepo et al., 2006; de Vente et al., 2011; Raux et al., 2011; Shi et al., 2014; Wuttichaikitcharoen and Babel, 2014; Buendia et al., 2016) or considering only some of them, such as topographic parameters (Cheng et al., 2017). Some studies are focused on rainfall-runoff events as the factors controlling the suspended sediment yield (Dominic et al., 2015; Fang et al., 2015). Walling and Fang (2003) reported that anthropogenic activities are the most predominant factors controlling suspended sediment and soil erosion. Examinations of the combined influences of topographic parameters and human activities (Duru et al., 2017), as well as the combined changes in land cover/land use and climate (Gusarov, 2021), contributed to the determination of the relative importance of physical and anthropogenic variables as a driving force for erosion and river suspended sediment load reduction. The paper Halder and Roy. (2021) has successfully predicted soil erosion-susceptible zone using 14 geo-environmental, hydrometeorological and anthropogenic conditioning factors as the input layers in the fuzzy AHP method. Some studies consider the impact of different human activities or socio-economic factors on soil erosion. The correlation and regression models identified socio-economic variables as predictor variables of soil erosion, and showed that soil erosion reduction was significantly influenced by education, occupation, farm size, migrated population and farm income (Bhandari et al., 2015). Several studies focus on specific issues regarding factors that change intensity of soil erosion in Serbia, such as direct impact of agriculture land use change and demographic change on sediment load and soil erosion (Manojlovic et al., 2017; Manojlovic et al. 2018; Manojlovic et al. 2021) or the effects of erosion control measures (Kostadinov et al., 2018).
Previous research in Serbia (Perović et al., 2016; Manojlović et al., 2017) has shown that the most important control factor in the intensity of soil erosion is land use change (represented in the EPM model as the X coefficient, and in the USLE model represented as the C factor). The correlation matrix of EPM model parameters at the statistical significance level of α = 0.05 (Manojlović et al., 2018), showed that the coefficient X has the major impact on the sediments gros erosion (W = f(X), r = 0.778). It is noticed that the climatic parameters (precipitation and temperature) that appear in the formula are not significant factors affecting on soil erosion. Namely, research in Serbia has shown that the annual scale results suggest no significant trend of precipitation in Serbia in the second half of the 20th century and the beginning of the 21st century (Luković et al., 2014). Also, studies of long-term time series of sediments in watersheds in Serbia have shown that changes in sediment transport were 89% affected by human activities (Manojlovic et al., 2021). In this context, the main focus of our research is to determine the trend of soil erosion intensity, as well as to determine the influence of major anthropogenic factors on changes in soil erosion intensity. Our research is based on some parameters not used in previous studies to understand changes in the intensity of soil erosion. The database comprises information on 11 watersheds across Serbia. Selected variables encompass a wide panel of different anthropogenic and several natural characteristics. Watershed characteristics were divided into 5 classes: erosion, topography, land cover, demographic and agriculture. Within these classes, 22 variables were derived that could potentially affect the change in soil erosion intensity. Table 2 provides an overview of the control variables. The principle data sources used for this study are presented in Table 3.
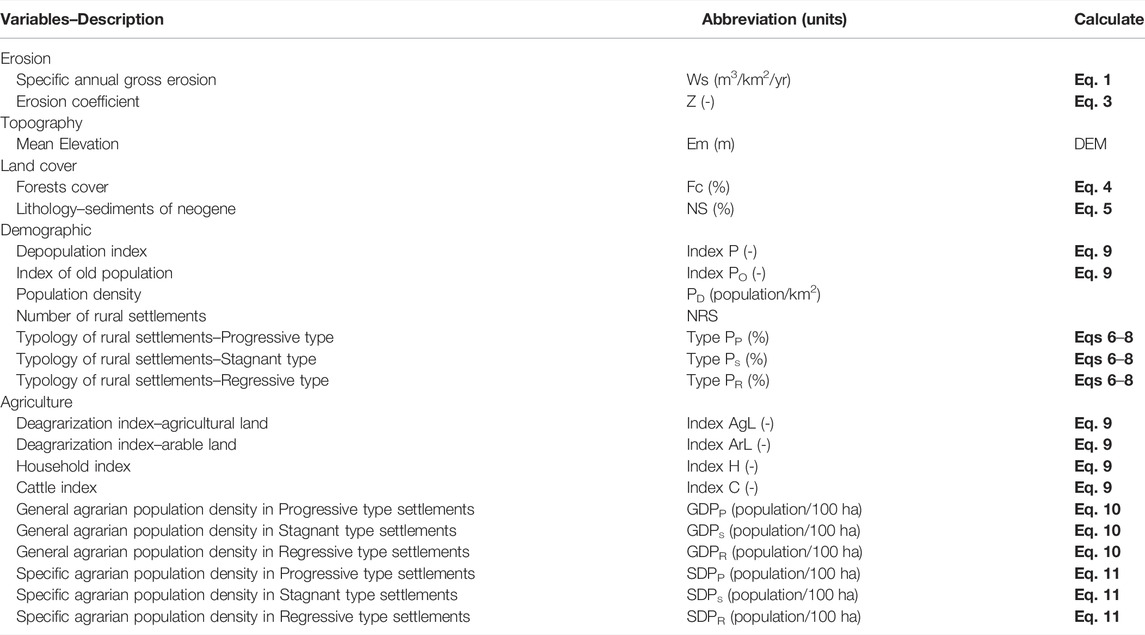
TABLE 2. Controlling variables used in correlation and PCA analysis.
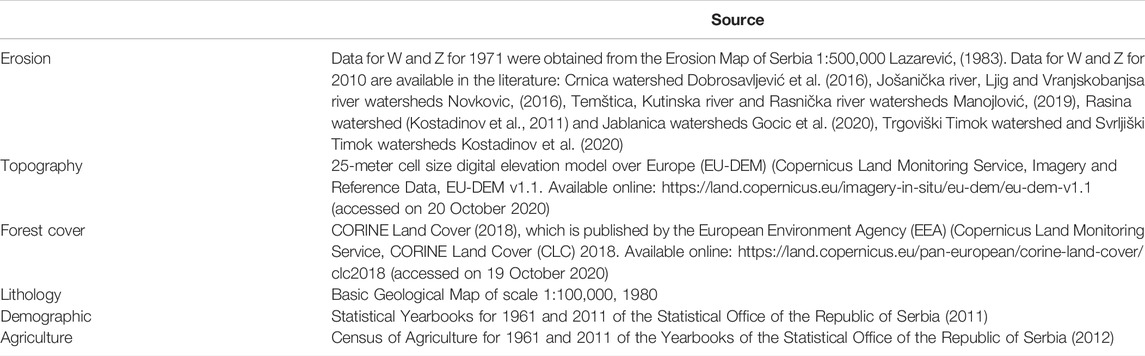
TABLE 3. Basic dataset sources used in the study.
The Erosion Potential Model (EPM) was used to calculate soil erosion intensity by Eq. 1:
where: W (m3/year)–total annual gross erosion, T–temperature coefficient, H (mm)–mean annual precipitation, Z–erosion coefficient and F (km2)–watershed area. The temperature coefficient (T) is calculated from the following Eq. 2:
where: t–the mean annual air temperature (°C).
The EPM model uses a scoring approach for three descriptive variables for calculated coefficient of erosion: coefficient of soil resistance, coefficient of soil protection and coefficient of type and extent of erosion (Table 4). The EPM erosion categorization is given in Table 5. The soil erosion coefficient (Z) can be calculated from the following Eq. 3:
where: Y–coefficient of soil resistance, X–soil protection coefficient, φ–erosion and stream network development coefficient and I (%)–average slope.
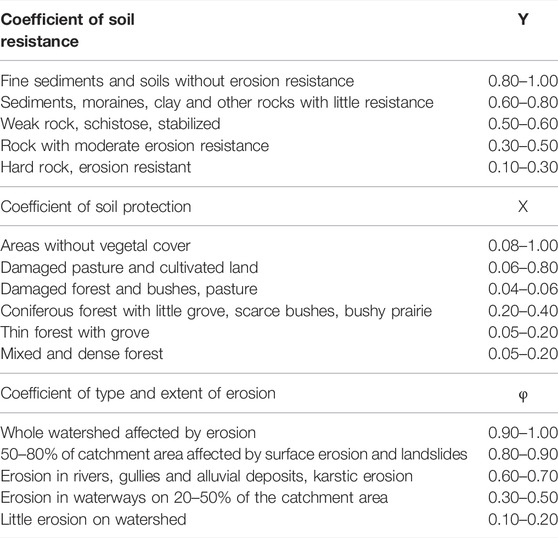
TABLE 4. Descriptive variables used in the erosion coefficient (Z).
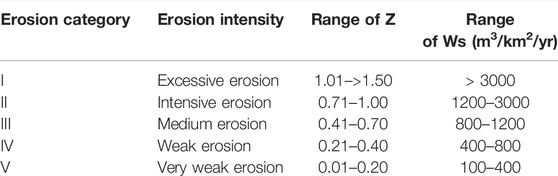
TABLE 5. EPM erosion categorization and range of erosion coefficient (Z) and specific annual gross erosion (Ws).
Forest information was obtained from the CORINE Land Cover by the European Environment Agency. The use of a forest cover (Fc) is thus essential and given as follows Eq. 4:
where: Af–forest area, A–total area of the catchment.
One lithology variable refers to the distribution of neogene sediments in the catchments. Considering that neogene sediments are the most sensitive to mechanical erosion, the study included a lithologic parameter (NS) calculated as follows Eq. 5:
where: ANS–neogen sediments area, A–total area of the catchment.
The method of Proportional Changes was used for the typology of rural settlements. Changes in rural population for the period 1961–2011 can be determined based on the analysis of proportional changes which defines the regional configuration of the processes of depopulation in the rural area (Antic et al., 2017; Manojlovic et al., 2018; Manojlovic et al., 2021).
where: PCj - absolute change in the number of population in each rural settlement individually, PEj0–rural population in 1961, PEj1–rural population in 2011, PNj–regional development component, PT1–total rural population in 2011; PT0–total rural population in 1961; PRj–net of relative component. The method of proportional changes enables the definition of different types of changes. The relative values of the two main components of change, in relation to the relative values of the Regional share component, define the following types of regional changes: Progressive type (Type PP), Stagnant type (Type PS), Regressive type (Type PR).
The process of deagrarization of rural areas of Serbia is significantly related to the processes of depopulation and senilization of rural settlements, as well as changes in the size of households and livestock (Sibinović, 2018). The intensity of different processes was calculated on the basis of base indices for each watershed separately, according to Eq. 8:
where: Indexj–depopulation index (Index P)/Index of old population (Index PO)/deagrarization index-agricultural land (Index AgL)/deagrarization index-arable land (Index ArL)/household index (Index H)/cattle index (Index C), Tj1–rural population/old population/agricultural land/arable land/household/cattle in 2011, Tj0–rural population/old population/agricultural land/arable land/household/cattle in 1961. Based on the obtained results, the index was classified according to the following scale: high Indexj<10, medium Indexj = 10–70, low Indexj>70–100, growth Indexj>100. Note–old population represents the share of rural population older than 65 years in the total rural population.
Furthermore, the changes in General agrarian population density (GD) explain the intensity of the two parallel processes of depopulation and deagrarization. General agrarian population density represents the human pressure on agricultural land.
where: GD–General agrarian population density, P–total rural population, Ag100–agricultural land (100 ha). Decreasing of rural population has been followed by decreasing in agricultural activity. Research on General agrarian population density gives better insight of the intensity level of processes of deagrarization and depopulation.
Specific agrarian population density (SD) provides the possibility of insight into the intensity of the process of agricultural production and the direct correlation of demographic and agricultural parameters. While arable land is a static category, the population is dynamic and can be engaged in agriculture and cultivate the land in several different places (municipalities or river basins).
where: SD–Specific agrarian population density, P–total rural population, Ag100–arable land (100 ha).
In this study, a statistical approach was used to understand the changes in the intensity of erosion of mountain basins in Serbia. Based on statistical analysis, classification and typology of watersheds was performed according to the dominant factors of changes in erosion intensity. The concept of typology is interpreted in different ways, but the basic function of the typology process is contained in the transformation of apparent specifics to the level of imaginary uniform order, where different predictions and projections can be made by recognizing characteristic factors. Therefore, typology can be viewed as a pragmatically conceived system of characteristics, shaped into a single conceptual pattern (Ayres and Knafle, 2008; Denford, 2013; Greenberg, 2019). According to (Todorović, 2002) typology can also be defined as a set of specific techniques in systems analysis, synthesis, identification, optimization and other methodological procedures (Todorović, 2002). Based on the logical scheme of the method of hypothetical deduction, the hypothetical statement shows that the given phenomenon will take place in a certain way, assuming that certain conditions are met. Different scientific interpretations of typology are the result of a complex methodological dilemma in which the essence of typology is not clearly defined, i.e., whether it represents a scientific discipline, method or basic principle of any theoretical-methodological procedure (Yeganeh, 2020). In this paper, typology has a hypothetical character that gives a clearer insight into the current state of influence of anthropogenic factors on the change of soil erosion intensity.
The types of mountain watersheds, according to the change of soil erosion intensity, are basically determined by the environmental characteristics of the territory, but the driving force of the change process is caused by anthropogenic factors, which are related to the processes of deagrarization, depopulation and senilization of rural settlements. Therefore, the typology of mountain watersheds implies consideration of the degree of causality of anthropogenic factors (economic, demographic, social and behavioral relations to production) and physical-geographical characteristics of an area. Defining the types of mountain watersheds by the method of factor analysis requires an adequate choice of parameters, which describe the area based on real characteristics.
The selected parameters (22 basic indicators) provide insight into mutually conditioned relations, erosion intensity, geological background, forest cover, demographic characteristics and agricultural production components. However, the basic problem of forming typological characteristics is contained in a large number of variables, which determine the attributes, properties and characteristics of the studied area. Based on previous papers that used methods of multivariate analysis, the algorithm for the analysis of basic components proved to be the most suitable for typology (Anderson, 2003; Tagliamonte and Baayen, 2012; Wuttichaikitcharoen and Babel, 2014; Sibinović, 2015; Matejka, 2017; Mizuta et al., 2018). Basically, factor analysis starts from the assumption that a high degree of correlation of two or more variables leads to their replacement by a common indicator. In this way, an insight into the unambiguous quantitative formulation of hidden structures is provided by defining new indicators that represent a complex of merged variables, inaccessible to direct observation. The mathematical procedure of factor analysis can be simplified through six phases (Kovačić, 1994; Ratkaj, 2009; Sibinović, 2015):
1. Defining the initial spatial information matrix, in which the number of columns m is equal to the number of spatial variables (baseline indicators), and the number of rows n, the number of territorial units (mountain watersheds in this study).
2. Calculation of a standardized spatial information matrix (Z), which represents the number of standard deviations from the mean value, is mathematically expressed as follows:
where:
3. Calculation of the matrix of the correlation coefficient of spatial variables (
where:
4. Factor isolation and formation of factor load matrix by analysis of the main component. The analysis of the main component implies the formulation of a linear combination of variables, which explains the maximum part of their variance. The factor loads for the main component can be calculated by the following equation:
on the basis of which it is possible to conclude that factor loads represent correlation coefficients between a certain variable and composite factors.
5. Analysis of factor load matrix rotations, is most often performed using the Varimax technique (variance maximization), i.e., the variant of orthogonal rotation, where the ratio of factor axes does not change–they remain orthogonal. The result of this rotation is the elimination of certain variables that are difficult to interpret.
6. Calculation of factor results is expressed by spatial data, which show the degree of connection between each territorial unit (mountain watersheds) and a given factor. All spatial indicators (base indicators) participate in the formation of the factor result, but their influence differs depending on the corresponding factor loads.
It is very important to emphasize that the correlation coefficient matrix should not be singular, i.e., its inverse matrix should not exist, which is why it is necessary to calculate the Kaiser-Meyer-Olkin (KMO) sample adequacy index and conduct Bartlett’s sphere test. KMO values close to unity indicate that the layout in the matrix is compact, which allows the definition of reliable factors. Also, for the successful implementation of factor analysis, it is necessary for the Bartlett test to be significant: p < 0.05. There are several different methods of grouping based on factor results, but in this paper the Ward method of hierarchical grouping with the square of Euclidean distance is applied, because in this way different groups with minimal internal variances are clearly separated. Ward’s method is characterized by a pronounced minimum sum of squares, because at the beginning of the algorithm, each territorial unit represents a group for itself (Kovačić, 1994; Sibinović, 2015), which is a necessary condition for defining types of mountain watersheds in this research.
The methodological procedure of factor analysis does not imply an explanation of the overall variability of selected baseline indicators. The subject of analysis is only a certain number of factors that determine a significant percentage of variability. The methodology for selecting the number of factors consists of the analysis of characteristic roots (λ) and the Scree diagram. The characteristic root interprets the variance of all base indicators of mountain watersheds explained by the isolated factor. Mathematically, it can be presented as the product of a part of the explained variance and the total number of diagnostic indicators.
The temporal distribution of the erosion coefficient (Z) and the specific annual gross erosion (Ws) are shown in Table 6. General tendency of erosion processes development during the period 1971–2011 is characterized by decreasing soil erosion processes intensity. The classification of watersheds according to the erosion category shows that in 1971 six watersheds were in the category III (medium erosion), four watersheds belonged to the IV category (weak erosion) and one watershed was in the I category (excessive erosion). Changes in the intensity of erosion over 40 years are evident. All watersheds belong to the IV category, which indicates a weak intensity of erosion. The largest changes in soil erosion were recorded in the VR watershed, where the erosion coefficient was reduced by 69% and specific annual gross erosion by 82.7%. At least a reduction of Z and Ws is either CR watershed, 7.7% and 12.4%, respectively. In other watersheds, the decrease in Z ranges from 14.4% to 42.9%, and the decrease in Ws ranges from 18.3% to 59.3%
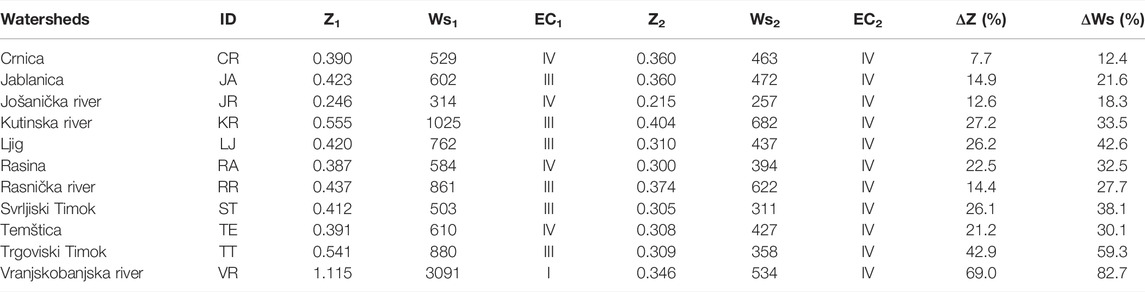
TABLE 6. Intensity of soil erosion in mountain watersheds (Erosion coefficient 1971 (Z1) and 2011 (Z2); Specific annual gross erosion 1971 (Ws1–m3/km2/yr) and 2011 (Ws2–m3/km2/yr); Erosion category 1971 (EC1) and 2011 (EC2); changes in the percentage ΔZ and ΔW for the period 1971–2011.
Mathematical interactions between various variables are described in the correlation matrix (Table 7). The applied statistical analysis shows the level dependence between selected variables. Values of correlations range from minimum r = −0.949 to maximum r = 0.898. Generally, the results of the study indicate a high correlation between the variables at a significance level of α = 0.05.
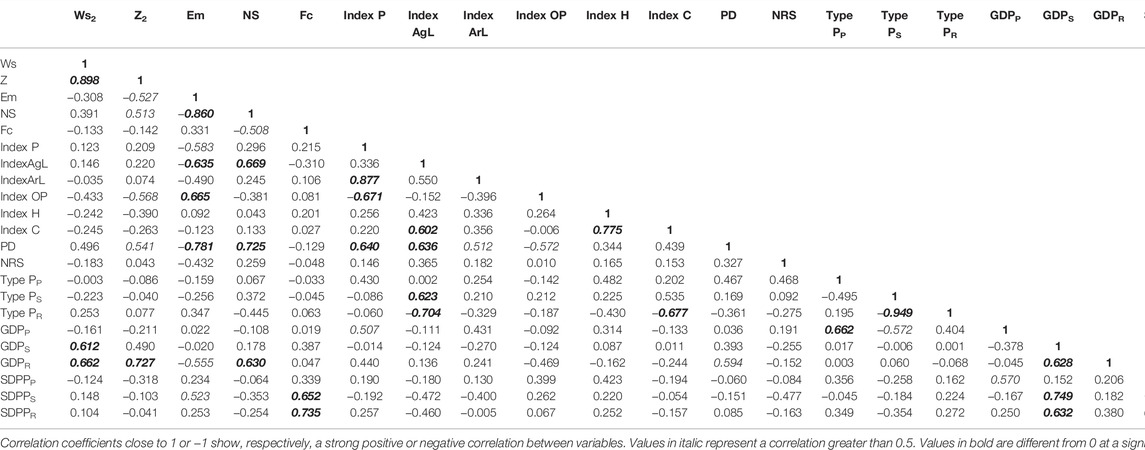
TABLE 7. Correlation matrix of Principal component analysis [Pearson (n)].
The results show that W is highly positively correlated with the erosion coefficient Z (r = 0.898). Z is negatively correlated with mean elevation (r = −0.527). Also, lithologic parameter is negatively correlated with mean elevation (r = −0.860). Positive correlation between lithological parameter and erosion coefficient (r = 0.513) is relatively high. In general, at lower altitudes, the areas under Neogene sediments are larger. Not surprisingly, basins that have large areas under neogene sediments have a large correlation between Z and NS parameters, since neogene sediments show strong erodibility. On the other hand, a very strong ratio of Em = f (Index AgL), Em = f (PD) and Em = f (Index PO) is explained by the fact that with increasing altitude, the process of deagrarization of agricultural land intensifies, population density is reduced and the share of old population increases. Additionally, the results show that correlations between NS and Index AgL and between NS and PD have positive values (r = 0.669 and r = 0.725, respectively). This indicates that in areas with a higher share of neogene sediments, the deagrarization process is low, which implies a higher population density of the rural areas. At the same time, the negative correlation of the relationship NS = f (Fc) indicates that with the increase of areas under neogene sediments, the share of forests decreases.
The process of deagrarization of agricultural areas is directly related to the depopulation process, which shows a high level of correlation (r = 0.877) for the AgL = f (Index P) relationship. Also, the process of deagrarization is positively correlated (r = 0.602) with the process of reduction of livestock (cattle) expressed as Index C. At the same time, the reduction of livestock is directly dependent on the process of reducing the number of households, which shows a high positive degree of correlation between Index C and Index H (r = 0.775). In fact, specific sediment production and erosion coefficient are directly related to available agricultural land in stagnant type settlements (Type PS) and regression type settlements (Type PR).
In this study the suitability of data for the analysis was assessed. The KMO score was 0.44 and Bartlett’s test of sphericity showed significance at p = 0.05, which supports the factorability of the cross-correlation. The order of significance of these variables is determined by the magnitude of their eigenvalues, as presented in Figure 2. The eigenvalues provide the explanation of the percentage of variance and the cumulative variance of the Principal Components. The first four principal components explain 79.06% of the total variance.
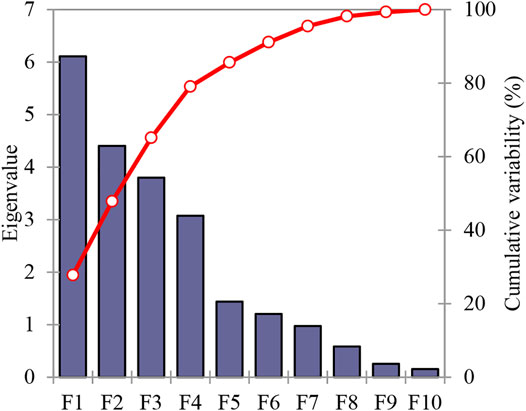
FIGURE 2. Eigenvalues and cumulative variance of principal components.
Data from PCA were subjected to Varimax rotation. After Varimax rotation, four components that determine the change in the intensity of soil erosion were grouped (Table 8). The first component explained 27.79% of the soil erosion variation in the data set. The second and third component explained 42.19% and 59.58% of the soil erosion. The addition of the fourth component increased the model-explained variance to 79.06%. The different variables considered in the PCA and their factor loadings after Varimax rotation are presented in Table 9. The square cosines of variables indicate the best-described variables on each principal component.
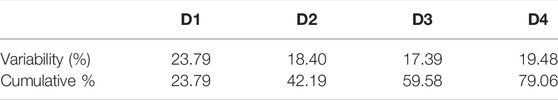
TABLE 8. Percentage of variance and cumulative variance after Varimax rotation.
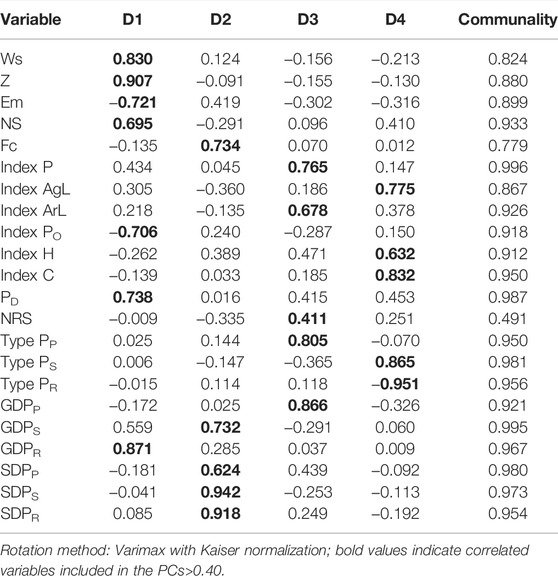
TABLE 9. Results after Varimax rotation.
Based on the obtained results of factor scores after Varimax rotation (Table 10), the typology of watersheds, according to the dominant variables of changes in soil erosion intensity was performed. There are four types of watersheds: 1) Population type, 2) Agricultural type of specific population density, 3) Demographic-agrarian type of progressive settlements and 4) Demographic-agrarian type of stagnant and regressive settlements. The spatial distribution of the typological classification of watersheds is given in Figure 3.
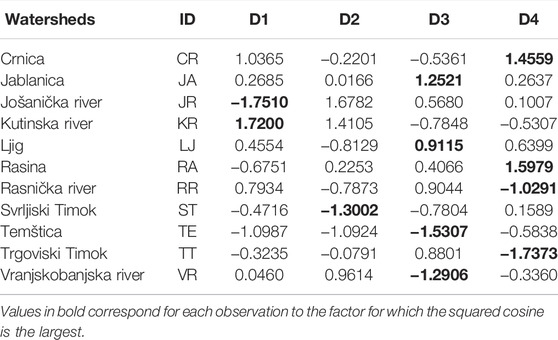
TABLE 10. Factor scores after Varimax rotation for watersheds.
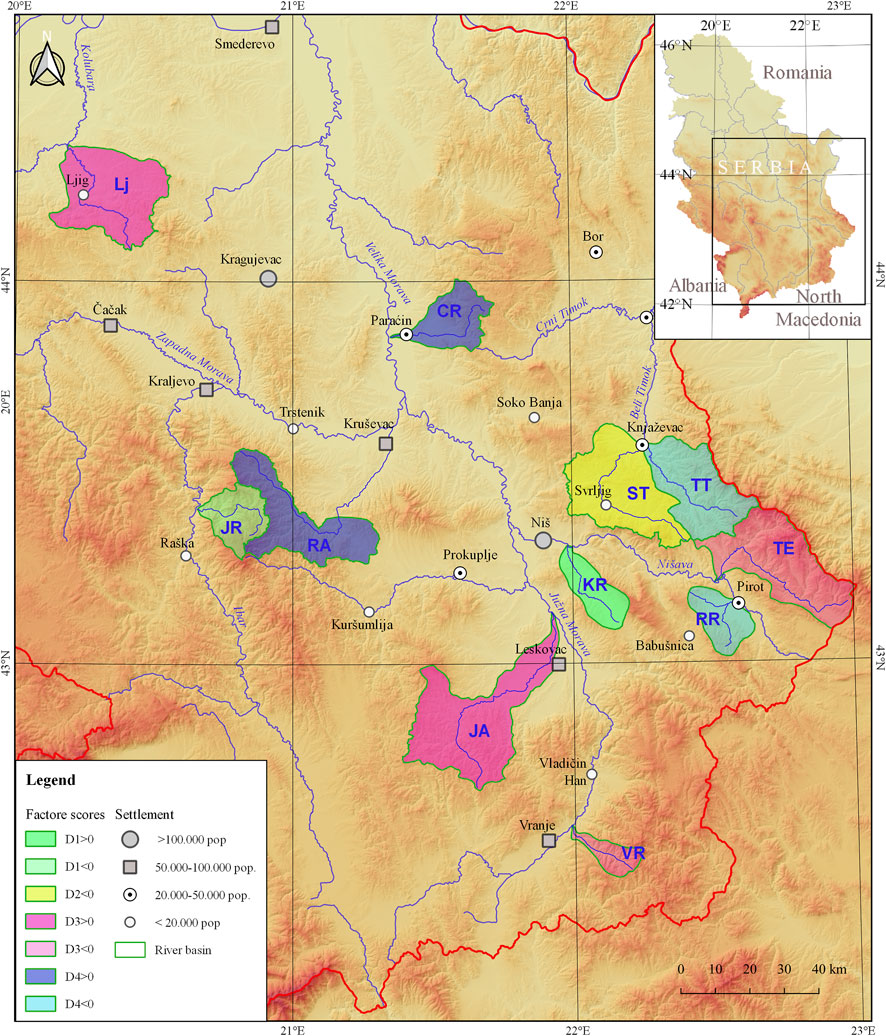
FIGURE 3. Spatial distribution of watersheds according to factor scores for dominant variables of changes in soil erosion intensity.
In this type of watershed, the first principal component explains 23.79% of the total variance and consists of Ws, Z, Em, NS, Index PO, PD and GDPP variables.
Population parameters show a high degree of load in this factor. Previous research indicates a high degree of correlation between the spatial distribution of settlements and the population when the altitude changes (Manojlović et al., 2018). Very high correlation Em = f (PD) is explained by the fact that the increase in altitude shows a decreasing trend of rural population, which is manifested by lower population density (PD). Consequently, the negative correlation of Index PO is manifested by an increase in the share of the population older than 65 with an increase in altitude. On the other hand, physical parameters are also highly correlated. Neogene sediments on the territory of Serbia spread mainly at lower altitudes. Not surprisingly, basins that have large areas under neogene sediments have a large correlation between erosion parameters, since neogene sediments show strong erodibility. At the same time, these are areas that are strongly anthropogenic in terms of agricultural production, which implies higher erosion rates. For this reason, the NS component is highly correlated with PD. The agrarian parameter of GDPR is also a significant indicator of changes in the intensity of soil erosion. Rural settlements of the Regressive type population change (PR type) dominate in all watersheds between 50–82% (Table 11), which implies a strong depopulation process over the last 50 years. Accordingly, the agrarian population density of agricultural areas is extremely low. Since settlements of this type are represented in all altitude zones (Figures 4, 5), there is a strong positive correlation between GDPR and Em. In general, as altitude decreases, the anthropogenic impact on arable land increases. Thus, the GDPR ranges from 19 populations/100 ha of agricultural land (in watersheds with higher Em and lower erosion rates) to 160 populations/100 ha of agricultural land (in watersheds with lower Em and higher erosion rates, for example Kutinska river watershed).
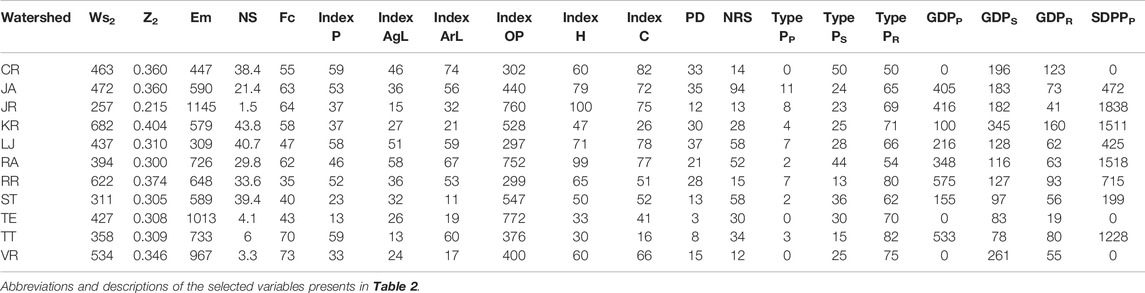
TABLE 11. Characteristics of the 11 mountains watershed.
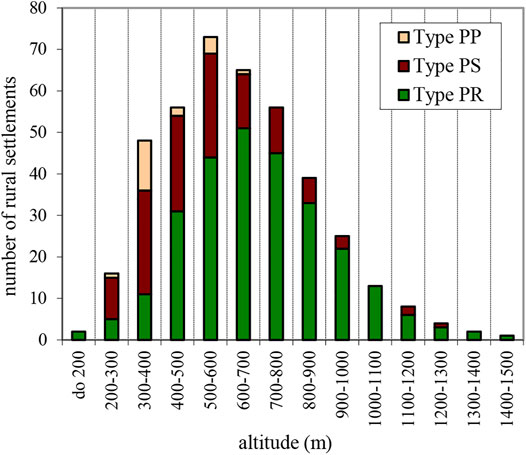
FIGURE 4. Spatial differentiation of rural settlements according to altitude (The figure presents 21 settlements of Progressive type population change–Type PP, 119 settlements of Stagnant type of population change–Type PS and 269 settlements of Regressive type of population change–Type PR).
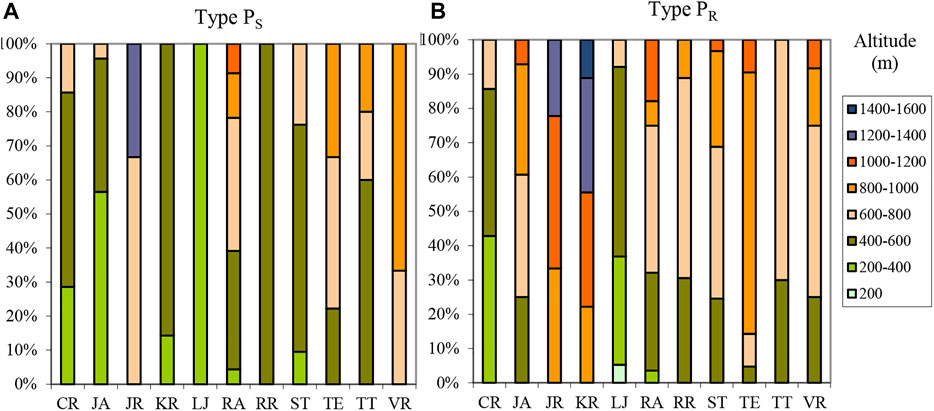
FIGURE 5. Altitude distribution of rural settlements Stagnant type of population change (Type PS) in mountain watersheds (A); Altitude distribution of rural settlements Regressive type of population change (Type PR) in mountain watersheds (B).
Factor scores after Varimax rotation showed that this component explains soil erosion in Kutinska river watershed and Jošanička river watershed (Table 10). These two basins represent opposites in the intensity of the erosive process. The Kutinska river watershed (KR) is characterized by an erosion reduction over time of 27.2% for Z and 33.5% for W (Table 6; Figure 6A). In addition to a significant reduction in erosion intensity, this watershed in 2010 has the highest erosion coefficient Z2 = 0.404 and a specific annual gross erosion of Ws2 = 682 m3/km2/yr compared to other catchments. High erosion rates are explained by the large share of Neogene sediments, which cover 43.8% of the catchment area, high agrarian population density and relatively low mean altitude of the catchment. Namely, the differentiation of rural settlements by altitude zones is clearly expressed in the watershed. All Type Ps settlements are located between 200–600 m, and all Type PR settlements above 800 m (Figure 5). Due to the proximity of Niš as a large urban center, the rural population of this area is market-oriented to agricultural production. Therefore, in all settlements, the values of agrarian population density are the highest in relation to other watersheds, and they are especially high in the regressive type of settlements.
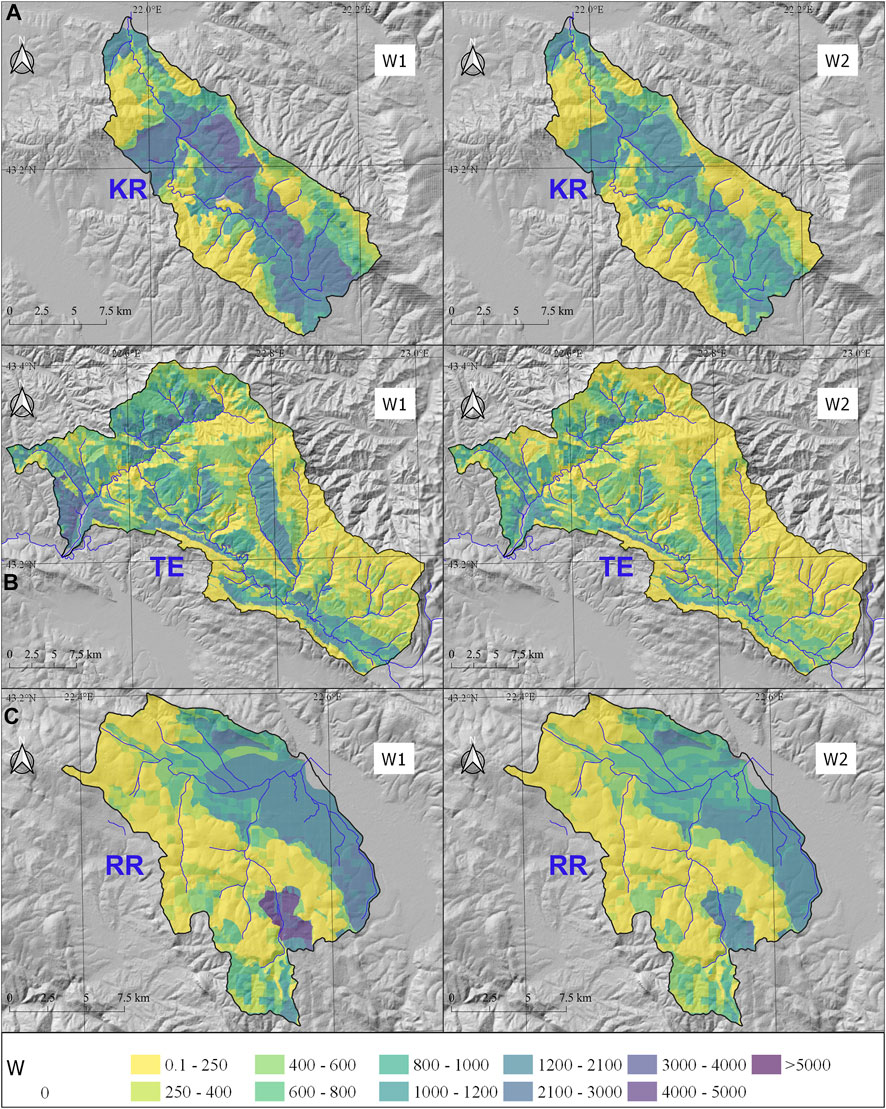
FIGURE 6. Specific annual gross erosion (Ws, m3/km2/yr) 1971 (W1) and 2010 (W2) for characteristic watersheds according to the typological classification. (A) Kutinska river (KR)–Population type (D1), (B) Temštica (TE)–Demographic-agrarian type of progressive settlements (D3) and (C) Rasnička river (RR)–Demographic-agrarian type of stagnant and regressive settlements (D4).
On the other hand, the Jošanička river watershed (JR) has the lowest values of erosion coefficient of Z2 = 0.215 and specific annual gross erosion of Ws2 = 257 m3/km2/yr. Low values of Z and W are explained by extremely small areas under neogene sediments, as well as high values of Index PO. The high mean elevation of Em = 1145 m implies a low population density (PD = 12 populations/km2). The isolation of this mountain basin in relation to regional urban centers was reflected in the process of demographic extinction of the rural population over time. High share of the population older than 65 years (Index PO = 760) and domination of Type PR settlements, has led to extremely low agricultural pressure on land (GDPR = 41 populations/100 ha of arable land), which is reflected in low rates of soil erosion.
In this type of watershed, the second principal component explains 18.40% of the total variance and consists of SDPP, SDPS, SDPR, GDPS and Fc variables.
This component is characterized by a high positive correlation with variables that have characteristics of anthropogenic pressure on arable land. The changes in erosion intensity explained by this component are characteristic of Svrljiški Timok watershed (ST). In general, this border part of Serbia is characterized by extremely low agricultural potential (Martinović and Ratkaj, 2015). Agrarian population density shows that its values are very low in all types of rural settlements. Both settlements of Type PP and 76% of settlements of Type PS are located in altitude zones up to 600 m (Figure 5). In settlements of Type PP and Type PS, the agrarian pressure on the land is record low in relation to all other watersheds, and the amounts of SDPP = 199 populations/100 ha of arable land and SDPS = 149 populations/100 ha of arable land, respectively. It is interesting that most settlements of Type PR settlements, spatially located in altitude zones up to 800 m, have a low anthropogenic pressure on the land (SDPP = 91 populations/100 ha of arable land).
This type of watershed includes the third principal component. This component explains 17.39% of the total variance and consists of Index P, Index ArL, Type PP, GDPP and NRS variables. This component has a high positive correlation with the parameters related to the process of depopulation and the process of deagrarization of arable land and the agrarian population density of agricultural areas in the progressive type of settlement. The Jablanica watershed (JA) and Ljig watershed (LJ) have a positive factor score. Also the largest number of rural settlements is located in these two watersheds, which shows a positive correlation of this component with the NRS parameter. Settlements are mostly located at lower altitudes, functionally connected to the proximity of important regional traffic infrastructure. This is especially pronounced for the settlements in Jablanica watershed, which are well connected with the corridor in the South Morava valley and well connected with the regional centers Leskovac and Nis. Due to these characteristics in particular, the processes of depopulation and deagrarization of arable land were the least intensive. This is due to the relatively high agrarian population density of GDPP = 405 populations/100 ha of arable land and to the relatively small reduction in erosion intensity, and the relatively low reduction in soil erosion intensity. The reduction of Z and W was 14.9 % and 21.6%, respectively.
On the other hand, the Temštica watershed (TE) and Vranjskobanjska river watershed (VR) have a negative factor score of this component. Small number of settlements and extreme deruralization are main features of these watersheds. The demographic depopulation of rural settlements was reflected in the disappearance of progressive type of settlements, as well as the intensive abandonment of arable land. These processes are indicated by the low values of Index P and Index ArL, which have record low values of Index p = 33 and Index ArL = 17 in the Vranjskobanjska river watershed and Index p = 13 and Index ArL = 19 in the Temštica watershed, respectively. In fact, a record depopulation was recorded in the Temštica watershed. In the period 1961–2010, the rural population decreased by 87%, which cause to a 30% redusction in soil erosion (Table 6; Figure 6B).
The demographic-agrarian type of stagnant and regressive settlements includes the fourth component. The fourth principal component explains 19.48% of the total variance and consists of Index AgL, Index H, Index C, Type PS and Type PR variables.
Indices AgL, H and C are positively correlated with Type PS. A higher Index AgL indicates a less pronounced process of deagrarization of agricultural land, which is directly related to a relatively stable livestock. The relative sustainability of the rural population is related to stagnant settlements (Type PS) and the abandonment of low-intensity agricultural land. In this context, the pronounced anthropogenic pressure on the land implies smaller changes in the intensity of soil erosion in the Crnica watershed (CR) and Rasina watershed (RA). In fact, the largest share of Type PS settlements is in these basins, 50% in CR and 46% in RA. The agricultural sector of the rural population is based primarily on livestock, which shows a relatively high Index C = 82 for CR and Index C = 77 for RA. Intensive cultivation of agricultural land in relation to other watersheds and relatively small reduction in the number of households, resulted in less reduction of soil erosion. Thus, the reduction of Z by only 7.7% and W by 12.4% in the Crnica watershed is the lowest, compared to all other watersheds.
On the other hand, Indices AgL, H and C are negatively correlated with Type PR. This means that a lower Index H implies a pronounced downward trend in the number of households. This is directly related to the process of intensive deagrarization and pronounced losses of livestock, with a larger share of Type PR settlements in the watersheds. The negative factor score of this component is characteristic of the basin Trgoviški Timok watershed (TT) and Rasnička river watershed (RR). The share of Type PR settlements is a record and amounts to 82% of the total number of settlements in the watershed. The values of Index H, Index AgL and Index C in TT watershed are record low (13, 30 and 16, respectively). The consequence of the abandonment in agricultural land, decrease number of household and livestock was a decrease in erosion rates by 42.9% for Z and 59.3% for W (Table 6). The relationship between factors explains the changes in soil erosion in the Rasnička river watershed (RR). The share of Type PR settlements of 80% implies that the deagrarization process in this basin is very pronounced (Index AgL = 36), which had affected the reduction of soil erosion for 27.7% (Table 6; Figure 6C).
From the above, it can be concluded that the relating watershed characteristics to soil erosion showed that component D1 and D4 explained the largest percentage (42.91%) of the variation in the data set. The square cosines of variables indicate the best-described variables on each of two principal components. The visualization of the variables space and the watershed space are presented by their axial plane on Figure 7. Based on the previous analysis, it can be concluded that out of a total of 22 analyzed parameters, 12 of them explain changes in soil erosion intensity in 6 studied watersheds.
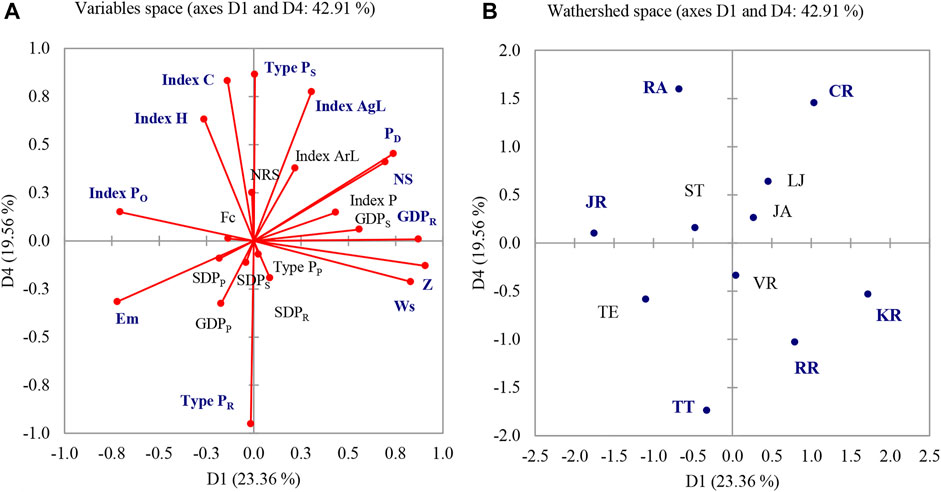
FIGURE 7. Weight plot of the D1 and D4 components (A) and watersheds space (B) (Weight plot of the predictors with the highest weights on the individual variables are highlighted with bold).
In addition, NRS and Fc show less commonality than the others, with scores of 0.491 and 0.779 (Table 9), respectively. Generally, these numbers suggest that a substantial portion of the variables variances is not accounted for by these two variables, and these are considered as less closely related to other variables and have less impact on soil erosion changes.
In the mid-20th century, soil erosion was a serious problem in certain regions in Serbia. Deforestation, changes in forested land, concurrent socio-economic changes, have affected the distribution and density of forests as a factor of land degradation (Valjarević et al., 2018). Also, agricultural expansion, excessive grazing, and expansion of the road network have led to increased soil erosion in different parts of the country. Generally, 27.04% of the territory of Serbia was affected by medium, intensive and excessive erosion (Lazarević, 1983). Over time, the intensity of erosion has decreased, which was especially recognizable in the mountainous areas of Serbia. During the period 1961–2011 in the analyzed watersheds in this study, the average erosion reduction rates were 0.31% per year to 2.07% per year for W and 0.19% per year to 1.72% per year for Z (Table 12). The main reason for changes in soil erosion is the process of deagrarization. Migrations of the population of rural areas to urban centers have led to a decrease in the number of farmers, which has resulted in changes in structural production and permanent abandonment of agricultural land and arable land. Between 1961 and 2011 in the analyzed watersheds in this study, the total reduction of agricultural land (AgL) was 169,236 ha, and arable land (ArL) 61647 ha, while the rural population decreased by 155,245 populations. Actually, the number of rural population decreased between 0.83% per year and 1.74 per year %. The rates of AgL and ArL reduced between 0.47–1.79% per year and 0.53–1.77% per year, respectively (Table 12). A similar trend has been observed in developed European countries, where the average annual decrease in rural population is 1.5% (Frey and Zimmer, 2001). Agricultural land abandonment represents one of the widespread phenomena in Europe. The trend of abandoning cultivated land is especially intensified in post-socialistic countries, as a result of technological, socio-economic, political, demographic and institutional changes (Muuler et al., 2009; Griffiths et al., 2013; Kuškova, 2013; Pasakarnis et al., 2013; Prishchepov et al., 2013; Pazur et al., 2014; Gusarov, 2021).
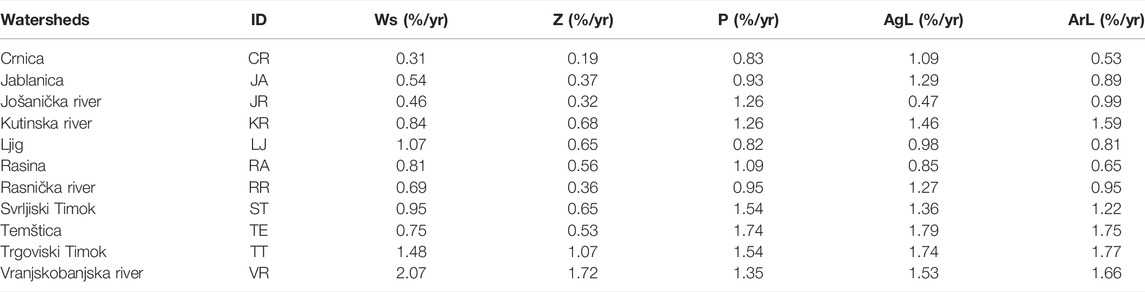
TABLE 12. Rates of the reduction of erosion, rural population, agricultural land and arable land.
The land use change processes are often triggered by European, national and sub-national policies and include widespread land abandonment and urbanization trends (Stellmes et al., 2013). The reduction in agricultural land and arable land in Serbia began gradually in the 1960s, and accelerated during the political and economic reform in Serbia in 1970s and 1980s, and continued after the collapse of the Socialistic Federative Republic of Yugoslavia (SFRJ) in the early 1990s. After the Second World War, economic activities throughout SFR Yugoslavia developed under the influence of central planning, i.e., the socialist model of economy, which was focused on the process of industrialization (Puljiz, 2002; Jordan, 2009; Sibinović, 2018; Gusarov, 2021). Due to the development of industry in urban settlements and significant needs for labor, during the 1960s there were intensive rural-urban migrations. Apart from the employment process, the relocation of the rural population to the cities was also caused by the lifestyle, the need for education, the lack of general living conditions in the countryside (low level of transport and telecommunication infrastructure), etc. The result of the decades-long process of rural-urban migration is the depopulation of rural areas of Serbia, followed by the processes of deagrarization and senilization (Bański, 2008; Mc Donagh, 2012). During the 1990s, in the conditions of the economic crisis caused by the civil war in SFR Yugoslavia and international sanctions, agricultural production became more and more subsidiary, less and less market (Ševarlić and Tomić, 2009; Hubbard and Gorton, 2011). Due to the international economic sanctions, agricultural production was dominantly oriented on self-use production. After the democratic changes in 2000, agriculture in Serbia is slowly beginning to regain its market character (Sibinović, 2018). Systematically organized agriculture is most represented exclusively in the vicinity of larger cities and in Vojvodina (84% of total cultivable land in Serbia, according to Stojanović, 2022), while other parts of rural Serbia are still affected by strong deagrarization and traditional forms of agriculture (economically underdeveloped areas). The dominant presence of plant production in the total agriculture of Serbia still indicates a low level of agricultural development. According to previous data, there are around 565,000 farms in Serbia (Stojanović, 2022). The modern way of cultivating the land represents a kind of compilation of the application of traditional and new agro-technical measures and procedures, which has an evident effect on the state of erosion intensity.
The process of deagrarization implies the abandonment of agricultural production by the population, despite being their only source of income and the only activity until then (Puljiz, 2002). Specific causes of the deagrarization process on the territory of the Republic of Serbia were political (favoring other economic branches), demographic (reduction of the active population due to rural-urban migration), property (fragmentation of property), economic (low level of earnings compared to labor) and social ones that explain pull-push factors by Everett Lee’s theory of Migration (Lee, 1966; Malaj and Rubertis, 2017). The consequences of this process were demographic and economic, and are reflected in changes in the socio-economic structure of the population and the functional transformation of settlements (Sibinović, 2015). During the studied period (1961–2011), rural deagrarization was predominantly present in the Republic of Serbia, and urban deagrarization sporadically, when agrarian areas in suburban zones were transformed into construction land. In this way, the rural-urban continuums become dynamic processes that are still present today.
After the intensified urbanization of 1970–1980, significant degradation of agriculture in rural settlements was noted (Drobnjaković, 2019). Unfavorable topography was an important determinant of the abandonment of agricultural and arable land. Mountainous, peripheral and border areas express deepest multifaceted decline in agriculture, and are presented with areas affected by extreme depopulation, population aging, economic shrinkage and nonsufficient infrastructural supply (Martinović and Ratkaj, 2015; Gajić et al., 2021). Industrial giants employed large number of populations, causing dramatic decrease in agricultural production. Urban employment opportunities caused the migration to be one of the most distinctive attributes of these mountainous rural areas (Nikitović et al., 2016). It manifested itself mainly in higher farm fragmentation and unprecedented livestock husbandry changes. The total number of households in the 11 studied basins decreased from 50904 to 32238, a reduction of 36.7%. The reduction in the number of households resulted in a reduction in livestock. The number of cattle decreased from 53529 to 33166, or 38%. At the same time with these processes, the share of the old population increased. Thus, in 1961 the proportion of the population over 65 in the total rural population was 6.7%, and in 2011 a record 27.3%. As a consequence of these processes, there was a widespread reduction of agricultural land. In fact, the result of reduction in agricultural land was a proportional increase in the area of abandoned land. Such uncultivated arable land quickly overgrows, first with weeds and then with zonal vegetation. Accordingly, research show (Gusarov, 2021) that a decrease in cultivated land significantly reduces process of soil erosion intensity since abandoned arable lands are covered over time by vegetation which does not differ from meadows in terms of soil protection properties.
The present study aimed to establish a framework for identifying the changes in soil erosion intensity and its driving factors for mountains watershed in Serbia. A dataset of soil erosion and related parameters, topography, geological data, forests cover, demographic and agricultural information were included in this analysis. The investigation of factors affecting the soil erosion is based on using the principal component analysis. From the principal component analysis (PCA), four components of dominant factors influencing soil erosion were identified. These factors contribute to 79.06% of the total variance of all variables considered in the analysis.
The dominant factors from each group were then taken as predictor variables for watersheds classification. By focusing on the major controlling factors driving the erosion rate response, our work also proposes a typology of the watersheds. This classification is based on the identification factor score after Varimax rotation of the obtained main components. Watersheds are classified into 4 types. Population type, which includes the Jošanička river watershed (JR) and Kutinska river watershed (KR), and Demographic-agrarian type of stagnant and regressive settlements, which includes watersheds of Crnica (CR), Rasina (RA), Rasnička river (RR) and Trgoviški Timok (TT), explained the largest percentage of 42.91% of the variation in the data set. In Population type basins, the share of old population and population density are the key factors of the change of soil erosion intensity. It should be noted that basins with a larger area of Neogene sediments have a higher rate of soil erosion. The process of deagrarization of agricultural land, which is highly significant with the reduction of the number of households and livestock, are the main factors of the reduction of soil erosion in Demographic-agrarian type of stagnant and regressive settlements. In addition, the results also indicated that the number of population cultivating arable land is the dominant factor, by means of which 18.40% of variance in the Svrljiški Timok watershed (ST) is explained, classified as an Agrarian type of specific population density. On the other hand, there are four factors that significantly influence (17.39% of variance) the change of soil erosion in the Demographic-agrarian type of progressive settlements of the watersheds. These factors are typical for the Jablanica (JA), Ljig (LJ), Temštica (TE) and Vranjskobanjska river (VR) watersheds, which are dominated by the processes of depopulation and deagrarization of arable land. The analysis showed that the variables in the number of rural settlements and forests cover have less impact on changes in soil erosion intensity. This study highlights the drastic effects that socio-economic changes can have on land-use change. Deagrarization and depopulation processes were the key drivers of land abandonment, and reducing of soil erosion.
This approach exhibits great potential for use in other regions, which would be adapted to local and regional physical-geographical and socio-economic conditions. Future research on changes in erosion intensity should take into account current data, based on the application of remote sensing. Therefore, multispectral satellite images, such as those from Landsat, Sentinel-2 or similar missions, would be of great importance. The analysis and classification of multispectral images could monitor changes in land use/land cover at the level of different spatial scale (watersheds, regions, municipalities, settlements), as one of the basic factors influencing the intensity of erosive processes. Understanding the soil erosion patterns and causes is a crucial prerequisite of adequate soil management, ecological restoration of the watersheds and revitalization of rural areas.
The original contributions presented in the study are included in the article/Supplementary Material, further inquiries can be directed to the corresponding author.
Conceptualization, SM and MS; methodology, SM, MS and TS; software, IC and IN; validation, IC, MS and NB; formal analysis, SM and MS; investigation, DG; resources, NB; data curation, MM; writing—original draft preparation, SM and MS; writing—review and editing, MS; visualization, MM; supervision, SM; project administration, TS.
This research was funded by Ministry of Education, Science, and Technological Development of the Republic of Serbia, project nioid200091.
The authors declare that the research was conducted in the absence of any commercial or financial relationships that could be construed as a potential conflict of interest.
All claims expressed in this article are solely those of the authors and do not necessarily represent those of their affiliated organizations, or those of the publisher, the editors and the reviewers. Any product that may be evaluated in this article, or claim that may be made by its manufacturer, is not guaranteed or endorsed by the publisher.
The authors thanks to editor AV and to reviewers for valuable comments. Their suggestions have been of great help and enhanced the quality of this study. We also thanks to Dejan Sandić for technical support in GIS.
Anderson, T. W. (2003). An Introduction to Multivariate Statistical Analysis. Stanford, CA: John Wiley & Sons.
Antić, M., Šantić, D., Kašanin-Grubin, M., and Malić, A. (2017). Sustainable Rural Development in Serbia—Relationship between Population Dynamics and Environment. J. Environ. Prot. Ecol. 18, 323–331.
Ayres, L., and Knafle, A. (2008). “Typological Analysis,” in Sage Encyclopedia of Qualitative Research Methods. Editor M. Given (Thousand Oaks, CA: Sage).
Bański, J. (2008). Agriculture of Central Europe in the Period of Economic Transformation. Rural Stud. 15, 9–22.
Bazzoffi, P. (1985). Methods for Net Erosion Measurement in Watersheds as a Tool for the Val-Idation of Models in central Italy, Workshop on Soil Erosion and Hillslope Hydrology with Em-Phasis on Higher Magnitude Events. Leuven.
Beyer, P., N. (1998). Erosion des bassins versant alpins suisses par ruissellement de surface. Laussanne (CH): University of Switzerland. [dissertation thesis].
Bhandari, K. P., Aryal, J., and Darnsawasdi, R. (2015). A Geospatial Approach to Assessing Soil Erosion in a Watershed by Integrating Socio-Economic Determinants and the RUSLE Model. Nat. Hazards 75, 321–342. doi:10.1007/s11069-014-1321-2
Bini, C. S. (2009). “A Precious Natural Resource,” in Conservation of Natural Resources. Editor N. J. Kudrow (Hauppauge, NY, USA: Nova Science Publishers).
Blinkov, I., Ts. Marinov, I., and Kostadinov, S. (2013). Comparison of Erosion and Erosion Control Works in Macedonia, Serbia and Bulgaria. Int. Soil Water Conserv. Res. 1, 3. doi:10.1016/s2095-6339(15)30027-7
Buendia, C., Herrero, A., Sabater, S., and Batalla, R. J. (2016). An Appraisal of the Sediment Yield in Western Mediterranean River Basins. Sci. Total Environ. 572, 538–553. doi:10.1016/j.scitotenv.2016.08.065
Chalise, D., Kumar, L., Spalevic, V., and Skataric, G. (2019). Estimation of Sediment Yield and Maximum Outflow Using the IntErO Model in the Sarada River Basin of Nepal. Water 11 (5), 952. doi:10.3390/w11050952
Cheng, N. N., He, H. M., Yang, S. Y., LuJing, Y. J. Z. W., and Jing, Z. W. (2017). Impacts of Topography on Sediment Discharge in Loess Plateau, China. Quat. Int. 440, 119–129. doi:10.1016/j.quaint.2016.12.005
Copernicus Land Monitoring Service (2018). CORINE Land Cover (CLC). Available at: https://land.copernicus.eu/pan-european/corine-land-cover/clc2018.
Copernicus Land Monitoring Service (2020). Imagery and Reference Data, EU-DEM v1.1. Available at: https://land.copernicus.eu/imagery-in-situ/eu-dem/eu-dem-v1.1.
de JongParacchini, S. M. M. L., Paracchini, M. L., Bertolo, F., Folving, S., Megier, J., and de Roo, A. P. J. (1999). Regional Assessment of Soil Erosion Using the Distributed Model SEMMED and Remotely Sensed Data. Catena 37, 291–308. doi:10.1016/s0341-8162(99)00038-7
De Vente, J., and Poesen, J. (2005). Predicting Soil Erosion and Sediment Yield at the basin Scale: Scale Issues and Semi-quantitative Models. Earth-Science Rev. 71, 95–125. doi:10.1016/j.earscirev.2005.02.002
De Vente, J., Verduyn, R., Verstraeten, G., Vanmaercke, M., and Poesen, J. (2011). Factors Controlling Sediment Yield at the Catchment Scale in NW Mediterranean Geoecosystems. J. Soils Sediments 11, 690–707. doi:10.1007/s11368-011-0346-3
Denford, J. S. (2013). Building Knowledge: Developing a Knowledge‐based Dynamic Capabilities Typology. J. Knowl. Manag. 17 (2), 175–194. doi:10.1108/13673271311315150
Dobrosavljević, T., Mustafić, S., and Gocić, M. (2016). in Mechanical water erosion in the Crnica basin” in Proceedings of the 6th Scientific-professional conference with international participation Local self-government in planning and arrangement of space and settlements. Editors D. Filipović, V. Šećerov, and Z. Radosavljević (Vršac, Serbia: Serbian Spatial Planners Association, University of Belgrade—Faculty of Geography), 445–452.
Dominic, J. A., Aris, A. Z., and Sulaiman, W. N. A. (2015). Factors Controlling the Suspended Sediment Yield during Rainfall Events of Dry and Wet Weather Conditions in A Tropical Urban Catchment. Water Resour. Manage. 29, 4519–4538. doi:10.1007/s11269-015-1073-0
Dragičević, N., Karleuša, B., and Ožanić, N. (2018). Modification of Erosion Potential Method Using Climate and Land Cover Parameters. Geomatics, Nat. Hazards Risk 9, 1. doi:10.1080/19475705.2018.1496483
Drobnjaković, M. (2019). Development Role of the Rural Settlements in Central Serbia. J. Geographical Inst. “Jovan Cvijić” SASA. Spec. Issues No 95, 1–256.
Duru, U., Wohl, E., and Ahmadi, M. (2017). Factors Controlling Sediment Load in the Central Anatolia Region of Turkey: Ankara River Basin. Environ. Manage. 59 (5), 826–841. doi:10.1007/s00267-016-0818-8
Efthimiou, N., Lykoudi, E., Panagoulia, D., and Karavitis, C. (2016). Assessment of Soil Suscep-Tibility to Erosion Using the EPM and RUSLE MODELS: The Case of Venetikos River Catch-Ment. Glob. NEST J. 18 (1), 164–179.
Elhag, M., Kojchevska, T., and Boteva, S. (2019). “EPM for Soil Loss Estimation in Different Geomorphologic Conditions and Data Conversion by Using GIS,” in IOP Conference Series: Earth and Environmental Science (Prague, Czech Republic. Volume 221, World Multidisciplinary Earth Sciences Symposium (WMESS 2018) 3–7 September 2018.
Fang, N., Shi, Z., Chen, F., and Wang, Y. (2015). Partial Least Squares Regression for Determining the Control Factors for Runoff and Suspended Sediment Yield during Rainfall Events. Water 7 (7), 3925–3942. doi:10.3390/w7073925
Fannetti, D., and Vezzoli, L. (2007). Sediment Input and Evolution of Lacustrine Deltas: The Breggia and Greggio Rivers Case Study (Lake Como, Italy). Quat. Int. 173-174 (Suppl. L), 113–124.
Frey, W. H., and Zimmer, Z. (2001). “Defining the City,” in Handbook of Urban Studies. Editor R. Paddison (London, UK): SAGE Publications), 14–35.
Gajić, A., Krunić, N., and Protić, B. (2021). Classification of Rural Areas in Serbia: Framework and Implications for Spatial Planning. Sustainability 13 (4), 1596. doi:10.3390/su13041596
Gavrilović, S. (1972). Inženjering O Bujičnim Tokovima I Eroziji. Serbian: Izgradnja, special edition.
Geološki zavod Srbije (1978). Basic Geological Map of Former Yugoslavia 1:100 000. Belgrade, Serbia: Federal Geological Survey.
Gocić, M., Dragićević, S., Radivojević, A., Martić Bursać, N., Stričević, L., and Đorđević, M. (2020). Changes in Soil Erosion Intensity Caused by Land Use and Demographic Changes in the Jablanica River Basin, Serbia. Agriculture 10 (8), 345. doi:10.3390/agriculture10080345
Gocic, M., and Trajkovic, S. (2014). Spatio-temporal Patterns of Precipitation in Serbia. Theor. Appl. Climatol. 117, 419–431. doi:10.1007/s00704-013-1017-7
Golosov, V., Koiter, A., Ivanov, M., Maltsev, K., Gusarov, A., Sharifullin, A., et al. (2018). Assessment of Soil Erosion Rate Trends in Two Agricultural Regions of European Russia for the Last 60 Years. J. Soils Sediments 18, 3388–3403. doi:10.1007/s11368-018-2032-1
Greenberg, J. H. (2019). “The Typological Method,” in Diachronic, Areal, and Typological Linguistics. Editor H. M. Hoenigswald (Berlin, Boston: De Gruyter Mouton), 149–194.
Griffiths, P., Müller, D., Kuemmerle, T., and Hostert, P. (2013). Agricultural Land Change in the Carpathian Ecoregion after the Breakdown of Socialism and Expansion of the European Union. Environ. Res. Lett. 8, 045024. doi:10.1088/1748-9326/8/4/045024
Günal, H., Korucu, T., Birkas, M., Özgöz, E., and Halbac-Cotoara-Zamfir, R. (2015). Threats to Sustainability of Soil Functions in Central and Southeast Europe. Sustainability 7 (2), 2161–2188. doi:10.3390/su7022161
Gusarov, A. V. (2021). Land-Use/-Cover Changes and Their Effect on Soil Erosion and River Suspended Sediment Load in Different Landscape Zones of European Russia during 1970-2017. Water 13 (12), 1631. doi:10.3390/w13121631
HalderRoy, S. M. B., Roy, M. B., and Roy, P. K. (2021). Modelling Soil Erosion Risk of a Tropical Plateau basin to Identify Priority Areas for Conservation. Environ. Earth Sci. 80, 646. doi:10.1007/s12665-021-09941-8
Hubbard, C., and Gorton, M. (2011). Placing Agriculture within Rural Development: Evidence from EU Case Studies. Environ. Plann. C Gov Pol. 29, 80–95. doi:10.1068/c1031r
Jordan, P. (2009). Development of Rural Space in post-communist Southeast Europe after 1989: A Comparative Analysis. Revija Za geografijo - J. Geogr. 4 (1), 89–102.
Karlen, D., and Rice, C. (2015). Soil Degradation: Will Humankind Ever Learn? Sustainability 7 (9), 12490–12501. doi:10.3390/su70912490
Karydas, C. G., Panagos, P., and Gitas, I. Z. (2012). A Classification of Water Erosion Models According to Their Geospatial Characteristics. Int. J. Digital Earth 7 (3), 229–250. doi:10.1080/17538947.2012.671380
Karydas, C. G., and Panagos, P. (2018). The G2 Erosion Model: An Algorithm for Month-Time Step Assessments. Environ. Res. 161, 256–267. doi:10.1016/j.envres.2017.11.010
Kirby, M. J., Irvine, B. J., Jones, R. J. A., and Goveres, G. (2008). The PESERA Coarse Scale Erosion Model for Europe. I. – Model Rationale and Implementation. Eur. J. Soil Sci. 59, 1293–1306.
Kostadinov, S., Braunović, S., Dragićević, S., Zlatić, M., Dragović, N., and Rakonjac, N. (2018). Effects of Erosion Control Works: Case Study-Grdelica Gorge, the South Morava River (Serbia). Water 10 (8), 1094. doi:10.3390/w10081094
Kostadinov, S., Rakonjac, Lj., Stefanović, T., Jotov, E., Bilibajkić, S., Momirović, N., et al. (2020). Studija Ugroženosti Puteva I I II Reda Od Pojave Poplava U Slivu Timoka. (Study of Vulnerability of Roads First and Second Category of the Flood in the Timok River Basin). BelgradeBelgrade: Institute of ForestryUniversity of Belgrade-Faculty of Geography. (in Serbian).
Kostadinov, S., Zlatić, M., Dragićević, S., Novković, I., Košanin, O., Borisavljević, A., et al. (2014). Anthropogenic Influence on Erosion Intensity Changes in the Rasina River Watershed - central Serbia. Fresenius Environ. Bull. 23 (1 A), 254–263.
Kovačić, Z. (1994). Multivarijaciona Analiza (Eng. Multivariate Analysis). Belgrade: Faculty of Economy.
Kuškova, P. G. (2013). A Case Study of the Czech Agriculture since 1918 in a Socio-Metabolic Perspective– from Land Reform through Nationalisation to Privatisation. Land Use Policy 30, 592–603.
Lal, R. (2015). Restoring Soil Quality to Mitigate Soil Degradation. Sustainability 7 (5), 5875–5895. doi:10.3390/su7055875
Lazarević, R. (1985). Novi Postupak Za Odredjivanje Koeficijenata Erozije (Z) (New Procedure for Determining Erosion Coefficients (Z)). Erozija 13, 54–61. (in Serbian).
Lazarević, R. (1983). The Erosion Map of Serbia. Scale 1:500000. Belgrade, Serbia: Institute of Forestry.
Lovric, N., and Tosic, R. (2018). Assessment of Soil Erosion and Sediment Yield Using Erosion Potential Method: Case Study - Vrbas River basin (B&H). B Serbian Geogr. 98 (1), 1–14. doi:10.2298/gsgd180215002l
Luković, J., Bajat, B., Blagojević, D., and Kilibarda, M. (2014). Spatial Pattern of Recent Rainfall Trends in Serbia (1961–2009). Reg. Environ. Change 14 (5), 1789–1799.
Malaj, V., and De Rubertis, S. (2017). Determinants of Migration and the Gravity Model of Migration - Application on Western Balkan Emigration Flows. Migrat. Lett. 14 (2), 204–220. doi:10.33182/ml.v14i2.327
Manojlović, S., Antić, M., Šantić, D., Sibinović, M., Carević, I., and Srejić, T. (2018). Anthropogenic Impact on Erosion Intensity: Case Study of Rural Areas of Pirot and Dimitrovgrad Municipalities, Serbia. Sustainability 10 (3), 826. doi:10.3390/su10030826
Manojlović, S., Antić, M., Sibinović, M., Dragicević, S., and Novković, I. (2017). Soil Erosion Response to Demographic and Land Use Changes in the Nišava River basin, Serbia. Fresenius Environ. Bull. 26, 7547–7560.
Manojlović, S., Sibinović, M., Srejić, T., Hadud, A., and Sabri, I. (2021). Agriculture Land Use Change and Demographic Change in Response to Decline Suspended Sediment in Južna Morava River Basin (Serbia). Sustainability 13 (6), 3130. doi:10.3390/su13063130
Manojlović, S. (2019). Uticaj Geografskih Faktora Na Promene Intenziteta Vodne Erozije U Slivu Reke Nišave. (Influence of Geographical Factors on Changes in the Intensity of Water Erosion in the Nišava River Basin). Belgrade: University of Belgrade, Faculty of Geography. (In Serbian).
Martinović, M., and Ratkaj, I. (2015). Sustainable Rural Development in Serbia: Towards a Quantitative Typology of Rural Areas. Carpathian J. Earth Environ. Sci. 10 (3), 37–48.
Matejka, K. (2017). Multivariate Analysis for Assessment of the Tree Populations Based on Dendrometric Data with an Example of Similarity Among Norway spruce Subpopulations. J. For. Sci. 63 (10), 449–456.
Mc Donagh, J. (2012). Rural Geography I: Changing Expectations and Contradictions in the Rural. Prog. Hum. Geogr. 37 (5), 712–720.
Milovanovic, B., Schuster, P., Radovanovic, M., Ristic-Vakanjac, V., Schneider, C., and Milivojevic, M. (2018). Spatial-temporal Variability of Air Temperatures in Serbia in the Period 1961-2010. J. Geogr. Inst. Cvijic 68 (2), 157–175. doi:10.2298/ijgi1802157m
Milovanović, B., Schuster, P., Radovanović, M., Vakanjac, V. R., and Schneider, C. (2017). Spatial and Temporal Variability of Precipitation in Serbia for the Period 1961-2010. Theor. Appl. Climatol. 130 (1), 687–700. doi:10.1007/s00704-017-2118-5
Mizuta, K., Grunwald, S., and Phillips, M. A. (2018). New Soil Index Development and Integration with Econometric Theory. Soil Sci. Soc. America J. 82 (5), 1017–1032. doi:10.2136/sssaj2017.11.0378
Mohammadi, M., Khaledi Darvishan, A., Spalevic, V., Dudic, B., and Billi, P. (2021). Analysis of the Impact of Land Use Changes on Soil Erosion Intensity and Sediment Yield Using the IntErO Model in the Talar Watershed of Iran. Water 13 (6), 881. doi:10.3390/w13060881
Morgan, R. P. C., Morgan, D. D. V., and Finney, H. J. (1984). A Predictive Model for the Assessment of Soil Erosion Risk. J. Agric. Eng. Res. 30, 245–253. doi:10.1016/S0021-8634(84)80025-6
Morgan, R. P. C., Quinton, J. N., and Rickson, R. J. (1994). Modelling Methodology for Soil Erosion Assessment and Soil Conservation Design: The EUROSEM Approach. Outlook Agric. 23, 5–9. doi:10.1177/003072709402300103
Muuler, D., Kuemmerle, T., Rusu, M., and Griffiths, P. (2009). Lost in Transition: Determinants of post-socialist Cropland Abandonment in Romania. J. Land Use Sci. 4, 109–129.
Niacsu, L., Ionita, I., Samoila, C., Grigoras, G., and Blebea-Apostu, A. M. (2021). Land Degradation and Soil Conservation Measures in the Moldavian Plateau, Eastern Romania: A Case Study from the Racova Catchment. Water 13 (20), 2877. doi:10.3390/w13202877
Nikitović, V., Bajat, B., and Blagojević, D. (2016). Spatial Patterns of Recent Demographic Trends in Serbia (1961–2010). Geografie 121 (4), 521–543.
Novković, I. (2016). Natural Conditions as Determinants of Geohazards on the Example of Ljig, Jošanička and Vranjskobanjska River Basins. Belgrade (RS): University of Belgrade. [dissertation thesis].
Ouallali, A., Aassoumi, H., Moukhchane, M., Moumou, A., Houssni, M., Spalevic, V., et al. (2020). Sediment Mobilization Study on Cretaceous, Tertiary and Quaternary Lithological Formations of an External Rif Catchment, Morocco. Hydrological Sci. J. 65, 1568–1582. doi:10.1080/02626667.2020.1755435
Panagos, P., Ballabio, C., Poesen, J., Lugato, E., Scarpa, S., Montanarella, L., et al. (2020). A Soil Erosion Indicator for Supporting Agricultural, Environmental and Climate Policies in the European Union. Remote Sensing 12, 1365. doi:10.3390/rs12091365
Panagos, P., Borrelli, P., Poesen, J., Ballabio, C., Lugato, E., Meusburger, K., et al. (2015). The New Assessment of Soil Loss by Water Erosion in Europe. Environ. Sci. Pol. 54, 438–447. doi:10.1016/j.envsci.2015.08.012
Pašakarnis, G., Morley, D., and Maliene, V. (2013). Rural Development and Challenges Establishing Sustainable Land Use in Eastern European Countries. Land Use Policy 30, 703–710.
Pazúr, R., Lieskovský, J., Feranec, J., and Oťaheľ, J. (2014). Spatial Determinants of Abandonment of Large-Scale Arable Lands and Managed Grasslands in Slovakia during the Periods of post-socialist Transition and European Union Accession. Appl. Geogr. 54, 118–128. doi:10.1016/j.apgeog.2014.07.014
Perović, V., Jaramaz, D., Životić, L., Cakmak, D., Mrvić, V., Milanović, M., et al. (2016). Design and Implementation of WebGIS Technologies in Evaluation of Erosion Intensity in the Municipality of NIS (Serbia). Environ. Earth Sci. 75, 1–12. doi:10.1007/s12665-015-4857-x
Petrović, A. (2021). Torrential Floods in Serbia. Special Issues 73. Belgrade: Serbian Geographical Society.
Poggetti, E., Cencetti, C., Rosa, P. D., Fredduzzi, A., and Rivelli, F. R. (2019). Sediment Supply and Hydrogeological Hazard in the Quebrada De Humahuaca (Province of Jujuy, Northwestern Argentina)-Rio Huasamayo and Tilcara Area. Geosciences 9 (11), 483. doi:10.3390/geosciences9110483
Prishchepov, A. V., Müller, D., Dubinin, M., Baumann, M., and Radeloff, V. C. (2013). Determinants of Agricultural Land Abandonment in post-Soviet European Russia. Land Use Policy 30, 873–884. doi:10.1016/j.landusepol.2012.06.011
Puljiz, V. (2002). Oblici I Posledice Deagrarizacije U Našem Selu (Eng. Forms and Consequences of Deagrarization in Our Village). Sociologija sela 40 (3/4), 367–385.
Ratkaj, I. (2009). Prostorno-funkcionalna Organizacija Beograda (Eng. Spatial-Functional Organization of Belgrade). Belgrade: Faculty of Geography.
Raux, J., Copard, Y., Laignel, B., Fournier, M., and Masseï, N. (2011). Classification of Worldwide Drainage Basins through the Multivariate Analysis of Variables Controlling Their Hydrosedimentary Response. Glob. Planet. Change 76, 117–127. doi:10.1016/j.gloplacha.2010.12.005
Renard, K. G., Foster, G. R., Weesies, G. A., and Porter, J. P. (1991). RUSLE: Revised Universal Soil Loss Equation. J. Soil Water Conserv 46 (1), 30–33.
Restrepo, J. D., Kjerfve, B., Hermelin, M., and Restrepo, J. C. (2006). Factors Controlling Sediment Yield in a Major South American Drainage basin: the Magdalena River, Colombia. J. Hydrol. 316, 213–232. doi:10.1016/j.jhydrol.2005.05.002
Sakuno, N. R. R., Guiçardi, A. C. F., Spalevic, V., Avanzi, J. C., Silva, M. L. N., and Mincato, R. L. (2020). Adaptation and Application of the Erosion Potential Method for Tropical Soils. Rev. Ciênc. Agron. 51, 1. doi:10.5935/1806-6690.20200004
Scherr, S. J. (2001). “The Future Food Security and Economic Consequences of Soil Degradation in the Developing World,” in Response to Land Degradation (New Delhi, India: Oxford Press), 155–170.
Shi, Z. H., Huang, X. D., Ai, L., Fang, N. F., and Wu, G. L. (2014). Quantitative Analysis of Factors Controlling Sediment Yield in Mountainous Watersheds. Geomorphology 226, 193–201. doi:10.1016/j.geomorph.2014.08.012
Sibinović, M. (2018). How Did Agricultural Patterns Change in Serbia after the Fall of Yugoslavia? Geogr. Teach. 15 (1), 33–35.
Sibinovic, M. (2015). Typology of Agriculture in Conditions of Transitional Crisis: the Case of the Belgrade Region. Zb Rad Geogr. Fak Uni Beograd 63, 81–118. doi:10.5937/zrgfub1563081s
Spalevic, V., Barovic, G., Vujacic, D., Curovic, M., Behzadfar, M., Djurovic, N., et al. (2020). The Impact of Land Use Changes on Soil Erosion in the River Basin of Miocki Potok, Montenegro. Water 12 (11), 2973. doi:10.3390/w12112973
Statistical Office of the Republic of Serbia (2012). Agricultural Land in the Republic of Serbia and Settlements of Serbia from 1961 to 2012. Available at: https://www.stat.gov.rs/(Accessed Jan, , 2020).
Statistical Office of the Republic of Serbia (2011). Comparative Overview of the Number of Population 1948. 1953, 1961, 1971, 1981, 1991, 2002, 2011, data by settlements. Available at: http://www.stat.gov.rs/(Accessed Jan, 2020).
Stefanidis, S., and Stathis, D. (2018). Effect of Climate Change on Soil Erosion in a Mountainous Mediterranean Catchment (Central Pindus, Greece). Water 10 (10), 1469. doi:10.3390/w10101469
Stellmes, M., Röder, A., Udelhoven, T., and Hill, J. (2013). Mapping Syndromes of Land Change in Spain with Remote Sensing Time Series, Demographic and Climatic Data. Land Use Policy 30, 685–702. doi:10.1016/j.landusepol.2012.05.007
Stojanović, Ž. (2022). “Agriculture in Serbia,” in Geography of Serbia. Editors E. Manić, V. Nikitović, and P. Djurović (Cham, Switzerland: Springer), 199–207.
Sui, J., He, Y., and Liu, C. (2009). Changes in Sediment Transport in the Kuye River in the Loess Plateau in China. Int. J. Sediment Res. 24, 201–213. doi:10.1016/s1001-6279(09)60027-5
Tagliamonte, S. A., and Baayen, R. H. (2012). Models, Forests, and Trees of York English: Was/were Variation as a Case Study for Statistical Practice. Lang. Change 24 (2), 135–178. doi:10.1017/s0954394512000129
Todorović, M. (2002). Osnove Tipologije I Regionalizacije Poljoprivrede Srbije (Eng. Basics of Typology and Regionalization of Agriculture in Serbia). Beograd: Srpsko geografsko društvo.
Tošić, R., Dragićević, S., and Lovrić, N. (2012). Assessment of Soil Erosion and Sediment Yield Changes Using Erosion Potential Method - Case Study: Republic of Srpska – BiH. Carpathian J. Earth Environ. Sci. 7 (4), 147–154.
Tosic, R., and Dragicevic, S. (2012). Methodology Update for Determination of the Erosion Coefficient(Z). B Serbian Geogr. 92 (1), 11–26. doi:10.2298/gsgd1201011t
Urošev, M., Štrbac, D., Kovacevic-Majkic, J., Plavsic, J., and Yamashkin, S. (2020). Spatial Distribution of Specific Runoff in Serbia Based on Rainfall-Runoff Relationship. J. Geogr. Inst. Cvijic. 70 (3), 203–214. doi:10.2298/ijgi2003203u
Valjarević, A., Djekić, T., Stevanović, V., Ivanović, R., and Jandziković, B. (2018). GIS Numerical and Remote Sensing Analyses of forest Changes in the Toplica Region for the Period of 1953–2013. Appl. Geogr. 92, 131–139.
Valjarević, A., Morar, C., Živković, J., Niemets, L., Kićović, D., Golijanin, J., et al. (2021). Long Term Monitoring and Connection between Topography and Cloud Cover Distribution in Serbia. Atmosphere 12 (8), 964. doi:10.3390/atmos12080964
Walling, D. E., and Fang, D. (2003). Recent Trends in the Suspended Sediment Loads of the World's Rivers. Glob. Planet. Change 39, 111–126. doi:10.1016/S0921-8181(03)00020-1
Williams, J. R. (1975). “Sediment-yield Prediction with Universal Equation Using Runoff Energy Factor,” in Present and Prospective Technology for Predicting Sediment Yield and Sources (Washington DC: US Department of Agriculture, Agriculture Research Service), 244–252.
Wischmeier, W. H., and Smith, D. D. (1978). Predicting Rainfall Erosion Losses: A Guide to Conservation Planning (No. 537). Hyattsville, MD, USA: Department of Agriculture, Science and Education Administration.
Wuttichaikitcharoen, P., and Babel, M. (2014). Principal Component and Multiple Regression Analyses for the Estimation of Suspended Sediment Yield in Ungauged Basins of Northern Thailand. Water 6 (8), 2412–2435. doi:10.3390/w6082412
Yeganeh, K. H. (2020). A Typology of Sources, Manifestations, and Implications of Environmental Degradation. Meq 31, 765–783. doi:10.1108/meq-02-2019-0036
Keywords: EPM model, principal component analysis, soil erosion, litology, forest cover, demographic and agrarian variables
Citation: Manojlović S, Sibinović M, Srejić T, Novković I, Milošević MV, Gatarić D, Carević I and Batoćanin N (2022) Factors Controlling the Change of Soil Erosion Intensity in Mountain Watersheds in Serbia. Front. Environ. Sci. 10:888901. doi: 10.3389/fenvs.2022.888901
Received: 03 March 2022; Accepted: 18 March 2022;
Published: 14 April 2022.
Edited by:
Aleksandar Valjarević, University of Belgrade, SerbiaReviewed by:
Ivica Milevski, Saints Cyril and Methodius University of Skopje, North MacedoniaCopyright © 2022 Manojlović, Sibinović, Srejić, Novković, Milošević, Gatarić, Carević and Batoćanin. This is an open-access article distributed under the terms of the Creative Commons Attribution License (CC BY). The use, distribution or reproduction in other forums is permitted, provided the original author(s) and the copyright owner(s) are credited and that the original publication in this journal is cited, in accordance with accepted academic practice. No use, distribution or reproduction is permitted which does not comply with these terms.
*Correspondence: Mikica Sibinović, bWlraWNhLnNpYmlub3ZpY0BnZWYuYmcuYWMucnM=
Disclaimer: All claims expressed in this article are solely those of the authors and do not necessarily represent those of their affiliated organizations, or those of the publisher, the editors and the reviewers. Any product that may be evaluated in this article or claim that may be made by its manufacturer is not guaranteed or endorsed by the publisher.
Research integrity at Frontiers
Learn more about the work of our research integrity team to safeguard the quality of each article we publish.