 Chunfen Zeng
 Wanyu Qi
 Yuqing Mao
 Rui Liu
 Boya Yu
 Xinning Dong5
94% of researchers rate our articles as excellent or good
Learn more about the work of our research integrity team to safeguard the quality of each article we publish.
Find out more
ORIGINAL RESEARCH article
Front. Environ. Sci., 06 July 2022
Sec. Environmental Informatics and Remote Sensing
Volume 10 - 2022 | https://doi.org/10.3389/fenvs.2022.887040
This article is part of the Research TopicHydroclimatic Extremes: Human-Natural System Adaptation and ImpactsView all 13 articles
The Three Gorges Project is the largest water conservancy project in the world. To cope with the ecological problems of the subsidence zone in the Three Gorges Reservoir area, the Kaizhou water-level-regulating dam was built, forming a model of nested water conservancy projects. The Pengxi River Basin is affected not only by this project but also by human activities in the reservoir area and changes in the substratum and hydro-meteorology, which exert influences on the water connotation function and its ecological value through complex mechanisms. In addition, the response mechanism of the changes in the environment is unclear. Therefore, based on the Integrated Valuation of Ecosystem Services and Tradeoffs (InVEST) model and a spatial interpolation method, in this study, two time nodes (2005 and 2018) before and after the operation of the nested water conservancy projects began were selected, and seven simulation scenarios with different water levels, precipitations, and temperatures were created to explore the evolution of the water conservation service function in the nested water conservancy project operation area under the complex changes in the environment. The results reveal that the operation of the water conservancy projects has had some influence on the water content, but the response of the water content function to the precipitation conditions has been more significant. In colder and rainier years, the water content was higher. In contrast, the lowest value occurred in a year with high temperatures and low rainfall. The highest and lowest values were quantitatively different. Therefore, the influences of the complex environmental factors on the regional water connotation service function deserve more attention. The results of this study provide a scientific basis for research on the ecological service function and the value of water conservation in the Three Gorges Reservoir subsidence zone and the nested operation area of the related water conservancy projects, as well as a data reference for the optimal allocation of regional water resources.
Under the context of climate change, ecological degradation has become a global priority. As a result, human well-being and livelihoods depend heavily on freshwater ecosystems and their service functions (Capon et al., 2018). Water conservation service is an important link between natural ecosystems and human society’s demand for ecosystem services, and it plays an important role in the water cycle and water balance of river basins, as well as human survival and development (Ren and Mao, 2021).
The integrated valuation of ecosystem services and tradeoffs (InVEST) model has been widely used in water conservation services research. This model has been used in many regions, such as the Chindwin River Basin in Myanmar, the Portuguese Continental Basin, the Sokoto–Rima Basin in West Africa, Chile in South America, and the middle and lower reaches of the Yangtze River in China (Almeida and Cabral, 2021; Benra et al., 2021; Raji et al., 2021; Shrestha et al., 2021; Chen et al., 2022). This model can be used not only to evaluate the ecological service functions of different regions but also to predict the changes in ecological services by simulating different scenarios in order to identify the best scenario for sustainable regional development.
In recent years, due to the impacts of global climate change and social and economic development, Chinese and foreign scholars have focused on analyzing the driving factors of regional water conservation services with the help of this model. Dai and Wang (2020) analyzed the spatial heterogeneity and conducted the attribution analysis of water producing services in the Hengduan mountainous area and found that climate factors were the main factors controlling the spatial heterogeneity of the water producing service. In addition, evapotranspiration and precipitation can be interpreted differently for different topography. Wang et al. (2020) used the InVEST model to simulate the water conservation scenarios for the Fujian Triangle urban agglomeration in 2015 and 2030 and found that the impact of land-use changes on water conservation is mainly manifested in four aspects: changes in area, changes in direction, action intensity, and area compensation. Aneseyee et al. (2022) used the InVEST model to analyze the spatial and temporal variabilities of the water yield under land-use change (LUC) and climate change in the Winike watershed, Ethiopia, and found that land conversion affected the water yield but precipitation had a greater impact. Wang et al. (2022) quantitatively assessed the spatial and temporal variabilities of the ecosystem services in the Qilian Mountains using the InVEST model, as well as the differences in the eco-hydrological services under different land-use types. The Daqinghe River Basin was selected as an example to study the changes in the ecosystem services and its influencing factors. The results revealed that the natural background conditions and ecological protection policies were the main factors driving the changes in the ecosystem regulation services. The supply of agricultural products and the change in the area of construction land were the main factors driving the spatiotemporal changes in the agricultural product supply service and human settlement environment, respectively (Pan et al., 2021). Li J. et al. (2021) studied the impacts of precipitation and land-use changes on the water supply and service function in the Beisanhe River Basin. Their results revealed that the impact of the climate on the water yield was far greater than that of the land-use changes, and the surge in precipitation played a leading role. Zhao et al. (2019) analyzed the driving factors affecting the water yield in the upper reaches of the Shiyang River and concluded that climate was the leading factor affecting the changes in the water yield. Most of these studies focused on the response of water harvesting to land-use changes and climate change. With the increasing disturbance of human activities, especially the construction and operation of large-scale water conservancy projects, the water resources and ecosystems in the basin are greatly affected. However, few studies have been conducted on the mechanism of water-level fluctuations under the influence of water conservancy projects and their effect on water conservation services.
The Three Gorges Project formed a fluctuation zone, and its ecosystem is fragile. Related studies have mainly focused on the health and change mechanism of the ecosystem in the water-level fluctuation zone of the Three Gorges Reservoir area, including the soil, vegetation, ecological problems, and restoration (He and Bao, 2019; Lu, 2021; Lu et al., 2021; Shen et al., 2021). In addition, the characteristics of the water-level fluctuation zone, such as its long and narrow shape, cloudy weather, and large variations in the water level, increase the difficulty of data acquisition, and thus, previous research studies on the water conservation services are mainly based on static evaluations (Zhang et al., 2007). Few studies have been conducted on the dynamic changes caused by the operation of nested water conservancy projects. The operation of large-scale water conservancy projects has significantly affected the regional water and soil resources and the ecological services (Cheng et al., 2015; Cheng et al., 2018; Hu, 2019; Li and Hao, 2019; Li et al., 2019; Gong et al., 2020; Li et al., 2021a). Lu et al. (2021) analyzed the comprehensive effect and driving mechanism of the ecological water transfer project in the Heihe River Basin since 2000 and found that the hydrological, ecological, and socio-economic systems in the LXS region have formed feedback loops, but the comprehensive correlation among the water resources, ecosystem, and socio-economic system should still be considered in order to coordinate the relationship between them.
The Pengxi River Basin was chosen as the research area of this study. A large water-level fluctuation zone has formed in this basin under the influences of the operation of the Three Gorges Project and the special terrain conditions in this region. It accounts for about 45% of the water-level fluctuation zone in the Three Gorges Reservoir area, which makes this watershed ecologically fragile. In order to reduce the deterioration of the ecological environment in the water-level fluctuation zone and its surrounding areas, a water-level-regulating dam was built in Kaizhou. The operation of nested water conservancy projects makes the regional ecological driving mechanism more complex. Under the multiple effects of land-use changes, the operation of nested water conservancy projects, the human activities in the reservoir area, and changes in the meteorological conditions, the change mechanisms of the ecological service functions and the value of the water conservation need to be investigated further. Therefore, in this study, the Pengxi River Basin was taken as the study area, and the InVEST model was used to evaluate the water conservation service functions under the effects of multiple impacts via statistical analysis and geographic information system (GIS) technology and to determine the change mechanism of the water conservation ecological service functions under the influence of human activities, land-use changes, changes in the meteorological conditions, and water-level control of different water conservancy projects (the water-level control of the Three Gorges Project: low water level 145 m, high water level 175 m, the same below). The results of this study provide a scientific basis for ecological protection and restoration and the optimal allocation of regional water and soil resources in the Pengxi River Basin and the affected areas of related large-scale water conservancy projects and a theoretical reference for the ecological effects of related engineering measures.
The operation of the Three Gorges Project has formed a water fluctuation zone at 145–175 m in the reservoir. The special topography of the Pengxi River Basin in the Chongqing section of the Three Gorges Reservoir area has resulted in the formation of a large water-level fluctuation zone, accounting for about 45% of the Three Gorges Reservoir area. In order to improve the water-level fluctuation zone and the vulnerability of the surrounding ecological environment, the Kaizhou water-level regulation dam was constructed to form a nested area of large-scale water conservancy projects (Figure 1).
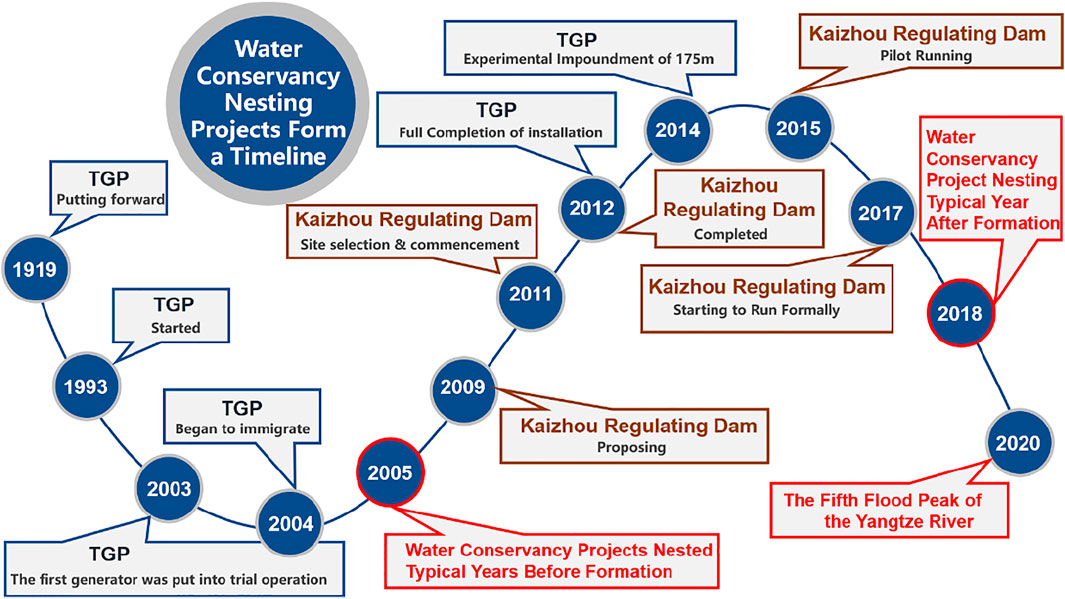
FIGURE 1. Water conservancy projects are nested to form a timeline.
The Pengxi River Basin (Figure 2) is located in the eastern part of the Sichuan Basin (107°56'–108°54'E, 30°49'–31°42'N), and the Pengxi River mainly flows through the Kaizhou District and Yunyang County in Chongqing, with a total basin area of 5,173 m2. The main landforms in the basin include mountains, hills, and plains. The topography of the region is undulating and is generally high in the northeast and low in the southwest. Most of the region has a subtropical humid monsoon climate, except for the northern mountainous area, which has an altitude of more than 1,000 m and a warm temperate monsoon climate.
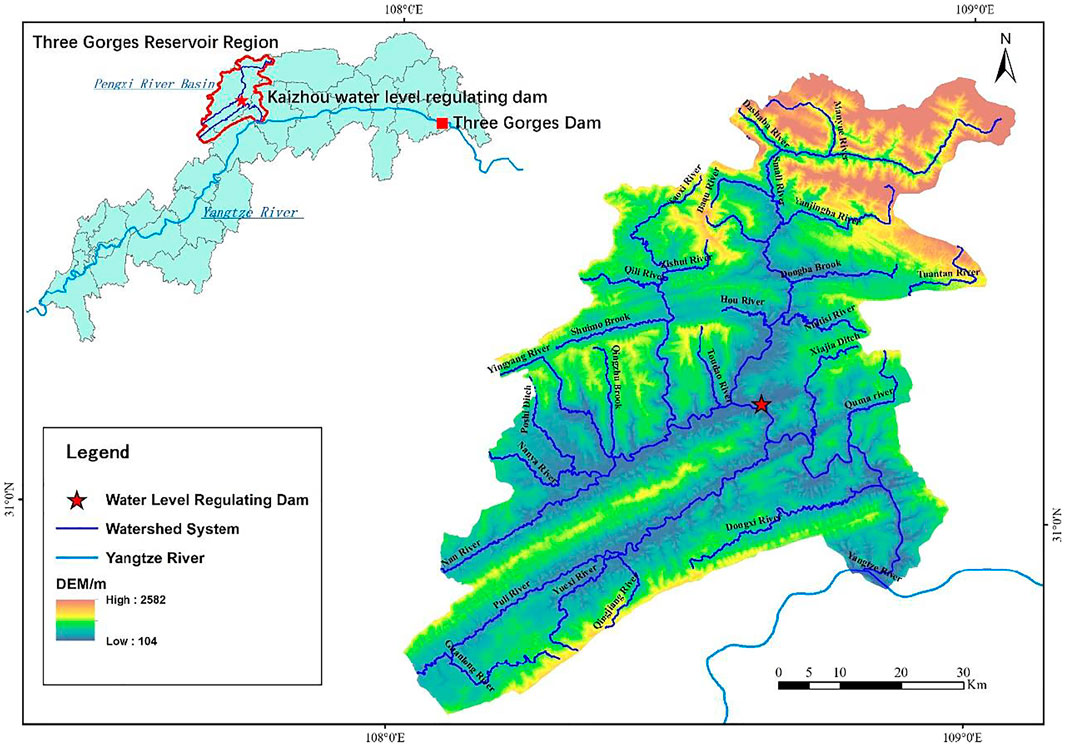
FIGURE 2. Schematic diagram showing the location, elevation, water system, and dam in the study area.
The average annual temperature is 18.47–10.81°C, and the temperature difference between the northern and southern parts of the study area is large due to the influence of the vertical temperature gradient. The rainfall is concentrated in summer and autumn, and the rainy season is long. The annual average rainfall is 1,100–1,500 mm, and the annual average runoff is 3.58 × 10⁹ m³. The forest coverage rate of the basin is 31.4%, and the vertical zoning of the vegetation is obvious. Purple soil, yellow soil, and paddy soil are the main soil types.
The sources of the land cover, meteorological, and socio-economic data used in this study are presented in Table 1. In this study, two time nodes were selected: one before the operation of the nested hydraulic project began (2005) and one after the operation of the nested hydraulic project began (2018). According to the land-use classification standard GB/T21010-2017, the spatial distributions of the ecosystems in 2005 and 2018 in the study area were determined. The hydrological analysis tool in ArcGIS was used to determine the boundary of the watershed in the study area based on a digital elevation model (DEM). Based on hydrological and meteorological data from three meteorological stations in the Kaizhou District and its surrounding areas for typical years, such as a wet year, a normal water year, a dry year, a high-temperature year, and a low-temperature year, an annual rainfall distribution map and temperature distribution map were generated via inverse distance weighted interpolation. Hydrometeorological simulation scenarios were defined based on the temperature, precipitation, and solar radiation data in order to calculate the potential evapotranspiration. The water available for vegetation growth was calculated based on the soil’s sand, silt, clay, and organic matter contents. The plant evapotranspiration coefficient was calculated based on the leaf area index (LAI). The saturated water conductivity of the soil was calculated using the soil’s sand and clay contents and the soil bulk density. The soil depth and DEM were extracted from the soil dataset of the Harmonized World Soil Database (HWSD) to calculate the topographic index.
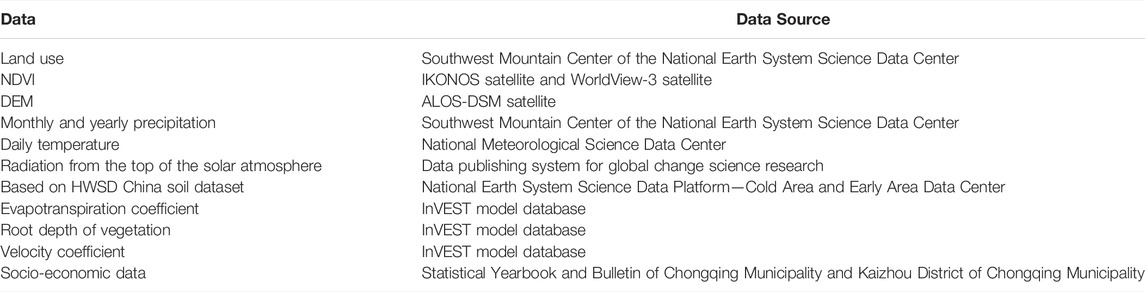
TABLE 1. Data and sources.
The water conservation module of the InVEST model calculates the water yield based on the water cycle principle using parameters such as the average annual precipitation, surface and vegetation evapotranspiration, and soil and vegetation root depth. Then, it obtains the final amount of water conservation using the velocity coefficient, topographic index, and saturated soil water conductivity. The specific calculation formula is as follows:
where water retention is the water retention depth (mm), velocity is the velocity coefficient, and TI is the dimensionless topographic index, which is calculated using Eq. 2. Ksat is the saturated soil water conductivity (cm/d), which is calculated using the Saxton model and Eq. 3 (Li et al., 2019). Yield is the water yield, which can be calculated using Eq. 4.
where Gridnumber is the number of grids in the study area, Soil Depth _is the soil depth (mm), and Percent Slope is the slope percentage.
where Ksat is the saturated soil water conductivity (cm/d), sand and clay are the soil sand and clay contents (%), and θs is the saturated soil water content (%).
where Yjx is the annual water output, Px is the average annual rainfall in grid unit X, and AETxj is the annual average evapotranspiration in grid unit X in ecosystem type J (Wang et al., 2021), which can be calculated using Eq. 5.
where Rxj is the dimensionless dryness index of grid unit X in ecosystem type J, which is calculated based on the ratio of the potential evapotranspiration to rainfall and using Eq. 6. Ωx is the dimensionless ratio of the annual available water to rainfall for modified vegetation.
where k is the vegetation coefficient, which can be calculated using the LAI. ET0 is the evapotranspiration when the flat ground is completely covered by certain short green vegetation and the soil is still sufficiently moist (mm/d) (Zhang et al., 2012). Eq. 7 is used to calculate the evapotranspiration.
where RA is the solar atmospheric top layer radiation (MJ/m2·d), Tavg and TD are the mean and difference of the mean of the daily maximum and minimum temperature (°C), respectively, and P is the monthly precipitation (mm).
where Z is the Zhang coefficient (constant) and its range is (1–10), which represents the seasonal characteristics of the precipitation. When the precipitation is mostly concentrated in winter, Z approaches 10. When the precipitation is relatively concentrated in summer or is evenly distributed in all seasons, Z approaches 1. According to the model test and the analysis of the precipitation data, the precipitation in the study area is mainly concentrated from May to October, of which the precipitation from June to August accounts for about 50%. In addition, by referring to the research results of other scholars regarding the Three Gorges Reservoir area (Xiao et al., 2015), it was found that
where maxSoil_Depthx is the maximum soil depth, Root_Depthx is the root depth, and PAWCx is the water available for vegetation growth, which is calculated using Equation 10:
where sand, silt, clay, and OM are the sand, silt, clay, and organic matter contents of the soil (%), respectively.
After the completion of the Kaizhou water-level regulation dam in 2017, the Kaizhou water-level regulation dam and the Three Gorges Dam formed a nested operation to influence the area of water conservancy projects. The highest and lowest water levels of the Three Gorges Project are 175 m (hereinafter referred to as the high water level) and 145 m (hereinafter referred to as the low water level), based on which surface cover data were obtained for the high and low water levels at two time nodes in the study area.
Second, the ecosystem service functions of the water conservation were the result of the combined effect of the meteorological and hydrological factors. Therefore, for precipitation and temperature, seven simulation scenarios were designed based on the meteorological data from 1959 to 2019 for the study area. For precipitation, a wet year (PH), normal year (PN), and dry year (PL) were defined. A high-temperature year (TH) and low-temperature year (TL) were defined for air temperature. In view of the dual effects of precipitation and temperature, we defined a high-temperature year with little rain (THPL) and a low-temperature year with abundant rain (TLPH).
In order to reveal the impacts of human activities on the land cover, land cover data for two time nodes were selected to analyze the direction and source of the land loss of each land-use type during the study period using an ecosystem type transfer matrix. Before and after the operation of the nested water conservancy projects began, the area of grassland converted to other land-use types was the largest, followed by cultivated land, and the amount of dryland converted was the smallest. The area of cultivated land was the largest, followed by woodland. The area of grassland converted was the largest (Figure 3) and was 523.38 km2. The converted areas were mainly medium and high coverage grassland, and the area of medium coverage grassland converted (509.03 km2), accounted for 45.85% of the total area of grassland converted, while the area of high coverage grassland converted was only 12.71 km2 (1.15%). More grassland with a medium coverage was converted into the dryland (403.79 km2), accounting for 42.19% of the total area converted. The high coverage grassland was converted into the woodland (7.20 km2), dryland (3.79 km2), and sparse woodland (0.55 km2). The 22.28% of the farmland was converted to the dryland, and the dryland was mainly converted to sparse woodland, paddy fields, and medium coverage grassland. The percentage of farmland converted was the largest (61.39%). Among them, the area of dryland converted was the largest (568.45 km2). The second largest was woodland (20.84%), among which the area of sparse forest land converted was the largest (111.37 km2), and it was mainly converted from the medium coverage grassland, dryland, and paddy fields.
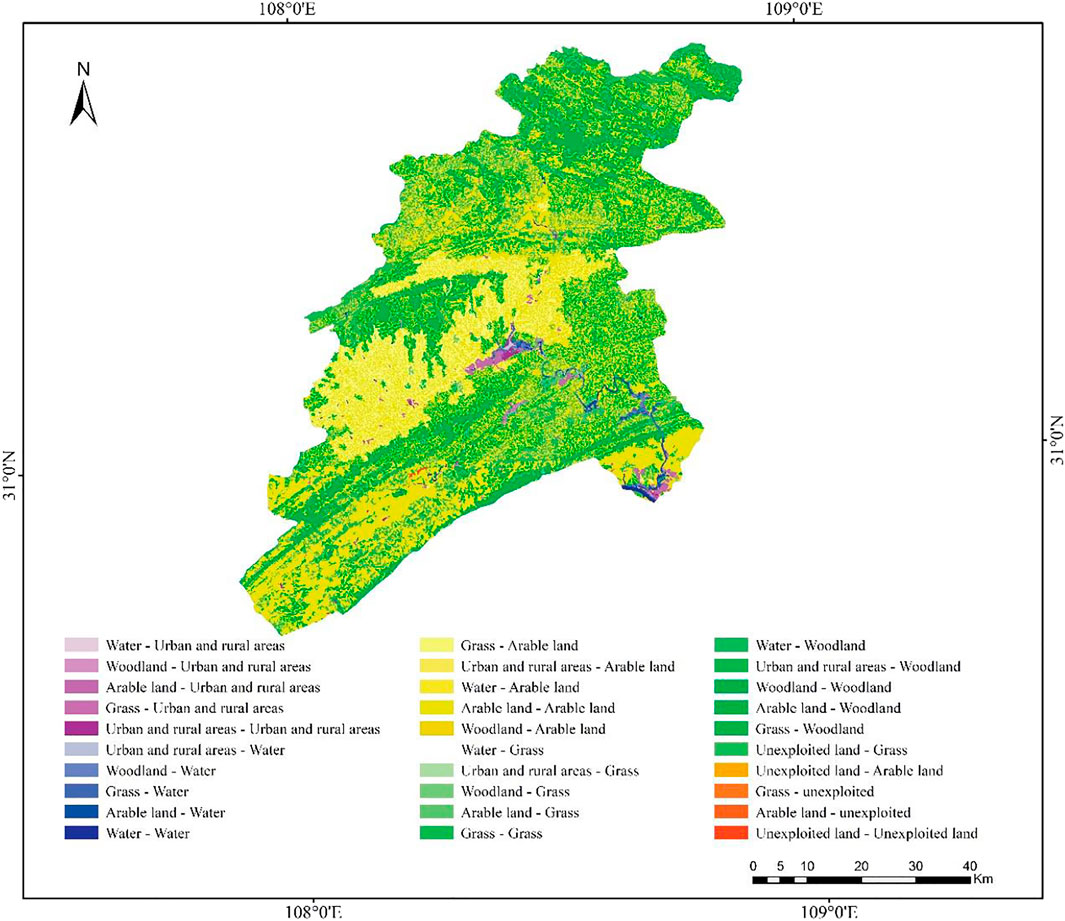
FIGURE 3. Map of land-use changes in the Pengxi River Basin from 2005 to 2018.
The results revealed that from 2005 to 2018, the areas of the dryland, open woodland, high coverage grassland, canals and reservoirs pits, urban land, land for rural residents, and land for industry, mining, and transportation increased; the areas of the paddy fields, shrub land, forest land, other beaches and coverage, low coverage grassland, and the grass in the bare rock gravel land decreased. These changes were mainly due to the nested operation of the water conservancy projects and corresponded to the impacts of human activities.
The dynamic changes in the land cover are presented in Table 2. Before the water conservancy project nesting was implemented in 2005, the land cover was dominated by the dryland (31.69%), medium coverage grassland (19.24%), and sparse forest land (13.53%). In 2018, the dryland (38.15%), sparse forest land (13.98%), and paddy fields (13.32%) were the main land-use types. After the nested water conservancy projects were implemented, the areas of the dryland and medium coverage grassland changed significantly, and the area of the dryland increased by 321.11 km2. The area of the medium coverage grassland decreased the most by 445.878 km2.
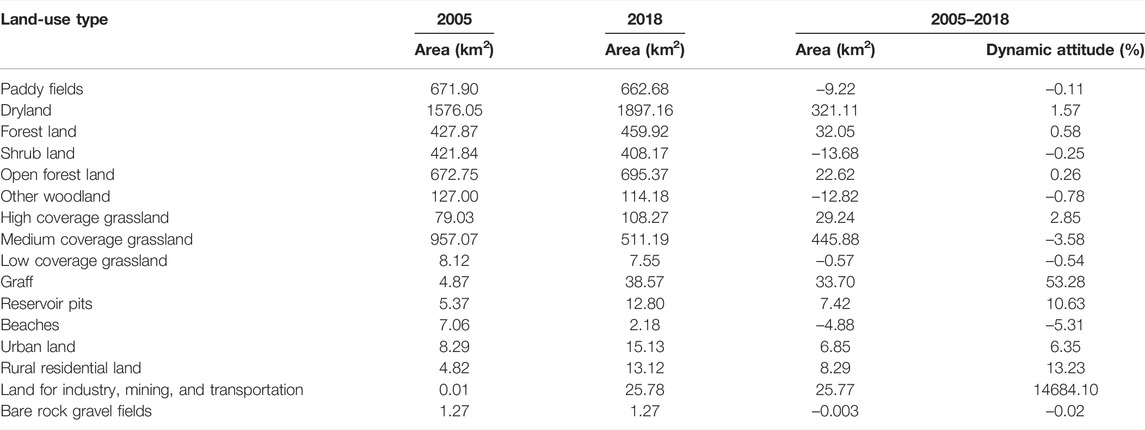
TABLE 2. Dynamic change of land cover.
From 2005 to 2018, the dynamic attitudes of the urban and rural areas, water area, cultivated land, and forest land were 23.98, 16.11, 1.07, and 0.13%, respectively. The dynamic attitude of the industrial, mining, and transportation land was the largest (14,684.10%). The dynamic attitude of the water channels was the second largest (53.28%). The dynamic attitudes of the grassland and bare gravel land were –3.07% and –0.02%, respectively. Due to the construction of the Three Gorges Dam, the total reservoir area of about 55.5 km2 in the Kaizhou District was submerged, and the grace length of the 400 km reservoir was submerged. The urban pattern of the district was completely changed. The old city was basically submerged, and the population in the district affected by this change accounted for 16.62% of the total immigrant population in Chongqing (Zeng and Wang, 2017). The migration period (1993–2008) accelerated the urbanization process in the Kaixian County, and the dynamic attitudes of the urban and rural land and cultivated land in the study area were relatively large. In addition, the construction of new towns in the county promoted the development of the urbanization pattern of the Kaizhou District.
The total rainfall in the wet years was 1716.4 mm, which mainly occurred from June to October. The annual rainfall in normal years was about 869.3 mm, which was 49.36% lower than that in wet years, and the average daily rainfall was 6.44 mm. The total rainfall in the dry years was only 759.7 mm, which was the lowest compared to the other years and was 55.77% lower than that in the wet years.
Precipitation was abundant in the low-temperature years, with the annual rainfall reaching 1180.7 mm. The annual total rainfall in the high-temperature years was the same as that in the normal years, which was 26.37% lower than in the low-temperature years. The annual precipitation in Fengshui exhibited an increasing trend from the Mingzhong Township in the northeast to the southwest (Figure 4), and the rate of increase was rapid. The annual precipitation in the normal years and high-temperature years decreased from the central area to the Toudao River to the northeast and southwest, and the precipitation was lower in the southwest than that in the northeast. The distribution of the rainfall was roughly the same in the dry and wet years, that is, the precipitation decreased from southwest to northeast, but the annual precipitation was lower in the dry years. However, the annual precipitation in the low-temperature years decreased from the northeast to the central part of the study area and increased from the central part of the study area to the Kanto River in the southwest. Moreover, the precipitation was lower in the southwest than that in the northeast. The annual precipitation in the high temperature and low rainfall years increased slowly from northeast to southwest in the study area. In the low temperature and rainy years, the precipitation increased from northeast to southwest.
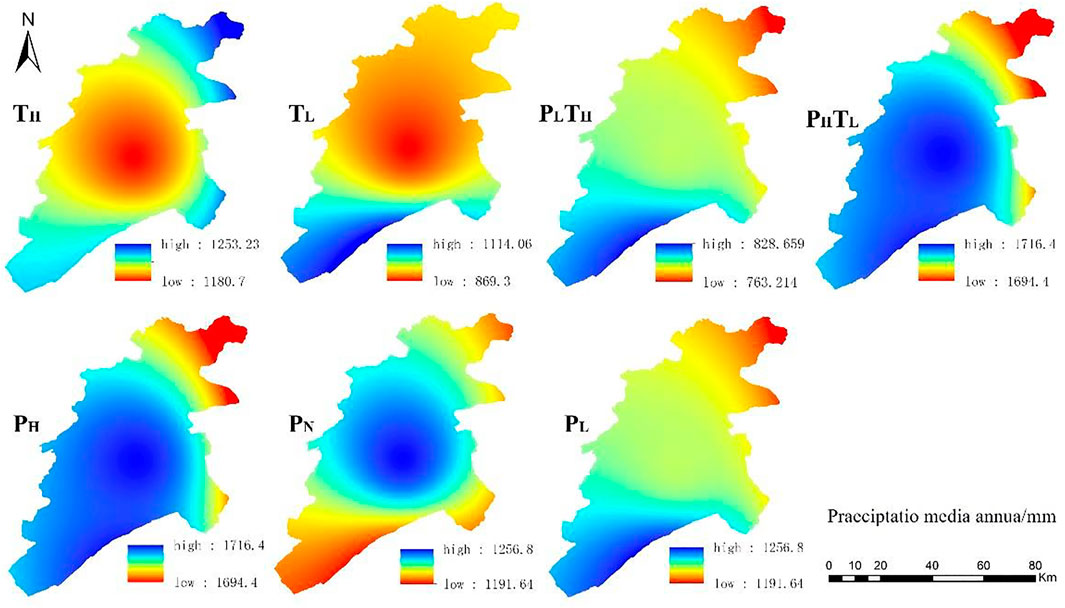
FIGURE 4. Annual precipitation in the Pengxi River Basin under different scenarios.
In general, the precipitation increased from northeast to southwest in the wet years, dry years, high temperature and low rainfall years, and low temperature and high rainfall years, with a rapid increase in wet years and a slow increase in dry years. The precipitation characteristics were the same in the low temperature and high rainfall years and high temperature and low rainfall years, and the precipitation characteristics were the same in the high temperature and low rainfall years and dry years. The annual precipitation in the normal years and high-temperature years decreased from the central China to the northeast and southwest. The precipitation in the low-temperature years increased from central China to the northeast and southwest, and the precipitation in the northeast was greater than that in the southwest. Although the spatial distribution characteristics of the precipitation were similar under the different scenarios, the precipitation itself was quite different in different scenarios.
The average daily temperatures in the wet years, normal years, and dry years were 17.97, 19.61, and 18.41°C, respectively. The annual average temperatures in the Pengxi River Basin in the high temperature and low-temperature years were 18.69 and 16.84°C, respectively. Under the two extreme scenarios, the trends of the temperature and precipitation were similar. The temperature initially gradually increased and then began to decrease in August. The precipitation exhibited an increasing–decreasing–increasing–decreasing trend. The difference in the potential evapotranspiration between the high-temperature years and low-temperature years in the study area is 250.51–305.53 mm/d (Figure 5). The average temperature in the high-temperature years was 19.4°C, and that in the low-temperature years was 17.42°C.
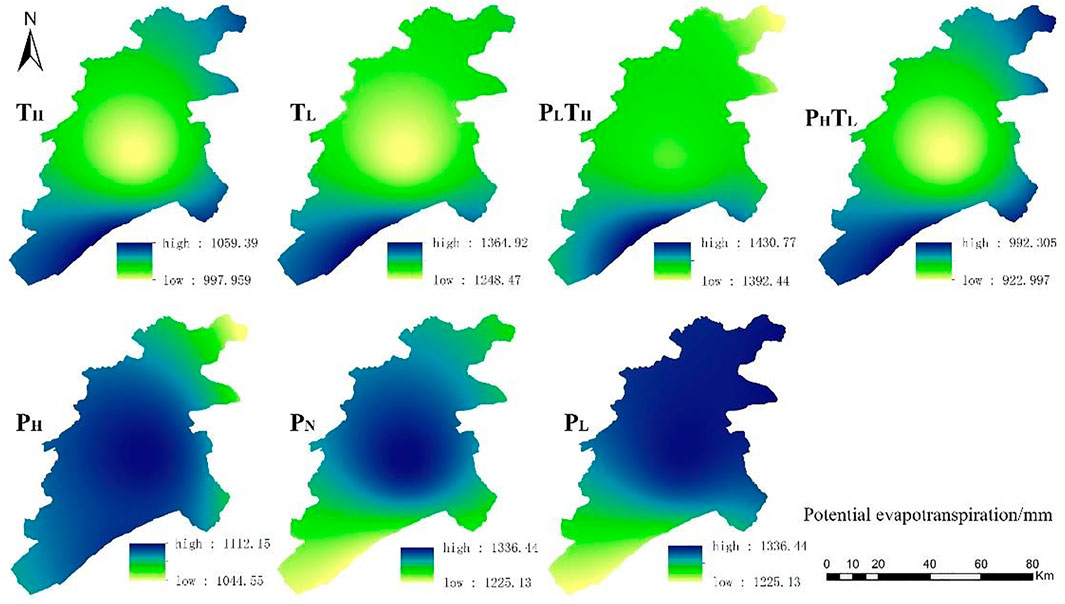
FIGURE 5. Distribution of potential evapotranspiration in the Pengxi River Basin under different scenarios.
The results of the potential evapotranspiration calculation are shown in Figure 5. The distributions of the potential evapotranspiration in the high-temperature years and low temperature and high rainfall years were roughly the same, increasing from the central part of the area to the Toudao River in the axial direction. In contrast, in the normal years, it increased from the northeast and southwest to the central part of the area. In general, the distribution of the potential evapotranspiration was basically consistent with the precipitation and air temperature distributions, which preliminarily indicates that the water conservation was strongly correlated with the evapotranspiration.
Under the same precipitation and temperature conditions, the water conservation and actual evapotranspiration of different surface cover types were compared, and it was found that the water conservation values of the open forest land, shrub land, dryland, and forest land were higher. Among them, the open forest had the highest water conservation (19.5751 × 10⁶ m3) (Figure 6), but the shrub ecosystem had the highest average water conservation, which was 94.10% higher than the average water conservation of the reservoirs and ponds. The average water conservation values of the paddy fields and dryland were low, but they increased by 56.38 and 288.30% compared with those of the reservoirs and pits. The total actual evapotranspiration was higher in the dryland, paddy fields, medium coverage grassland, and forest land. The bare rock and gravel land and rural residential land had the lowest average evapotranspiration, but the average evapotranspiration of the low coverage grassland and reservoirs and pools increased by 286.15 and 230.88%, respectively. Therefore, the water conservation function of the reservoirs was weak.
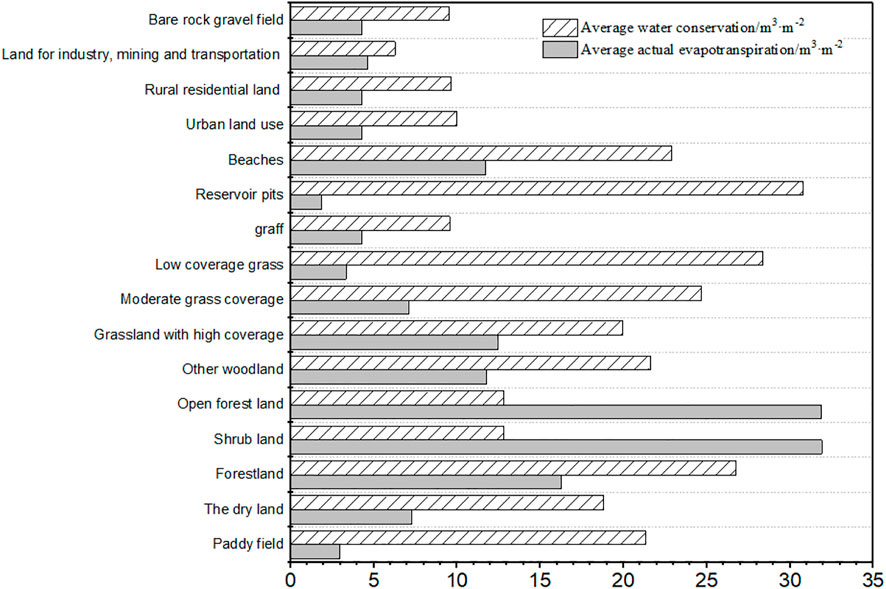
FIGURE 6. Comparison of water conservation and actual evapotranspiration of the different types of ecosystems.
Overall, the water conservation exhibited a decreasing trend from southeast to northwest, and the water conservation was higher around the Liangma River, Xiaojiagou River, and Tuantan River. The actual evapotranspiration exhibited a decreasing trend from northwest to southeast, and the total evapotranspiration was higher around the Taoxi River, Qili River, and Baqu River.
Under the same precipitation and temperature conditions (Figure 7), after the formal operation of the nested water conservancy projects began in 2018, except for the water area and unused land, the surface cover of the cultivated land, grassland, forest land, and urban and rural land at the low water level exhibited obvious decreasing trends compared with those at the high water level. The area of the high water level mainly increased in the vicinity of the Toudao River and its junction with Xiaojiagou. In the case of the high water level, the water conservation changed most obviously, with an average increase of 327,700 m3 (Table 3).

FIGURE 7. Land-use changes and water conservation changes at different water levels in 2018.
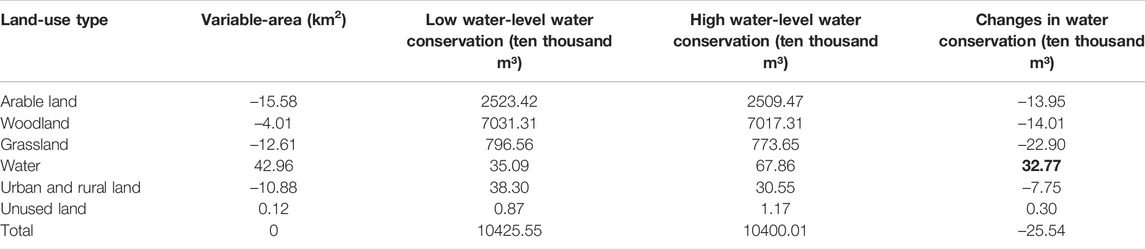
TABLE 3. Land-use changes and water conservation changes at different water levels in 2018.
The actual evapotranspiration increased the most in the cultivated land (8.5760 × 10⁶ m3), while the actual evapotranspiration of the grassland increased by –13.9709 × 10⁶ m³ (Table 4). The change in the water conservation of the cropland and grassland exhibited the opposite trend, and the total change in the water conservation of the cropland increased by 200% compared with that of the grassland, which was mainly caused by the construction of the water-level regulation dam and the immigration engineering in the reservoir area of the Three Gorges project. Through comprehensive comparison, it was found that the changes in the land cover had a certain impact on the water conservation and the actual evapotranspiration due to the difference in the evapotranspiration intensity and root depth in the different types of ecosystems. The change in the water level caused by the operation of the nested water conservancy projects was finally reflected in the change in the land cover, resulting in a reduction in the amount of water conservation (813,300 m³) and the total actual evapotranspiration (3,535,100 m³). Therefore, the construction of the Kaizhou water-level regulation dam and the Hanfeng Lake positively affected the water conservation in the region and improved the ecological service functions in the study area.
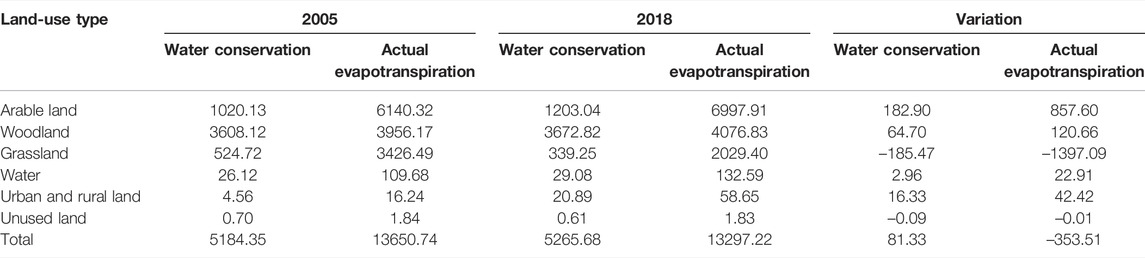
TABLE 4. Average variations in water conservation and actual evapotranspiration in the Pengxi River Basin in 2005 and 2018 (104 m3).
Under different precipitation conditions (Figure 8 and Table 5), the average water conservation depth in the wet years increased by 86.52 and 135.84 mm compared to the normal years and dry years, respectively, and the total water conservation increased by 32.62 and 17.55% under the low water level control. The effects of the different precipitation conditions on the water conservation were similar under the high water level and low water-level control. The results revealed that the influence of the precipitation conditions on water conservation was greater than that of the water level difference caused by the operation of the water conservancy projects. The precipitation conditions had a significant effect on the water conservation values of the different land cover types. The distribution of the water conservation was similar to that of the vegetation cover, that is, the high values are mainly distributed in the northeastern part of the Pengxi River Basin.
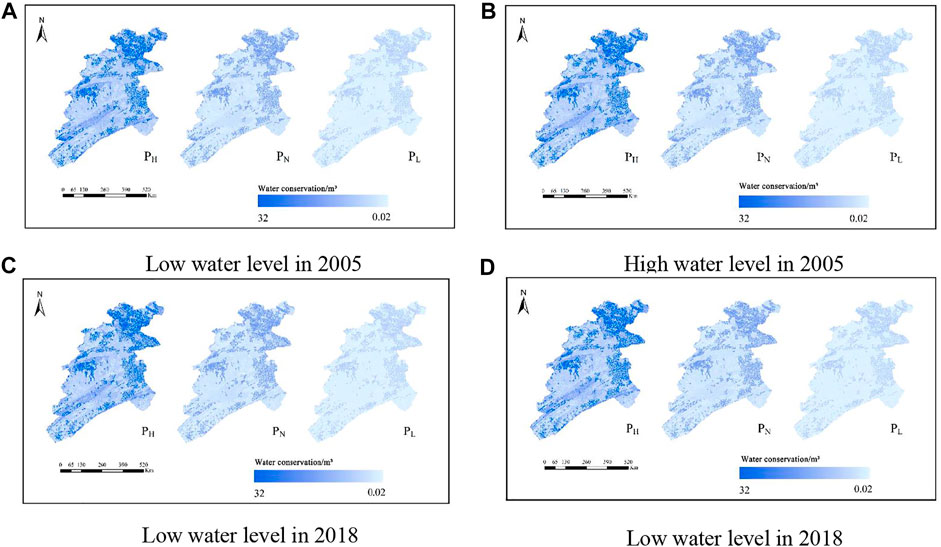
FIGURE 8. Distribution of the water conservation for different water levels under the different precipitation scenarios in 2005 and 2018.
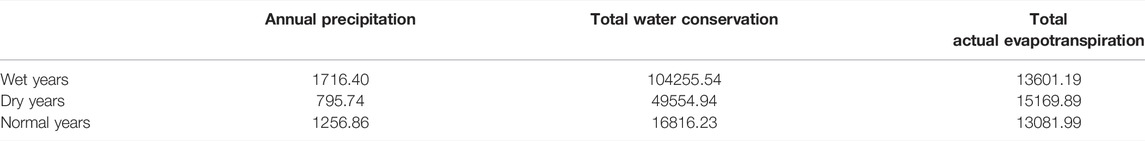
TABLE 5. Response of water conservation function under different precipitation conditions (Unit: 10,000 m3).
The average evapotranspiration and total actual evapotranspiration were the highest in the normal years, followed by the wet years, and were the lowest in the dry years (Figure 9). Under the low water-level control, the average evapotranspiration in the dry years increased by 25.99 and 45.78 mm compared with the wet years and normal years, respectively, and the total actual evapotranspiration increased by 10.34 and 13.76%. Under the high water-level control, the average evapotranspiration in the normal years was 25.80 and 45.42 mm compared with that in the dry years and wet years, respectively. Spatially, the actual evapotranspiration was stronger in the eastern part of Xiaojiagou in the normal years. This was mainly because there were more paddy fields, grassland, and beaches in the east, so the potential evapotranspiration was relatively large and the change was obvious.
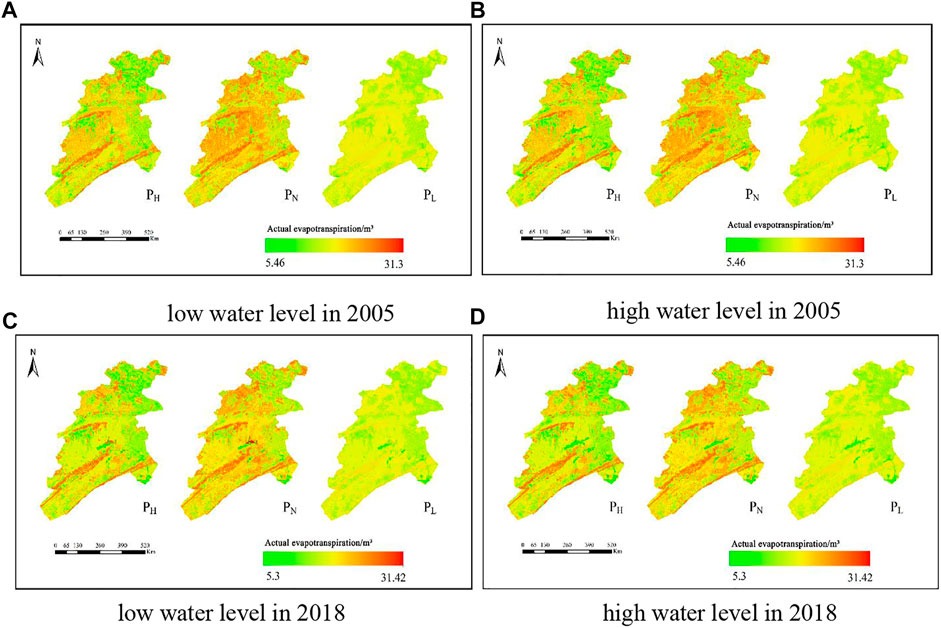
FIGURE 9. Distribution of the total actual evapotranspiration for the different water levels under the different precipitation conditions in 2005 and 2018.
Overall, the average water conservation depth and total water conservation in the Pengxi River Basin were highest in the wet years, followed by the normal years, and were the lowest in the dry years. However, the average evapotranspiration and total actual evapotranspiration were the highest in the normal years, followed by the wet years, and were the lowest in the dry years.
Under the land cover conditions and low water-level control in 2005, the average water conservation depth under the low-temperature scenario was 25.27 mm higher (61.04%) than that under the high-temperature scenario. The average evapotranspiration under the high-temperature scenario was 29.72 mm higher (11.44%) than that under the low-temperature scenario. Under the land cover conditions and high water-level control in 2005, the average water conservation depth under the low-temperature scenario was 24.85 mm higher than that under the high-temperature scenario. The average evapotranspiration under the high-temperature scenario was 23.29 mm higher (9.19%) than that under the low-temperature scenario.
Under the land cover conditions and low water-level control in 2018 (Table 6), the annual average water conservation depth under the low-temperature scenario was 25.58 mm higher (63.56%) than that under the high-temperature scenario. The annual average evapotranspiration under the high-temperature scenario was 28.73 mm higher (11.13%) than that under the low-temperature scenario. Under the land cover conditions and high water-level control in 2018, the annual average water conservation depth under the low-temperature scenario was 25.66 mm (62.67%) higher than that under the high-temperature scenario. The annual average evapotranspiration under the high-temperature scenario was 29.82 mm higher (11.48%) than that under the low-temperature scenario.
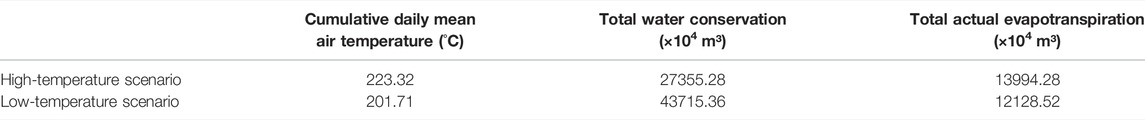
TABLE 6. Response of water conservation function to evapotranspiration conditions.
If the water level and surface cover conditions are ignored, the water conservation level was about 60% higher under the low-temperature scenario than under the high-temperature scenario, and the total actual evapotranspiration was about 12–13% higher under the high-temperature scenario than under the low-temperature scenario. In particular, the temperature in the southwestern part of the Pengxi River Basin was higher under the high-temperature scenario, so the actual evapotranspiration in the southwestern part of the Pengxi River Basin was larger, which was in sharp contrast to the low-temperature scenario (Figure 10). Therefore, the air temperature was also one of the important factors controlling the water conservation function. Precipitation and temperature not only affected the total amount of water conservation, but also affected its spatial distribution.
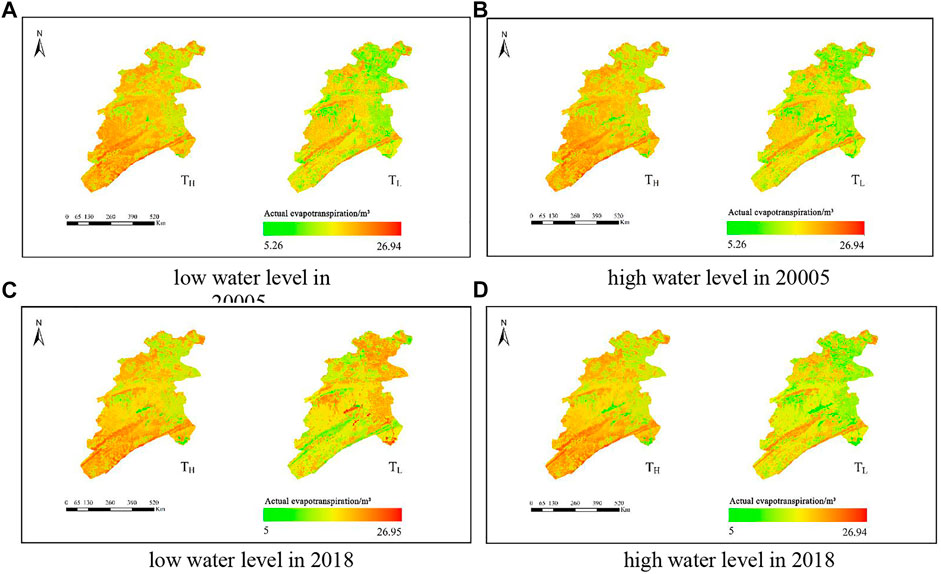
FIGURE 10. Distributions of the total actual evapotranspiration for different water levels under different annual precipitation and evapotranspiration conditions in 2005 and 2018.
In the case of precipitation and temperature extremes, the changes in the water conservation function were significantly different (Figure 11; Table 7). Under the low-temperature and high rainfall scenarios, the water conservation reached the maximum value, and it was as high as 112.3979 × 10⁶ m³ for the high water-level control in 2018. In contrast, the lowest value occurred under the high temperature and low rainfall scenario, and it was as low as 14.3569 × 10⁶ m³ under the low water-level control in 2005. There was an order of magnitude difference between them, that is, a difference of about 98 × 106 m³ (87.23%).
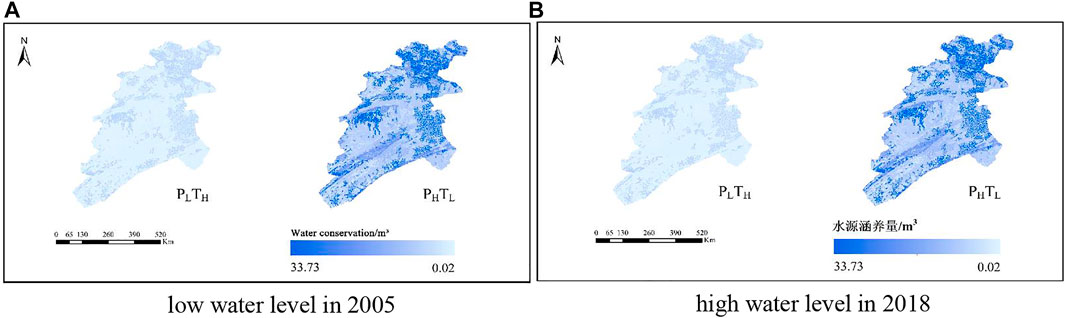
FIGURE 11. Distribution of water conservation under extreme meteorological conditions for different water levels in 2005 and 2018.
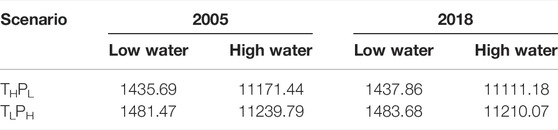
TABLE 7. Change in the total water conservation under the influence of double extreme scenarios (unit: 10,000 m³).
Similarly, under the two extreme evapotranspiration and precipitation scenarios for the study area, the average difference in the average water conservation was 9.6 m³ (Figure 12). From the perspective of the spatial distribution, the amount of water conservation was not only related to the type of ecosystem but also to the precipitation and air temperature distributions in the region (Table 8).
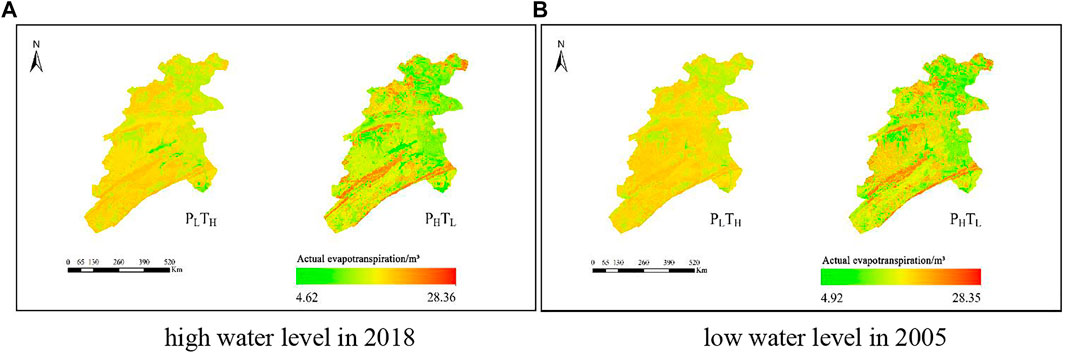
FIGURE 12. Comparison of actual evapotranspiration for different water levels in 2005 and 2018.
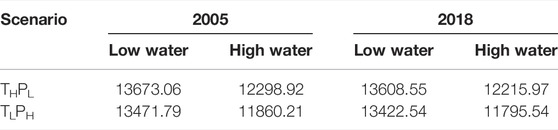
TABLE 8. Change in the total actual evapotranspiration under the influence of dual extreme scenarios (unit: 10,000 m³).
The maximum and minimum values of actual evapotranspiration increased in the Pengxi River Basin were 136,730,600 m³ and 117,953,300 m³, respectively, that is, a difference of 15.91%. The main reason for the high and low values is that the population and urban land in the study areas were mainly distributed near Qukou Town. When the water level changed, the main change in the land cover type was reflected in the water area and cultivated land, and the actual evapotranspiration per unit area of these two land cover types was higher.
The InVEST model was used to simulate the water-level changes in the study area and different meteorological conditions to obtain the amount of water supplied to the study area after subtracting the actual evapotranspiration from the precipitation and to calculate the water production coefficients and water production moduli of all of the scenarios. The results were compared with the water production modulus and water production coefficients for Kaizhou and Yunyang in Chongqing, which are located in the study area, obtained from the Chongqing Water Resources Bulletin (Table 9). The relative error of the validation model is 0.2, which shows that the model results are reliable.
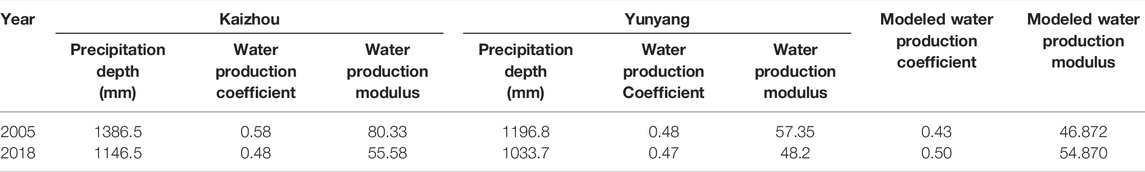
TABLE 9. Model availability validation.
The operation of the nested water conservation projects resulted in a positive trend in the water catchment’s function. The operation of the water conservation projects has had a certain influence on the water conservation, but the meteorological conditions have had a greater impact on it. Moreover, the simulation results of the different precipitation and temperature scenarios show that the water conservation function responded more significantly to the precipitation conditions, which is consistent with the results of previous studies (Delphin et al., 2016; Dai and Wang, 2020). The depth of the water cover in this study is generally consistent with the precipitation trend. In addition, the water conservation function responded most significantly to the combined effect of the precipitation and temperature. In low temperature and high rainfall years, the water conservation was extremely high, especially under the high water-level control scenario after the operation of the nested water conservancy projects began, and the water conservation exceeded 100 × 106 m³. In contrast, the lowest values occurred in the high temperatures and low rainfall years, with water conservation of around 14 × 106 m³. The highest and lowest values are quantitatively different. Under the high-temperature scenario, the potential evapotranspiration was higher and the water conservation was lower. This is consistent with the findings of Chen et al. (2016) and Wang et al. (2021). Therefore, the influences of the complex environmental factors on the regional water conservation service function deserve further attention.
Climate change, management policies, and other factors have a certain impact on the function and value of ecological services (Luo et al., 2019; Marques et al., 2021). Relevant research results have shown that the terrain also has a certain impact on the evapotranspiration conditions and water conservation. Water conservation increases as the slope and topographic relief increase, and it fluctuates as the topographic position index increases (Xu et al., 2020). The topographic gradient significantly affects the water supply (Gao et al., 2016; Zhou et al., 2021). Hu et al. (2021) found that the correlation between the heterogeneity of the landscape and water conservation is higher than that between climate factors and water conservation (Hu et al., 2021). The impact of the landscape pattern on water-related ecosystem services is mainly reflected in the change in the intensity, but the dominant relationship does not change (Li et al., 2021b). Therefore, the influences of terrain and landscape heterogeneity on water conservation will be considered further in future studies.
The factors influencing the water conservation service function are complex and differ significantly in different situations. In the study area, there was a positive correlation between the land cover changes and water conservation changes. Among the land cover types, the forest ecosystem contributed the most to the water conservation, with an average contribution rate of 68%. The Pengxi River Basin is an important water conservation area in northeastern Chongqing and is an important component of the Yangtze River ecological corridor.
Under the operation of nested water conservancy projects, the water conservation function has exhibited a positive development trend. The operation of the water conservancy project has had a certain effect on the water conservation function, but the meteorological conditions have had a greater effect. A comprehensive comparison of the water conservation function under seven simulated scenarios revealed that the changes in the precipitation and air temperature were the leading factors causing the changes in the water conservation function. However, there were differences in the mechanisms by which these two factors affected the water conservation function. Comparatively, precipitation had the greatest influence on the water conservation function.
The data analyzed in this study is subjected to the following licenses/restrictions: part of the dataset comes from the weather bureau. Data can only be used with the approval of the weather bureau. Requests to access these datasets should be directed to XD|, ZHhuOThtcnlAc29odS5jb20=.
CZ and RL contributed to the conception and design of the study. YM, RL, and XD organized the database. WQ and YM performed the statistical analysis and created the figures. CZ and WQ wrote the first draft of the manuscript. CZ, WQ, YM, and BY wrote sections of the manuscript. All of the authors contributed to the revision of the manuscript and have read and approved the submitted version.
This research was financially supported by the Chongqing Natural Science Foundation Project (cstc2019jcyj-msxmX0227), the Chongqing Normal University Fund Project (No.19XL13011), the Chongqing Social Science Planning Project (2019QNGL23), the Belt and Road Special Foundation of the State Key Laboratory of Hydrology-Water Resources and Hydraulic Engineering (2021490211), the Chongqing University Innovation Research Group funding (No.CXQT20015), and the Science and Technology Research Project of the Chongqing Education Commission (KJQN201900524).
The authors declare that the research was conducted in the absence of any commercial or financial relationships that could be construed as a potential conflict of interest.
All claims expressed in this article are solely those of the authors and do not necessarily represent those of their affiliated organizations, or those of the publisher, the editors, and the reviewers. Any product that may be evaluated in this article, or claim that may be made by its manufacturer, is not guaranteed or endorsed by the publisher.
The authors thank the Southwest Mountain Center of the National Earth System Science Data Center for providing the surface cover data and the Chongqing Meteorological Bureau for providing the precipitation and temperature data. We thank LetPub (www.letpub.com) for its linguistic assistance during the preparation of this article.
Almeida, B., and Cabral, P. (2021). Water Yield Modelling, Sensitivity Analysis and Validation: A Study for Portugal. ISPRS Int. J. Geo-Inf. 10 (8), 494. doi:10.3390/ijgi10080494
Aneseyee, A. B., Soromessa, T., and Elias, E. (2022). Evaluation of Water Provision Ecosystem Services Associated with Land Use/Cover and Climate Variability in the Winike Watershed, Omo Gibe Basin of Ethiopia. Environ. Manag. 69, 367–383. doi:10.1007/s00267-021-01573-9
Benra, F., De Frutos, A., Gaglio, M., Álvarez-Garretón, C., Felipe-Lucia, M., and Bonn, A. (2021). Mapping Water Ecosystem Services: Evaluating InVEST Model Predictions in Data Scarce Regions. Environ. Model. Softw. 138, 104982. doi:10.1016/j.envsoft.2021.104982
Capon, S. J., Leigh, C., Hadwen, W. L., George, A., McMahon, J. M., Linke, S., et al. (2018). Transforming Environmental Water Management to Adapt to a Changing Climate. Front. Environ. Sci. 6, 80. doi:10.3389/fenvs.2018.00080
Chen, S.-S., Liu, K., and Bao, Y.-B. (2016). Spatial Pattern and Influencing Factors of Water Conservation Service Function in Shangluo City. Sci. Geogr. Sin. 2016 (10, 1546–1554). doi:10.13249/j.cnki.sgs.2016.10.012
Chen, W.-X., Zhao, X.-L., Zhong, M.-X., Li, J., and Zeng, J. (2022). Spatiotemporal Evolution Patterns of Ecosystem Health in the Middle Reaches of the Yangtze River Urban Agglomerations. Acta Ecol. Sin. 2022 (01, 2–12). doi:10.5846/stxb202012093142
Cheng, H., Wu, S.-J., Wang, X.-X., Jiang, Y., Chen, C.-D., Wang, Y., et al. (2015). Research Progress on the Effects of the Three Gorges Reservoir on the Ecological Environment. Chin. J. Eco-Agriculture 23 (02), 127–140. doi:10.13930/j.cnki.cjea.140734
Cheng, L., Opperman, J. J., Tickner, D., Speed, R., Guo, Q., and Chen, D. (2018). Managing the Three Gorges Dam to Implement Environmental Flows in the Yangtze River. Front. Environ. Sci. 6, 64. doi:10.3389/fenvs.2018.00064
Dai, E.-F., and Wang, Y.-H. (2020). Spatial Heterogeneity and Driving Mechanisms of Water Yield Service in the Hengduan Mountain Region. Acta Geogr. Sin. 75 (3), 607–619. doi:10.11821/dlxb202003012
Delphin, S., Escobedo, F. J., Abd-Elrahman, A., and Cropper, W. P. (2016). Urbanization as a Land Use Change Driver of Forest Ecosystem Services. Land Use Policy 54, 188–199. doi:10.1016/j.landusepol.2016.02.006
Gao, H.-J., Han, H.-Q., Yu, H.-Y., and Han, M.-R. (2016). Distribution Characteristic of Important Ecosystem Services in Terrain Gradient in Wujiang River Basin. Ecol. Sci. 2016 (05), 154–159. doi:10.14108/j.cnki.1008-8873.2016.05.021
Gong, X.-J., Wang, X.-F., Liu, T.-T., Yuan, X.-Z., Kong, W.-W., and Liu, H. (2020). Spatial-temporal Characteristics of Carbon,nitrogen and Phosphorus and Eutrophication Assessment in a Typical River of Three Gorges Reservoir under the Development of Field Towns. J. Lake Sci. 32 (01), 111–123. doi:10.18307/2020.0111
He, X.-B., and Bao, Y.-H. (2019). Research Advances on Soil Erosion and Ecological Restoration in the Riparian Zone of the Three Gorges Reservoir. Sci. Soil Water Conservation 17 (04), 160–168. doi:10.16843/j.sswc.2019.04.019
Hu, C.-H. (2019). Analysis on Sediment Scouring and Silting Variation of Three Gorges Reservoir since 175 M Trial Impoundment for Past Ten Years. Water Resour. Hydropower Eng. 50 (08), 18–26. doi:10.13928/j.cnki.wrahe.2019.08.003
Hu, W., Li, G., and Li, Z. (2021). Spatial and Temporal Evolution Characteristics of the Water Conservation Function and its Driving Factors in Regional Lake Wetlands—Two Types of Homogeneous Lakes as Examples. Ecol. Indic. 130, 1470. doi:10.1016/j.ecolind.2021.108069
Li, J., Zhou, K., Xie, B., and Xiao, J. (2021). Impact of Landscape Pattern Change on Water-Related Ecosystem Services: Comprehensive Analysis Based on Heterogeneity Perspective. Ecol. Indic. 133, 108372. doi:10.1016/j.ecolind.2021.108372
Li, M.-Y., Liu, T.-X., Luo, Y.-Y., Duan, L.-M., Zhang, J.-Y., and Zhou, Y.-J. (2019). Pedo-Transfer Function and Remote-Sensing-Based Inversion Saturated Hydraulic Conductivity of Surface Soil Layer in Xilin River Basin. Acta Pedol. Sin. 56 (1), 90–100. doi:10.11766/trxb201803200104
Li, Q.-Q., and Hao, F.-J. (2019). Deformation Trend Judgment and Prediction of Accumulated Layer Landslide in Three Gorges Reservoir Area. Water Resour. Hydropower Eng. 50 (05), 228–233. doi:10.13928/j.cnki.wrahe.2019.05.027
Li, W.-J., Wang, S., Li, Q., Wu, T.-L., and Zhao, X.-Y. (2021a). The Impacts of Climate and Land Use Changes on Water Yield in the Beisan River Basin. J. East China Normal Univ. Sci. 2021 (04), 99–108. doi:10.3969/j.issn.1000-5641.2021.04.012
Li, W.-J., Zhu, K., Ran, Y.-G., Ran, J.-J., and Huang, P. (2021b). Effects of Land-Use Types and Off-Season Water-Level Fluctuation on Component Characteristics of Soil Active Organic Carbon. J. Soil Water Conservation 35 (02), 178–183. doi:10.13870/j.cnki.stbcxb.2021.02.024
Lu, B. (2021). A Review of the Literature on Ecological Restoration of the Three Gorges Reservoir Area's Subsidence Zone. Technol. Innovation Appl. 11 (19), 1–8.
Lu, Z.-X., Feng, Q., Xiao, S., Xie, J., Zou, S., Yang, Q., et al. (2021). The Impacts of the Ecological Water Diversion Project on the Ecology-Hydrology-Economy Nexus in the Lower Reaches in an Inland River Basin. Resour. Conservation Recycl. 164, 105154. doi:10.1016/j.resconrec.2020.105154
Luo, Y., Lu, Y., Fu, B., Zhang, Q., Li, T., Hu, W., et al. (2019). Half Century Change of Interactions Among Ecosystem Services Driven by Ecological Restoration: Quantification and Policy Implications at a Watershed Scale in the Chinese Loess Plateau. Sci. Total Environ. 651 (Pt 2), 2546–2557. doi:10.1016/j.scitotenv.2018.10.116
Marques, S. M., Campos, F. S., David, J., and Cabral, P. (2021). Modelling Sediment Retention Services and Soil Erosion Changes in Portugal: A Spatio-Temporal Approach. ISPRS Int. J. Geo-Inf. 10 (4), 262. doi:10.3390/ijgi10040262
Pan, Y., Zheng, H., Yi, Q., and Li, R. (2021). The Change and Driving Factors of Ecosystem Service Bundles: A Case Study of Daqing River Basin. Acta Ecologica Sinica. 13, 5204–5213. doi:10.5846/stxb202103100650
Raji, S. A., Odunuga, S., and Fasona, M. (2021). Quantifying Ecosystem Service Interactions to Support Environmental Restoration in a Tropical Semi-arid Basin. Acta Geophys. 69 (5), 1813–1841. doi:10.1007/s11600-021-00644-z
Ren, M., and Mao, D.-H. (2021). Supply and Demand Analysis and Service Flow Research of Water Production Service in Lianshui River Basin. Ecol. Sci. 40 (02), 186–195. doi:10.14108/j.cnki.1008-8873.2021.02.023
Shen, Z.-F., Zhang, K.-J., Xia, X., and Hu, L. (2021). Bibliometric Analysis of the Current Situation and Hot Research Topics on the Water Level Fluctuation Zone (WLFZ) of Three Gorges Reservoir. J. Hydroecology 42 (01), 26–34. doi:10.15928/j.1674-3075.202006280187
Shrestha, M., Piman, T., and Grünbühel, C. (2021). Prioritizing Key Biodiversity Areas for Conservation Based on Threats and Ecosystem Services Using Participatory and GIS-Based Modeling in Chindwin River Basin, Myanmar. Ecosyst. Serv. 48, 101244. doi:10.1016/j.ecoser.2021.101244
Wang, B.-S., Chen, H.-X., Dong, Z., Zhu, W., Qiu, Q.-Y., and Tang, L.-N. (2020). Impact of Land Use Change on the Water Conservation Service of Ecosystems in the Urban Agglomeration of the Golden Triangle of Southern Fujian, China, in 2030. Acta Ecol. Sin. 40 (02), 484–498. doi:10.5846/stxb201902180286
Wang, R., Peng, Q., Zhang, W., Liu, C., and Zhou, L. (2022). Ecohydrological Service Characteristics of Qilian Mountain Ecosystem in the Next 30 Years Based on Scenario Simulation. Sustainability 14, 1819. doi:10.3390/su14031819
Wang, X.-F., Fu, X.-X., Chu, B.-Y., Li, Y., Yan, Y., and Feng, X.-M. (2021). Spatio-temporal Variation of Water Yield and its Driving Factors in Qinling Mountains Barrier Region. J. Nat. Resour. 36 (10), 2507–2521. doi:10.31497/zrzyxb.20211005
Xiao, Y., Xiao, Q., Ouyang, Z., and Maomao, Q. (2015). Assessing Changes in Water Flow Regulation in Chongqing Region, China. . Environ. Monit. Assess. 187. doi:10.1007/s10661-015-4370-4
Xu, C.-X., Gong, J., Li, Y., Yan, L.-L., and Gao, B.-L. (2020). Spatial Distribution Characteristics of Typical Ecosystem Services Based on Terrain Gradients of Bailongjiang Watershed in Gansu. Acta Ecol. Sin. 40 (13), 4291–4301. doi:10.5846/stxb201911152447
Zeng, W., and Wang, L.-L. (2017). Research on Migrant Community Optimization in the Three Gorges from the Perspective of Social Network. Chongqing Archit. 2017 (07), 5–10. doi:10.3969/j.issn.1671-9107.2017.07.005
Zhang, H.-F., Ouyang, Z.-Y., and Zheng, H. (2007). Spatial Scale Characteristics of Ecosystem Services. Chin. J. Ecol. 26 (09), 1432–1437. doi:10.13292/j.1000-4890.2007.0247
Zhang, X.-L., Xiong, L.-H., Lin, L., and Long, H.-F. (2012). Application of Five Potential Evapotranspiration Equations in Hanjiang Basin. Arid. Land Geogr. 2012 (02), 229–237. doi:10.13826/j.cnki.cn65-1103/x.2012.02.006
Zhao, Y.-R., Zhou, J.-J., Lei, L., Xiang, J., Huang, M.-H., Feng, W., et al. (2019). Identification of Drivers for Water Yield in the Upstream of Shiyang River Based on InVEST Model. Chin. J. Ecol. 38 (12), 3789–3799. doi:10.13292/j.1000-4890.201912.017
Keywords: InVESTt model1, water yield2, nested area of water conservancy project3, hydrology weather condition4, Lucc5
Citation: Zeng C, Qi W, Mao Y, Liu R, Yu B and Dong X (2022) Water Conservation Ecological Service Function and Its Value Response Mechanism in a Nested Water Conservancy Project Area. Front. Environ. Sci. 10:887040. doi: 10.3389/fenvs.2022.887040
Received: 01 March 2022; Accepted: 09 May 2022;
Published: 06 July 2022.
Edited by:
Zhenzhong Zeng, Southern University of Science and Technology, ChinaReviewed by:
Chuanfu Zang, South China Normal University, ChinaCopyright © 2022 Zeng, Qi, Mao, Liu, Yu and Dong. This is an open-access article distributed under the terms of the Creative Commons Attribution License (CC BY). The use, distribution or reproduction in other forums is permitted, provided the original author(s) and the copyright owner(s) are credited and that the original publication in this journal is cited, in accordance with accepted academic practice. No use, distribution or reproduction is permitted which does not comply with these terms.
*Correspondence: Chunfen Zeng, Y2Z6ZW5nMThAMTYzLmNvbQ==; Rui Liu, bGl1ckBjcW51LmVkdS5jbg==
Disclaimer: All claims expressed in this article are solely those of the authors and do not necessarily represent those of their affiliated organizations, or those of the publisher, the editors and the reviewers. Any product that may be evaluated in this article or claim that may be made by its manufacturer is not guaranteed or endorsed by the publisher.
Research integrity at Frontiers
Learn more about the work of our research integrity team to safeguard the quality of each article we publish.