 Yang Guangming1,2
 Zhang Fengtai
- 1Management College, Chongqing University of Technology, Chongqing, China
- 2Research Center of Rural Revitalization and Regional High Quality Development, Chongqing University of Technology, Chongqing, China
In order to achieve sustainable development, low-carbon economic efficiency (LCEE) is particularly important in China. Therefore, this study uses SBM-DEA model to evaluate the LCEE of 30 provinces in China from 2008 to 2017. Based on the uncoordinated coupling model, this study discusses the interaction between China’s provincial LCEE and scientific and technological development level (STDL), and uses the panel VAR model to consider the interactive response relationship between China’s provincial LCEE and STDL. The research shows that the uncoordinated coupling degree (UCCD) between the STDL and LCEE in 30 provinces showed a decreasing trend as a whole during the research period. In terms of spatial distribution, the provinces with UCCD less than 0.5 mainly concentrated in the eastern and southern provinces, gradually spread to the north, and showed positive spatial autocorrelation, with significant spatial accumulation effect. From the perspective of influencing factors, patents, urbanization level, traffic level and financial development have significant positive effects on promoting the coordinated development of STDL and LCEE. From the relationship between them, the STDL has a positive promoting effect on LCEE, but the mechanism of the two is not obvious enough. Therefore, it is necessary to emphasize the coordinated development of low-carbon economy and science and technology, and promote the development of low-carbon economy through scientific innovation.
1 Introduction
Climate change has become one of the most important environmental problems in the world due to consumption of fossil fuels (Abid et al., 2019; Elahi et al., 2021a). Under the background of global warming, it is necessary to reduce energy consumption and greenhouse gas emissions by promoting a low-carbon economy (Elahi et al., 2022a; 2022b). Understanding the adoption measures in the production system is imperative (Elahi et al., 2021b). As the largest developing country, carbon emitter, and energy consumer in the world, China is facing substantial domestic and international pressure. Under the background of global warming, it is necessary to reduce energy consumption and greenhouse gas emissions by promoting low-carbon economy.
While the concept of the low-carbon economy is focused on the goal of reducing carbon dioxide emissions and coping with global climate change, it also affects all aspects of economic, social, and public life. The goal of the low-carbon economy is mainly to limit greenhouse gas emissions caused by human activities and mitigate the impact of climate change. In recent years, many people have committed to transforming the world into a low-carbon economy. A series of policies have been formulated to control the implementation of a low-carbon economy. For example, the United Nations Framework Convention on Climate Change (UNFCCC) was launched in 1992 to accelerate the reduction of carbon dioxide emissions. The annual climate change conference was held within the framework of UNFCCC, and many relevant agreements and policies were formulated (Johnston et al., 2005; Huettner et al., 2010). Many signatory countries are seeking the best way to reduce greenhouse gas emissions and have formally promised to control their domestic carbon dioxide emissions (to some extent). For example, looking towards 2050, European countries such as Britain, France, and Germany set long-term targets of 60%, 75%, and 80% reduction, respectively, compared with their levels in 1990 (Shimada et al., 2007). China has also taken effective measures to solve the problems of energy conservation and greenhouse gas emission.
Since 2000, although the total amount of carbon dioxide emissions has increased, the intensity of carbon emissions has declined, and the rate of decline is faster than that of other countries From 1971 to 2015, China’s carbon intensity dropped significantly (73.9%), and the United States’ carbon intensity dropped by 65.3%. In addition, the Carbon Emission Committee has set strict carbon emission intensity targets. For example, on 22 September 2020, the Chinese government put forward at the 75th UN General Assembly: “China will increase its national independent contribution, adopt more powerful policies and measures, and strive for the peak of carbon dioxide emissions by 2030 and carbon neutrality by 2060.”
Developing low-carbon economy is a new model of China’s future economic development, and it is also an inevitable trend. Technological innovation is the core power of low-carbon economy. However, the negative effects brought by neglecting low-carbon economy are becoming more and more obvious, so it is necessary to integrate the concept of scientific and technological innovation into the development process of low-carbon economy. Therefore, it is particularly important to realize the harmonious unity of scientific and technological innovation and low-carbon economy, and scientific and technological innovation is the key to low-carbon economy.
The rest of this paper is arranged as follows: Section 2 sorts out relevant literature; Section 3 introduces the methods, indicators and data sets; Section 4 discusses the measurement results, temporal and spatial dynamics, spatial correlation, interactive response relationship and influencing factors; Section 5 summarizes and discusses the research results, and provides suggestions for decision makers.
2 Literature Review
In the process of development, China is facing serious challenges in economic growth and unbalanced emissions (Venkataraman, 2004; Bo-Feng et al., 2012; Battistella et al., 2013; Yoon et al., 2015; Liu and Liu, 2016; Zhang N et al., 2017; Zhang et al., 2018; Wang X et al., 2019). In China, from 1986 to 2008, using DEA model to calculate carbon emission efficiency found that it is an effective measure to improve carbon emission efficiency through innovation (Lee and Lee, 2009; Guo et al., 2011). At present, most of the existing researches calculate the efficiency from the perspective of carbon emission, and the measurement of carbon emission efficiency can be divided into single-factor carbon emission efficiency and full-factor carbon emission efficiency (Wang Z et al., 2016). Studies have shown that technological progress can significantly promote the efficiency of total factor carbon emissions (Cheng et al., 2018). In the existing research, most scholars have studied the relationship between economic development and carbon emission efficiency. Although this is in line with China’s current resource management situation and policies aimed at improving management efficiency, it has no significant effect on promoting regional sustainable development. The existing literature lacks the calculation of regional low-carbon economic efficiency.
This paper integrates comprehensive economic indicators and carbon emission indicators to calculate the provincial low-carbon economic efficiency. In recent years, the DEA model has been widely used in the measurement of energy efficiency and carbon dioxide emission efficiency at the macroeconomic level because it incorporates economic and environmental factors into multiple input–output data (Guo et al., 2011). For example, Lee et al. analyzed the energy efficiency performance of 47 government office buildings using the DEA method (Lee and Lee, 2009). When using DEA to measure environmental performance, we first use linear programming and convex analysis to construct a production boundary, then project different decision-making units onto the production boundary, and evaluate the relative efficiency by comparing the distance between decision-making units and the production frontier (Bo-Feng et al., 2012; Liu et al., 2016). Therefore, many scholars use the traditional DEA method to evaluate the environmental performance. Spillover effects will have an impact between regions (Sun, 2018). The closer the regions are, the more relevant the regions are. According to this concept, regional carbon emission efficiency should decrease with the increase of distance. Carbon emission is mainly a by-product in the process of industrial production and development, which reflects the efficiency of energy utilization. Previous modeling research mainly used shadow price and unexpected variables as input variables; However, this method can’t meet the demand of minimizing unwanted output while improving productivity. Therefore, Tone (2001) established the unexpected Slack-Based Measures model to solve directional measures and non-directional measures.
Recently, the extended data envelopment analysis model has been widely used in the field and application of energy efficiency in China (Meng et al., 2016). The Slacks-based model (SBM) with imperfect output, the SBM with super efficiency, the SBM with two ideal outputs and super efficiency, the advanced technology model, the directional distance function, and the non-radial beam method have all been proven in the literature (Cecchini et al., 2018; Huang et al., 2018; Kang et al., 2018a; Wang G et al., 2019; Wang et al., 2015; Wu et al., 2020). Lu et al. (2013) measured the CO2 emission efficiency of 32 Organisation for Economic Co-operation and Development (OECD) countries using a hybrid efficiency data model (Lu et al., 2013).
However, the research on low-carbon development is mostly very single. Some scholars reported the carbon emissions of a single low-carbon pilot city. Some scholars have reported the carbon emissions of a single low-carbon pilot city. For example, regarding Beijing (Shen et al., 2018), Jiang and others used structural equation models to evaluate the relationship between output efficiency and environmental efficiency in Jiangsu Province (Jiang et al., 2016). Clarke-Sather adopted the life cycle assessment method to assess the potential of improving lighting efficiency in Gansu Province (Clarke-Sather et al., 2016). Because the existing research uses different methods, scopes, and data, it is difficult to compare their results. This means it can’t be used for a macro-policy adjustment at the national level, which is very important for developing countries like China. The purpose of this study is to empirically evaluate the relationship between China’s provincial STDL and LCEE. Compared with other similar studies, they are from resources (Alonso et al., 2016), industries (Yu et al., 2018), electricity (Yuan et al., 2018), buildings (Gan et al., 2018), cities (Li et al., 2017; Fang et al., 2018; Long et al., 2018), transportation (Dong et al., 2018), and low-carbon technologies (Kang et al., 2018b), all of which are closely related to the development of low-carbon economy. The focus of this paper is not the influence of a single industry or technology on the efficiency of the low-carbon economy, but a systematic consideration of the scientific and technological development level.
In terms of research methods, a range of methods such as comparative analysis (Zhan and de Jong, 2018), cluster analysis (Schanes et al., 2019), scenario analysis (Hu et al., 2011), modeling methods (Tan et al., 2017; Zhao et al., 2017; Lou et al., 2018), and evaluation methods are frequently used in research into the low-carbon economy. With the deepening understanding of scientific development management, the coupling coordination model has become an effective evaluation and research tool for studying the overall balanced development degree of the region. For example, Ma analyzed the coupling and coordination among population, land, and industry, and investigated the urban sustainability of Ansuluan, China (Ma et al., 2019). Ai explored the relationship between population aging and ecosystem quality in Lianyungang City by using the coupling coordination model, and found that the comprehensive level of ecosystem quality has declined since 1985, and dropped sharply after 2005 (Ai et al., 2016). Yang et al. (2014) established a coordinated development index based on the coupled coordination model, focusing on the coordination level of the economic and social environment and its comprehensive development level (Li et al., 2019; Xie et al., 2019). At present, there is little research on the coordinated coupling between STDL and LCEE. The so-called uncoordinated coupling refers to the non-benign interaction phenomenon between STDL and LCEE in the interaction characteristics, effect and evolution trend. It is a phased problem in the development of regional human-land relationship, and it has certain inevitability. Based on the perspective of reverse thinking and problem diagnosis, uncoordinated coupling is studied as a scientific problem, which builds a bridge between uncoordinated pathology and coordinated development for the study of the coupling relationship between STDL and LCEE.
To sum up, there has always been a close relationship between technological innovation and low-carbon economy. Some achievements have been made in scientific and technological innovation and low-carbon economy research. Therefore, based on the interaction between coordination and non-coordination, this paper takes 30 provinces in China as the research object, selects the sample data from 2008 to 2017, and discriminates the non-coordination coupling relationship between STDL and LCEE by setting up a model. The panel VAR model is used to consider the interactive response relationship between STDL and LCEE, so as to expand the existing research perspective and further promote the development of low-carbon economy in China. Finally, based on the investigation of uncoordinated coupling, the tobit model is used to determine the factors that affect the development of uncoordinated coupling, and the influence degree of different factors on uncoordinated coupling is compared.
3 Research Methods and Data Sources
3.1 LCEE Evaluation Model
Data envelopment analysis is a research method that is widely used in studies related to multi-objective decision problems. It uses linear programming to analyze the effectiveness of the same type of units of input–output indicators. Since it was proposed by Charnes (Charnes et al., 1978), DEA models have been used widely and gradually improved. To solve the problem of slackness of inputs and outputs, Tone proposed a non-radial, non-angle based SBM model with slack variables. The model solves the impact of slack variables on the measurement value by incorporating the slack variables of each input and output directly into the objective function. The equation is as follows (Chu et al., 2018; Chen et al., 2021; Pishgar-Komleh et al., 2021).
where
3.2 Uncoordinated Coupling Measurement Model
3.2.1 Index System
As the development level of the low-carbon economy varies from region to region, this paper uses LCEE to measure the quality of low-carbon development in different regions. In this paper, based on analysis of the research on evaluation index selection of LCEE by many scholars in recent years, combined with China’s own unique advantages, the index selection is mainly made from two aspects. For the input index: the year-end employee index (l); the number of employees is selected to reflect this index. As for the capital investment index (K), this paper uses the perpetual inventory method (PIM) to calculate the stock of fixed assets instead of the capital investment (Song et al., 2013; Huang et al., 2018; Xue et al., 2021). Energy consumption (EN): this paper adopts the total energy consumption of raw coal, crude oil, natural gas, oil, etc. In terms of output indicators, this paper selects two indicators: GDP and CO2 emissions (Zhang J et al., 2017; Yang et al., 2021). GDP is chosen to reflect the economic growth, but to account for price changes and other factors this paper makes a price reduction. With regard to the carbon emission index, this paper takes the CO2 emissions of various provinces and cities from 2008 to 2017 from the data published by the database -CEDS.
When considering the scientific and technological innovation level, the full-time equivalent of R&D personnel, the number of R&D projects, and the internal expenditure of R&D funds are selected as input indicators (Chen et al., 2018; Li and Zhang, 2021); the sales revenue of new products in high-tech industries and the expenditure of education funds are taken as output indicators; and the expenditure of education funds, the number of research and development institutions, and the number of ordinary colleges and universities are taken as environmental support for calculations (Yam et al., 2011; Hue, 2019).
Considered in combination with relevant research, the indicators selected in this paper largely reflect the development of LCEE and the STDL based on the data available from various provinces and cities (Table 1). The relevant data mainly come from statistical yearbooks, scientific and technological statistical yearbooks, and educational statistical yearbooks of various provinces and cities from 2008 to 2017; a few missing data are estimated by using the average growth rate of the adjacent 3 years.
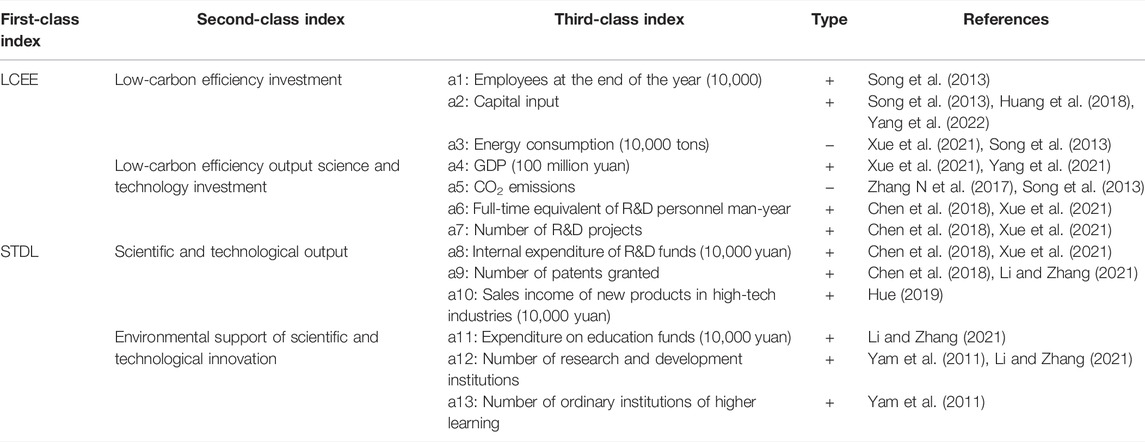
TABLE 1. Index system of LCEE and the STDL.
3.2.2 Determination of Index Weight
The weight reflects the importance of each index in the index system. The weight distribution is reasonable for the optimization of the overall goal, reflecting the importance of each index. This study is based on the entropy method of objective weighting and uses the analytic hierarchy process of the subjective weighting method, thus forming the final index comprehensive weight. The entropy method has been widely used in the evaluation of many fields since it was proposed. The entropy method has the following advantages when determining the index weight: first, the results are intuitive and easy to understand and the method is practical; second, it avoids the interference of subjective factors and has strong objectivity; third, it has no limit on the number of indicators and has a wide range of applications. In order to eliminate the dimensional differences between the different index systems, this paper first carries out a dimensionless tempering treatment on the quantity, in which the benefit (positive) index is given by
In the above formula,
The analytic hierarchy process has the following advantages: first, it combines qualitative and quantitative methods organically, and makes people’s thinking process mathematical and systematic, which enables people’s acceptance. Second, the influence of each factor in each level of AHP (Analytic Hierarchy Process) on the results is quantitative and very clear. Third, based on the evaluators’ understanding of the essence and elements of the evaluation problem, qualitative analysis and judgment are more emphasized than in the general quantitative methods.
Based on the weights of the various indicators obtained from the comprehensive weights, the comprehensive evaluation index U1 of scientific and technological development and the comprehensive evaluation index U2 of low-carbon economic development are further calculated. The specific formulas are as follows:
3.2.3 Uncoordinated Coupling Function
Studies have shown that, under the condition of an open economy, scientific and technological progress will have an impact on the low-carbon economy; scientific and technological innovation is the key to realize the transformation of a green economy. LCEE and the STDL may show coordinated or uncoordinated coupling states in different time periods and regions. Based on the study of coupled coordination, this paper constructs a uncoordinated coupling model (Zhao et al., 2016):
In the above formula, ND represents the uncoordinated coupling degree; D is the coordination coupling degree; C is the coupling degree; T is the comprehensive level of STDL and LCEE; U1 and U2, respectively, represent the comprehensive evaluation functions of STDL and LCEE; and a and b are undetermined coefficients. For this paper the STDL is considered to be as important as the development of a low-carbon economy, so a = b = 0.5. The results of the coordinated coupling divide the degree of the uncoordinated coupling into four stages (Table 2) (Gao et al., 2021), and their values are in the range (0, 1). The UCCD is mainly used to measure the lag degree of different interacting systems.
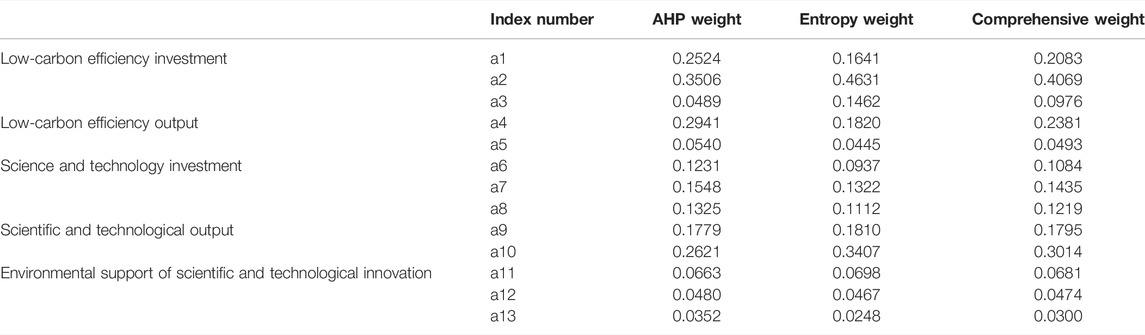
TABLE 2. Index weights of low-carbon economy and technological innovation.
3.2.4 Spatial Autocorrelation Analysis
Spatial autocorrelation is a method for analyzing the spatial relationship of data, explaining the correlation characteristics of spatial attribute data, and further expounding its spatial agglomeration characteristics (Lv et al., 2021). In this paper, Moran’s I index is used to explore the correlation of uncoordinated coupling between provinces in China. The global Moran’s I index is generally used in geography to explore the spatial autocorrelation of an attribute in a certain region, and it can also be used to study the similarity of adjacent units in space. The specific formula is as follows:
In the above formula,
In the above formula,
3.3 Panel VAR Model
The relationship and mechanism between the STDL system and the LCEE system are complex. The panel VAR model is an organic combination of panel data and the VAR model, which absorbs the advantages of both, and can be used to predict the impact effect of random disturbance on variables. Therefore, the panel VAR model is used to explore the interactive response relationship between the STDL and the development of the low-carbon economy in China.
3.4 Data Sources
The basic data used in this analysis are from the China Statistical Yearbook, China Energy Statistical Yearbook, China Environmental Statistical Yearbook, and China Science and Technology Statistical Yearbook. The time span is from 2008 to 2017, and the sample data includes 30 provinces (including municipalities and autonomous regions) in China, excluding Hong Kong, Macao, and Taiwan. Tibet is not included because of the lack of multiple variable data. Having referred to the relevant literature, combined with the characteristics of the economic system, the selection of the input–output indicators and the data processing are carried out.
3.5 Establishment of the Tobit Model
Determining what factors affect the uncoordinated coupling is an important goal of this paper. Testing the factors that influence the uncoordinated coupling is helpful to determine the most significant factors, which is very important to effectively improve the green total factor energy efficiency of industry. The necessary condition for the establishment of the model is that the value of the model dependent variable cannot be limited by size. However, the value range of uncoordinated coupling is between [0–1]. At this time, the least square method (OLS) is used to test the factors influencing the uncoordinated coupling, with the possibility that the regression result tends to be 0, that is, that the estimation result is wrong. In this case, the tobit model is chosen to carry out estimation, which just meets the requirements of this paper. This is because the premise of the tobit model estimation, also called the censored regression model, is that the dependent variable is usually set between [0–1]. Based on this, taking the uncoordinated coupling to be measured as the dependent variable and the influencing factors such as patent quantity, urbanization level, transportation level, economic development level, financial development, government macro-control, fixed assets, and energy consumption as the independent variables, this paper establishes a tobit model reflecting the relationship between them. Its basic expression is as follows (Xue et al., 2021):
Where
4 Results and Analysis
4.1 Spatial and Temporal Characteristics of the LCEE and STDL Indices
The comprehensive evaluation index of STDL and the comprehensive evaluation index of LCEE of provinces in China from 2008 to 2017 were calculated by the above methods, and then the average value of each year and the UCCD of the two systems were determined. According to economic and geographical principles, the Chinese government divides provinces in China into seven categories: north, northeast, northwest, central, eastern, southern, and southwest. From the regional level (as shown in Figure 1B), the ranking of the regional UCCD from high to low is northwest, southwest, north, south, northeast, central, and east. From a national perspective, the regional UCCD shows a downwards trend, that is, the degree of regional coordination coupling is constantly increasing, and the coordination between the LCEE and the STDL is developing well.
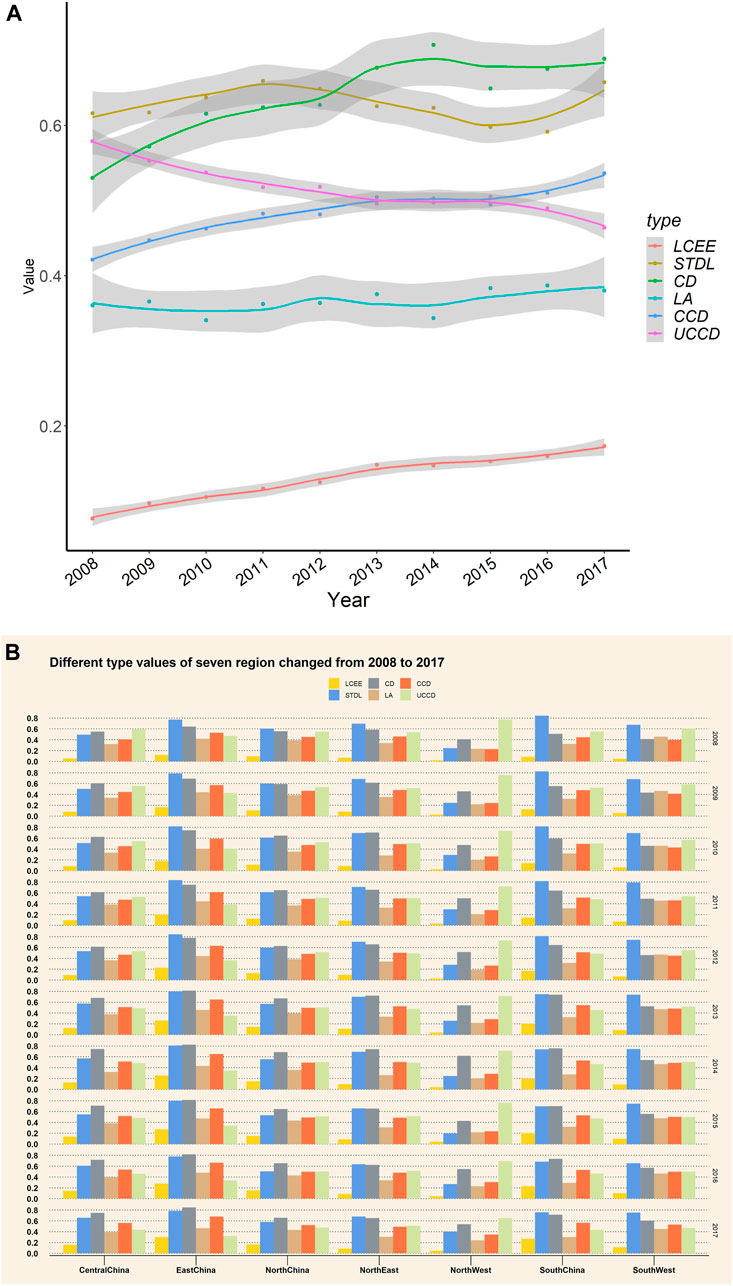
FIGURE 1. (A) Time series changes of the LCEE and STDL indices and the UCCD. (B). Diffrent type values of seven region changed from 2008 to 2017.
4.1.1 STDL Index
4.1.1.1 Time Sequence Change
It can be seen from Figure 1A that the average level of the STDL index of the provinces shows an increasing trend, which indicates that the STDL of each province is in a good condition and is developing in a positive direction as a whole. From 2008 to 2017, the growth rate was relatively flat, increasing from 0.0768 in 2008 to 0.1732 in 2017, which was due to China’s increasing investment in innovation; many indicators remained at the forefront of the world. In 2017, China’s STDL index was 196.3, an increase of 6.8% over the previous year and the highest value since 2008.
4.1.1.2 Spatial Characteristics
The comprehensive evaluation index (U1) of the STDL is calculated according to the uncoordination coupling model, and the comprehensive evaluation index of 2008, 2011, 2014, and 2017 are visualized by ArcGIS 10.3 software (Figure 2). The comprehensive price index is divided into five intervals according to the natural breakpoint method such that the development of different provinces in the same system can be clearly observed.
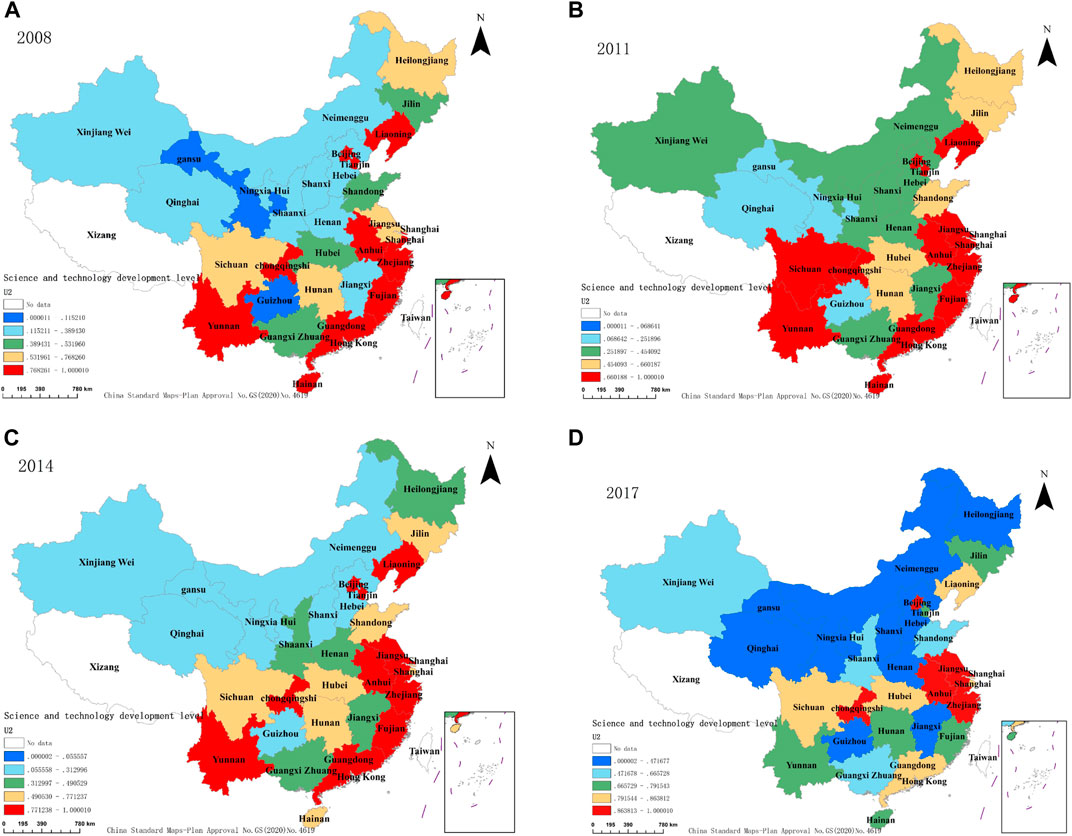
FIGURE 2. Spatial distribution of the STDL index. (A) China’s provincial STDL in 2008; (B) China’s provincial STDL in 2011; (C) China’s provincial STDL in 2014; (D) China’s provincial STDL in 2017.
From 2008 to 2017, the STDL in all provinces of the country showed an overall upward trend; However, there was an obvious gap between different provinces that continued to widen. Qinghai, Ningxia, and Hainan always rank lower in the STDL development index at the four time nodes. This indicates that the development of scientific and technological innovation in these provinces is consistently behind that of other provinces. It can be seen that the STDL is closely related to the level of economic development, and the provinces with higher level of economic development have strong capabilities in human resources and other aspects, which promotes the improvement of the STDL in those provinces.
4.1.2 LCEE Index
4.1.2.1 Time Sequence Change
It can be seen from Figure 1A that the average value of the comprehensive evaluation index of LCEE in China’s provinces has changed with time. It is not difficult to find that the average value of the comprehensive evaluation index of LCEE in China’s provinces changes with time. The promotion effect of low-carbon on the economy has a high starting point, and it has been maintained at the upper-middle level, with occasional downward fluctuations. This is probably because on 3 June 2007, the State Council issued China’s National Plan for Climate Change, which was the first comprehensive policy document to deal with climate change in China. Then, in 2008, the Information Office of the State Council issued a white paper entitled “China’s Policies and Actions to Address Climate Change,” which comprehensively introduced the impact of climate change on China, China’s policies and actions to mitigate and adapt to climate change, and China’s institutional and institutional construction. On 19 July 2010, the National Development and Reform Commission issued the Notice on Piloting Low-carbon Provinces and Cities, which clearly stated that it would organize the pilot work of low-carbon provinces and cities, and identified Guangdong, Liaoning, Hubei, Shaanxi, and Yunnan provinces, as well as the cities of Tianjin, Chongqing, Shenzhen, Xiamen, Hangzhou, Nanchang, Guiyang, and Baoding, as the first batch of national low-carbon pilots in China, laying a solid foundation for the development of low-carbon industries. The subsequent decline in efficiency can be understood as the result of a combination of various factors over time; its action tends to be gradual and flat, which is a harbinger of the gradual industrial upgrading of low-carbon industries. It is not difficult to predict the low-carbon development and socio-economic development of provinces and cities in coming years. The LCEE of provinces and cities will maintain a stable growth trend for a long time. Force majeure events in some years cannot overcome the general trend of low-carbon economic development. Maintaining this development momentum requires the joint efforts of the central government, local governments, community residents, and social investment and financing forces.
4.1.2.2 Spatial Characteristics
The LCEE of provinces in China from 2008 to 2017 was calculated by SBM-DEA, and the LCEE levels in 2008, 2011, 2014, and 2017 were further visualized by ArcGIS. 10.3 software (Figure 3).
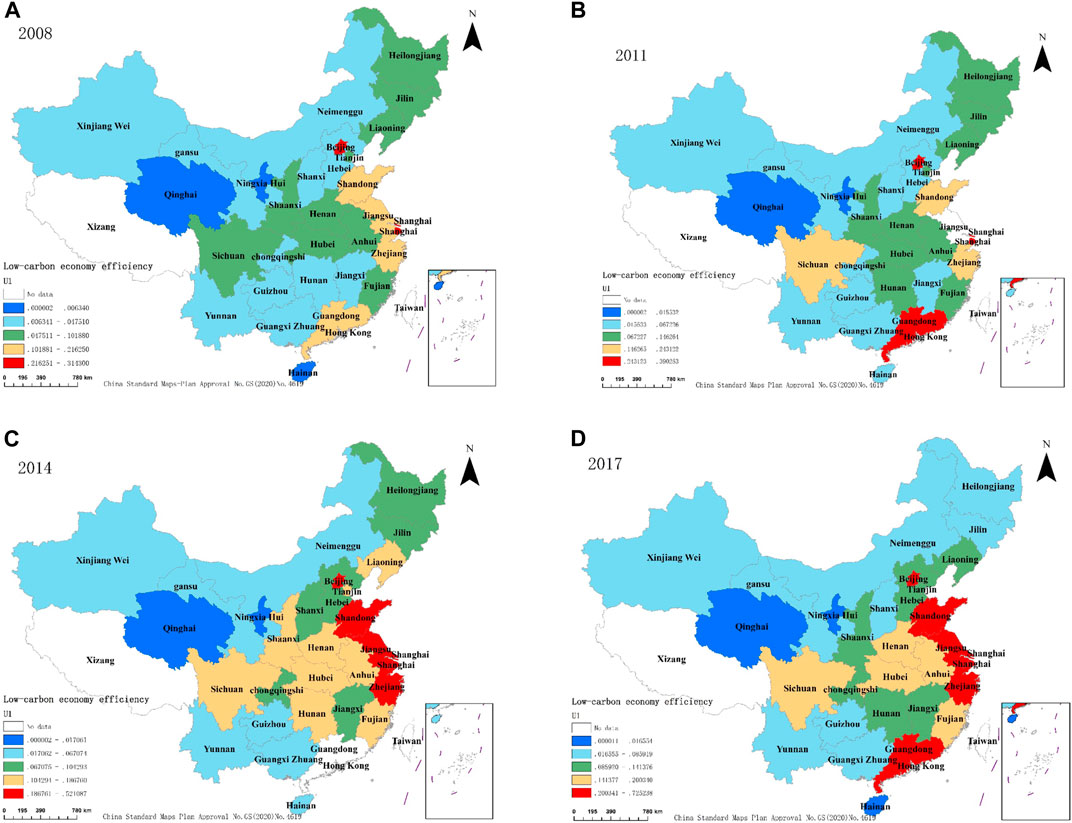
FIGURE 3. Spatial distribution of the LCEE index. (A) China’s provincial LCEE in 2008; (B) China’s provincial LCEE in 2011; (C) China’s provincial LCEE in 2014; (D) China’s provincial LCEE in 2017.
On the whole, from 2008 to 2017, the trend of overall development of the LCEE was higher in central and eastern China and lower in western China. From 2008 to 2014, the LCEE in the central and eastern regions developed steadily, and the LCEE in Beijing, Tianjin, Liaoning, Shanghai, Anhui, Fujian, Zhejiang, Guangdong, Yunnan, and Chongqing was roughly in the high efficiency range of 0.7–1, which indicated that low-carbon development played a great role in promoting local social and economic development and improving people’s living standards. However, by 2017, the LCEE in Liaoning, Yunnan, Guangdong and Fujian has decreased, which indicates that the low-carbon development in these areas has a good foundation, but the development is not stable enough, and it is still necessary to explore an internal resource integration mechanism to realize the more effective use of resources. This shows that the low-carbon development in these areas has a good foundation, but the development is not yet stable, and it is still necessary to explore an internal resource integration mechanism to achieve more effective use of resources. From 2008 to 2017, the LCEE in Hubei, Hunan, Shandong, Jilin, and Heilongjiang was in the middle and upper level, which shows that, while these provinces have a foundation for low-carbon development, it is necessary to strengthen the low-carbon economy and the planning guidance. From 2008 to 2011, the LCEE of northwest China, including Xinjiang, Qinghai, Gansu, Ningxia, Inner Mongolia, Shanxi, Shaanxi, and other regions increased, but the LCEE of these regions began to decline in the next few years.
4.2 Spatial and Temporal Distribution Characteristics of UCCD
In order to reveal the spatial combination difference of UCCD in the 30 provinces in different periods, the UCCD between the STDL system and the LCEE development system in each province was measured, and the UCCD values in 2008, 2011, 2014, and 2017 were visualized in ArcGIS 10.3 software. In accordance with Table 3, the UCCD of the two systems in each city is divided into four grades (Figure 4): if the UCCD of the province’s STDL and LCEE is less than or equal to 0.2, it is marked as yellow, indicating that the city is in a low-level uncoordinated coupling stage, and the scientific and technological innovation development system and the low-carbon economy system promote each other significantly, which is a state that the provinces are committed to achieving; Second, the stage of antagonistic uncoordinated coupling; Third, the running-in uncoordinated coupling stage; Finally, a high level of uncoordinated coupling.

TABLE 3. Evaluation table for uncoordinated coupling level.
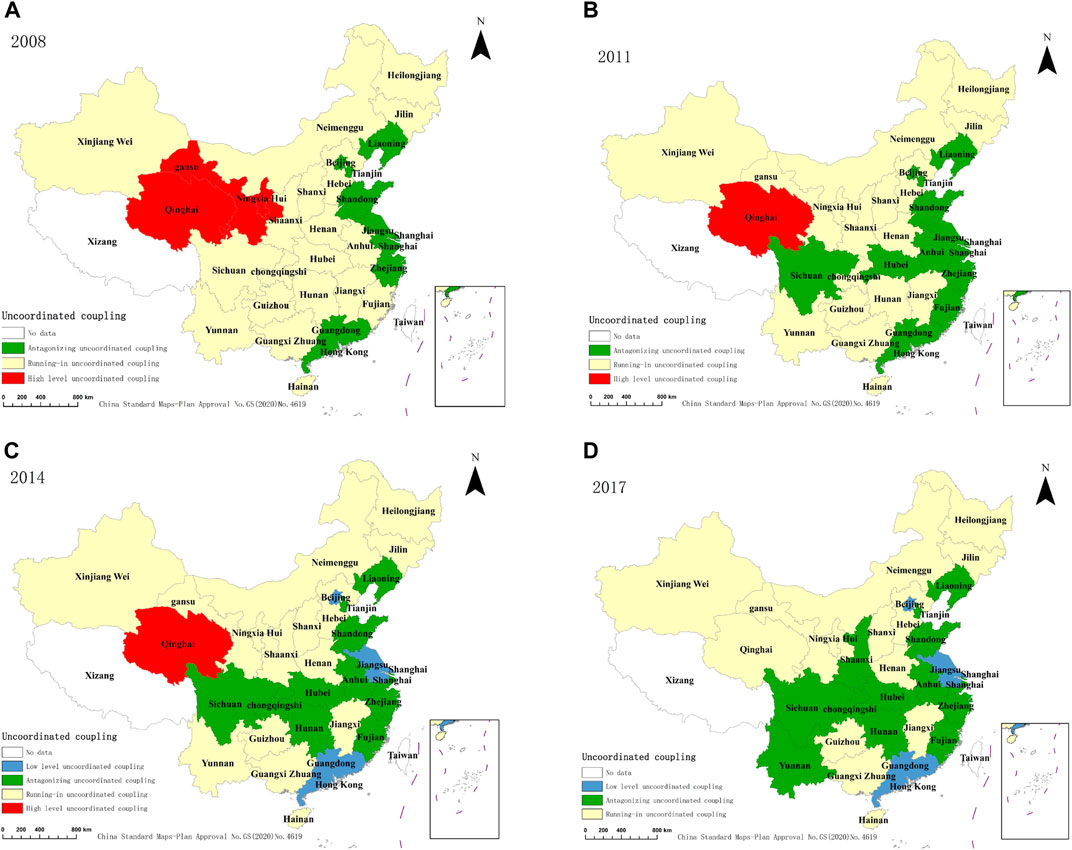
FIGURE 4. Temporal and spatial difference evolution of UCCD between STDL and LCEE. (A) China’s provincial UCCD in 2008; (B) China’s provincial UCCD in 2011; (C) China’s provincial UCCD in 2014; (D) China’s provincial UCCD in 2017.
The UCCD between the STDL and the development of LCEE in provinces in China shows an overall downwards trend, and the UCCD between the two systems has changed from running-in uncoordinated coupling to antagonistic uncoordinated coupling, and from antagonistic uncoordinated coupling to low-level uncoordinated coupling, which indicates that the relationship between scientific and technological innovation and the low-carbon economy has been continuously improved.
In 2008 and 2011, the UCCD between the STDL and the LCEE was divided into three levels: antagonistic uncoordinated coupling, running-in uncoordinated coupling and high-level uncoordinated coupling. After 2014, low-level uncoordinated coupling levels were added in Beijing, Jiangsu, and Guangdong. In 2008, there were three provinces with high-level uncoordinated coupling between STDL and LCEE, namely Qinghai, Gansu, and Ningxia. By 2011, there was only one province in Qinghai, Until 2017, when the high-level uncoordinated coupling level was small, it turned to running-in uncoordinated coupling level. By comparison, it is found that during 2008–2017, the number of provinces running in uncoordinated coupling level gradually decreased, and the number of provinces changing to antagonistic uncoordinated coupling level increased. This embodies the changing characteristics that the incoordination is weakening in the coupling process, that is, the coordination of the two systems is gradually enhanced in the coupling process. In the spatial layout, the provinces with a low-level uncoordinated coupling level or an antagonistic uncoordinated coupling level, that is, the provinces with uncoordinated coupling degree less than or equal to 0.5, are mainly concentrated in the central and eastern regions. The UCCD of the northern, western, and some southern regions is greater than 0.5, which indicates that the disconnection between the LCEE and STDL in these regions is serious, and the interaction coordination mechanism needs to be improved.
4.3 Correlation Analysis of UCCD
This paper explores the uncoordinated coupling evolution law of STDL and the LCEE in different provinces, but cannot fully understand the whole picture of China’s provincial STDL and LCEE. Therefore, this paper uses the spatial autocorrelation model to more deeply explore the correlation among provinces and deepen the research into China’s provincial development, so as to provide a reference for the coordinated development of China’s provinces.
In this paper, based on the uncoordinated coupling index of the STDL and the LCEE in 2008, 2011, 2014 and 2017, the global Moran’s I index is calculated using GeoDa software (Table 4). The global Moran’s I index is greater than 0, and the standardized statistical indicators Z and P have passed the test, showing that Moran’s I index is significant, that is, the uncoordinated coupling between scientific and technological innovation and the low-carbon economy in each province has a clear positive spatial autocorrelation. In addition, the global Moran’s I index is growing, indicating that its spatial agglomeration is increasing. The local spatial autocorrelation index can further indicate the location of provincial spatial agglomeration and the degree of regional correlation, and can specifically describe the local spatial agglomeration characteristics of UCCD between the STDL and the LCEE among provinces. Therefore, this paper calculates the local spatial correlation index of UCCD between China’s provincial STDL and LCEE in 2008, 2011, 2014 and 2017, and spatially processes the results with the ArcGIS10.3 software, obtaining the LISA diagram of UCCD between China’s provincial STDL and LCEE (Figure 5).
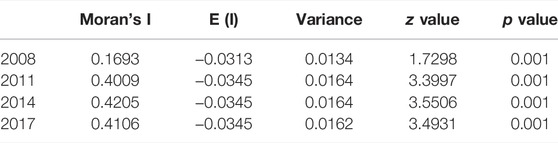
TABLE 4. Global Moran’s I index of UCCD.
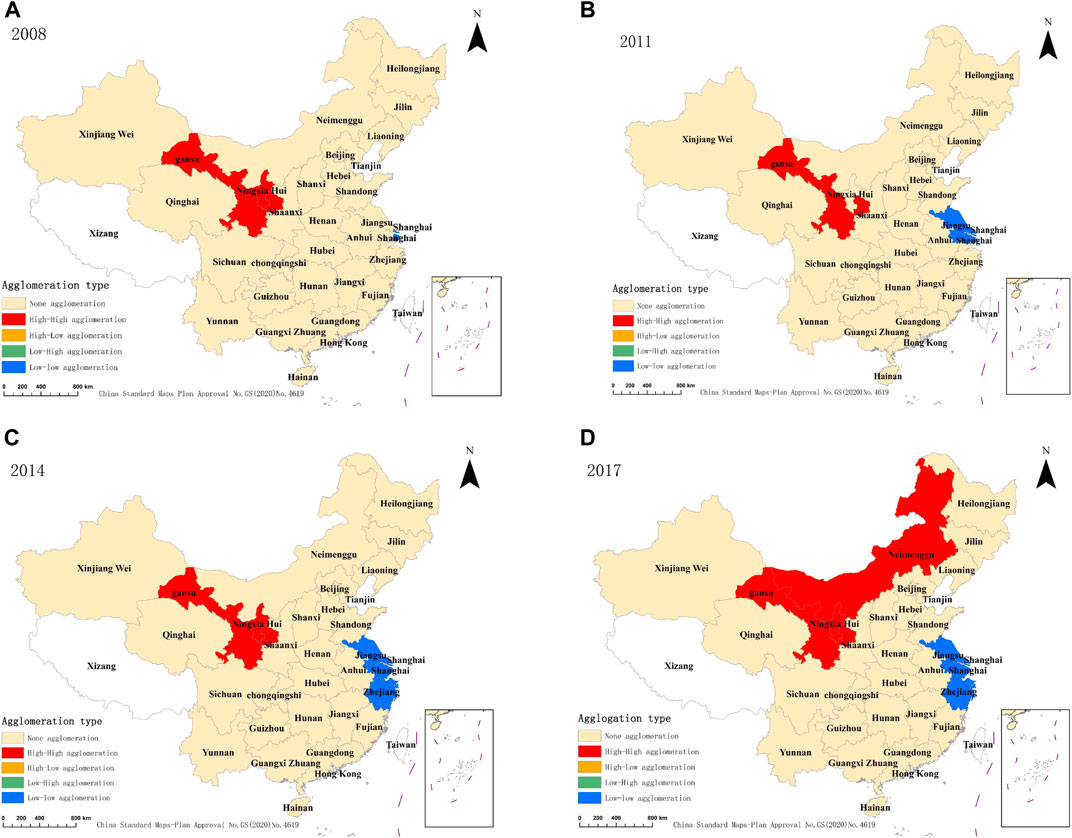
FIGURE 5. LISA diagram of UCCD between STDL and LCEE. (A) China’s provincial LISA diagram in 2008; (B) China’s provincial LISA diagram in 2011; (C) China’s provincial LISA diagram in 2014; (D) China’s provincial LISA diagram in 2017.
As can be seen from the figure, there are only two types of agglomeration areas of High-High and Low-Low from 2008 to 2017, but there are no two types of agglomeration areas of High-Low and Low-High.
High and high gathering area: In 2008, 2011 and 2014, this was mainly concentrated in Gansu and Ningxia. In 2017, Inner Mongolia was added. In short, it is concentrated in some economically underdeveloped areas in northern China; The number of agglomeration in these provinces is small, with little fluctuation. The UCCD between the STDL and LCEE in these provinces is much higher than that in their neighboring provinces, demonstrating the growth pole of uncoordinated development and the shortcomings of provincial development. It is difficult for these provinces to strengthen their STDL and LCEE by relying solely on their own economic strength. Therefore, it is necessary to strengthen ties with surrounding provinces and formulate their own development paths in a targeted manner, which provides a breakthrough to promote scientific and technological innovation and the low-carbon economy.
Low and Low gathering area: these cities are mainly concentrated in the economically developed east. In 2008, Shanghai was the only province of this type, and then Jiangsu and Zhejiang provinces were added, with no major changes in spatial distribution. The UCCD between STDL and the LCEE is low, which is the growth pole of regional coordinated development. This is due to the integration of the Yangtze River Delta, which has enhanced the level of scientific and technological innovation and the low-carbon economy, and formed a low-value agglomeration area with uncoordinated and coupled development. The STDL and LCEE in the Yangtze River Delta is stable, and the degree of coordination and coupling is strong, forming the regional core. The Yangtze River Delta is economically developed, with close ties between provinces and cities, and obvious spillover effects such as talent flow and technology diffusion. Therefore, its driving effect should be expanded to drive the STDL and LCEE development of neighboring provinces and cities.
4.4 The Interactive Response Relationship Between the LCEE and STDL
4.4.1 Unit Root Test
The premise of cointegration, causality and suggested VAR template between variables is that variables obey the single-order unit process. In this paper, the Eviews10.0 software is used to test the level of each variable with the ADF unit root (Table 5). The ADF test has three auxiliary equations:
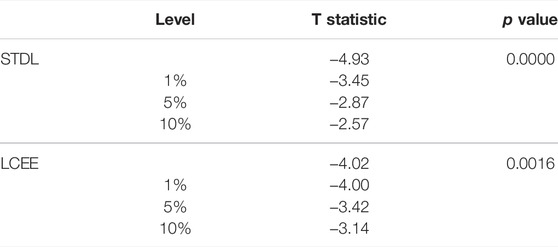
TABLE 5. Unit root test results.
1) No intercept term and no trend term
2) Only the intercept term
3) Both intercept term and time trend term
In which the symbol △ represents the first-order difference operator, c is the intercept term, αt is the trend term, ut is a stationary random error term, and k is the maximum lag order for determining that ut satisfies white noise. According to Schwarz and Akaike, the smaller the information criterion, the better the model. According to the results of calculating the three equations and the comparison with Akaike, the variables representing STDL and the LCEE are stationary, with only intercept terms.
According to the lag order information criterion, the optimal lag order is the first order. On this basis, the Granger causality test is carried out; the results show that the p value of technological innovation to low-carbon economy is 0.0426 (<0.05), and that of low-carbon economy to technological innovation is 0.4921 (>0.05), which indicates that there is a one-way causal relationship between technological innovation and the low-carbon economy in each province.
4.4.2 Impulse Response Analysis
Using Eviews10.0, impulse response analysis of STDL and LCEE is carried out to explore the dynamic interaction and response trend of technological innovation and low-carbon economy in each province in the next 20 periods (Figure 6).
1) The STDL and LCEE in each province have a significant positive response to the spontaneous impulse shock, with the maximum value in the first stage; it is then gradually weakened until it is no longer significant. The self-enhancement mechanism of scientific and technological innovation continued to the 18th issue, and the self-enhancement mechanism of LCEE continued to the 20th issue. The above results show that each province’s STDL and LCEE show different degrees of self-enhancement mechanism and path-dependent characteristics. Therefore, in practice, we should take active measures to avoid the weakening of the self-enhancement mechanism.
2) The LCEE has a significant response to the impact of STDL. On the whole, the STDL in China’s provinces has a driving effect on the low-carbon economy, but its effect is not very strong. The main reason is that the existing technology support system hinders low-carbon technology innovation, which faces great uncertainty. Moreover, the spatial accumulation effect in each province is not obvious, and it is difficult to create an overall effect, which limits the leading role of scientific and technological innovation in the low-carbon economy.
3) Regarding the impact of the LCEE, the STDL shows negative impact effect, that is, the LCEE has no significant supporting effect on the STDL.
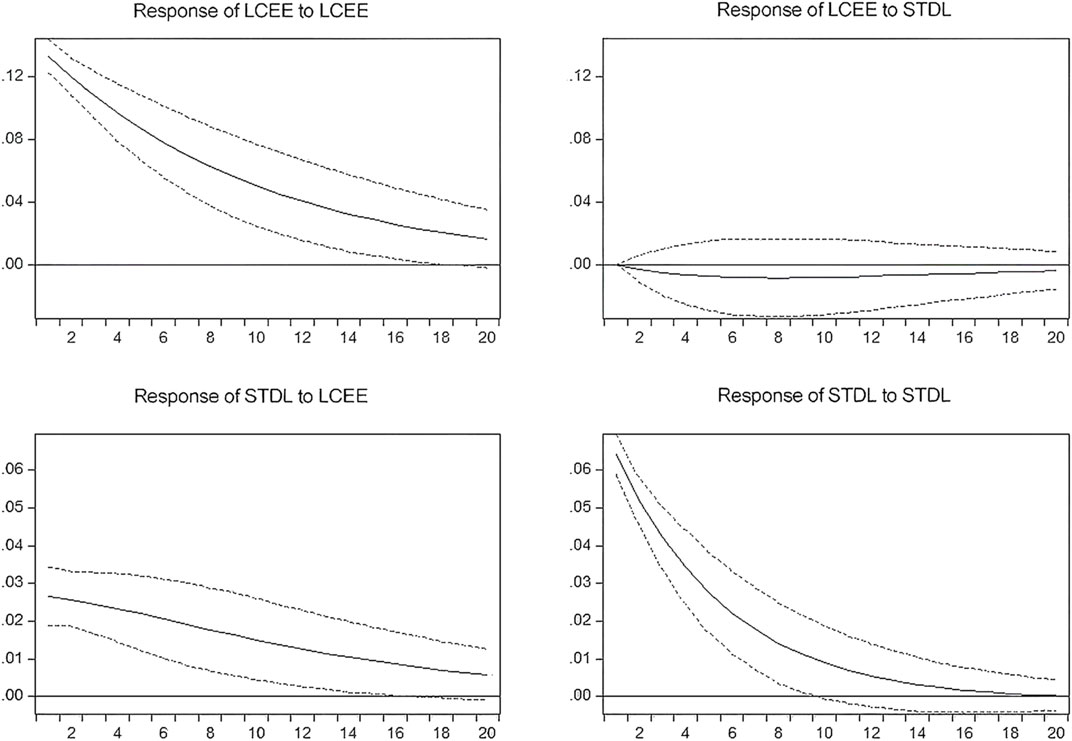
FIGURE 6. Impulse response analysis results.
4.4.3 Prediction Variance Decomposition
Variance decomposition can reveal the relative cumulative contribution rate of one variable impacted by another variable over time. The variance decomposition results (Table 6) show that the impact of scientific and technological innovation on itself is declining year by year, from 100% in the first period to 92% in the 20th period. The contribution rate of scientific and technological innovation to the low-carbon economy is increasing every year. In the first period, the contribution rate of scientific and technological innovation to the low-carbon economy is 85%, and it has increased to 90% in the 20th period, which shows that scientific and technological innovation can promote the development of the low-carbon economy. The impact of the low-carbon economy on itself is increasing year by year, from 0 in the first period to 8%, which reflects its self-improvement.
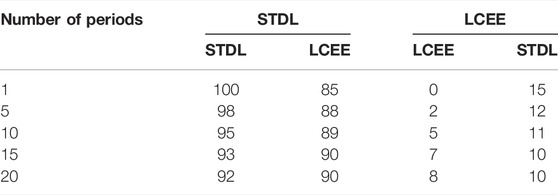
TABLE 6. Variance decomposition results based on the PVAR model estimation.
4.5 Results of the Tobit Model
Based on the tobit model, this paper uses Stata12.0 to test the significance of each of the influencing factors of uncoordinated coupling; the estimated results of each independent variable coefficient are shown in Table 7.
1) The coefficient of patent authorization value is negative, and it passed the significance test at the level of 1%. This shows that an increase in the number of patents granted does not promote uncoordinated coupling between low-carbon economic efficiency and the level of scientific and technological innovation. Patents, as one of the results of scientific and technological innovation, can quantitatively reflect the importance attached by society to such innovation and effectively enhance the technological innovation and scientific and technological competitiveness of cities. From the above analysis, it can be seen that the UCCD is opposed to the differentiation characteristics of the development level of scientific and technological innovation, that is, the improvement of the STDL reduces the UCCD. In addition, a change in STDL will also affect the development of LCEE; science and technology are the material basis for developing the low-carbon economy. The improvement of STDL and LCEE reduces the UCCD.
2) The urbanization level has a negative influence on the uncoordinated coupling at a 1% significance level. The continuous increase of the urbanization level shows that the comprehensive strength of cities is constantly growing. The level of urbanization is influenced by the basic conditions of urban development, industrial development, institutional development, etc.; at the same time, it also impacts the development of LCEE and STDL in various ways. The level of urbanization will, to a certain extent, contribute to the development of low-carbon economy and technological innovation. Areas with a higher urbanization level can provide more powerful support for the development of the low-carbon economy and technological innovation, and create a more favorable development environment. Residents have a higher enthusiasm for low-carbon life and innovation. Therefore, increasing the urbanization level can reduce the uncoordinated coupling between the low-carbon economy and technological innovation.
3) The influence of the transportation level on the uncoordinated coupling is negative at a 1% significance level. To be rich, build roads first. The development of transportation not only affects the travel of residents, but also affects the development of the economy, science and technology, low-carbon, commerce, and other aspects. The higher the transportation level, the more convenient and safe the traffic, the more enhanced the competitive ability of scientific and technological innovation, the stronger the attraction of low-carbon resources, and the better the economic development. The improvement of transportation level can promote the development of the low-carbon economy and scientific and technological innovation in many ways, and effectively reduce the UCCD between LCEE and STDL.
4) The level of economic development has a positive effect on the uncoordinated coupling at a significance level of 1%. The level of economic development can reflect the social and economic development of a country or region. The higher the level of the economic development, the better the regional economic situation and the better the people’s quality of life. From the national perspective, there are regional differences in economic development, and the level of economic development between the east and the west is unbalanced, which contributes to the differences in regional investment in scientific and technological innovation. Areas with a high economic development level have more funds and resources to invest in scientific and technological innovation research and development, while areas with a poor economic foundation mainly focus on economic development and pay less attention to scientific and technological innovation. Similarly, low-carbon economic resources are unevenly distributed between the east and west, resulting in low-carbon economic efficiency in areas with better economic development and abundant low-carbon economic resources in areas with poor economic development, which leads to the positive impact of economic development level on the UCCD between the LCEE and STDL.
5) Financial development has a negative impact on the uncoordinated coupling at a significance level of 1%. Today is still the era of financial imperialism, and finance plays an important role in the development of society. The development of finance contributes to the accumulation and concentration of capital, thus improving the utilization efficiency of resources. The expansion of financial scale can effectively guide the flow of funds to the low-carbon economy and technology industries and promote technological progress. The development and utilization of low-carbon economic resources and the invention and innovation of science and technology require a large amount of capital support. Financial development can provide a strong and solid foundation, improve the efficiency of the low-carbon economy and the level of scientific and technological innovation, and reduce uncoordinated coupling between them.
6) The influence of government macro-control on uncoordinated coupling is not significant. Government macro-control refers to the input of resources. The higher the input of resources, the greater the proportion of the low-carbon economy in the regional economic structure. The LCEE is observed by comparing the input of resources with the output of “carbon reduction.” Because the government does not direct the coordinated development of the LCEE and STDL there is no obvious effect of government macro-control on the uncoordinated coupling between LCEE and STDL.
7) The influence of fixed assets on uncoordinated coupling is positive at a 1% significance level. The investment in social fixed assets is increasing yearly, and it has a positive impact on the UCCD between LCEE and STDL. The increase of investment in fixed assets is conducive to adjusting industrial structures, enabling infrastructure construction, improving residents’ living environment, and stimulating economic development. However, there are some problems in the regional economic level, such as unbalanced development and obvious regional differences, which lead to the differences in regional scientific and technological innovation investment, unbalanced development of scientific and technological innovation, uneven distribution of low-carbon economic resources and low utilization rate of resources, which in turn leads to difficulties in the integration of low-carbon economy and scientific and technological innovation and promotes the uncoordinated coupling between LCEE and STDL.
8) Energy consumption has a positive effect on uncoordinated coupling at a significance level of 5%. Energy consumption refers to the utilization of resources in daily production and life. The scale of energy consumption can reflect the level of GDP and the wealth of a society. On the one hand, energy consumption can promote the development of industry and improve the level of economic development; on the other hand, excessive consumption of energy leads to problems such as resource depletion and environmental damage. Scientific and technological innovation and the development of the low-carbon economy are inseparable from energy consumption, which provides a fundamental basis for production and living. Therefore, energy consumption has increased the uncoordinated coupling between LCEE and STDL.
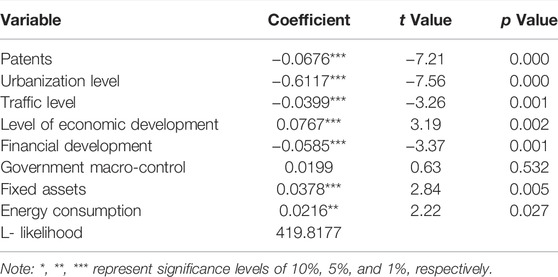
TABLE 7. Regression results of the tobit model.
5 Conclusion and Discussion
In order to test the UCCD mechanism of STDL and LCEE development, this paper selects 30 provinces and cities as research objects, and constructs the UCCD index system of STDL and LCEE. Using SBM-DEA model to calculate LCEE, this paper reveals the distribution characteristics of STDL and LCEE in China’s provinces and cities from the perspective of time and space, evaluates the uncoordinated coupling relationship between STDL and LCEE in various provinces and cities, explores the influencing factors of UCCD by Tobit regression model, and investigates the interactive response relationship between STDL and LCEE by panel VAR model. The main conclusions are as follows:
1) During the study period, the STDL index and LCEE of the 30 provinces showed an increasing trend, and the situation of scientific and technological innovation and low-carbon economic development was generally positive. In addition, the spatial distribution of the STDL index and LCEE in Chinese provinces also tends to be consistent, showing that the development level of the eastern regions is higher than that of the western regions, and that of the eastern coastal regions is higher than that of inland regions. At the provincial level, Beijing, Shanghai, Guangdong, Jiangsu, Zhejiang, and Shandong are high-value areas of both the STDL and LCEE; Qinghai and Gansu are low-value areas of the STDL index, while Gansu, Ningxia and Qinghai are low-value areas of LCEE. The results are consistent with the research results of cheng, Low-carbon emission efficiency clusters are mainly concentrated in northwest China, and its carbon emission efficiency is restricted by regional economic development and technical level (Cheng et al., 2018). When formulating low-carbon economic policies, different regions can learn from each other, and regions with low LCEE can learn advanced experience from regions with high LCEE, thus steadily improving LCEE.
2) During the study period, the UCCD between STDL and LCEE in the 30 provinces showed a decreasing trend, opposite the development of subsystems in space. The higher the level of STDL and LCEE, the lower the UCCD; the uncoordinated coupling degree between the two systems changed from running-in uncoordinated coupling to antagonistic uncoordinated coupling, and from antagonistic uncoordinated coupling to low-level uncoordinated coupling, with more and more provinces exhibiting low-level uncoordinated coupling. This conclusion is consistent with Wang (Wang Q et al., 2016).
3) Moran’s I index of UCCD between STDL and LCEE in the 30 provinces during the study period was greater than 0 during 4 years, and all of them passed the test at a 99% confidence interval level, which proved that the spatial pattern has positive spatial autocorrelation. Local spatial positive correlation shows that the UCCD between STDL and LCEE presents typical high–high and low–low agglomeration areas in space. The distribution of high–high agglomeration areas is consistent with economically underdeveloped cities, while the distribution of low–low agglomeration areas is concentrated in the Yangtze River Delta and other provinces with a high level of scientific and technological innovation and low-carbon economy development. The UCCD level of science and technology innovation and the low-carbon economy in provinces has significant negative spillover effect in space; that is, the improvement of science and technology innovation and low-carbon economy level in neighboring provinces will lead to a decrease of the UCCD in neighboring provinces.
4) Each province’s STDL and LCEE have positive progressive effects and inertia development characteristics, though their influences are gradually declining. Of these, the low-carbon economic development has a more obvious impact on itself. Scientific and technological innovation in the 30 provinces has a positive promotion effect on the low-carbon economy. Literature shows that carbon emission efficiency is influenced by many factors, but the technical level plays a key role (Wang G et al., 2019). Technology sector is not an energy-intensive industry, with low energy dependence and low carbon dioxide emissions (Lee and Hashim, 2014). Therefore, these provinces should rely on their strong economic and technological advantages to transform high-energy consumption industries into high-tech information industries and other technical industries, and further promote the transformation of low-energy consumption industries. However, due to the overall low level and unbalanced internal development of STDL and LCEE, the mechanism between them is not obvious. Therefore, the key to realize the coordinated coupling between STDL and LCEE is to enable the positive promotion of the two subsystems.
5) Among the influencing factors, patents, urbanization level, transportation level and financial development have negative effects on UCCD, which indicates that these factors promote the coordinated development of STDL and LCEE. The effect of level economic development and Energy consumption on UCCD is positive. Some scholars believe that economic growth and transportation energy consumption significantly affect the long-term carbon dioxide emissions of ASEAN countries (Chandran and Tang, 2013). With the passage of time, due to the regional differences in economic development and the imbalance of economic development levels between the east and the west, the regional differences in investment in scientific and technological innovation have been promoted, and the expansion of the technological gap has jointly inhibited the growth of carbon emission efficiency (Cheng et al., 2018). The article results are consistent with this conclusion.
The article has the following limitations: China has significant regional differences in economic development, energy endowment, technical level and environmental regulations. The same influencing factors may show different effects in different regions (Chen et al., 2020). Therefore, when studying the influencing factors, it is necessary to consider the spatial-temporal heterogeneity (Zhang et al., 2020). China’s LCEE and STDL show significant spatial-temporal differences, so the driving factors of UCCD will also have significant spatial-temporal heterogeneity.
Data Availability Statement
The original contributions presented in the study are included in the article/Supplementary Material, further inquiries can be directed to the corresponding author.
Author Contributions
Writing—original draft preparation: GY and GQ; Conceptualization: GY and ZF; methodology: GG; Data curation: YY.
Funding
This research was funded by the National Social Science Fund (Grant No. 20AJY005). Supported by the Science and Technology Research Program of Chongqing Municipal Education Commission (Grant No. KJQN202101122).
Conflict of Interest
The authors declare that the research was conducted in the absence of any commercial or financial relationships that could be construed as a potential conflict of interest.
Publisher’s Note
All claims expressed in this article are solely those of the authors and do not necessarily represent those of their affiliated organizations, or those of the publisher, the editors and the reviewers. Any product that may be evaluated in this article, or claim that may be made by its manufacturer, is not guaranteed or endorsed by the publisher.
Abbreviations
LCEE, low-carbon economic efficiency; STDL, scientific and technological development level; UCCD, uncoordinated coupling degree.
References
Abid, M., Scheffran, J., Schneider, U. A., and Elahi, E. (2019). Farmer Perceptions of Climate Change, Observed Trends and Adaptation of Agriculture in Pakistan. Environ. Manage. 63, 110–123. doi:10.1007/s00267-018-1113-7
Ai, J., Feng, L., Dong, X., Zhu, X., and Li, Y. (2016). Exploring Coupling Coordination between Urbanization and Ecosystem Quality (1985-2010): a Case Study from Lianyungang City, China. Front. Earth Sci. 10, 527–545. doi:10.1007/s11707-015-0531-6
Alonso, P. M., Hewitt, R., Pacheco, J. D., Bermejo, L. R., Jiménez, V. H., Guillén, J. V., et al. (2016). Losing the Roadmap: Renewable Energy Paralysis in Spain and its Implications for the EU Low Carbon Economy. Renew. Energ. 89, 680–694. doi:10.1016/j.renene.2015.12.004
Battistella, C., Colucci, K., De Toni, A. F., and Nonino, F. (2013). Methodology of Business Ecosystems Network Analysis: A Case Study in Telecom Italia Future Centre. Technol. Forecast. Soc. Change 80, 1194–1210. doi:10.1016/j.techfore.2012.11.002
Bo-Feng, C., Jin-Nan, W., Wei-Shan, Y., Lan-Cui, L., and Dong, C. (2012). Low Carbon Society in China: Research and Practice. Adv. Clim. Change Res. 3, 106–120. doi:10.3724/SP.J.1248.2012.000106
Cecchini, L., Venanzi, S., Pierri, A., and Chiorri, M. (2018). Environmental Efficiency Analysis and Estimation of CO2 Abatement Costs in Dairy Cattle Farms in Umbria (Italy): A SBM-DEA Model with Undesirable Output. J. Clean. Prod. 197, 895–907. doi:10.1016/j.jclepro.2018.06.165
Chandran, V. G. R., and Tang, C. F. (2013). The Impacts of Transport Energy Consumption, Foreign Direct Investment and Income on CO2 Emissions in ASEAN-5 Economies. Renew. Sust. Energ. Rev. 24, 445–453. doi:10.1016/j.rser.2013.03.054
Charnes, A., Cooper, W. W., and Rhodes, E. (1978). Measuring the Efficiency of Decision Making Units. Eur. J. Oper. Res. 2, 429–444. doi:10.1016/0377-2217(78)90138-8
Chen, K., Kou, M., and Fu, X. (2018). Evaluation of Multi-Period Regional R&D Efficiency: An Application of Dynamic DEA to China's Regional R&D Systems. Omega 74, 103–114. doi:10.1016/j.omega.2017.01.010
Chen, L., Cai, W., and Ma, M. (2020). Decoupling or Delusion? Mapping Carbon Emission Per Capita Based on the Human Development index in Southwest China. Sci. Total Environ. 741, 138722. doi:10.1016/j.scitotenv.2020.138722
Chen, Y., Ma, L., and Zhu, Z. (2021). The Environmental-Adjusted Energy Efficiency of China's Construction Industry: a Three-Stage Undesirable SBM-DEA Model. Environ. Sci. Pollut. Res. 28, 58442–58455. doi:10.1007/s11356-021-14728-2
Cheng, Z., Li, L., Liu, J., and Zhang, H. (2018). Total-factor Carbon Emission Efficiency of China's Provincial Industrial Sector and its Dynamic Evolution. Renew. Sust. Energ. Rev. 94, 330–339. doi:10.1016/j.rser.2018.06.015
Chu, J.-F., Wu, J., and Song, M.-L. (2018). An SBM-DEA Model with Parallel Computing Design for Environmental Efficiency Evaluation in the Big Data Context: a Transportation System Application. Ann. Oper. Res. 270, 105–124. doi:10.1007/s10479-016-2264-7
Clarke-Sather, A., Li, Y., and Qu, J. (2016). Lighting Energy Use in Anding District, Gansu Province, China. Energ. Sust. Dev. 32, 40–49. doi:10.1016/j.esd.2016.02.012
Dong, D., Duan, H., Mao, R., Song, Q., Zuo, J., Zhu, J., et al. (2018). Towards a Low Carbon Transition of Urban Public Transport in Megacities: A Case Study of Shenzhen, China. Resour. Conservation Recycling 134, 149–155. doi:10.1016/j.resconrec.2018.03.011
Elahi, E., Khalid, Z., Tauni, M. Z., Zhang, H., and Lirong, X. (2021a). Extreme Weather Events Risk to Crop-Production and the Adaptation of Innovative Management Strategies to Mitigate the Risk: A Retrospective Survey of Rural Punjab, Pakistan. Technovation 2021, 102255. doi:10.1016/j.technovation.2021.102255
Elahi, E., Khalid, Z., and Zhang, Z. (2022a). Understanding Farmers' Intention and Willingness to Install Renewable Energy Technology: A Solution to Reduce the Environmental Emissions of Agriculture. Appl. Energ. 309, 118459. doi:10.1016/j.apenergy.2021.118459
Elahi, E., Zhang, H., Lirong, X., Khalid, Z., and Xu, H. (2021b). Understanding Cognitive and Socio-Psychological Factors Determining Farmers' Intentions to Use Improved Grassland: Implications of Land Use Policy for Sustainable Pasture Production. Land Use Policy 102, 105250. doi:10.1016/j.landusepol.2020.105250
Elahi, E., Zhang, Z., Khalid, Z., and Xu, H. (2022b). Application of an Artificial Neural Network to Optimise Energy Inputs: An Energy- and Cost-Saving Strategy for Commercial Poultry Farms. Energy 244, 123169. doi:10.1016/j.energy.2022.123169
Fang, K., Zhang, Q., Yu, H., Wang, Y., Dong, L., and Shi, L. (2018). Sustainability of the Use of Natural Capital in a City: Measuring the Size and Depth of Urban Ecological and Water Footprints. Sci. Total Environ. 631-632, 631476–632484. doi:10.1016/j.scitotenv.2018.02.299
Gan, V. J. L., Deng, M., Tse, K. T., Chan, C. M., Lo, I. M. C., and Cheng, J. C. P. (2018). Holistic BIM Framework for Sustainable Low Carbon Design of High-Rise Buildings. J. Clean. Prod. 195, 1091–1104. doi:10.1016/j.jclepro.2018.05.272
Gao, X., Wang, K., Lo, K., Wen, R., Mi, X., Liu, K., et al. (2021). An Evaluation of Coupling Coordination between Rural Development and Water Environment in Northwestern China. Land 10, 405. doi:10.3390/land10040405
Guo, X.-D., Zhu, L., Fan, Y., and Xie, B.-C. (2011). Evaluation of Potential Reductions in Carbon Emissions in Chinese Provinces Based on Environmental DEA. Energy Policy 39, 2352–2360. doi:10.1016/j.enpol.2011.01.055
Hu, Z., Yuan, J., and Hu, Z. (2011). Study on China's Low Carbon Development in an Economy-Energy-Electricity-Environment Framework. Energy Policy 39, 2596–2605. doi:10.1016/j.enpol.2011.02.028
Huang, J., Yu, Y., and Ma, C. (2018). Energy Efficiency Convergence in China: Catch-Up, Lock-In and Regulatory Uniformity. Environ. Resource Econ. 70, 107–130. doi:10.1007/s10640-017-0112-0
Hue, T. T. (2019). The Determinants of Innovation in Vietnamese Manufacturing Firms: an Empirical Analysis Using a Technology-Organization-Environment Framework. Eurasian Bus Rev. 9, 247–267. doi:10.1007/s40821-019-00125-w
Huettner, M., Freibauer, A., Haug, C., and Cantner, U. (2010). Regaining Momentum for International Climate Policy beyond Copenhagen. Carbon Balance Manage 5, 2. doi:10.1186/1750-0680-5-2
Jiang, L., Folmer, H., and Bu, M. (2016). Interaction between Output Efficiency and Environmental Efficiency: Evidence from the Textile Industry in Jiangsu Province, China. J. Clean. Prod. 113, 123–132. doi:10.1016/j.jclepro.2015.11.068
Johnston, D., Lowe, R., and Bell, M. (2005). An Exploration of the Technical Feasibility of Achieving CO2 Emission Reductions in Excess of 60% within the UK Housing Stock by the Year 2050. Energy Policy 33, 1643–1659. doi:10.1016/j.enpol.2004.02.003
Kang, Y.-Q., Xie, B.-C., Wang, J., and Wang, Y.-N. (2018a). Environmental Assessment and Investment Strategy for China's Manufacturing Industry: A Non-radial DEA Based Analysis. J. Clean. Prod. 175, 501–511. doi:10.1016/j.jclepro.2017.12.043
Kang, Z.-Y., Li, K., and Qu, J. (2018b). The Path of Technological Progress for China's Low-Carbon Development: Evidence from Three Urban Agglomerations. J. Clean. Prod. 178, 644–654. doi:10.1016/j.jclepro.2018.01.027
Lee, M. Y., and Hashim, H. (2014). Modelling and Optimization of CO2 Abatement Strategies. J. Clean. Prod. 71, 40–47. doi:10.1016/j.jclepro.2014.01.005
Lee, W.-S., and Lee, K.-P. (2009). Benchmarking the Performance of Building Energy Management Using Data Envelopment Analysis. Appl. Therm. Eng. 29, 3269–3273. doi:10.1016/j.applthermaleng.2008.02.034
Li, W., and Zhang, P. (2021). Developing the Transformation of Scientific and Technological Achievements in Colleges and Universities to Boost the Development of Low-Carbon Economy. Int. J. Low-Carbon Tech. 16, 305–316. doi:10.1093/ijlct/ctaa066
Li, Y., Li, F., Emrouznejad, A., Liang, L., and Xie, Q. (2019). Allocating the Fixed Cost: an Approach Based on Data Envelopment Analysis and Cooperative Game. Ann. Oper. Res. 274, 373–394. doi:10.1007/s10479-018-2860-9
Li, Z., Galeano Galván, M. J., Ravesteijn, W., and Qi, Z. (2017). Towards Low Carbon Based Economic Development: Shanghai as a C40 City. Sci. Total Environ. 576, 538–548. doi:10.1016/j.scitotenv.2016.10.034
Liu, X., and Liu, J. (2016). Measurement of Low Carbon Economy Efficiency with a Three-Stage Data Envelopment Analysis: A Comparison of the Largest Twenty CO2 Emitting Countries. IJERPH 13, 1116. doi:10.3390/ijerph13111116
Liu, Y., Zhao, G., and Zhao, Y. (2016). An Analysis of Chinese Provincial Carbon Dioxide Emission Efficiencies Based on Energy Consumption Structure. Energy Policy 96, 524–533. doi:10.1016/j.enpol.2016.06.028
Long, Y., Dong, L., Yoshida, Y., and Li, Z. (2018). Evaluation of Energy-Related Household Carbon Footprints in Metropolitan Areas of Japan. Ecol. Model. 377, 16–25. doi:10.1016/j.ecolmodel.2018.03.008
Lou, Y., Shen, L., Huang, Z., Wu, Y., Li, H., and Li, G. (2018). Does the Effort Meet the Challenge in Promoting Low-Carbon City?-A Perspective of Global Practice. IJERPH 15, 1334. doi:10.3390/ijerph15071334
Lu, C.-C., Chiu, Y.-H., Shyu, M.-K., and Lee, J.-H. (2013). Measuring CO2 Emission Efficiency in OECD Countries: Application of the Hybrid Efficiency Model. Econ. Model. 32, 130–135. doi:10.1016/j.econmod.2013.01.047
Lv, K., Cheng, Y., and Wang, Y. (2021). Does Regional Innovation System Efficiency Facilitate Energy-Related Carbon Dioxide Intensity Reduction in China? Environ. Dev. Sustain. 23, 789–813. doi:10.1007/s10668-020-00609-0
Ma, L., Chen, M., Che, X., and Fang, F. (2019). Research on Population-Land-Industry Relationship Pattern in Underdeveloped Regions: Gansu Province of Western China as an Example. Sustainability 11, 2434. doi:10.3390/su11082434
Meng, F., Su, B., Thomson, E., Zhou, D., and Zhou, P. (2016). Measuring China's Regional Energy and Carbon Emission Efficiency with DEA Models: A Survey. Appl. Energ. 183, 1–21. doi:10.1016/j.apenergy.2016.08.158
Pishgar-Komleh, S. H., Čechura, L., and Kuzmenko, E. (2021). Investigating the Dynamic Eco-Efficiency in Agriculture Sector of the European Union Countries. Environ. Sci. Pollut. Res. 28, 48942–48954. doi:10.1007/s11356-021-13948-w
Schanes, K., Jäger, J., and Drummond, P. (2019). Three Scenario Narratives for a Resource-Efficient and Low-Carbon Europe in 2050. Ecol. Econ. 155, 70–79. doi:10.1016/j.ecolecon.2018.02.009
Shen, L., Wu, Y., Lou, Y., Zeng, D., Shuai, C., and Song, X. (2018). What Drives the Carbon Emission in the Chinese Cities?-A Case of Pilot Low Carbon City of Beijing. J. Clean. Prod. 174, 343–354. doi:10.1016/j.jclepro.2017.10.333
Shimada, K., Tanaka, Y., Gomi, K., and Matsuoka, Y. (2007). Developing a Long-Term Local Society Design Methodology towards a Low-Carbon Economy: An Application to Shiga Prefecture in Japan. Energy Policy 35, 4688–4703. doi:10.1016/j.enpol.2007.03.025
Song, M., Song, Y., Yu, H., and Wang, Z. (2013). Calculation of China's Environmental Efficiency and Relevant Hierarchical Cluster Analysis from the Perspective of Regional Differences. Math. Comp. Model. 58, 1084–1094. doi:10.1016/j.mcm.2012.04.003
Sun, Y. (2018). China's Target Responsibility System and Convergence of Co2 Emissions. Singapore Econ. Rev. 63, 431–445. doi:10.1142/S0217590817400197
Tan, S., Yang, J., Yan, J., Lee, C., Hashim, H., and Chen, B. (2017). A Holistic Low Carbon City Indicator Framework for Sustainable Development. Appl. Energ. 185, 1919–1930. doi:10.1016/j.apenergy.2016.03.041
Venkataraman, S. (2004). Regional Transformation through Technological Entrepreneurship. J. Business Venturing 19, 153–167. doi:10.1016/j.jbusvent.2003.04.001
Wang G, G., Deng, X., Wang, J., Zhang, F., and Liang, S. (2019). Carbon Emission Efficiency in China: A Spatial Panel Data Analysis. China Econ. Rev. 56, 101313. doi:10.1016/j.chieco.2019.101313
Wang Q, Q., Su, B., Zhou, P., and Chiu, C.-R. (2016). Measuring Total-Factor CO2 Emission Performance and Technology Gaps Using a Non-radial Directional Distance Function: A Modified Approach. Energ. Econ. 56, 475–482. doi:10.1016/j.eneco.2016.04.005
Wang, Q., Su, B., Sun, J., Zhou, P., and Zhou, D. (2015). Measurement and Decomposition of Energy-Saving and Emissions Reduction Performance in Chinese Cities. Appl. Energ. 151, 85–92. doi:10.1016/j.apenergy.2015.04.034
Wang X, X., Ding, H., and Liu, L. (2019). Eco-efficiency Measurement of Industrial Sectors in China: A Hybrid Super-efficiency DEA Analysis. J. Clean. Prod. 229, 53–64. doi:10.1016/j.jclepro.2019.05.014
Wang Z, Z., Deng, X., Bai, Y., Chen, J., and Zheng, W. (2016). Land Use Structure and Emission Intensity at Regional Scale: A Case Study at the Middle Reach of the Heihe River basin. Appl. Energ. 183, 1581–1593. doi:10.1016/j.apenergy.2016.09.109
Wu, H., Hao, Y., and Ren, S. (2020). How Do Environmental Regulation and Environmental Decentralization Affect green Total Factor Energy Efficiency: Evidence from China. Energ. Econ. 91, 104880. doi:10.1016/j.eneco.2020.104880
Xie, Q., Hu, P., Jiang, A., and Li, Y. (2019). Carbon Emissions Allocation Based on Satisfaction Perspective and Data Envelopment Analysis. Energy Policy 132, 254–264. doi:10.1016/j.enpol.2019.05.024
Xue, L., Zhang, W., Zheng, Z., Liu, Z., Meng, S., Li, H., et al. (2021). Measurement and Influential Factors of the Efficiency of Coal Resources of China's Provinces: Based on Bootstrap-DEA and Tobit. Energy 221, 119763. doi:10.1016/j.energy.2021.119763
Yam, R. C. M., Lo, W., Tang, E. P. Y., and Lau, A. K. W. (2011). Analysis of Sources of Innovation, Technological Innovation Capabilities, and Performance: An Empirical Study of Hong Kong Manufacturing Industries. Res. Pol. 40, 391–402. doi:10.1016/j.respol.2010.10.013
Yang, G., Gong, G., and Gui, Q. (2022). Exploring the Spatial Network Structure of Agricultural Water Use Efficiency in China: A Social Network Perspective. Sustainability 14, 2668. doi:10.3390/su14052668
Yang, G., Zhang, F., Zhang, F., Ma, D., Gao, L., Chen, Y., et al. (2021). Spatiotemporal Changes in Efficiency and Influencing Factors of China's Industrial Carbon Emissions. Environ. Sci. Pollut. Res. 28, 36288–36302. doi:10.1007/s11356-021-13003-8
Yang, Q., Ding, Y., de Vries, B., Han, Q., and Ma, H. (2014). Assessing Regional Sustainability Using a Model of Coordinated Development Index: A Case Study of Mainland China. Sustainability 6, 9282–9304. doi:10.3390/su6129282
Yoon, H., Yun, S., Lee, J., and Phillips, F. (2015). Entrepreneurship in East Asian Regional Innovation Systems: Role of Social Capital. Technol. Forecast. Soc. Change 100, 83–95. doi:10.1016/j.techfore.2015.06.028
Yu, X., Lu, B., and Wang, R. (2018). Analysis of Low Carbon Pilot Industrial parks in China: Classification and Case Study. J. Clean. Prod. 187, 763–769. doi:10.1016/j.jclepro.2018.03.141
Yuan, R., Behrens, P., Tukker, A., and Rodrigues, J. F. D. (2018). Carbon Overhead: The Impact of the Expansion in Low-Carbon Electricity in China 2015-2040. Energy Policy 119, 97–104. doi:10.1016/j.enpol.2018.04.027
Zhan, C., and de Jong, M. (2018). Financing Eco Cities and Low Carbon Cities: The Case of Shenzhen International Low Carbon City. J. Clean. Prod. 180, 116–125. doi:10.1016/j.jclepro.2018.01.097
Zhang J, J., Zeng, W., Wang, J., Yang, F., and Jiang, H. (2017). Regional Low-Carbon Economy Efficiency in China: Analysis Based on the Super-SBM Model with CO 2 Emissions. J. Clean. Prod. 163, 202–211. doi:10.1016/j.jclepro.2015.06.111
Zhang N, N., Liu, Z., Zheng, X., and Xue, J. (2017). Carbon Footprint of China's belt and Road. Science 357, 1107. doi:10.1126/science.aao6621
Zhang, P., Wang, Y., and Qin, G. (2018). Fuzzy Damage Analysis of the Seismic Response of a Long-Distance Pipeline under a Coupling Multi-Influence Domain. Energies 12, 62. doi:10.3390/en12010062
Zhang, Y., Wang, W., Liang, L., Wang, D., Cui, X., and Wei, W. (2020). Spatial-temporal Pattern Evolution and Driving Factors of China's Energy Efficiency under Low-Carbon Economy. Sci. Total Environ. 739, 140197. doi:10.1016/j.scitotenv.2020.140197
Zhao, G., Guerrero, J. M., Jiang, K., and Chen, S. (2017). Energy Modelling towards Low Carbon Development of Beijing in 2030. Energy 121, 107–113. doi:10.1016/j.energy.2017.01.019
Keywords: low-carbon economic efficiency (LCEE), scientific and technological development level (STDL), uncoordinated coupling, spatio-temporal characteristics, influencing factor
Citation: Guangming Y, Qingqing G, Fengtai Z, Guofang G and Yunrui Y (2022) The Temporal and Spatial Characteristics and Influencing Factors of Low-Carbon Economy Efficiency and Science and Technology Development Level in China’s Provinces From the Perspective of Uncoordinated Coupling. Front. Environ. Sci. 10:886886. doi: 10.3389/fenvs.2022.886886
Received: 02 March 2022; Accepted: 11 April 2022;
Published: 18 May 2022.
Edited by:
Tieyu Wang, Shantou University, ChinaReviewed by:
Ehsan Elahi, Shandong University of Technology, ChinaQunxi Gong, Sichuan University, China
Copyright © 2022 Guangming, Qingqing, Fengtai, Guofang and Yunrui. This is an open-access article distributed under the terms of the Creative Commons Attribution License (CC BY). The use, distribution or reproduction in other forums is permitted, provided the original author(s) and the copyright owner(s) are credited and that the original publication in this journal is cited, in accordance with accepted academic practice. No use, distribution or reproduction is permitted which does not comply with these terms.
*Correspondence: Zhang Fengtai, emhmdGhlcm80NUBjcXV0LmVkdS5jbg==