 Sikui Zhang
 Lin Bai2,3,4*
 Weile Li
- 1College of Computer Science and Cyber Security, Chengdu University of Technology, Chengdu, China
- 2College of Mathematics and Physics, Chengdu University of Technology, Chengdu, China
- 3Geomathematics Key Laboratory of Sichuan Province, Chengdu University of Technology, Chengdu, China
- 4State Key Laboratory of Geohazard Prevention and Geoenvironment Protection, Chengdu University of Technology, Chengdu, China
- 5College of Environment and Civil Engineering, Chengdu University of Technology, Chengdu, China
Landslides are one of the most widespread disasters and threaten people’s lives and properties in many areas worldwide. Landslide susceptibility mapping (LSM) plays a crucial role in the evaluation and extenuation of risk. To date, a large number of machine learning approaches have been applied to LSM. Of late, a high-level convolutional neural network (CNN) has been applied with the intention of raising the forecast precision of LSM. The primary contribution of the research was to present a model which was based on the CNN for LSM and methodically compare its capability with the traditional machine learning approaches, namely, support vector machine (SVM), logistic regression (LR), and random forest (RF). Subsequently, we used this model in the Wenchuan region, where a catastrophic earthquake happened on 12 May 2008 in China. There were 405 valuable landslides in the landslide inventory, which were divided into a training set (283 landslides) and validation set (122 landslides). Furthermore, 11 landslide causative factors were selected as the model’s input, and each model’s output was reclassified into five intervals according to the sensitivity. We also evaluated the model’s performance by the receiver operating characteristic (ROC) curve and several statistical metrics, such as precision, recall, F1-score, and other measures. The results indicated that the CNN-based methods achieved the best performance, with the success-rate curve (SRC) and prediction-rate curve (PRC) approaches reaching 93.14% and 91.81%, respectively. The current research indicated that the approach based on the CNN for LSM had both outstanding goodness-of-fit and excellent prediction capability. Generally, the LSM in our research is capable of advancing the ability to assess landslide susceptibility.
1 Introduction
Landslides are one of the main disasters which exist in mountainous zones worldwide, threatening people, properties, and the natural environment (Qiang and Xiu-June 2011; Dou et al., 2019; Mengistu et al., 2019; Shano et al., 2020). These events represent one of the most severe geological disasters and are caused by landforms, geology, hydrology, and human activities (Jaafari et al., 2019), possibly causing massive casualties and damaging many infrastructures when large-scale landslides occur. Especially in Wenchuan China, from the magnitude 8 earthquake in 2008 (Chen M. et al., 2020) to now, this region maintains a relatively high activity level, seriously threatening the rebuilding of the county and the local people (Chong et al., 2013; Zhou et al., 2021). Hence, reliability prediction and timely management of landslides are of vital importance for preventing and reducing the cost caused by landslides (Wu et al., 2015).
LSM describes the space division of landslides in a specific zone on the foundation of past and present landslide incidents. In LSM, the most important step in determining the evaluation accuracy involves defining which modeling approach is to be used (Akinci and Zeybek, 2021). In recent years, people have applied qualitative methods and quantitative methods (Depicker et al., 2020) in LSM. These qualitative methods are based on a knowledge-driven approach. The statistical models used in LSM include the analytical hierarchy process (AHP) (Hepdeniz, 2020), weight of evidence (Saha and Saha, 2020), frequency ratio (Zhang et al., 2020), information gain (Chen T. et al., 2020), etc. However, these methods have been gradually replaced by machine learning methods, which have achieved better performance in LSM, and a data-driven model is regarded as a more useful landslide spatiotemporal mapping tool in the quantitative method, including logistic regression (LR) (Akgun, 2012; Pourghasemi et al., 2013), support vector machine (SVM) (Pham et al., 2019), naïve Bayes (Xie M. et al., 2021), decision tree (DT) (Nhu et al., 2020a), and the artificial neural network (ANN) (Nhu et al., 2020b). While some progresses have been made in LSM, the performance of the methods in LSM still needs to be improved. For example, for some general methods such as DT and the ANN, their simple model structure makes it hard to fully capture the complex linear relationship or nonlinear relations between landslides and their surroundings (Kong et al., 2021).
Apparently, neither knowledge-driven approaches nor traditional machine learning approaches such as the SVM can make full use of the environmental information around landslides. More recently, except for the methods given above, convolutional neural networks (CNNs) have been successfully used in LSM (Wang et al., 2019; Fang et al., 2020; Pham et al., 2020; Wei et al., 2021). What is worth mentioning is that Wang et al., (2019) thoroughly compared one-dimensional, two-dimensional, and three-dimensional CNNs according to information from Yanshan County. A multiresolution sampling method (Yi et al., 2020) that can further take advantage of the surroundings of the landslides was proposed. Despite these developments, there is no consensus on the most appropriate method for LSM in the literature. Although it is novel to use CNN to analyze landslide susceptibility compared with other approaches, previous studies have mainly focused on the comparison between machine learning and statistical methods (Goetz et al., 2015; Pham et al., 2016; Merghadi et al., 2020), with few attempts to compare these approaches with conventional machine learning. To fill this gap, our research aims to compare the CNN with conventional machine learning approaches (LR, RF, and SVM), selecting 11 related factors such as terrain, environmental conditions, and the engineering behaviors of human beings to construct a landslide susceptibility assessment mechanism. We adopted the ROC curve, precision, recall, F1-score, and MCC coefficient to carry out assessment and verify our models, facilitating the prediction of landslide susceptibility.
As for this research, the mapping of landslide susceptibility in the Wenchuan region involves four steps:
1. For assembling the data required for the research, a causative factor determination procedure was performed by using multicollinearity assessment and Pearson’s analysis to choose appropriate factors, predisposing factors to establish datasets for CNN-based models.
2. Modeling landslide susceptibility in terms of CNN, logistic regression, random forest, and support vector machine.
3. Generating the landslide susceptibility mapping of the study area.
4. Evaluating the goodness-of-fit and prediction capability in training datasets and validation datasets.
2 Description of the Study Area
As illustrated in Figure 1, the study area is on the northwest edge of the Sichuan Basin, located in Sichuan Province, Southwest China. This area covers an area of 4,084 square kilometers and spans 102° 39′ E and 103° 44′ E longitudes and 30° 45′ N and 31° 43′ N latitudes. The pie chart in Figure 1 shows the percentage of landslides that occurred in the area for each year from 2013 to 2018. In this region, the variation in rock characteristics is complex and dominated by soft rock and soil layers, with a fourth-century loose soil layer and strong decaying magmatic layer as its symbols. The terrain in Wenchuan is mostly dominated by two mountain ranges: the Longmen mountain system and Qionglai mountain system. This area also contains the Maowen fault and Beichuan–Yinxiu fault (Xie W. et al., 2021). With prosperous water systems and highly fractured mounds, the main water systems in Wenchuan County are the Minjiang River, Zagunao River, and Yuzixi River.
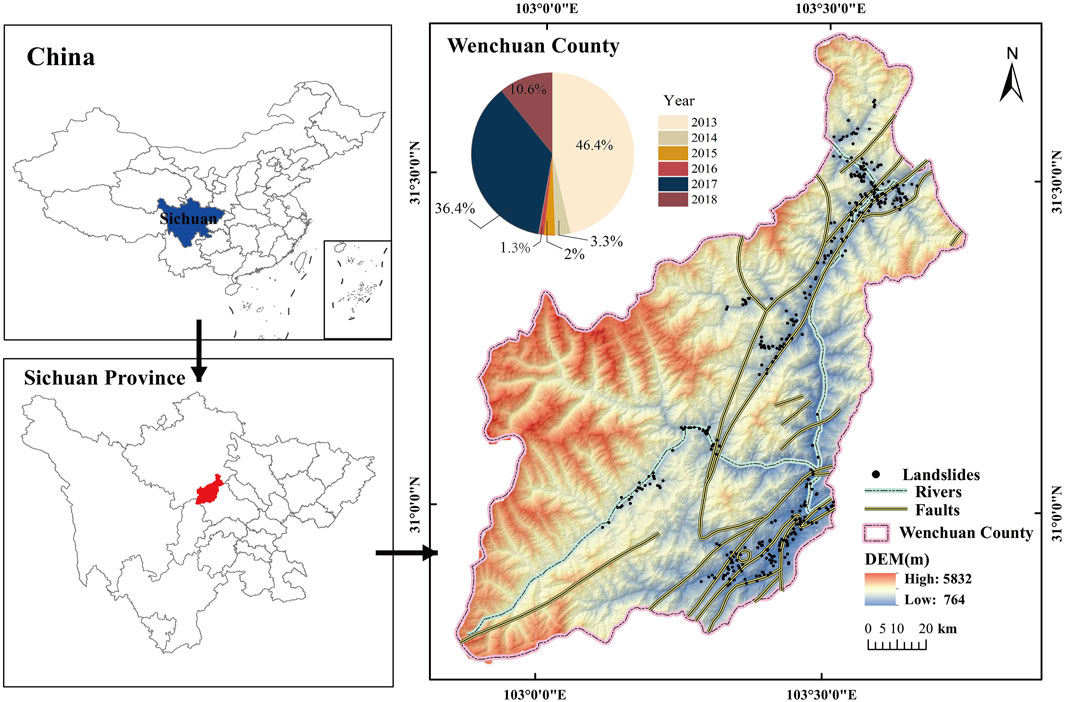
FIGURE 1. Location of the study area.
The magnitude 8 earthquake that occurred on 12 May 2008 caused a large-scale loosened rock mass and loose sediments (Cui et al., 2021). Under the action of rainfall and other natural factors, it leads to the saturation of the soil and rock layer on the slope and even water accumulation in the water barrier at the lower part of the slope, which increases the weight of the landslide and reduces the shear strength of the soil and rock layer, so the frequency of landslide increases. In this region, the main forms of landslide collapse, landslides, and debris flow severely disrupt the local traffic and economy. Thus, analyzing the factors of landslides and evaluating landslide susceptibility will contribute greatly to distinguish and figure out where the landslide-prone areas are.
3 Data Preparation
3.1 Landslide Inventory
The basis of landslide susceptibility studies is landslide inventory. Generally, a complete landslide inventory should keep track of the sites, size, outline, and time of the landslide, which can be developed into a basic database for further study. The data of this research mainly originated from the detailed landslide data of Wenchuan County at the GDEMV2 30 m resolution digital elevation. In total, 405 landslides were selected from the detailed geological hazard survey data of Wenchuan (2013F02D2018). Taking the image resolution and aims into consideration, we converted all the data into 30 m × 30 m raster data. The landslide inventory was divided into two parts at random for the intention of evaluating the landslide susceptibility: 70% of landslides were utilized for the purpose of model training, and the remaining 30% were utilized for the purpose of validation. In addition to this, the same quantity of non-landslide sites was chosen at random outside the buffer area to perform the training and validation. Taking the scale of landslides into consideration, this research sets the buffer distance as 100 m.
3.2 Landslide Causative Factors
At present, there are no general rules existing for choosing the landslide causative factors (Yi et al., 2020). It is generally believed that not a single factor can contribute to the appearance of landslides, requiring a close combination of many environmental factors such as terrain and geology. Therefore, choosing appropriate landslide factors can better explain the occurrence of landslides. Because of the complexity and diversity in the trigger source of landslides, we chose the factors according to the variation in the specific region (Van Westen et al., 2008). Considering the conditions of the nature and availability of data in the research area, 11 causative factors were selected: elevation, slope, aspect, plan curvature, profile curvature, relief amplitude, distance to rivers, distance to roads, distance to faults, NDVI, and lithology (Figure 2). The data that are utilized in this research are mainly derived from Wenchuan landslide survey data (2013–2018), as shown in Table 1.
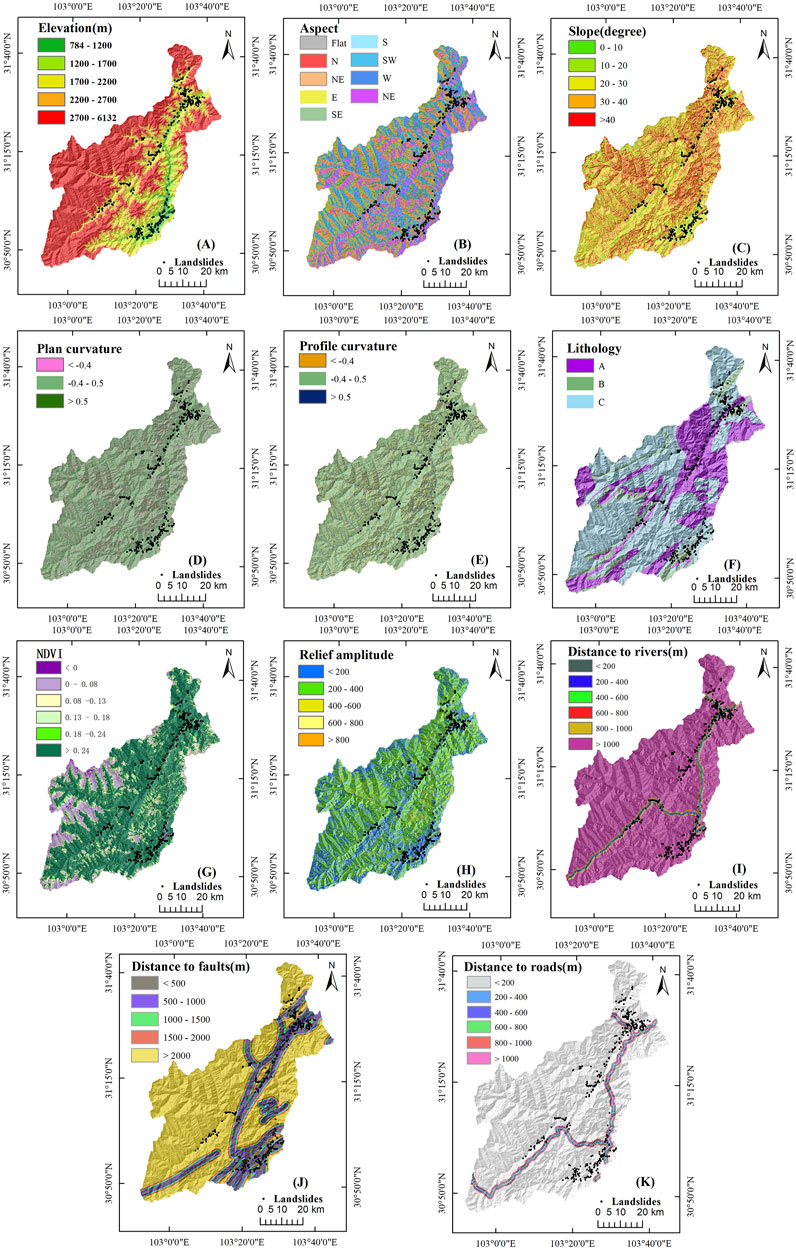
FIGURE 2. Maps of landslide causative factors. (A) Elevation, (B) aspect, (C) slope, (D) plan curvature, (E) profile curvature, (F) lithology, (G) NDVI, (H) relief amplitude, (I) distance to rivers, (J) distance to faults, and (K) distance to roads.
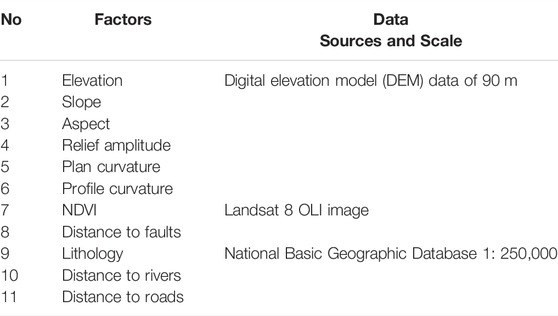
TABLE 1. Data sources of landslide-impacting elements.
Among these influencing factors, elevation occupies a decisive role in landslides. As for the study area, landslides are concentrated between 875 and 2613 m. The aspect in the research zone is associated with the location of the landslides as slope deposits or quaternary cover are usually distinct in different directions (Nandi and Shakoor, 2010). The slope reflects the sharpness of the research zone, and generally, steep slopes are more prone to landslides than gentle slopes (Dai et al., 2001). Plan and profile curvature is efficient to mirror the complication of the terrain (Oh and Pradhan, 2011). In mountain areas, the normalized vegetation index (NDVI) is an indispensable index of slope stability, and we classified the NDVI into six ranges:
4 Methodology
4.1 Convolutional Neural Network
With the landslide inventory and causative factors, the next step is to format these data into a uniform input dataset to construct the CNN model. The layers of the 11 landslide causative factors are superimposed together to form a tensor of size 11 × w × h, where w and h are the width and height of the research area, respectively. The established landslide inventory is then superimposed onto the abovementioned layers to obtain the raster location corresponding to the landslide point, which is expanded into square data of size n × n centered on that raster pixel so that more environmental information around the landslide will be used in model construction. It is to be noted that the scale of the raster influences the CNN model’s performance. The raster used for training should be set up on the resolution of the raster (Yi et al., 2020), and the final raster size used for learning in this study was determined to be 17 × 17 by using the trial-and-error approach.
As a characteristic deep learning algorithm, convolutional neural network (Krizhevsky et al., 2012) is widely used for image classification and recognition (Szegedy et al., 2015; Gu et al., 2018). The classical CNN structure consists of an input layer, multiple convolutional layers, multiple pooling layers, and fully connected layers (He et al., 2016). In this study, the input layer imports a normalized (uniform size) 11-dimensional training tensor, and the neurons extract some basic pixel features, including edges, corner points, etc. Next, the convolutional layer obtains the feature maps by convolutional operations, and at each position, the units that are derived from various feature maps gain their own kinds of features. Usually, a convolutional layer consists of numerous feature maps with various weight vectors in order to retain the richer features. The convolutional layer is later connected to a pooling layer for downsampling operation. For LSM, it can reduce the resolution of the image and the number of parameters and obtains robust translation and deformation. Finally, the chance of incidence of landslides is calculated by the fully connected layer to output the classification result. As for this research, the organization of the designed convolutional neural network is illustrated in Figure 3.
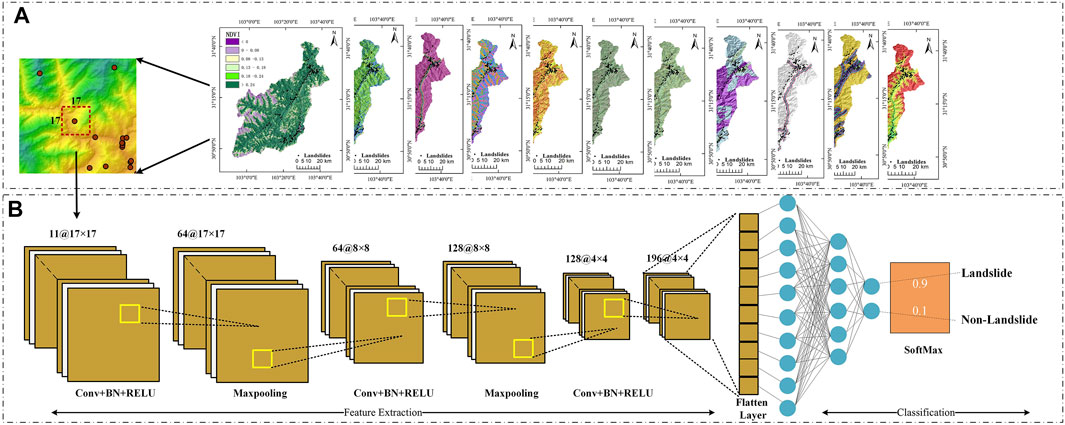
FIGURE 3. Two parts of the CNN network Architecture. (A) The construction of data set, (B) The construction of specific network.
4.2 Conventional Machine Learning Methods
1) Logistic regression: It is a comprehensive linear model that is commonly utilized in dichotomous problems and widely used for landslide susceptibility modeling problems (Kavzoglu et al., 2014; Colkesen et al., 2016). The cost function is first set up, after which the optimum model parameters are addressed iteratively by optimization methods. Logistic regression commonly uses the sigmoid functional equation as the cost function.
In the landslide susceptibility partition rating, the probability of landslide occurrence can be formulated as
where βi is the regression coefficient, xi is the individual influence factor, P is the possibility of the incidence of landslide, and Z is the sum of all the influence factors after simultaneous loading.
2) Random forest: It is an integrated learning approach which is utilized widely in order to perform the regression (Nhu et al., 2020a; Wang et al., 2020). The integrated learning approach produces numerous independent training sets and a quantity of classification and regression trees (CARTs) by combined bagging, and it is expressed as
where h (X, θk) is the unprocessed categorical regression tree produced by the CART algorithm, x is the input vector, and θk is an independently distributed random vector.
A singular decision tree is a poor classifier because of high-level bias or variance among data. Therefore, random forest creates multiple decision trees and then calculates the classification by aggregating these decision trees. The integrated model is found to perform better than the individual model (Nhu et al., 2020a). Therefore, creating decision trees individually to form a random forest is considered a better approach. In this study, a spatial training set was created by using the bagging method, and CARTs were created by 11 different landslide causative factors. Finally, all the decision trees were combined, and the class with the most votes was used as the result of the model.
3) Support vector machine: The core idea of the support vector machine is to classify samples in higher-dimensional space by converting the initial space to a new higher-dimensional one by the definition of the inner product function. By means of kernel functions, the linear classification boundary can be transformed into a nonlinear classification boundary to obtain better generalization performance (Sevgen et al., 2019; Sun et al., 2020). As for this research, the radial basis kernel function (RBF) (Nhu et al., 2020c) is expressed as follows:
in which z represents the center of the kernel function and γ represents the width parameter, which mainly controls the radial range of action of the function. The best parameters are found cyclically by using the GridSearchCV method (Vapnik, 1999) in the sklearn package.
5 Results and Discussion
5.1 Multicollinearity Analysis of Causative Factors
Feature selection is particularly important during spatial prediction of landslides. There are many features to choose, among which there may be features that are not related to landslides, and the features may depend on each other. The more features, the easier it will cause over-fitting and dimensional disasters, and the more complex the model will be. In this study, tolerance (TOL), variance inflation factor (VIF), and Pearson’s correlations (Al-Najjar et al., 2019) are utilized for the purpose of performing multicollinearity analysis.
1) VIF and TOL: To evaluate the correlation between the landslide impact factors, this study calculated the TOL and VIF so as to confirm the multicollinearity between the different impact factors. It is statistically demonstrated that the variance of the parameter estimator of the explanatory variables is expressed as
where
When the VIF is no more than 10, no multicollinearity exists; when 10 ≤ VIF ≤100, strong multicollinearity exists; and when VIF exceeds 100, there is severe multicollinearity. The tolerance level (TOL) is the reciprocal of the VIF and takes a value between 0 and 1. It is usually considered that when the tolerance level is less than 0.1, there is severe multicollinearity. If the VIF exceeds 10 or TOL is smaller than 0.1, the factor should be detached from the landslide forecasting model.
2) Pearson’s coefficient: The correlation of factors can be analyzed using Pearson’s coefficient. The correlation coefficient R represents the correlation between different factors, and its value generally ranges between [−1,1]
in which cov (x, y) is the covariance of x and y, and Var [x] and Var [y] are the variances.
Deriving the formula further, x and y are the two landslide causative factors in this study, and the following equation can be derived
in which
The correlation increases as the absolute value of the correlation coefficient increases. Typically, when the absolute value of Pearson’s coefficient exceeds 0.8, it indicates that the correlation is obvious. As for this research, Pearson’s coefficient is used for the purpose of evaluating the magnitude of correlation between two causative factors.
3) Results: The final outcomes of multicollinearity analysis for the 11 landslide causative factors are presented in Table 2. It was found that the largest VIF value for lithology was 8.1569, but still less than 10. The VIF and TOL values for the remaining 10 influences were within the normal interval, and the results indicated that all of the above 11 causative factors could be included in the susceptibility modeling.
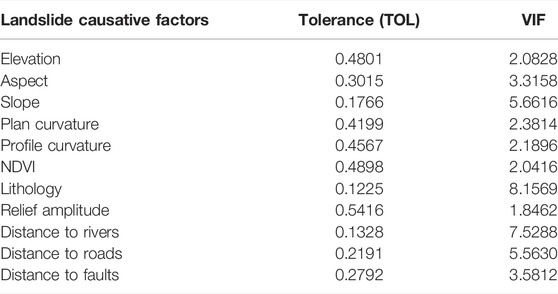
TABLE 2. Multicollinearity analysis of landslide causative factors.
Figure 4 shows the magnitude of correlation between different causative factors. The correlation to the fault distance and topographic relief shows a maximum positive correlation of 0.25, and the maximum negative correlation is NDVI with a plan curvature of −0.29. Typically, when Pearson’s coefficient exceeds 0.8, it indicates high covariance. The results show that there is no covariance problem with the influencing factors. The findings are in line with the validation results of VIF and TOL, and all the causative factors selected are able to be utilized for landslide susceptibility modeling, which ensures the accuracy and precision of the model.
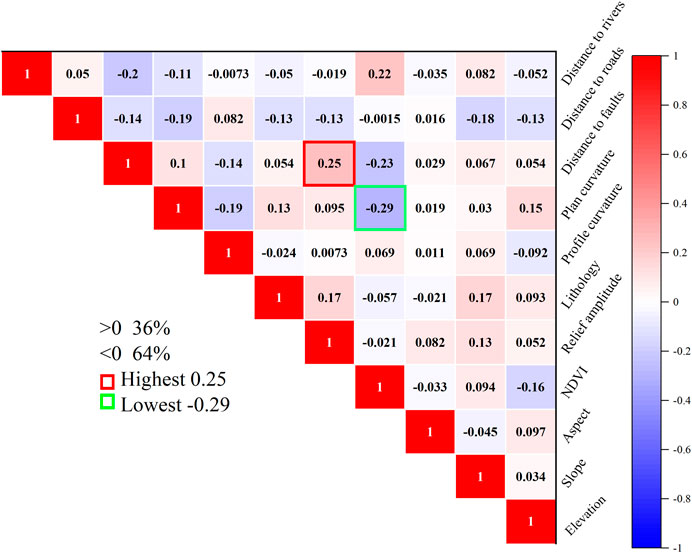
FIGURE 4. Result of Pearson’s analysis.
5.2 Landslide Susceptibility Mapping
This subsection conducts experiments on the above-introduced CNN model and three machine learning models for landslide susceptibility analysis. Data processing, model building, and training are implemented in PyTorch by using Python programing. For the parameters in the CNN model, this study uses the trial-and-error approach to optimize the main parameters that may be optimized during the training process, as detailed in Table 3.
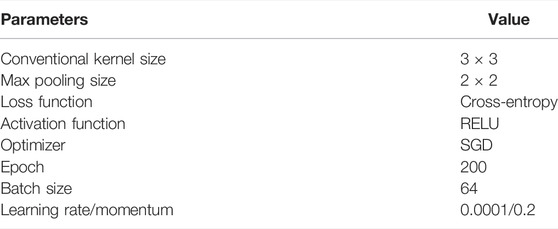
TABLE 3. Parameter settings of the CNN model.
Finally, the trained CNN model was applied for the purpose of producing a landslide susceptibility map. The LSM is described in Figure 5. The susceptibility was treated with reclassification into five levels using the Jenks natural fracture approach with ArcGIS 10.8 software, namely, very low, low, moderate, high, and very high. The LSM of the CNN model assumed that the susceptibility classes of the above-occupied areas of 14%, 9%, 6%, 10%, and 61% of the research zone, respectively (Figure 6). The very high susceptibility zones are mainly located in the fault concentration area (southeast area of Wenchuan County) and the water system around the region, accounting for 9.4% of the total area of the research zone (Figure 6). In addition, it can be noticed that the majority of the landslides are situated in the susceptibility zones which are very high, and no landslide occurs in the susceptibility zones which are low, pointing out that the model which is based on the CNN approach can precisely predict the majority of the landslides that are witnessed in the high-susceptibility area.
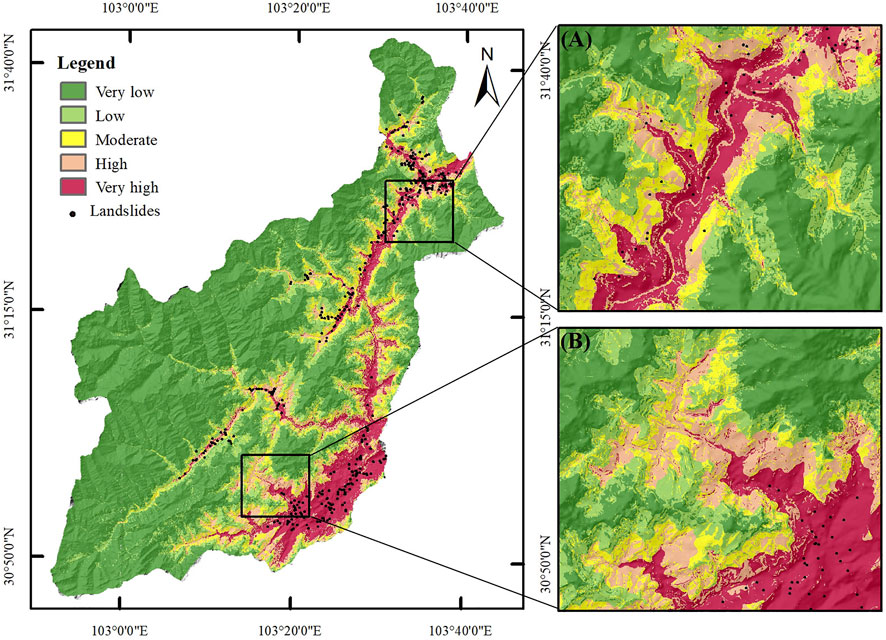
FIGURE 5. Landslide susceptibility maps produced by the CNN model. (A) and (B) are local expansions of two different regions respectively.

FIGURE 6. Distribution of susceptible areas (in %) produced by different LSM models.
The landslide susceptibility maps are produced by using three machine learning models which are LR, RF, and SVM to perform better comparison (Figure 7). Visually, the very high susceptibility areas for all three methods are similar to the CNN model distribution pattern, mainly concentrated in fault concentration areas and around water systems. In terms of the susceptibility which is very high, the outcomes of the CNN and the three machine learning algorithms are basically the same, but the moderate susceptibility based on the LR method is relatively scattered. Notably, the CNN-based method generates significantly lower regions of low susceptibility than the other three machine learning methods.
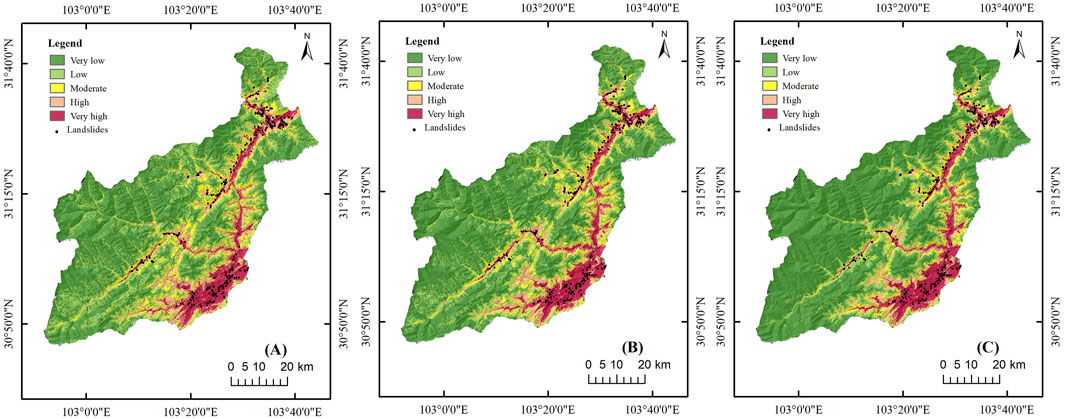
FIGURE 7. Landslide susceptibility maps produced by using (A) logistic regression, (B) random forest, and (C) support vector machine.
5.3 Validation and Comparison of the Results
The final step in LSM research is to validate the results of the model (Akinci and Zeybek, 2021). Chung and Fabbri, (2003) states that a central point in measuring the importance of a prediction is that it allows for interpretation of the results. If the validation is not carried out, it is impossible to obtain the explanation and the support for the approach (Chung and Fabbri, 2003; He and Kusiak, 2017). Numerous precision evaluation methods were used for the purpose of assessing the property of the CNN model (Saha et al., 2021). As shown in Figure 8, the property of the CNN model was determined by introducing five metrics such as ROC curve and precision, which were based on the foundation of confusion matrices with true positive (TP), false positive (FP), true negative (TN), and false negative (FN).
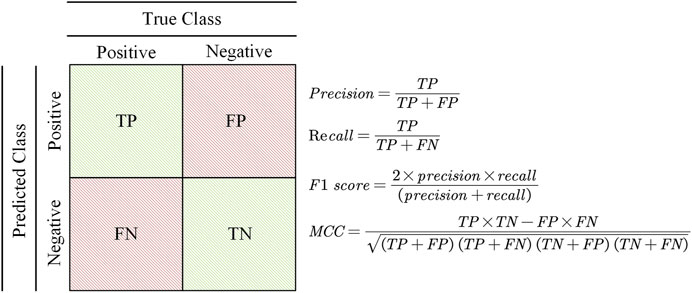
FIGURE 8. Confusion matrix and calculation formulas.
As far as the ROC curves are concerned, the area under the curve (AUC) (Jiao et al., 2019) is the most significant metric during the course of assessing the precision of the quality of the susceptibility model. As previously reported, AUC values between 0.5 and 0.6 show weak performance, 0.6–0.7 indicate average performance, 0.7–0.8 indicate good performance, 0.8–0.9 indicate very good performance, and 0.9–1.0 indicate excellent performance (Cao et al., 2020). As shown in Figure 9, numerically, the CNN structure outperforms the other three machine learning approaches on the training set and ranks first, with SRC-AUC and PRC-AUC values of 93.14% and 91.81%, respectively. This model is followed by the SVM (88.36%), RF (86.30%), and LR (84.89%). It is to be noted that the order of the AUC values on the validation set is not the same. The CNN model has the highest PRC-AUC value (91.81%), and SVM (89.75%) has the highest value among the three machine learning methods, followed by LR (87.87%), and the worst is RF (86.14%). However, their overall degrees of difference are not significant, approximately five to six percentage points.
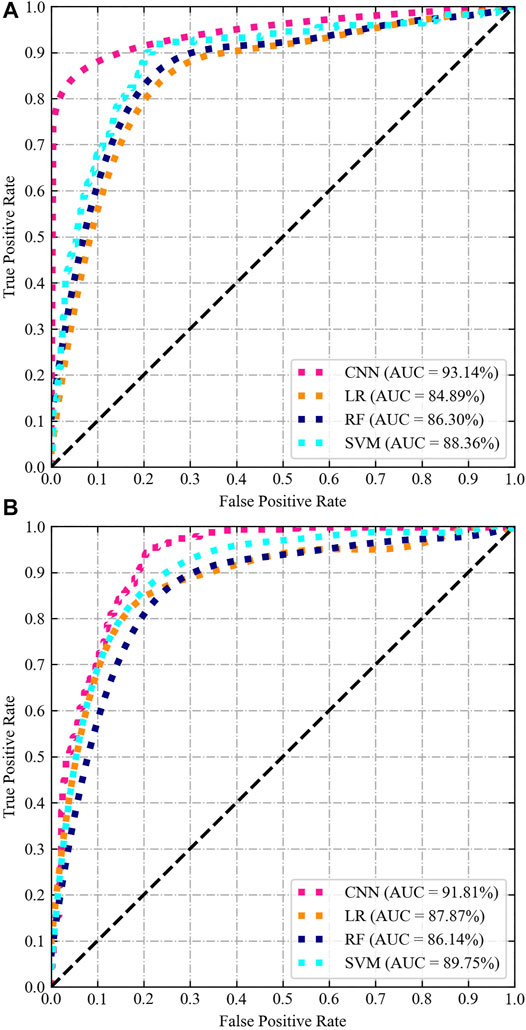
FIGURE 9. Performance analysis of different landslide susceptibility models. (A) SRC and (B) PRC.
In Table 4, the precision is the proportion of successful classification of landslide locations (Wang et al., 2019). The recall is the proportion of landslide points successfully classified by the CNN model in all landslide locations (Liu et al., 2020). The F1-score combines the output of precision and recall, which is defined as the harmonic average of precision and recall (Fukuda et al., 2013; Li et al., 2022). The higher the F1-score is, the better the performance of the model will be. The Matthews correlation coefficient (MCC) is useful in comparing the binary classification of unbalanced datasets. In addition, its value range is −1 to 1; the closer to 1, the better of the classification result will be (Fukuda et al., 2013).
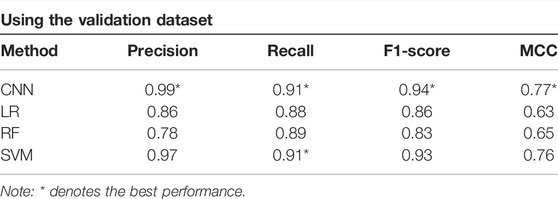
TABLE 4. Accuracy statistics of the models.
In summary, the CNN model is feasible and effective in LSM, with excellent goodness-of-fit and predictive power compared to those of the other three machine learning models.
6 Conclusion
This study is one of the few works that analyzes the performance of CNN models in deep learning compared with common machine learning approaches, conducting a case study in Wenchuan County, China. We summarize the method of constructing deep learning datasets in detail, namely, using images as input, which is rarely found in present studies in the literature. To prepare the training samples, 11 landslide causative factors, namely, elevation, slope, aspect, relief amplitude, plan curvature, profile curvature, NDVI, lithology, distance to roads, distance to rivers, and distance to faults were selected. A total of 405 landslides were adopted in this research, and 70% of landslides (283 landslides) were chosen at random to perform the training models, with the remaining (122 landslides) to perform the validation. The SRC and PRC were used for the purpose of validating the results of the approaches based on the CNN, and logistic regression, random forest, and support vector machine were applied for comparison. The results indicated that the CNN-based approach has excellent goodness-of-fit and strong prediction capability compared with those of LR, RF, and SVM, exhibiting a superior SRC-AUC (93.14%) and PRC-AUC (91.81%), with successful application to landslide susceptibility mapping. In addition, compared with machine learning methods, CNN’s precision, recall, F1-score, and MCC also achieve the best results.
We only considered the region of Wenchuan for our study. It is necessary to conduct the investigation on the incidence of landslides in other areas of Sichuan for the purpose of obtaining information that are more relevant. In addition, the limitation of this study is that the terrain condition elements used here is all derived from the 30-m resolution DEM. In future research, higher resolution input data should be used to deal with the LSM, which may lead to better performance.
Data Availability Statement
The raw data supporting the conclusion of this article will be made available by the authors, without undue reservation.
Author Contributions
SZ: investigation, data curation, methodology, writing—original draft, algorithm design, and program development. LB: methodology, funding acquisition and supervision. YL: conceptualization, investigation, data curation, program development, and writing—review and editing. WL: funding acquisition and methodology. MX: data curation.
Funding
This study was supported by the National Key Research and Development Program of China (2021YFC3000401), the Nature Resource Science and Technology Program of Sichuan Province (No. Kj-2022-7), the China Geological Survey Project (No. DD20211365), and the Project of Remote Sensing Recognition and Monitoring of Potential Geological Hazard in Sichuan Province (No. 510201202110324).
Conflict of Interest
The authors declare that the research was conducted in the absence of any commercial or financial relationships that could be construed as a potential conflict of interest.
Publisher’s Note
All claims expressed in this article are solely those of the authors and do not necessarily represent those of their affiliated organizations, or those of the publisher, the editors, and the reviewers. Any product that may be evaluated in this article, or claim that may be made by its manufacturer, is not guaranteed or endorsed by the publisher.
References
Akgun, A. (2012). A Comparison of Landslide Susceptibility Maps Produced by Logistic Regression, Multi-Criteria Decision, and Likelihood Ratio Methods: a Case Study at İzmir, Turkey. Landslides 9, 93–106. doi:10.1007/s10346-011-0283-7
Akinci, H., and Zeybek, M. (2021). Comparing Classical Statistic and Machine Learning Models in Landslide Susceptibility Mapping in Ardanuc (Artvin), turkey. Nat. Hazards 1–29. doi:10.1007/s11069-021-04743-4
Al-Najjar, H. A., Kalantar, B., Pradhan, B., and Saeidi, V. (2019). “Conditioning Factor Determination for Mapping and Prediction of Landslide Susceptibility Using Machine Learning Algorithms,” in Earth Resources and Environmental Remote Sensing/GIS Applications X (International Society for Optics and Photonics), 11156, 111560K. doi:10.1117/12.2532687
Cao, J., Zhang, Z., Du, J., Zhang, L., Song, Y., and Sun, G. (2020). Multi-geohazards Susceptibility Mapping Based on Machine Learning-A Case Study in Jiuzhaigou, China. Nat. Hazards 102, 851–871. doi:10.1007/s11069-020-03927-8
Chen, M., Tang, C., Xiong, J., Shi, Q. Y., Li, N., and Gong, L. F. (2020a). The Long-Term Evolution of Landslide Activity Near the Epicentral Area of the 2008 Wenchuan Earthquake in china. Geomorphology 367, 107317. doi:10.1016/j.geomorph.2020.107317
Chen, T., Zhu, L., Niu, R.-q., Trinder, C. J., Peng, L., and Lei, T. (2020b). Mapping Landslide Susceptibility at the Three Gorges Reservoir, china, Using Gradient Boosting Decision Tree, Random forest and Information Value Models. J. Mountain Sci. 17. doi:10.1007/s11629-019-5839-3
Chong, X., Xiwei, X., Xiyan, W., Fuchu, D., Xin, Y., and Qi, Y. (2013). Detailed Catalog of Landslides Triggered by the 2008 Wenchuan Earthquake and Statistical Analyses of Their Spatial Distribution. J. Eng. Geology. 21, 25–44.
Chung, C.-J. F., and Fabbri, A. G. (2003). Validation of Spatial Prediction Models for Landslide hazard Mapping. Nat. Hazards 30, 451–472. doi:10.1023/b:nhaz.0000007172.62651.2b
Colkesen, I., Sahin, E. K., and Kavzoglu, T. (2016). Susceptibility Mapping of Shallow Landslides Using Kernel-Based Gaussian Process, Support Vector Machines and Logistic Regression. J. Afr. Earth Sci. 118, 53–64. doi:10.1016/j.jafrearsci.2016.02.019
Cui, S., Pei, X., Jiang, Y., Wang, G., Fan, X., Yang, Q., et al. (2021). Liquefaction within a Bedding Fault: Understanding the Initiation and Movement of the Daguangbao Landslide Triggered by the 2008 Wenchuan Earthquake (Ms= 8.0). Eng. Geology. 295, 106455. doi:10.1016/j.enggeo.2021.106455
Dai, F., Lee, C., Li, J., and Xu, Z. (2001). Assessment of Landslide Susceptibility on the Natural Terrain of Lantau Island, hong kong. Environ. Geology. 40, 381–391.
Depicker, A., Jacobs, L., Delvaux, D., Havenith, H.-B., Mateso, J.-C. M., Govers, G., et al. (2020). The Added Value of a Regional Landslide Susceptibility Assessment: The Western branch of the East African Rift. Geomorphology 353, 106886. doi:10.1016/j.geomorph.2019.106886
Dou, J., Yunus, A. P., Bui, D. T., Merghadi, A., Sahana, M., Zhu, Z., et al. (2019). Assessment of Advanced Random forest and Decision Tree Algorithms for Modeling Rainfall-Induced Landslide Susceptibility in the Izu-Oshima Volcanic Island, japan. Sci. total Environ. 662, 332–346. doi:10.1016/j.scitotenv.2019.01.221
Fang, Z., Wang, Y., Peng, L., and Hong, H. (2020). Integration of Convolutional Neural Network and Conventional Machine Learning Classifiers for Landslide Susceptibility Mapping. Comput. Geosciences 139, 104470. doi:10.1016/j.cageo.2020.104470
Fukuda, S., De Baets, B., Waegeman, W., Verwaeren, J., and Mouton, A. M. (2013). Habitat Prediction and Knowledge Extraction for Spawning European grayling (thymallus thymallus l.) Using a Broad Range of Species Distribution Models. Environ. Model. Softw. 47, 1–6. doi:10.1016/j.envsoft.2013.04.005
Goetz, J., Brenning, A., Petschko, H., and Leopold, P. (2015). Evaluating Machine Learning and Statistical Prediction Techniques for Landslide Susceptibility Modeling. Comput. geosciences 81, 1–11. doi:10.1016/j.cageo.2015.04.007
Gu, J., Wang, Z., Kuen, J., Ma, L., Shahroudy, A., Shuai, B., et al. (2018). Recent Advances in Convolutional Neural Networks. Pattern Recognition 77, 354–377. doi:10.1016/j.patcog.2017.10.013
He, K., Zhang, X., Ren, S., and Sun, J. (2016). “Deep Residual Learning for Image Recognition,” in Proceedings of the IEEE conference on computer vision and pattern recognition, 770–778. doi:10.1109/cvpr.2016.90
He, Y., and Kusiak, A. (2017). Performance Assessment of Wind Turbines: Data-Derived Quantitative Metrics. IEEE Trans. Sust. Energ. 9, 65–73.
Hepdeniz, K. (2020). Using the Analytic Hierarchy Process and Frequency Ratio Methods for Landslide Susceptibility Mapping in Isparta-Antalya Highway (D-685), turkey. Arabian J. Geosciences 13, 1–16. doi:10.1007/s12517-020-05764-2
Jaafari, A., Panahi, M., Pham, B. T., Shahabi, H., Bui, D. T., Rezaie, F., et al. (2019). Meta Optimization of an Adaptive Neuro-Fuzzy Inference System with Grey Wolf Optimizer and Biogeography-Based Optimization Algorithms for Spatial Prediction of Landslide Susceptibility. Catena 175, 430–445. doi:10.1016/j.catena.2018.12.033
Jiao, Y., Zhao, D., Ding, Y., Liu, Y., Xu, Q., Qiu, Y., et al. (2019). Performance Evaluation for Four Gis-Based Models Purposed to Predict and Map Landslide Susceptibility: A Case Study at a World Heritage Site in Southwest china. Catena 183, 104221. doi:10.1016/j.catena.2019.104221
Kavzoglu, T., Sahin, E. K., and Colkesen, I. (2014). Landslide Susceptibility Mapping Using Gis-Based Multi-Criteria Decision Analysis, Support Vector Machines, and Logistic Regression. Landslides 11, 425–439. doi:10.1007/s10346-013-0391-7
Kong, C., Wang, J., Ma, X., Tian, Y., Zhang, Z., and Xu, K. (2021). Optimization of Random forest Model for Assessing and Predicting Geological Hazards Susceptibility in Lingyun County.
Krizhevsky, A., Sutskever, I., and Hinton, G. E. (2012). Imagenet Classification with Deep Convolutional Neural Networks. Adv. Neural Inf. Process. Syst. 25, 1097–1105.
Li, H., He, Y., Xu, Q., Deng, J., Li, W., and Wei, Y. (2022). Detection and Segmentation of Loess Landslides via Satellite Images: a Two-phase Framework. Landslides, 1–14. doi:10.1007/s10346-021-01789-0
Liu, P., Wei, Y., Wang, Q., Chen, Y., and Xie, J. (2020). Research on post-earthquake Landslide Extraction Algorithm Based on Improved U-Net Model. Remote Sensing 12, 894. doi:10.3390/rs12050894
Mengistu, F., Suryabhagavan, K., Raghuvanshi, T. K., and Lewi, E. (2019). Landslide hazard Zonation and Slope Instability Assessment Using Optical and Insar Data: a Case Study from Gidole Town and its Surrounding Areas, Southern ethiopia. Remote Sensing of Land 3, 1–14. doi:10.21523/gcj1.19030101
Merghadi, A., Yunus, A. P., Dou, J., Whiteley, J., ThaiPham, B., Bui, D. T., et al. (2020). Machine Learning Methods for Landslide Susceptibility Studies: A Comparative Overview of Algorithm Performance. Earth-Science Rev. 207, 103225. doi:10.1016/j.earscirev.2020.103225
Nandi, A., and Shakoor, A. (2010). A Gis-Based Landslide Susceptibility Evaluation Using Bivariate and Multivariate Statistical Analyses. Eng. Geology. 110, 11–20. doi:10.1016/j.enggeo.2009.10.001
Nhu, V.-H., Mohammadi, A., Shahabi, H., Ahmad, B. B., Al-Ansari, N., Shirzadi, A., et al. (2020a). Landslide Susceptibility Mapping Using Machine Learning Algorithms and Remote Sensing Data in a Tropical Environment. Int. J. Environ. Res. Public Health 17, 4933. doi:10.3390/ijerph17144933
Nhu, V.-H., Shirzadi, A., Shahabi, H., Singh, S. K., Al-Ansari, N., Clague, J. J., et al. (2020b). Shallow Landslide Susceptibility Mapping: A Comparison between Logistic Model Tree, Logistic Regression, Naïve Bayes Tree, Artificial Neural Network, and Support Vector Machine Algorithms. Int. J. Environ. Res. Public Health 17, 2749. doi:10.3390/ijerph17082749
Nhu, V.-H., Zandi, D., Shahabi, H., Chapi, K., Shirzadi, A., Al-Ansari, N., et al. (2020c). Comparison of Support Vector Machine, Bayesian Logistic Regression, and Alternating Decision Tree Algorithms for Shallow Landslide Susceptibility Mapping along a Mountainous Road in the West of iran. Appl. Sci. 10, 5047. doi:10.3390/app10155047
Oh, H.-J., and Pradhan, B. (2011). Application of a Neuro-Fuzzy Model to Landslide-Susceptibility Mapping for Shallow Landslides in a Tropical Hilly Area. Comput. Geosciences 37, 1264–1276. doi:10.1016/j.cageo.2010.10.012
Pham, B. T., Pradhan, B., Bui, D. T., Prakash, I., and Dholakia, M. (2016). A Comparative Study of Different Machine Learning Methods for Landslide Susceptibility Assessment: A Case Study of Uttarakhand Area (india). Environ. Model. Softw. 84, 240–250. doi:10.1016/j.envsoft.2016.07.005
Pham, B. T., Prakash, I., Chen, W., Ly, H.-B., Ho, L. S., Omidvar, E., et al. (2019). A Novel Intelligence Approach of a Sequential Minimal Optimization-Based Support Vector Machine for Landslide Susceptibility Mapping. Sustainability 11, 6323. doi:10.3390/su11226323
Pham, V. D., Nguyen, Q.-H., Nguyen, H.-D., Pham, V.-M., Bui, Q.-T., et al. (2020). Convolutional Neural Network—Optimized Moth Flame Algorithm for Shallow Landslide Susceptible Analysis. IEEE Access 8, 32727–32736. doi:10.1109/access.2020.2973415
Pourghasemi, H., Moradi, H., and Aghda, S. F. (2013). Landslide Susceptibility Mapping by Binary Logistic Regression, Analytical Hierarchy Process, and Statistical index Models and Assessment of Their Performances. Nat. hazards 69, 749–779. doi:10.1007/s11069-013-0728-5
Qiang, X., and Xiu-Jun, D. (2011). Genetic Types of Large-Scale Landslides Induced by Wenchuan Earthquake. Earth Science-Journal China Univ. Geosciences 36, 1134–1142.
Saha, A., and Saha, S. (2020). Comparing the Efficiency of Weight of Evidence, Support Vector Machine and Their Ensemble Approaches in Landslide Susceptibility Modelling: A Study on Kurseong Region of Darjeeling Himalaya, india. Remote Sensing Appl. Soc. Environ. 19, 100323. doi:10.1016/j.rsase.2020.100323
Saha, S., Roy, J., Hembram, T. K., Pradhan, B., Dikshit, A., Abdul Maulud, K. N., et al. (2021). Comparison between Deep Learning and Tree-Based Machine Learning Approaches for Landslide Susceptibility Mapping. Water 13, 2664. doi:10.3390/w13192664
Sevgen, E., Kocaman, S., Nefeslioglu, H. A., and Gokceoglu, C. (2019). A Novel Performance Assessment Approach Using Photogrammetric Techniques for Landslide Susceptibility Mapping with Logistic Regression, Ann and Random forest. Sensors 19, 3940. doi:10.3390/s19183940
Shano, L., Raghuvanshi, T. K., and Meten, M. (2020). Landslide Susceptibility Evaluation and hazard Zonation Techniques–A Review. Geoenvironmental Disasters 7, 1–19. doi:10.1186/s40677-020-00152-0
Sun, D., Xu, J., Wen, H., and Wang, Y. (2020). An Optimized Random forest Model and its Generalization Ability in Landslide Susceptibility Mapping: Application in Two Areas of Three Gorges Reservoir, china. J. Earth Sci. 31, 1068–1086. doi:10.1007/s12583-020-1072-9
Szegedy, C., Liu, W., Jia, Y., Sermanet, P., Reed, S., Anguelov, D., et al. (2015). “Going Deeper with Convolutions,” in Proceedings of the IEEE conference on computer vision and pattern recognition, 1–9. doi:10.1109/cvpr.2015.7298594
Van Westen, C. J., Castellanos, E., and Kuriakose, S. L. (2008). Spatial Data for Landslide Susceptibility, hazard, and Vulnerability Assessment: An Overview. Eng. Geology. 102, 112–131. doi:10.1016/j.enggeo.2008.03.010
Vapnik, V. N. (1999). An Overview of Statistical Learning Theory. IEEE Trans. Neural networks 10, 988–999. doi:10.1109/72.788640
Wang, Y., Fang, Z., and Hong, H. (2019). Comparison of Convolutional Neural Networks for Landslide Susceptibility Mapping in Yanshan County, china. Sci. total Environ. 666, 975–993. doi:10.1016/j.scitotenv.2019.02.263
Wang, Y., Sun, D., Wen, H., Zhang, H., and Zhang, F. (2020). Comparison of Random forest Model and Frequency Ratio Model for Landslide Susceptibility Mapping (Lsm) in Yunyang County (Chongqing, china). Int. J. Environ. Res. Public Health 17, 4206. doi:10.3390/ijerph17124206
Wei, X., Zhang, L., Luo, J., and Liu, D. (2021). A Hybrid Framework Integrating Physical Model and Convolutional Neural Network for Regional Landslide Susceptibility Mapping. Nat. Hazards 109, 471–497. doi:10.1007/s11069-021-04844-0
Wu, X., Chen, X., Zhan, F. B., and Hong, S. (2015). Global Research Trends in Landslides during 1991–2014: a Bibliometric Analysis. Landslides 12, 1215–1226. doi:10.1007/s10346-015-0624-z
Xie, M., Ju, N., Zhao, J., Fan, Q., and He, C. (2021a). Comparative Analysis on Classification Methods of Geological Disaster Susceptibility Assessment. Geomatics Inf. Sci. Wuhan Univ. 46, 1003–1014.
Xie, W., Nie, W., Saffari, P., Robledo, L. F., Descote, P.-Y., and Jian, W. (2021b). Landslide hazard Assessment Based on Bayesian Optimization–Support Vector Machine in Nanping City, china. Nat. Hazards, 1–18.
Yi, Y., Zhang, Z., Zhang, W., Jia, H., and Zhang, J. (2020). Landslide Susceptibility Mapping Using Multiscale Sampling Strategy and Convolutional Neural Network: A Case Study in Jiuzhaigou Region. Catena 195, 104851. doi:10.1016/j.catena.2020.104851
Zhang, Y.-x., Lan, H.-x., Li, L.-p., Wu, Y.-m., Chen, J.-h., and Tian, N.-m. (2020). Optimizing the Frequency Ratio Method for Landslide Susceptibility Assessment: A Case Study of the Caiyuan basin in the Southeast Mountainous Area of china. J. Mountain Sci. 17, 340–357. doi:10.1007/s11629-019-5702-6
Keywords: convolutional neural network, landslide susceptibility, machine learning, GIS, Wenchuan County
Citation: Zhang S, Bai L, Li Y, Li W and Xie M (2022) Comparing Convolutional Neural Network and Machine Learning Models in Landslide Susceptibility Mapping: A Case Study in Wenchuan County. Front. Environ. Sci. 10:886841. doi: 10.3389/fenvs.2022.886841
Received: 01 March 2022; Accepted: 11 April 2022;
Published: 16 May 2022.
Edited by:
Jingren Zhou, Sichuan University, ChinaReviewed by:
Zhongping Yang, Chongqing University, ChinaYueqin Zhu, Ministry of Emergency Management, China
Copyright © 2022 Zhang, Bai, Li, Li and Xie. This is an open-access article distributed under the terms of the Creative Commons Attribution License (CC BY). The use, distribution or reproduction in other forums is permitted, provided the original author(s) and the copyright owner(s) are credited and that the original publication in this journal is cited, in accordance with accepted academic practice. No use, distribution or reproduction is permitted which does not comply with these terms.
*Correspondence: Lin Bai, YmFpbGluQGNkdXQuZWR1LmNu