 S. Orozco
 M. Rivero
 E. Montiel
 J. Espino Valencia
- 1Posgrado de Ingeniería Química, Universidad Michoacana de San Nicolás de Hidalgo, Edif V1, Ciudad Universitaria, Morelia, Mexico
- 2Instituto de Investigaciones en Materiales, Unidad Morelia, Universidad Nacional Autónoma de México, Morelia, Mexico
- 3Escuela de Estudios Superiores de Xalostoc, Universidad Autónoma del Estado de Morelos, Morelia, Mexico
Heterogeneous photocatalysis is a highly efficient process for degrading recalcitrant and emerging pollutants. Rhodamine B (RhB) is a nonbiodegradable and highly refractory compound persistent in conventional processes. In this work, we investigate the photocatalytic activity of gallium-based catalysts undoped (GO) and doped with Fe ions (GOFe). Catalysts were synthesized by simple precipitation assisted with an ultrasonic transducer and subjected to thermal treatment at different temperatures (500, 650, 800 and 950°C). They were characterized by thermogravimetric analysis (TGA), Fourier transform infrared (ATR-FTIR) spectroscopy, and X-ray diffraction (XRD). Catalysts were tested in the discoloration of Rhodamine B dye. Experiments were carried out at different pH values (3.00, 5.00 and 9.00) in the presence of H2O2 and using Visible and Visible-UV light sources as study variables. Better discoloration results were observed for GO and GOFe under acid environments (pH = 3.00) for both light sources. GO and GOFe photocatalyst showed high effectiveness in the discoloration of RhB completing the process in 300 min, under a Visible-UV lamp at pH = 3.00. Incorporating Fe ions into the gallium oxides matrix decreases its bandgap, allowing it to activate under visible light. The discoloration process exhibited pseudo-zero-order apparent kinetics.
1 Introduction
In recent years, gallium oxides have gained increasing attention due to their electrical, thermal, optical, chemical, and catalytic properties (Manandhar et al., 2019), as well as due to their importance in mature and emerging technologies (Pearton et al., 2019). Gallium oxides are obtained after oxyhydroxides are subjected to a thermal process (Kumar et al., 2015; Suman et al., 2021). Thus, thermal treatment at an optimal temperature becomes a key parameter for the nanostructure to improve its surface smoothness and crystallization (Suman et al., 2021). Ga2O3 has six polymorphs structures: α (rhombohedral), β (monoclinic), γ (cubic defective spinel), δ (body-centred cubic), ϵ (pseudo-hexagonal) and κ (orthorhombic) (Nikolaev et al., 2019; Tak et al., 2021; Sprincean et al., 2021). Among these structures, the α-Ga2O3 phase is obtained after the oxyhydroxides are subjected at temperatures around 395°C, while the β-Ga2O3 phase is obtained at 758°C. β-Ga2O3 is the most thermodynamically stable phase, and it possesses excellent chemical stability. The order of the phase formation energies is: β
Different methods for synthesizing gallium oxyhydroxides, GaO(OH) nanostructures, have been reported. These methods include sol-gel (Cheah et al., 2020), hydrothermal (Quan et al., 2010; Suman et al., 2021), precipitation (Parveen et al., 2018), coprecipitation (Venediktova et al., 2017), thermal and microwave plasma chemical vapor (Zhu et al., 2006; Stijepovic et al., 2015; Rex et al., 2019), microwaves (Deshmane et al., 2010; Yuwen et al., 2020), ultrasonic (Parveen et al., 2018). Analogously, other precursors have been reported, such as nitrates (Quan et al., 2010; Shan et al., 2017; Das et al., 2019; Suman et al., 2021), chlorides (Suman et al., 2021) and organic compounds (Stijepovic et al., 2015; Suman et al., 2021) of gallium and, recently, gallium and gallium based liquid metals (Kumar et al., 2015; Shan et al., 2017). Gallium oxide is a semiconductor material with wide bandgap energy (
The optical properties of materials for optoelectronic and photocatalytic applications can be improved by doping those materials. Gallium oxides have been doped with N, S, In, Tl, Se, Sn, Cr, Cu, Ti, Mn, Mo, Ni, Zn, Pb and W. These metals promote changes in their optical absorption and band gap, enhancing their photocatalytic activity (Choi and Son, 2017; Venediktova et al., 2017; Manandhar et al., 2019; Yuwen et al., 2020; Roy and Ramana, 2021). Du et al. (2021) investigated the site replacement of Ga atoms by Zn atoms. They obtained that Zn improved the separation of photogenerated carriers, enhancing the photocatalytic performance. Ga2O3 doped with transition cations, such as Co2+, Mn2+ and Fe2+, has also attracted attention due to their unusual magnetic and catalytic properties (Venediktova et al., 2017). Furthermore, the presence of these cations (Co2+, Mn2+ and Fe2+) in the matrix of Ga2O3 intrude impurity states resulting in a decrease in the band gap of Ga2O3 (Li et al., 2018; Wang et al., 2018), allowing to activate them under visible light. The study of electrical and magnetic properties of gallium oxides doped with Co2+, Mn2+ and Fe2+ has been reported in the literature (Li et al., 2018; Wang et al., 2018; Roy and Ramana, 2021). However, there are a limited number of publications addressing the photocatalytic properties of these materials, which is the main aim of this work.
This work reports the photocatalytic activity of gallium and Fe-doped gallium oxides by the discoloration process of a model dye (Rhodamine B) under three different pH of reaction (3.00, 5.00 and 9.00) and two light sources (visible and UV-visible light) using Fe-doped and undoped gallium oxides as catalysts, being this latter the reference case. The properties of the catalysts were determined by thermogravimetric analysis (TGA), Fourier transform infrared (ATR-FTIR) spectroscopy and X-ray diffraction.
2 Materials and Methods
2.1 Materials
Gallium based catalysts were synthesized from procured highly pure precursor materials, gallium nitrate (Ga(NO3)3, 99.9% purity, Aldrich), hydroxide ammonium (NH4OH, 26–30%) and nitrate ferric (Fe(NO3)3, 99.9%). Rhodamine B (C28H31ClN2O3, 99.9%) was used as the pollutant model. pH adjustment was done with nitric acid (HNO3, 60, −,66% conc.) and sodium hydroxide (NaOH, 98%). All chemicals were purchased from Merk as A.C.S reagent grade, and used as received without further purification.
2.2 Synthesis Methods
Gallium oxides (GO) and Fe ion-doped gallium oxides (GOFe) were synthesized following the same methodology. GO and GOFe were synthesized by simple precipitation of a gallium nitrate aqueous solution 0.1 M with NH4OH at pH = 10, coupled with an ultrasonic transducer (Shan et al., 2017; Parveen et al., 2018). For GOFe, an aqueous solution of ferric nitrate (6 mM) was prepared by slowly adding it to a gallium nitrate solution (0.1 M) under constant stirring. Subsequently, the NH4OH solution (10% in vol.) was added dropwise and kept under constant stirring until a pH of 10 was reached. The Ga:Fe mass ratio was 95 : 05. Then, this suspension was subjected to an ultrasonic process, using an ultrasonic transducer (SONICS Vibra Cell 750), at 450 W for 30 min. Synthesized GO and GOFe photocatalysts undergone an aging process for 24 h. Then, GO and GOFe photocatalysts were dried in an oven at 50°C overnight. To investigate the effect of heat treatment on the catalyst phase formation, the above GO samples were treatment at 500, 650, 800 and 950°C for 3 h at the corresponding temperature in TERLAB muffle (25–1,100°C ± 1°C) in an oxygen atmosphere. The samples were labeled as GO 500, GO 650, GO 800 and GO 950. In turn, the GOFe was only treated at 950°C for 3 h.
2.3 Characterization
The materials were characterized by thermogravimetric analysis (TGA), Fourier transform infrared (ATR-FTIR) spectroscopy, and X-ray diffraction (XRD). The samples were characterized using an X-ray diffractometer with a Bruker D2-Phaser diffractometer using CuKα radiation at 30 kV and 10 mA. Difractograms were scanned at 2θ angles from 10 to 80° with 0.5 s per step and increments of 0.010 0806 (1.21 /min). XRD allowed analyzing the crystalline structure of the catalysts.
The functional groups present on the catalysts were obtained by attenuated total reflectance Fourier transform infrared (ATR-FTIR) Spectroscopy. ATR-FTIR spectra were collected using a Thermo Scientific Nicolet iS10 FTIR spectrometer fitted with a Thermo Scientific Smart iTRTM ATR accessory with a diamond crystal. The OMNIC software collected data. Powder samples were added directly onto the crystal for analysis at room temperature without applying pressure. Sixteen spectra were obtained and coadded for each sample covering a range of 4,000–650 cm−1 at a spectral resolution of 4 cm−1. A background spectrum was obtained by collecting a similar number of scans following the cleaning of the diamond crystal with acetone.
Thermogravimetric analysis were obtained using a Perkin Elmer themal analizer Model STA 6000, using oxygen gas at 30 cm3 min−1, 20 mg of material and heating from 25 to 850°C at 10°C min−1.
2.4 Analytic Methods
Discoloration process of RhB was evaluated from its characteristic absorption peak at λchar = 0.556 μm. Absorption spectra of the samples in the wavelength range 0.2–0.7 μm were measured with a Evolution 300 Thermo Scientific Spectrophotometer, using a spectral interval of 0.001 μm pH measurements were conducted with a HANNA pH meter, calibrated with standard buffers solutions of 3.01 and 7.01 ± 0.02 (25°C).
2.5 Experimental Procedure
The photocatalytic activity of GO and GOFe materials was studied by RhB discoloration. Experiments were carried out in a photoreactor with hydrodynamic batch operation and constant stirring to maintain the catalyst in suspension, see Figure 1A. 13 W commercial lamps illuminated the reaction space. Two different lamps, whose emissions span the Visible and UV-Visible region of the spectrum (see Figure 1B), were tested as illumination sources. The emission spectrum of the Visible lamp ranges from λ = 0.4–0.7 µm. It is worth observing that UV-Visible lamp emission is in the UVB and UVA regions (0.3–0.4 µm) as well as in the visible region (0.55–0.61 µm).
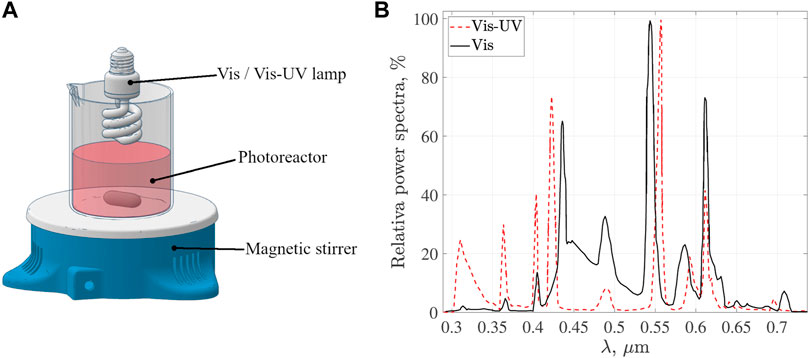
FIGURE 1. (A) Experimental setup of the photoreactor and (B) relative power spectra of Visible-UV and Visible lamps.
The efficiency of heterogeneous photocatalysis relies on several factors such as catalyst and pollutant concentrations, the presence or not of an oxidizing agent, pH, among others (Hidaka and Tsukamoto, 2019). For this reason, it is necessary to investigate the effect of those parameters on the photocatalytic process. The experimental development consisted of two stages. In the first stage (Section 3.2.1), several experiments were carried out to determine the experimental conditions. These experiments were performed using GO and varying the concentration of catalyst (0.25, 0.5 and 1 g L−1), RhB (0.022 and 0.045 mM) and oxidizing agent (7 and 48 mM). Once the experimental conditions are defined, in the second stage (Section 3.2.2), it is investigated the influence of Fe ion presence on the catalyst matrix, pH and light source on the discoloration process of RhB. In both stages, the experimental procedure is as follows. The synthetic colored solution was prepared by dissolving 0.0043 or 0.0087 g of RhB in 0.4 L of deionized water. The initial pH of the solution was adjusted to 3.00, 5.00 or 9.00 through a nitric acid solution (5% vol.) or sodium hydroxide (5% weight). At this time (t = t0), the first sample was taken. The amount of GO or GOFe, at initial concentration of 0.25, 0.5 or 1 g L−1, was added into the synthetic colored solution. The reacting mixture was kept in agitation under dark conditions for 30 min to homogenize it and to reach the adsorption equilibrium. At this time, a second sample was taken, and H2O2 (7 or 48 mM) was added to the corresponding solution, the lamp was turned on, and the photocatalytic reaction started. The solution was kept under constant stirring for the whole duration of the photocatalytic process and samples were taken at 10, 20, 30, 60, 120, 180, 240 and 300 min. For the analysis of the RhB dye samples, catalysts particles were separated by centrifugation at 7,500 rpm by 15 min.
3 Results
3.1 Characterization
3.1.1 Thermogravimetric Analysis
TGA analysis of gallium-based materials was carried out under an oxygen atmosphere during the whole characterization, from ambient temperature up to 850°C. Using oxygen allowed us to identify the phase transformation to its oxidation state and determine the thermal treatment conditions of samples. Figure 2A shows the weight percentage loss and weight derivative as a function of the sample temperature for GO and GOFe. From the weight loss, it is possible to distinguish three temperature ranges: 1) a
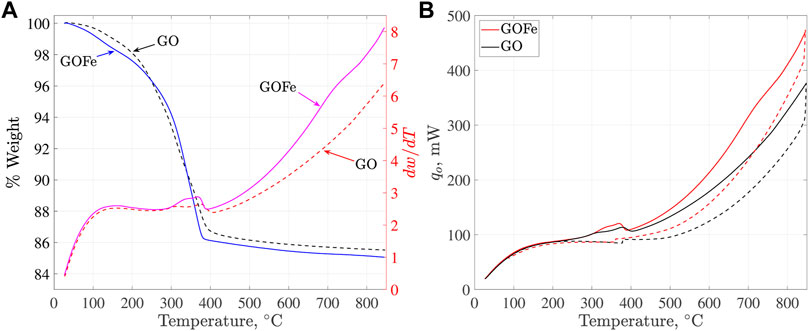
FIGURE 2. (A) Weight loss and weight derivative as a function of the sample temperature. (B) Heat flow as a function of the sample temperature for the whole heating (solid) - cooling (dashed) cycle.
From the heat flow plots for GO and GOFe, Figure 2B, it is possible to distinguish two endothermic peaks at 315 and 375°C, respectively. These peaks can be attributed to the transformation of GaO(OH) into α-Ga2O3 (Reddy et al., 2015; Shan et al., 2017; Yuwen et al., 2020). In addition, a less pronounced endothermic peak around 730°C can be observed. This peak is related to the phase transformation from α-Ga2O3 to β-Ga2O3, being more pronounced for GOFe material (Reddy et al., 2015; Shan et al., 2017; Yuwen et al., 2020).
3.1.2 X-Ray Diffraction
XRD patterns for all GO materials are shown in Figure 3A. The diffraction peaks in the XRD pattern of GOH can be indexed to GaOOH according to JCPDS 06-0180, which has a crystallized orthorhombic structure (Reddy et al., 2015; Huang et al., 2017; Sharma et al., 2020). In this case, the representative peaks to crystalline planes are (110), (130), (111) and (240) at diffraction angles, 2θ = 21.50, 33.78, 37.29 and 54.02°, respectively. In turn, the XRD patterns for GO materials show the formation of α and β phases, depending on the heat treatment. The samples GO 500°C and GO 650°C exhibit the same peaks, which correspond to the rhombohedral structure of the α phase (Huang et al., 2017; Sharma et al., 2020). The representative peaks of the α phase are 2θ = 33.90 and 36.16° for (104) and (110) crystalline planes. From these two patterns, it can be observed that increasing the temperature treatment favors the crystallization process of the sample, leading to more defined signals corresponding to the α phase according to JCPDS 158 06-0503. GO 800°C and GO 950°C samples have higher order diffraction lattice planes, which implies a more crystalline material than can be readily indexed to the monoclinic structure of β-Ga2O3 phase according to JCPDS 76-0573 (Quan et al., 2010; Guo et al., 2017; Cheah et al., 2020; Sharma et al., 2020). The representative peaks corresponding to the crystalline planes are (401), (002), (111) and (512) at diffraction angles 2θ = 30.47, 31.87, 35.43 and 64.74, respectively. These results are consistent with the thermogravimetric analysis, where phase transformations are observed. The β-Ga2O3 has been reported to be the more stable phase among the different gallium oxides phases (Stepanov et al., 2016; Tak et al., 2021). According to previous results, in this work GO was treated thermally at 950°C and was used as photocatalyst.
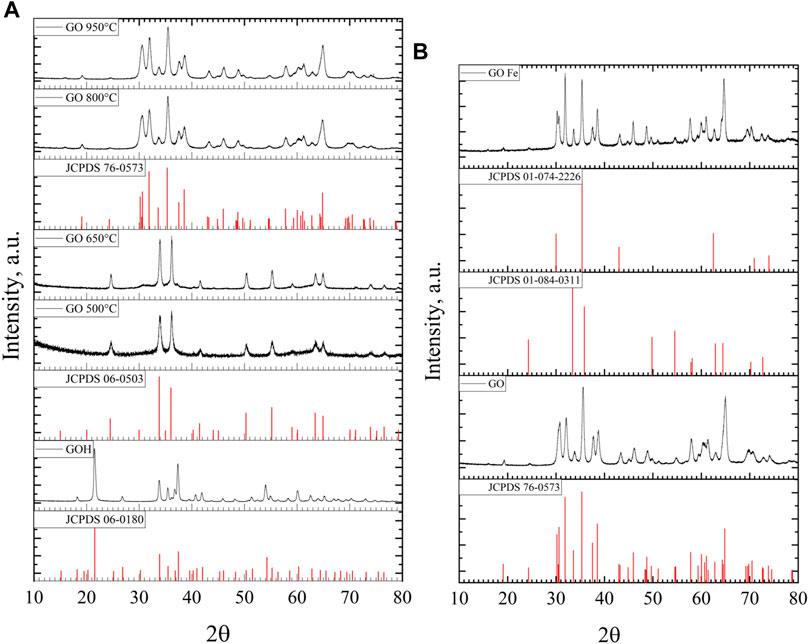
FIGURE 3. XRD patterns of (A) GOH at 50°C and GO at 500, 650, 800 and 950°C, and (B) of gallium oxide, GO and gallium oxide doped with Fe, GOFe treated at 950°C.
XRD patterns of Go and GOFe ion-doped gallium oxides are presented in Figure 3B, where for the sake of comparison the β-Ga2O3 pattern (GO 950°C or simply GO) is also included. The XRD pattern of GOFe has representative peaks of iron gallium oxide (Fe2.1Ga0.9O4) for the cubic structure (JCPDS 01-074-2226) and iron oxide (Fe2O3) for rhombohedral structure (JCPDS 01-084-0311). These peaks overlap with those of the gallium oxides (GO). However, the height of peaks indicates the presence of iron gallium oxide and iron oxides. The peak at 2θ = 30.23° corresponds to the crystalline plane (220) for iron gallium oxide material. For iron oxides, the peak at 2θ = 62.4°, crystalline plane (214) is observed.
3.1.3 FT-IR Spectroscopy
The FT-IR spectra for the gallium-based materials synthesized at pH of 10: GOH, GO heat treatment at 500, 650, 800 and 950°C, as well as GOFe (which is synthesizing at 950°C) are presented in Figure 4. For GOH, the broad band at 2,960 and 3,210 cm−1 can be attributed to the stretching vibration of H–O–H band and O–H stretching of GaO(OH). The band at 1,980 cm−1, as well as the bands at 1,020 cm−1 and 942.1 cm−1, can be assigned to constitutional Ga–OH bending bands and their overtones, respectively. The stretching vibration bond of the O–H group is also observed around 1,360 cm−1 owing to the absorption of water molecules (Quan et al., 2010). In turn, the FT-IR spectra of remaining materials, GO treated at 500–950°C and GOFe at 950°C, reveal a broad H–O–H stretching band at around 3,395 cm−1. In addition, heat treated GO and GOFe materials show a band at 600–700 cm−1, which is assigned to the valence vibrations of Ga–O in the lattice formed by GaO6 octahedra and GaO4 tetrahedra, corresponding to corundum and monoclinic structures of α and β crystalline phases, respectively. These results are consistent with those reported by Quan et al. (2010) and Girija et al. (2013). In FT-IR spectra for GOFe, species associated with Fe ions are not identified.
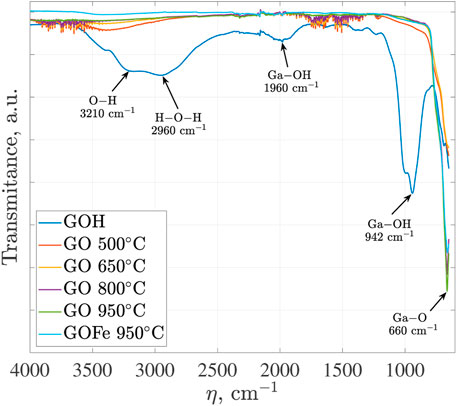
FIGURE 4. FT-IR spectra of GaO(OH), GO at 500, 650, 800 and 950°C, and GOFe at 950°C.
3.2 Experimental Results
3.2.1 Experimental Conditions
Evaluating the photocatalytic activity of synthesized materials requires determining the experimental conditions for pH, and the concentrations of catalyst, pollutant, and oxidizing agent. This was achieved by carrying out several experiments using GO as the catalyst at a pH = 3.00 under UV-Visible light. It is noteworthy to mention that the fast rates of electron-hole recombination exhibited by Ga2O3 require an oxidizing agent (Sun et al., 2013), which in this case is H2O2. In the photocatalytic process, hydroperoxyl ions are reduced by the electrons in the conduction band, yielding hydroperoxyl radicals, which can react with RhB molecules and carries out the discoloration process (Hidaka and Tsukamoto, 2019). Therefore, it is important to ensure that the concentration of H2O2 does not mask the photocatalytic activity of the interest materials. This is shown in Figure 5A. Photolysis of RhB dye, at C0 = 0.022 mM, was verified by running an experiment without catalyst in the presence of 7 and 48 mM of H2O2 and under Visible-UV. Results show that about 9% of discoloration is obtained for 7 mM after 300 min of reaction. When 48 mM of H2O2 is used, a complete discoloration of RhB dye is observed during the first 150 min. This can be attributed to reactions with the hydroperoxyl radicals (HO2−), the radical which are formed by the interaction of UV radiation with the oxidizing agent. In addition, it is important to consider the adsorption/desorption process, which is crucial to carry out the pollutant degradation by photocatalysis. The adsorption/desorption process of RhB dye molecules on GO catalyst was analyzed to determine the time in which the adsorption equilibrium is reached. This experiment was performed under dark conditions at C0 = 0.022 mM of RhB, a pH = 3.00 and in absence of H2O2. It can be observed that adsorption equilibrium is reached within the first 30 min of the contact between GO catalyst and RhB dye. After this time, changes in RhB concentration are not significant. Similar results (30 min) have been reported by several authors when working with Ga2O3 catalysts (Sun et al., 2013; Reddy et al., 2015; Magdalane et al., 2017; Du et al., 2021).
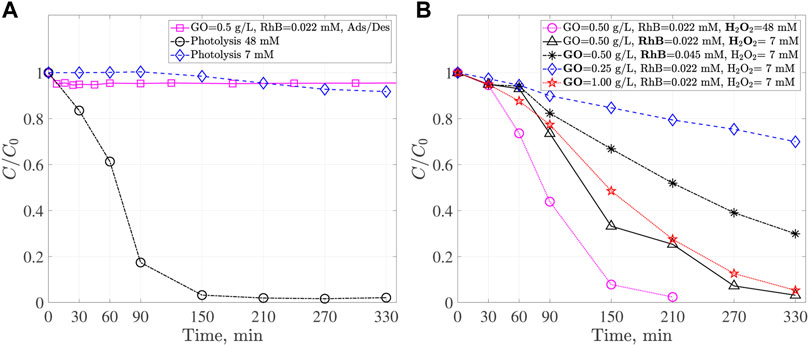
FIGURE 5. (A) Photolysis at C0 = 0.022 mM of RhB, 7 and 48 mM of H2O2, adsorption/desorption dark process at C0 = 0.022 mM of RhB and 0.5 g L−1 GO. (B) Discoloration profiles of RhB at C0 = 0.022 and 0.045 mM of RhB, 7 and 48 mM of H2O2, 0.25, 0.5 and 1 g L−1 GO.
The individual effect of concentration of H2O2, RhB, and GO catalyst on the discoloration process under UV-Visible light can be observed in Figure 5B. Increasing the oxidizing agent concentration while keeping other parameters constant leads to a faster discoloration process. Nevertheless, this decrease in the discoloration time can be attributed mainly to the presence of H2O2 and not to the GO photocatalytic activity. Using the oxidizing agent aims to slow down the recombination process of the photogenerated charges and not contribute to the discoloration process. A H2O2 concentration of 7 mM, 2:1 catalyst to oxidizing agent ratio, has been used, as reported by (Palanivel et al., 2021). In turn, increasing RhB concentration from 0.022 to 0.045 mM leads to a longer discoloration time. To keep discoloration time in 300 min as the reference, RhB concentration is fixed to 0.022 mM, which is similar to that reported in other works (Reddy et al., 2015; Das et al., 2019; Du et al., 2021). Finally, three GO catalyst concentrations have been investigated. The higher the catalyst concentration, the faster the discoloration process. Note that in this case, there is no linear decrease in discoloration time with catalyst concentration, which indicates that high catalyst concentrations inhibit light transmission through the heterogeneous dispersion (Hidaka and Tsukamoto, 2019). It has been reported Ga2O3 concentrations ranging from 0.5 g L−1 (Sun et al., 2013) to 1 g L−1 (Reddy et al., 2015; Das et al., 2019; Du et al., 2021). Therefore, according to the results obtained in this section, the catalyst concentration used to continue the experiments was 0.5 g L−1.
3.2.2 Photocatalytic Activity of GO and GOFe
The photocatalytic activity of GO and GOFe catalysts, using RhB dye as a model pollutant, was tested under three different pH values and two light sources. Results reported in this section corresponds to GO and GOFe synthesized via precipitation with NH4OH, at pH = 10.00, drying temperature at 50°C and heat treatment at 950°C. A three factor
Solutions of RhB dye were prepared at an initial concentration of 0.022 mM. The discoloration of the RhB dye was followed by measuring the evolution of the absorbance peak of the solution in the visible region (chromophore group). RhB dye concentration is proportional to the measured absorbance caused by the chromophore group of the molecule. The chromophore group containing the structure amino (NH) absorbs in the visible region (λchar = 0.556 μm for a pH = 3.00 and at λchar = 0.554 μm for pH = 6.00, 7.00 and 9.00), while the aromatic rings absorb in the UV region. The chromophore group shift is attributed to the charge separation of the carboxylic anion (R−) and proton (H+), which accepts the same resonant structures. Therefore, it exhibits a similar absorption spectrum with a shift in the chromophore group. Figure 6 shows the temporal evolution of the dye absorption spectra at concentrations of 0.022 mM of RhB, 7 mM of H2O2, 0.5 g L−1 of GOFe catalyst and a pH = 9.00, under Visible-UV light. In this figure, the disappearance of the chromophore group can be observed as the photocatalytic reaction proceeds.
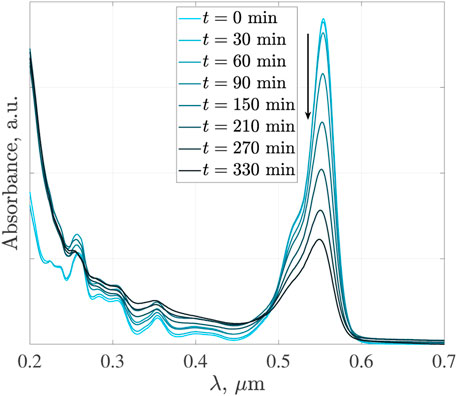
FIGURE 6. Absorption spectra for the RhB discoloration with GOFe under Visible-UV light. pH = 9.00, 0.022 mM of RhB, 7 mM of H2O2 and 0.5 g L−1 of GOFe.
The discoloration profiles of the RhB under Visible-UV and Visible light, using GO as photo catalyst, are presented in Figure 7A. Photolysis of RhB dye was verified by running an experiment without catalyst, in presence of 7 mM of H2O2 and under Visible illumination. RhB discoloration by photolysis was not observed under visible light. These later results complement those presented in Figure 5A.
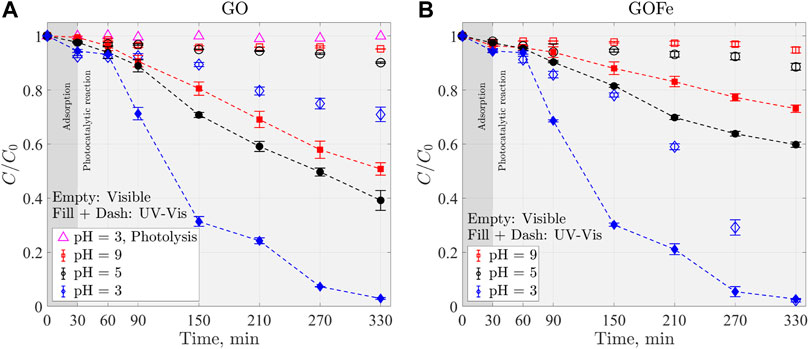
FIGURE 7. Discoloration profiles of RhB under Visible (empty markers) and Visible-UV (filled markers and dashed line) light at three pH values using (A) GO and (B) GOFe as catalysts. C0 = 0.022 mM of RhB, 0.5 g L−1 GO or GOFe catalyst and 7 mM of H2O2.
The discoloration process was performed in two stages: adsorption (the first 30 min) followed by the photocatalytic reaction during the next 300 min. In Figure 7 these processes are indicated by a different background color. In Figure 7A, it can be observed that acid conditions favor the adsorption process. At a pH = 3.00 more than 5% of the dye adsorbs, while at pH = 5.00 and pH = 9.00 the amount of adsorbed RhB molecules is lower. This behavior can be explained by the interactions of the catalyst’s surface charge and ionization of RhB. It has been reported that the isoelectric point for G2O3 is given at pH = 9.00 (Kosmulski, 2001). Therefore, below this pH value, the surface of GO is charged positively, favoring the attraction of the carboxylic anion (R−) of the RhB dye. The adsorption process influences discoloration since a larger amount of RhB dye molecules adsorbed on the catalyst’s surface, increasing the discoloration rate of the RhB dye. Discoloration process is reached after 300 min with a pH = 3.00 under Visible-UV light for GO, Figure 7A. In contrast, at pH = 5.00 and 9.00, about 40 and 50% of color remain, respectively, for the same period. Under visible light, 33% of discoloration was obtained with a pH = 3.00 after 300 min of reaction but no significant discoloration was observed for pH = 5.00 and 9.00. In literature it has been reported a 90% discoloration after 180 min of reaction using β-Ga2 O 3 nanoblocks and nanospindles Girija et al. (2013). Nevertheless, they used a 150 W Xenon lamp, in contrast to the results presented in this work in which about 80% of discoloration is observed but under a 13 W (
Now we turn our attention to the discoloration process when GOFe is used as the photocatalyst, shown in Figure 7B under Visible-UV and Visible light sources. Experimental conditions are the same as in previous section (for GO) except for the catalyst which is GOFe. Note that now the discoloration process is completed after 300 min of reaction at a pH = 3.00 with either light source. Results comparable to those obtained for GO (see Figure 7A) were observed. It is noteworthy to mention that the discoloration process is achieved with Ga2O3 catalyst doped with iron ions under Visible illumination conditions. This suggests that the incorporation of iron ions promotes a shift of the catalyst absorption band towards lower values (Li et al., 2018; Wang et al., 2018). Additionally, for those cases in which a complete discoloration is obtained, two behaviors are distinguished: (1) a slow discoloration rate in the first instances followed by (2) a faster discoloration process. This behavior can be attributed to the surface reactions between the charge pair (e−-h+) generated in the catalyst and its reaction with H2O2 and RhB dye.
The statistical analysis has been performed by a two-way ANOVA with interaction considering pH (3.00, 5.00, and 9.00), catalyst (GO and GOFe) and light source (Vis and Vis-UV) as independent variables, and dye (RhB) concentration as the dependent variable at all reported experiment instants (t = 30, 60, 90, 150, 210, 270, and 330 min). The F-statistic and p-values are presented in Table 1. The significance level is set at 0.05. In this Table, all those cases in which p ≤ 0.05 are indicated in bold font. It was found a statistically-significant difference in dye concentration by pH levels through all photocatalytic process. At the first instances of the process (t = 30 and 60 min) only pH exhibited a significant difference. Light source and the interactions between the three factors (Catalyst*pH, Catalyst*Light and pH*Light) are significant t = 90–210 min, where 50% of the discoloration occurs. At the latter times (t = 270 and 330 min) pH and light source are significant. These results are consistent with observations on the discoloration profiles. Moreover, a Scheffe post-hoc analysis revealed that pH = 3.00 and pH = 9.00 showed a significant difference, but pH = 3.00 and pH = 5.00 and pH = 5.00 and pH = 9.00 did not.
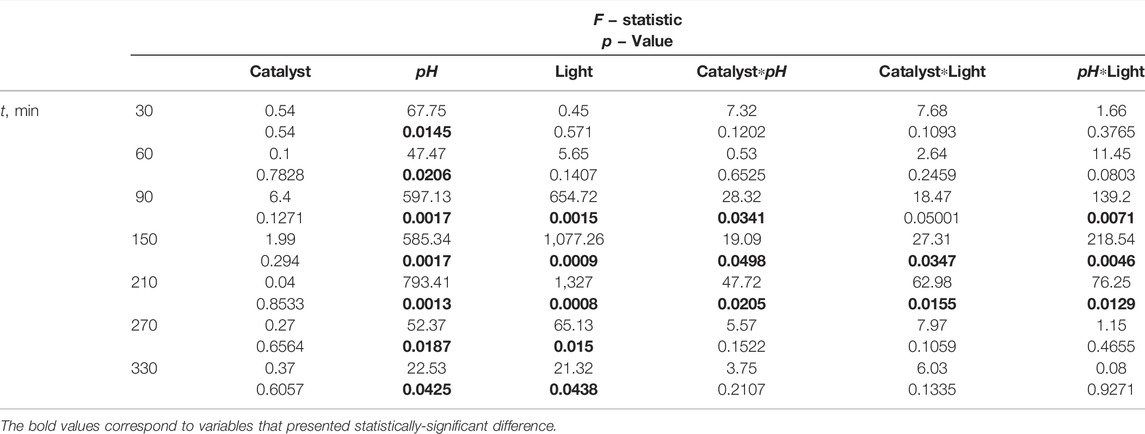
TABLE 1. F − Statistic and p − values for the independent variables and 2-way interactions for all sampling times. Significance level: 0.05.
Figure 8 presents the two-way interactions at those sampling times where these effects are significant (t = 90, 150 and 210 min). All interactions are ordinal. Although lines cross in Catalysts*pH and Catalyst*Light interactions, their slopes have the same sign. Catalysts*pH and pH*Light interaction plots confirm that acid conditions favor the discoloration process (steeper slopes), while no strong interaction for pH = 9.00 and 5.00 suggest their weak influence. A synergistic effect is observed in pH*Light plots, from which a pH = 3.00 under Vis-UV illumination enhances the discoloration rate. Statistical analysis corroborates the results described above.
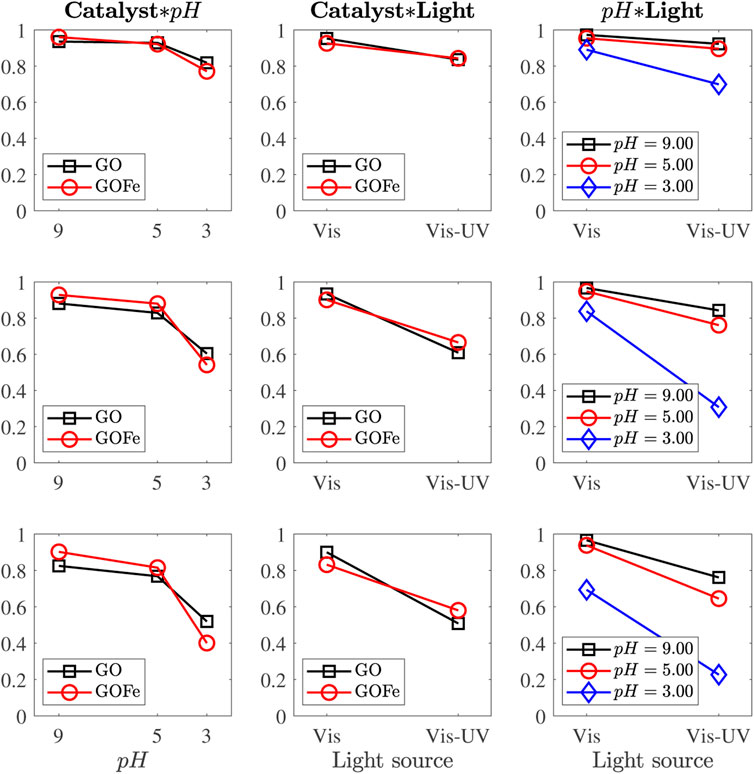
FIGURE 8. Means plots for the significant two-way interactions, at t = 90, 150 and 210 min (rows from top to bottom).
3.2.3 Kinetic Model
The rate of disappearance of the RhB dye is given by the temporal decay of RhB dye concentration. It is assumed that the reaction velocity depends only on the elapsed time, or it has a linear dependence on the RhB dye concentration. The equation that describes the variation of RhB dye concentration C as a function of time for a pseudo-zero-order model is given by Eq 1.
and for a pseudo-first-order model by Eq 2
Where the kinetic constants k0 and k1 are determined experimentally. These equations can be solved by specifying the initial concentration of the RhB solution C0 at the time t0. Eqs. 3 and 4 give the solutions for the concentration of the irradiated RhB solution, namely
With k0 and k1 the pseudo-zero-order and first-order kinetic constants, respectively.
Table 2 shows the values of the kinetic constants of pseudo-zero-order and pseudo-first-order, k0 and k1, obtained by fitting the experimental data (Figure 7) to the corresponding model. Constants and coefficients of determination R2 are provided for explored pH and illumination conditions. Those cases with at least 30% discoloration are indicated. Note that, according to the R2 value, discoloration follows to a pseudo zero-order kinetic model for GO photocatalyst while GOFe materials follow pseudo zero-order or first-order kinetics, depending on the experimental conditions. The kinetic parameter k0 for GO and GOFe catalysts under Visible-UV light and at pH = 3.00 indicates that the presence of iron ions does not influence on the discoloration rate. This can be attributed to the lamp’s emission spectrum, which includes the UV region, and thus a higher energy is available to activate both photocatalysts. However, under visible illumination conditions, a different behavior is observed at the same pH. In this case, the presence of Fe ions in GOFe significantly influences the discoloration process. These results are in good agreement with reported values. For example, for GO at pH = 3.00 under UV visible light k1 = (0.01448 ± 0.00034)min−1 which is bigger than 0.0096min−1 reported by Zhang et al. (2020) for Ga2O3 nanowire arrays. In turn, for GOFe we report k1 = (0.01537 ± 0.00084)min−1 which agrees to the value of 0.0142 min−1 reported by Zhang et al. (2020), but in this case the catalyst was GaN@Ga2O3 nanowires arrays. Finally, for Zn-doped Ga2O3 nanofibers (5% in weight) it has been found a kinetic parameter k1 = 0.058min−1 (Das et al., 2019), higher that those reported in this work. Nevertheless their results where obtained with a high-energy photon lamp and with higher power (UVC, 254.6 nm), while in this work low power and high-energy photon lamp have been used.
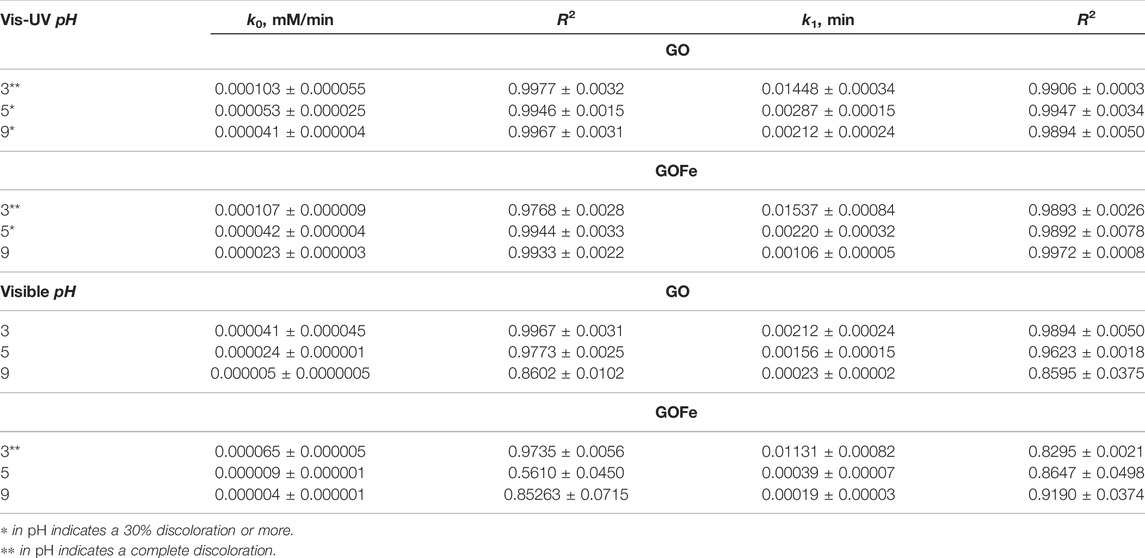
TABLE 2. Kinetic parameters, k0 and k1, obtained with GO and GOFe catalysts.
3.2.4 Reusability of the GO and GOFe
Practical applications of catalysts require materials to be stable under illumination and reuse (cycling) (Sun et al., 2013; Magdalane et al., 2017; Nguyen et al., 2022). Figure 9A presents the discoloration process of RhB dye under Visible-UV illumination for GO. The stability study was performed for three cycles with a reaction time of 300 min each. The experiments were carried out at pH = 3.00, 0.5 g L−1 of catalyst concentration and 7 mM of H2O2. Section 2.5 details the procedure for each experiment. At the end of the photocatalytic reaction, the photocatalyst was recovered, dried at room temperature, and used for the next experiment cycle. This procedure was repeated for each cycle.
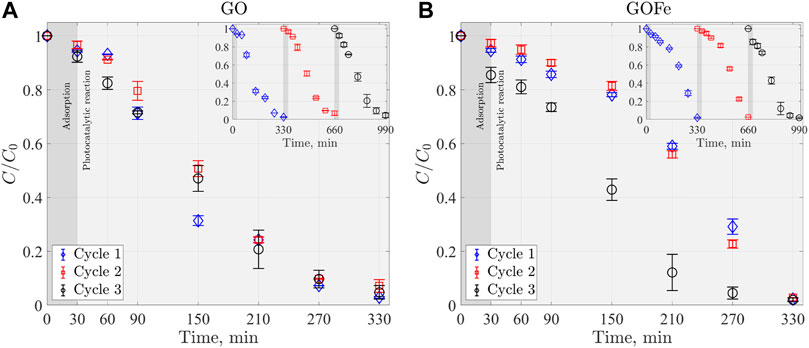
FIGURE 9. Stability of (A) GO and (B) GOFe catalysts, in three cycles (300 min each) of the discoloration at experimental conditions of RhB = 0.022 mM, GO or GOFe = 0.5 g L−1 and H2O2 = 7 mM, under Visible-UV illumination.
The differences in the process can be retrieved from the discoloration rate constants obtained from fitting models, which for this case is done with a pseudo zero-order kinetic model (Eq 3). According to the results, the discoloration rate constants k0 for cycles one, two and three were 0.0001035 ± 0.0000055 mM/min (R2 = 0.9775 ± 0.0032), 0.0000925 ± 0.0000045 mM/min (R2 = 0.9956 ± 0.0017), and 0.000096 ± 0.000005 mM/min (R2 = 0.9914 ± 0.0014) respectively. These results indicate that GO catalyst retains its photocatalytic performance even after third cycle, which is consistent with other studies (Das et al., 2019).
An analog procedure can be done for the discoloration process of RhB using GOFe, presented in Figure 9B. Results demonstrate that the kinetic constants k0 for the discoloration rate of cycles one and two are similar, namely, 0.0000655 ± 0.0000055 mM/min (R2 = 0.9735 ± 0.0056) and 0.0000645 ± 0.0000065 mM/min (R2 = 0.9496 ± 0.0053), respectively. In turn, for cycle three this constant is 0.000125 ± 0.000012 mM/min (R2 = 0.9887 ± 0.0056), which represents a two-fold increase of the discoloration rate. This increase can be attributed to a change in the surface charge of the iron-doped gallium oxides, that promotes a bigger number of RhB dye molecules to be absorbed.
4 Conclusion
In this work GO and GOFe photocatalysts were synthesized. The synthesis aims to evaluate the effect of heat treatment on the material structure. Three structures were identified: GOH, α-Ga2O3 (treatment at 500 and 600°C) and β-Ga2O3 (treatment at 800 and 950°C). Since this latter structure has been reported to be the more stable phase of Ga2O3, GO at 950°C methodology was selected to synthesize GO and GOFe catalysts. Characterization was done by TGA, XRD and FT-IR techniques. GO and GOFe catalysts were applied and evaluated in the discoloration of RhB.
Experimental results suggest that the incorporation of Fe ions in GO diminishes the energy bandgap of the material, allowing it to be activated under visible illumination conditions. Complete discoloration is achieved with GO and GOFe photocatalysts, under Visible-UV illumination conditions at pH = 3.00, while at pH = 5.00 and pH = 9.00, the catalytic activity is low and their effects were not significant. The discoloration process with the GO and GOFe catalysts under Visible-UV and Visible illumination follows a pseudo-zero-order or pseudo-first-order model kinetic model, depending on the conditions, with coefficients of determination close to unity. Under visible illumination conditions, the discoloration process showed two steps carried out at different rates. Moreover, for the GOFe catalyst complete discoloration is achieved, while for GO only 30% discoloration was reached after 300 min of reaction. Furthermore, GO and GOFe showed photocatalytic activity after three cycles of 300 min each. The discoloration rate for GO decreases by about 20% after three cycles. Conversely, the discoloration rate for GOFe increases 50% in the third cycle. The photocatalytic activity of the GOFe catalysts in the visible region of the electromagnetic spectrum expands the possibility to use it in environmental remediation applications with solar irradiation as a source of illumination.
Data Availability Statement
The raw data supporting the conclusion of this article will be made available by the authors, without undue reservation.
Author Contributions
SO, MR, and JE contributed to the conceptualization and project administration. SO and EM developed the experimental methodology, data curation and statistical analysis. SO and MR wrote the first draft of the manuscript. All authors contributed to formal analysis, visualization, manuscript revision, read, and approved the submitted version.
Funding
SO Posdoctoral fellowship grant I1200/224/2021 MOD. ORD./30/2021. Becas de Consolidación Conacyt. MR Project UNAM-DGAPA-PAPIIT IA100621.
Conflict of Interest
The authors declare that the research was conducted in the absence of any commercial or financial relationships that could be construed as a potential conflict of interest.
Publisher’s Note
All claims expressed in this article are solely those of the authors and do not necessarily represent those of their affiliated organizations, or those of the publisher, the editors and the reviewers. Any product that may be evaluated in this article, or claim that may be made by its manufacturer, is not guaranteed or endorsed by the publisher.
Acknowledgments
Authors acknowledge Karen Murguía for the characterization by TGA.
References
Cheah, L. B., Osman, R. A. M., and Poopalan, P. (2020). Ga2O3 Thin Films by Sol-Gel Method its Optical Propertiess. AIP Conf. Proc. 2203, 020028. doi:10.1063/1.5142120
Choi, M., and Son, J. (2017). Doping-Induced Bandgap Tuning of α-Ga2O3 for Ultraviolet Lighting. Curr. Appl. Phys. 17, 713–716. doi:10.1016/j.cap.2017.02.019
Das, B., Das, B., Das, N. S., Sarkar, S., and Chattopadhyay, K. K. (2019). Tailored Mesoporous Nanocrystalline Ga2O3 for Dye-Selective Photocatalytic Degradation. Microporous Mesoporous Mater. 288, 109600. doi:10.1016/j.micromeso.2019.109600
Deshmane, C. A., Jasinski, J. B., and Carreon, M. A. (2010). Microwave-assisted Synthesis of Nanocrystalline Mesoporous Gallium Oxide. Microporous Mesoporous Mater. 130, 97–102. doi:10.1016/j.micromeso.2009.10.018
Du, F., Yang, D., Sun, Y., Jiao, Y., Teng, F., and Fan, H. (2021). Electrospun Zn-Doped ga2o3 Nanofibers and Their Application in Photodegrading Rhodamine B Dye. Ceram. Int. 47, 4963–4971. doi:10.1016/j.ceramint.2020.10.072
Girija, K., Thirumalairajan, S., Patra, A. K., Ponpandian, N., Mangalaraj, D., and Viswanathan, C. (2013). Organic Additives Assisted Synthesis of Mesoporous β-Ga2O3 Nanostructures for Photocatalytic Dye Degradation. Semicond. Sci. Technol. 28, 035015. doi:10.1088/0268-1242/28/3/035015
Guo, D. Y., Qian, Y. P., Su, Y. L., Shi, H. Z., Li, P. G., Wu, J. T., et al. (2017). Evidence for the Bias-Driven Migration of Oxygen Vacancies in Amorphous Non-stoichiometric Gallium Oxide. AIP Adv. 7, 065312. doi:10.1063/1.4990566
Hidaka, H., and Tsukamoto, T. (2019). “Ga2O3-Photoassisted Decomposition of Insecticides,” Gallium Oxide, 419–437. doi:10.1016/B978-0-12-814521-0.00018-X
Huang, E., Li, J., Wu, G., Dai, W., Guan, N., and Li, L. (2017). A Simple Synthesis of Ga2O3 and GaN Nanocrystals. RSC Adv. 7, 47898–47903. doi:10.1039/c7ra10639d
Kosmulski, M. (2001). Pristine Points of Zero Charge of Gallium and Indium Oxides. J. Colloid Interface Sci. 238, 225–227. doi:10.1006/jcis.2001.7484
Kumar, V. B., Gedanken, A., and Porat, Z. e. (2015). Facile Synthesis of Gallium Oxide Hydroxide by Ultrasonic Irradiation of Molten Gallium in Water. Ultrason. Sonochem. 26, 340–344. doi:10.1016/j.ultsonch.2015.03.012
Li, Q., Zhang, Y., Zhang, L., Xia, J., Liu, X., Hu, L., et al. (2018). Enhanced Activity of β-Ga2O3 by Substitution with Transition Metal for CO2 Photoreduction under Visible Light Irradiation. Catal. Commun. 120, 23–27. doi:10.1016/j.catcom.2018.11.007
Magdalane, C. M., Kaviyarasu, K., Vijaya, J. J., Siddhardha, B., Jeyaraj, B., Kennedy, J., et al. (2017). Evaluation on the Heterostructured CeO2/Y2O3 Binary Metal Oxide Nanocomposites for Uv/vis Light Induced Photocatalytic Degradation of Rhodamine-B Dye for Textile Engineering Application. J. Alloys Compd. 727, 1324–1337. doi:10.1016/j.jallcom.2017.08.209
Manandhar, S., Battu, A. K., Orozco, C., and Ramana, C. (2019). Optical Constants of Titanium-Doped Gallium Oxide Thin Films. Opt. Mater. 96, 109223. doi:10.1016/j.optmat.2019.109223
Nguyen, L. T., Vo, D.-V. N., Nguyen, T., LanDuong, A. T., Nguyen, H. Q., Chu, N. M., et al. (2022). Synthesis, Characterization, and Application of ZnFe2O4@ZnO Nanoparticles for Photocatalytic Degradation of Rhodamine B under Visible-Light Illumination. Environ. Technol. Innovation 25, 102130. doi:10.1016/j.eti.2021.102130
Nikolaev, V. I., Stepanov, S. I., Romanov, A. E., and Bougrov, V. E. (2019). “Gallium Oxide,” Single Crystals of Electronic Materials, 487–521. doi:10.1016/B978-0-08-102096-8.00014-8
Palanivel, B., Hu, C., Shkir, M., AlFaify, S., Ibrahim, F. A., Hamdy, M. S., et al. (2021). Fluorine Doped G-C3N4 Coupled NiFe2O4 Heterojunction: Consumption of H2O2 for Production of Hydroxyl Radicals towards Paracetamol Degradation. Colloid Interface Sci. Commun. 42, 100410. doi:10.1016/j.colcom.2021.100410
Parveen, K., Rafique, U., Akhtar, M. J., and Ashokumar, M. (2018). Ultrasound-assisted Synthesis of Gallium Hybrids for Environmental Remediation Application. Ultrason. Sonochem. 49, 222–232. doi:10.1016/j.ultsonch.2018.08.013
Pearton, S., Yang, J., Ren, F., and Kim, J. (2019). “Progress in Semiconductor β-Ga2O3,” Ultra-Wide Bandgap Semiconductor Materials, 263–345. doi:10.1016/B978-0-12-815468-7.00003-2
Quan, Y., Fang, D., Zhang, X., Liu, S., and Huang, K. (2010). Synthesis and Characterization of Gallium Oxide Nanowires via a Hydrothermal Method. Mater. Chem. Phys. 121, 142–146. doi:10.1016/j.matchemphys.2010.01.009
Reddy, L. S., Ko, Y. H., and Yu, J. S. (2015). Hydrothermal Synthesis and Photocatalytic Property of β-Ga2O3 Nanorods. Nanoscale Res. Lett. 10, 364. doi:10.1186/s11671-015-1070-5
Rex, J. P., Kwong, Y. F., and San, Y. F. (2019). The Influence of Deposition Temperature on the Structural, Morphological and Optical Properties of Micro-size Structures of beta-Ga2O3. Results Phys. 14, 102475. doi:10.1016/j.rinp.2019.102475
Roy, S., and Ramana, C. (2021). Effect of Sintering Temperature on the Chemical Bonding, Electronic Structure and Electrical Transport Properties of βGa1 ⋅9Fe0 ⋅1O3 Compounds. J. Mater. Sci. Technol. 60, 135–144. doi:10.1016/j.jmst.2020.05.072
Shan, J.-J. S., Li, C.-H., Wu, J.-M., Liu, J.-A., and Shi, Y.-S. (2017). Shape-controlled Synthesis of Monodispersed Beta-Gallium Oxide Crystals by a Simple Precipitation Technique. Ceram. Int. 43, 6430–6436. doi:10.1016/j.ceramint.2017.02.056
Sharma, A., Varshney, M., Saraswat, H., ⋅ Chaudhary, S., Parkash, J., Shin, H., et al. (2020). Nano-structured Phases of Gallium Oxide (GaOOH, α-Ga2O3, β-Ga2O3, γ-Ga2O3, δ-Ga2O3, and ϵ-Ga2O3): Fabrication, Structural, and Electronic Structure Investigations. Int. Nano Lett. 10, 71–79. doi:10.1007/s40089-020-00295-w
Sprincean, V., Lupan, O., Caraman, I., Untila, D., Postica, V., Cojocaru, A., et al. (2021). Crystallinity and Optical Properties of β-Ga2O3/Ga2S3 Layered Structure Obtained by Thermal Annealing of Ga2S3 Semiconductor. Mater. Sci. Semicond. Process. 121, 105314. doi:10.1016/j.mssp.2020.105314
Stepanov, S., Nikolaev, V., Bougrov, V., and Romanov, A. (2016). Gallium Oxide: Properties and Aplications, a Review. Rev. Adv. Mater. Sci. 444, 63–86.
Stijepovic, I., Djenadic, R., Srdic, V. V., and Winterer, M. (2015). Chemical Vapour Synthesis of Lanthanum Gallium Oxide Nanoparticles. J. Eur. Ceram. Soc. 35, 3545–3552. doi:10.1016/j.jeurceramsoc.2015.05.020
Suman, S., Mukurala, N., and Kushwaha, A. K. (2021). Annealing Induced Surface Restructuring in Hydrothermally Synthesized Gallium Oxide Nano-Cuboids. J. Cryst. Growth 554, 125946. doi:10.1016/j.jcrysgro.2020.125946
Sun, W.-j., Li, J., Mele, G., Zhang, Z.-q., and Zhang, F.-x. (2013). Enhanced Photocatalytic Degradation of Rhodamine B by Surface Modification of ZnO with Copper (Ii) Porphyrin under Both Uv–Vis and Visible Light Irradiation. J. Mol. Catal. A Chem. 366, 84–91. doi:10.1016/j.molcata.2012.09.010
Tak, B., Kumar, S., Kapoor, A., Wang, D., Li, X., Sun, H., et al. (2021). Recent Advances in the Growth of Gallium Oxide Thin Films Employing Various Growth Techniques—A Review. J. Phys. D Appl. Phys. 54, 453002–453023. doi:10.1088/1361-6463/ac1af2
Venediktova, O., Bulavchenko, O., Afonasenko, T., Tsyrul’nikov, P., Vinokurov, S., Chesalov, Y. A., et al. (2017). Synthesis and Characterization of Mixed Manganese-Gallium Oxides Mn3–xGaxO4 (x = 1 − 2) with the Spinel Structure. J. Alloys Compd. 725, 496–503. doi:10.1016/j.jallcom.2017.07.175
Wang, X., Quhe, R., Zhi, Y., Liu, Z., Huang, Y., Dai, X., et al. (2018). The Electronic Structure and Magnetic Property of the Mn Doped β-Ga2O3. Superlattices Microstruct. 125, 330–337. doi:10.1016/j.spmi.2018.12.001
Yuwen, C., Liu, B., and Zhang, L. (2020). Dielectric Properties, Structure and Morphology during Synthesis of β-Ga2O3 by Microwave Calcination of GaOOH. Ceram. Int. 46, 24923–24929. doi:10.1016/j.ceramint.2020.06.278
Zhang, L., Li, Y., Xiu, X., Xin, G., Xie, Z., Tao, T., et al. (2020). Preparation of Vertically Aligned GaN@Ga2O3 Core-Shell Heterostructured Nanowire Arrays and Their Photocatalytic Activity for Degradation of Rhodamine B. Superlattices Microstruct. 143, 106556. doi:10.1016/j.spmi.2020.106556
Zhao, W., Yang, Y., Hao, R., Liu, F., Wang, Y., Tan, M., et al. (2011). Synthesis of Mesoporous β-Ga2O3 Nanorods Using Peg as Template: Preparation, Characterization and Photocatalytic Properties. J. Hazard. Mater. 192, 1548–1554. doi:10.1016/j.jhazmat.2011.06.073
Zhao, B., Lv, M., and Zhou, L. (2012). Photocatalytic Degradation of Perfluorooctanoic Acid with β-Ga2O3 in Anoxic Aqueous Solution. J. Environ. Sci. 24, 774–780. doi:10.1016/s1001-0742(11)60818-8
Zhu, F., Yang, Z. X., Zhou, W. M., and Zhang, Y. F. (2006). Annealing Effects on the Structural and Optical Properties of β-Ga2O3 Nanobelts Synthesized by Microwave Plasma Chemical Vapor Deposition. Physica 33, 151–154. doi:10.1016/j.physe.2006.01.006
Keywords: photocatalysis, gallium oxides, go and gofe photocatalysts, photodegradation, rhodamine, visible-UV illumination
Citation: Orozco S, Rivero M, Montiel E and Espino Valencia J (2022) Gallium Oxides Photocatalysts Doped With Fe Ions for Discoloration of Rhodamine Under UV and Visible Light. Front. Environ. Sci. 10:884758. doi: 10.3389/fenvs.2022.884758
Received: 27 February 2022; Accepted: 11 April 2022;
Published: 02 May 2022.
Edited by:
Yaneth Alejandra Bustos Terrones, Instituto Tecnológico de Culiacán, MexicoReviewed by:
Jesus Gabriel Rangel-Peraza, Instituto Tecnológico de Culiacán, MexicoJuan Enrique Ruiz Espinoza, Autonomous University of Yucatan, Mexico
Copyright © 2022 Orozco, Rivero, Montiel and Espino Valencia. This is an open-access article distributed under the terms of the Creative Commons Attribution License (CC BY). The use, distribution or reproduction in other forums is permitted, provided the original author(s) and the copyright owner(s) are credited and that the original publication in this journal is cited, in accordance with accepted academic practice. No use, distribution or reproduction is permitted which does not comply with these terms.
*Correspondence: M. Rivero, bXJpdmVyb0BtYXRlcmlhbGVzLnVuYW0ubXg=; J. Espino Valencia, amFpbWUuZXNwaW5vQHVtaWNoLm14