 Wei Ren
 Xuesong Zhang1,2*
95% of researchers rate our articles as excellent or good
Learn more about the work of our research integrity team to safeguard the quality of each article we publish.
Find out more
ORIGINAL RESEARCH article
Front. Environ. Sci. , 16 May 2022
Sec. Land Use Dynamics
Volume 10 - 2022 | https://doi.org/10.3389/fenvs.2022.884440
This article is part of the Research Topic Land Governance, Integrated Socio-Ecosystem and Sustainable Development View all 33 articles
Located in the middle reaches of the Yangtze River, Jianghan Plain is an important part of the middle and lower reaches of the Yangtze River Plain, and together with Dongting Lake Plain, it is known as the Two-Lake Plain. It is a well-developed agricultural area and is an important source of grain in China, as well as one of the major cotton-producing areas, and aquaculture is also an important local industry. With the rapid development of urbanization in China, the impact of human activities on the ecological environment of Jianghan Plain has become increasingly obvious in recent years, and how to timely and objectively assess spatial and temporal changes in ecological environmental quality is of great practical significance for the sustainable development of the region and the construction of an ecological civilization. The Google Earth Engine platform was used to optimize the reconstruction of Landsat TM/OLI images of Jianghan Plain from 1990 to 2021, coupled with four indicators of the natural ecological environment such as the Normalized Difference Vegetation Index, WET, Normalized Difference Soil Index, and Land Surface Temperature to construct the remote sensing ecological index (RSEI) and evaluate the spatial and temporal changes in ecological environmental quality on Jianghan Plain. The results showed that the mean RSEI values in 1990, 1998, 2006, 2014, and 2021 were 0.667, 0.636, 0.599, 0.621, and 0.648, respectively, indicating that the overall ecological environmental quality of Jianghan Plain showed a decreasing trend from 1990 to 2006 and an increasing trend from 2006 to 2021. Degradation was most serious from 1990 to 1998, accounting for 44.86% of the total area, and improvement was most obvious from 2006 to 2014, accounting for 26.64% of the total area. Moran’s I values from 1990 to 2021 were 0.531, 0.529, 0.525, 0.540, and 0.545, respectively, indicating that the spatial distribution of ecological environmental quality was positively correlated. The local spatial clustering of the RSEI local indicators of spatial association showed that H-H clustering areas on Jianghan Plain were mainly distributed in the northern and western regions, and L-L clustering areas were mainly distributed in the densely populated eastern regions with frequent human activities. The results can provide a theoretical basis for ecological environmental protection and improvement on Jianghan Plain.
Ecological environmental quality refers to the degree of the ecological environment, which is the material basis for human survival and development and reflects the suitability of the ecological environment for human survival and socioeconomic development (Han et al., 2021; Khan et al., 2021; Yu, 2021). With the rapid development of society and the economy, the relationship between human activities and the ecological environment has become increasingly close, thus causing great damage to the global ecosystem, and ecological and environmental problems are becoming increasingly serious (Imhoff et al., 2010). Especially in recent years, rapid urbanization has accelerated the degree of damage caused by human activities to the surface environment, leading to the growing prominence of urban ecological problems, which seriously threaten urban ecological security (Karimi Firozjaei et al., 2021). Therefore, scientific monitoring of the impact of regional ecological and environmental conditions and their spatial and temporal changes and studying their key driving factors to optimize the spatial pattern of the national territory have become important tools and hot research areas for protecting the ecological environment, which has important theoretical and practical significance for coordinating the relationship between human activities and the ecological environment, promoting harmony between humans and nature, and promoting sustainable social and economic development (Feng et al., 2021).
In recent years, the use of remote sensing technology to analyze and evaluate the ecological environment has become an important part of the ecological remote sensing field (Liu, 2021). Many scholars have used remote sensing techniques for urban (Hu and Xu, 2019; Tang et al., 2021; Huang C et al., 2021), forest (Xu et al., 2019; Xiong et al., 2020), mining (Zhu et al., 2020; Nie et al., 2021), basin (Liu et al., 2021; Seelen et al., 2021), and nature reserves (Jing et al., 2020; Ferrario et al., 2021; Su et al., 2022). A large number of studies and applications have been conducted on the evaluation of ecological environmental quality changes in these areas, and richer results and practical examples have been achieved. The ecological environment is composed of complex ecosystems, which are often influenced by a combination of multiple factors. A single ecological quality index can only represent the ecological characteristics of a certain aspect of an ecosystem, and it is difficult to accurately and comprehensively reflect its comprehensive characteristics. In comparison, the comprehensive evaluation method takes the shortcomings of the former into account, but there are disadvantages in the subjectivity and arbitrariness of index selection and weight assignment. The method also suffers various problems in which some of the indices are often unrepresentative, the scope of application is limited, and the evaluation results have difficulty realizing spatial visualization (Wang et al., 2019; He et al., 2021). Some scholars have proposed the use of principal component analysis (PCA) to construct a remote sensing ecological index (RSEI) using the evaluation indices of the normalized difference vegetation index, wetness, normalized difference soil index, and land surface temperature in the ecological environment. This method is convenient in data acquisition, fast in the evaluation process, and objective and reliable in evaluation results, and it has been widely used at various regional spatial scales (Hu and Xu, 2018; Ning et al., 2020).
Some scholars have monitored the changes in ecological environmental quality in 35 major cities in China by using the RSEI (Yue et al., 2019). Zhu et al. (2021) analyzed the relationship between ecosystem quality and ecosystem service systems in the Pingjiang watershed in the red soil hilly region in southern China using the RSEI and ecosystem service index. Ariken et al. (2020) evaluated the urbanization–ecological environmental coupling correlation in Yanqi Basin from 2000 to 2018 by utilizing the RSEI and gray system, and it was found that the urbanization–ecological environmental coupling relationship in Yanqi Basin showed a slow urbanization rate and a moderate imbalance between urbanization and the ecological environment. Qureshi et al. (2020) assessed and compared the spatial and temporal variability of RSEI values for the Gomesan wetlands. Xu et al. (2021) explored the coupling mechanism between urbanization and ecological quality in central and eastern China from 1992 to 2015 using a modified remote sensing ecological index (RSEI-2). Other scholars have used Dongting Lake Basin as an example to evaluate and analyze the spatial variation in ecological quality and its influencing factors from 2001 to 2019 using the RSEI (Yuan et al., 2021).
Existing research shows that vegetation index analysis based on the Google Earth Engine remote sensing cloud platform (Zhou et al., 2019a), land use cover (Liu et al., 2018), and other land use remote sensing information extraction and classification (Wang et al., 2018) has obvious characteristic advantages over traditional remote sensing analysis methods, especially in long-time series and large-scale remote sensing monitoring research. The GEE platform can greatly shorten image processing time and improve work efficiency with the help of cloud computing (Tamiminia et al., 2020). Gao et al. (2021) analyzed the temporal and spatial distribution trends of eco-environmental quality in Yellow River Basin through the calculation of the Landsat OLI/TM cloud layer by GEE and RSEI. Zhang et al. (2021) analyzed the eco-environmental quality of the middle reaches of Yangtze River Basin from 2000 to 2019 with the help of the GEE platform. However, in Jianghan Plain, the research on the application of the GEE platform has just started. Shao et al. (2019) used GEE to monitor the change in the hydrological and ecological environment in Wuhan in Jianghan Plain. There are few research reports on the evaluation of long-term eco-environmental status based on the GEE platform in Yangtze River Basin, especially in Jianghan Plain. There is a lack of research data support for the cognition of the temporal and spatial variations of eco-environmental quality, and the characteristics and mechanism of eco-environmental change in Jianghan Plain are not clear.
In view of the aforementioned problems, as the core area of the Yangtze River economic belt, Jianghan Plain undertakes the important mission of protecting and maintaining the national ecological security of the Yangtze River. As an important grain production base in Hubei and even the whole country, maintaining China’s food security has important ecological and economic value. But at the same time, the rapid change of land and space development patterns has also brought negative results, such as the continuous swallowing of fertile land around cities and towns, the low comprehensive benefits of land use, and the destruction of the ecological environment. A comprehensive evaluation of the spatial and temporal changes in ecological environmental quality and a timely and accurate grasp of the ecological environmental quality status and changing trends on Jianghan Plain can provide a scientific basis for ecological environmental protection and improvement of Jianghan Plain, optimization of the regional territorial spatial pattern, and construction of ecological civilization. Based on the aforementioned statements, the objectives of the research in this study are as follows: 1) to establish the ecological index system and construct the RSEI model using Landsat 5/TM and Landsat 8/OLI on the GEE platform, 2) to carry out an analysis of the spatial and temporal changes in ecological environmental quality on Jianghan Plain from 1990 to 2021, and 3) to explore the spatial differentiation characteristics of ecological environmental quality on Jianghan Plain.
First, we selected Landsat 5/TM and Landsat 8/OLI remote sensing images for 1990, 1998, 2006, 2014, and 2021 and synthesized five 30-m resolution RSEI image maps on the GEE platform. Then, based on the five RSEI image maps from 1990 to 2021, the spatial and temporal changes in ecological environmental quality on Jianghan Plain were analyzed. Finally, the spatial data exploration (ESDA), the global spatial autocorrelation (Moran’s I), and local indicators of spatial association (LISA) were used to explore the spatial correlation of ecological environmental quality, and the technical roadmap is shown in Figure 1.
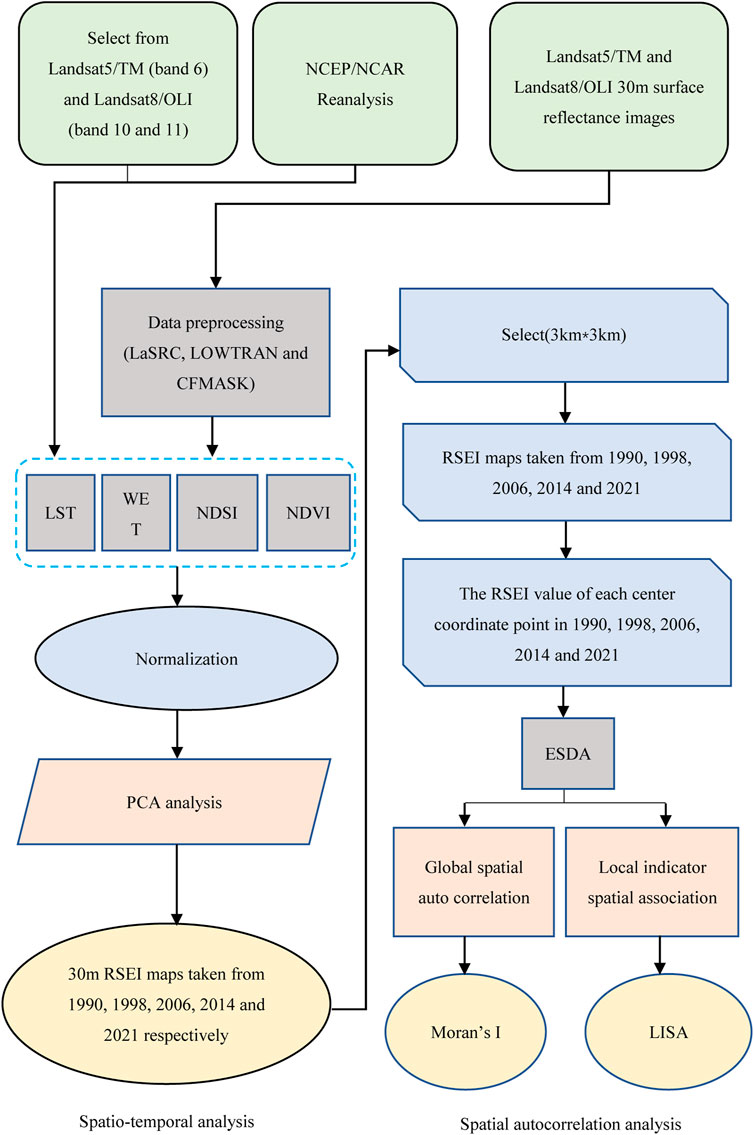
FIGURE 1. Technology roadmap.
Jianghan Plain is located in the middle reaches of the Yangtze River, the middle and lower reaches of the Han River, and the south-central part of Hubei Province and is an important part of middle Yangtze River Plain, one of the three major plains in China. It starts from the Yichang Zhijiang River in the west; ends in Wuhan, the largest city in central China; reaches Zhongxiang in the north; and is connected to Dongting Lake Plain in the south. It lies between latitudes 29°26′ and 31°37′ north and longitudes 111°14′ and 114°36′ east, with an area of more than 46,000 square kilometers. It has a subtropical monsoon climate with an annual average of approximately 2,000 h of sunshine and a total annual solar radiation value of approximately 460–480 kJ per square centimeter. The frost-free period is approximately 240–260 days, the duration above 10°C is approximately 230–240 days, and the active cumulative temperature is 5,100–5,300°C. The average annual precipitation is 1,100–1,300 mm, and the higher temperature of April–September precipitation accounts for approximately 70% of the total annual precipitation. Jianghan Plain mainly has eight counties and urban areas, including Jingzhou city, Jingzhou district, Shacheng district, Jiangling County, public security county, supervision city, Shishou city, Honghu city, and Songzi city; three provincial-level cities such as Xiantao, Qianjiang, and Tianmen, and radiates into some areas in the surrounding five prefectures of Wuhan, Xiaogan, Jingmen, Yichang, and Xiangyang and includes Caidian district, Hanchuan city, Yingcheng city, Shayang County, Jingshan city, Zhongxiang city, Zhijiang city, and Yicheng city. Figure 2 shows the location map of Jianghan Plain with data extracted from ASTER GDEM 30 m elevation (geospatial data cloud) and 2020 watershed information (land use).
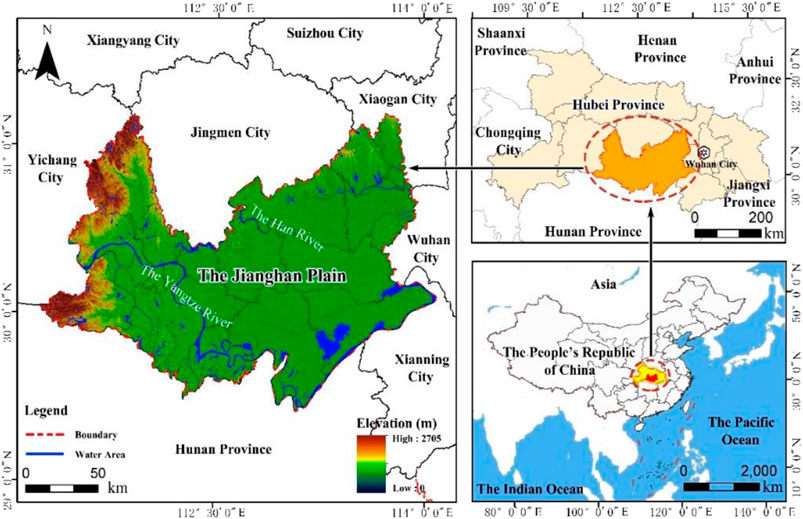
FIGURE 2. Location of the study area.
Worldwide Reference System (WRS-2) paths in Rows 130 and 043 using satellite remote sensing images; three Landsat 5/TM layer images corresponding to 1990, 1998, and 2006; and two Landsat 8/OLI layer images for 2014 and 2021 were selected for the study area to synthesize the spatial and temporal distribution of the RSEI on Jianghan Plain from 1990 to 2021. The layer image months were concentrated from January to March, the image cloudiness was less than 5%, and the quality was good (Table 1).
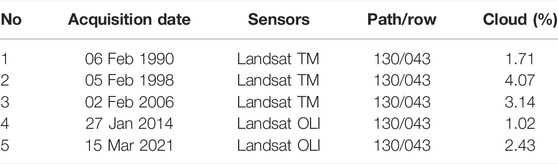
TABLE 1. Satellite remote sensing impact data of Jianghan Plain from 1990 to 2021.
The Google Earth Engine (GEE) platform was applied to collect and process Landsat 5/TM and Landsat 8/OLI imagery provided by the U.S. Geological Survey (USGS) and perform preprocessing, such as radiometric calibration, geometric correction, and atmospheric correction. Among them, the radiometric calibration was performed using the Landsat Surface Reflectance Code (LaSRC) proposed by Vermote for Landsat 5/TM and Landsat 8/OLI (Vermote et al., 2016), geometric correction using the quadratic polynomial and nearest image element method to control the root mean square error within 0.5 image elements (Chander et al., 2009), and atmospheric correction based on the LOWTRAN model for image correction and calculation of base pixel data such as clouds, water, and snow by CFMASK (Foga et al., 2017). In addition, the thermal infrared (TIR) band (Band 6) in Layer 1 in Landsat 5/TM Series 1 was initially acquired at a resolution of 120 m/pixel and resampled at 30 m using cubic convolution interpolation; two thermal infrared (TIR) bands (Band 10 and Band 11) in Layer 1 in Landsat 8/OLI Series 1 were initially acquired at a resolution of 100 m/pixel and resampled at 30 m using cubic convolution interpolation, pixel resolution, and 30 m resampling using cubic convolution interpolation (Xiong et al., 2021). In this study, the LST was calculated using the single-channel calculation rule (SC) (Gomis-Cebolla et al., 2018), and LANDSAT/LT05/C01/T1_SR and LANDSAT/LC08/C01/T1_SR were selected to calculate the NDVI, WET, NDSI, and LST. The surface temperature was calculated using the radiance of Landsat 5/TM Band 6, the radiance of Landsat 8/OLI Band 10, and the NCEP_RE/surface_wv data (Table 2).
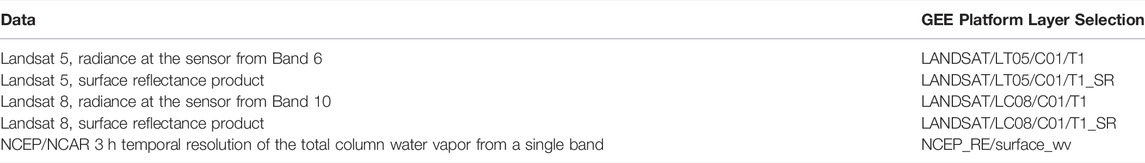
TABLE 2. Google Earth Engine (GEE)-related data platform selection.
The ecological evaluation index was constructed using four factors reflecting the natural ecological environment: normalized difference vegetation index, wetness, normalized difference soil index, and land surface temperature (Boori et al., 2021). The four remote sensing bands corresponding to the normalized difference vegetation index, wetness, normalized difference soil index, and land surface temperature were combined into a new index image after normalization and then subjected to principal component analysis (PCA), with a PCA range of [0, 1]; after normalization of the four indices, PC1 was calculated using feature analysis (https://developers.google.com/earth). The initial ecological index (
where NDVI, WET, NDSI, and LST refer to the normalized difference vegetation index, wetness, normalized difference soil index, and land surface temperature, respectively. RSEI0_max and RSEI0_min refer to the maximum and minimum values of the original ecological index, respectively.
The NDVI, as the most widely used vegetation index, is closely related to plant biomass, leaf area index, and vegetation cover (Liaqat et al., 2017). Therefore, the NDVI was chosen to represent the normalized difference vegetation index:
where
Moisture, greenness, and brightness components of remote sensing tassel cap transformation have been applied in a large number of ecological environmental quality evaluations, among which WET better reflects the moisture of soil and vegetation (Baig et al., 2014). The calculation model is as follows (Polevshchikova, 2019):
where
The NDSI consists of the building index (BI) and the bare soil index (SI), which is expressed as the average of the two (Xu, 2008):
where
Surface temperature is closely related to the growth and distribution of vegetation and the evaporation cycle of surface water resources and is one of the important parameters reflecting the surface environment; therefore, LST is represented by surface temperature, and the index model is given as follows (Neteler, 2010):
where LST is the surface temperature,
Spatial correlation analysis of ecological environmental quality can be used to describe the spatially homogeneous distribution of ecological environmental quality in the study area (Degefu et al., 2021). In this study, we used global spatial autocorrelation (global Moran’s I) and local indicator spatial association (local Moran’s I) to analyze the spatial correlation of the RSEI.
The global Moran’s I (Moran’s I) index reflects the correlation of attribute values of adjacent spatial units. The closer the absolute value of Moran’s I is to 1, the stronger the spatial autocorrelation. The formula is as follows:
where m is the total number of indicators, Di represents the ecological environmental quality value of location i,
Local Moran’s I (LISA) index can effectively reflect the correlation between the ecological environmental quality of each grid cell in the territory (Bi et al., 2021). There are five types of local spatial aggregation in the LISA clustering diagram, namely, high–high (H-H), low–low (L-L), low–high (L-H), and high–low (H-L), without significant differences. In this study, H-H indicates a high-ecological quality value of the selected region and spatially adjacent regions, L-L indicates a low-ecological quality value of the selected region and spatially adjacent regions, L-H indicates a low-ecological quality value of the selected region but a high-ecological quality value of the adjacent regions, and H-L indicates a high-ecological quality value of the selected region but a low-ecological quality value of the adjacent regions. If global spatial autocorrelation does not exist, the location of local spatial autocorrelation that may be masked can be found. When global spatial autocorrelation exists, the presence of spatial heterogeneity can be analyzed (Zhou et al., 2019b). The calculation formula is as follows:
As shown in Table 3, the first principal component (PC1) eigenvalues were above 60% in all five images from 1990 to 2021, with PC1 at 62.28% in 1990, 67.09% in 1998, 67.15% in 2006, 63.42% in 2014, and the highest at 71.65% in 2021, indicating that PC1 concentrated the four ecological indices of the main percentage characteristics. From PC2 to PC4, the magnitudes of the characteristic values were reflected in different positive and negative ways. In PC1, the eigenvalues of NDVI and WET were positive, and those of NDSI and LST were negative, which was consistent with the actual situation (xiong et al., 2021).
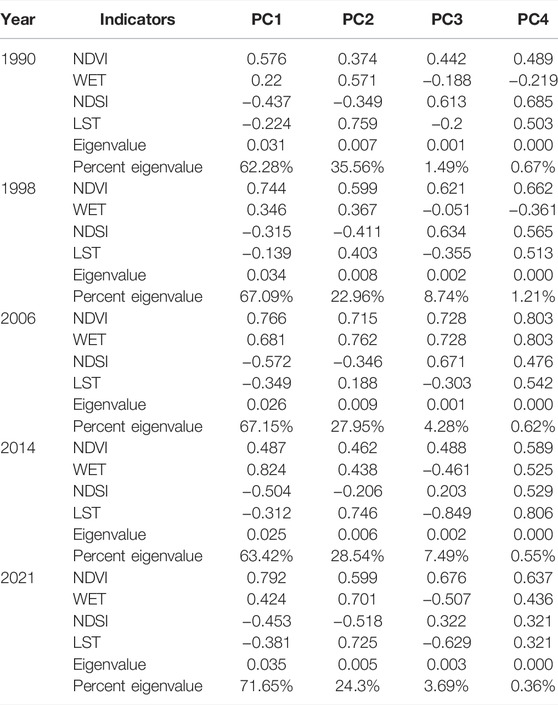
TABLE 3. Principal component analysis results of the RSEI from 1990 to 2021.
Figure 3 represents the distribution characteristics of the five RSEI values on Jianghan Plain from 1990 to 2021. The mean values of the RSEI corresponding to the five equally spaced years during 1990–2021 were 0.667, 0.636, 0.599, 0.621, and 0.648, respectively, with some RSEI levels between good levels (0.6 and 0.8), except for the lower quartile in 2006, when the RSEI values in the lower quartile were less than 0.4, while the RSEI values in the upper quartile were all greater than 0.8. The RSEI values in the lower quartile were less than 0.4 in 2006, while the RSEI values in the upper quartile were all greater than 0.8. Overall, the ecological and environmental quality of Jianghan Plain showed a decreasing trend from 1990 to 2006 and an increasing trend from 2006 to 2021, when the ecological and environmental quality improved.
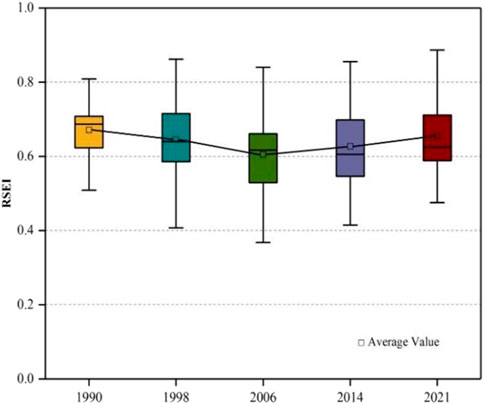
FIGURE 3. RSEI data box diagram of Jianghan Plain from 1990 to 2021.
Figure 4 shows the spatial and temporal variations in the ecological quality of Jianghan Plain (the watershed part was excluded). Red, dark green, brown, light green, and yellow represent “bad,” “fair,” “moderate,” “good,” and “excellent” ecological grades, respectively. The overall ecological quality was good from 1990 to 2021. The areas with poor and moderate ecological levels were mainly distributed in Jingzhou district, Xiantao city, and Hanchuan city, which are subject to the economic radiation effect of the Wuhan city circle, in which urbanization, construction area growth, and human activities are frequent, which in turn leads to the decline of ecological environmental quality in the region. The good and excellent ecological levels were mainly distributed in the southwestern part of Songzi city, the southern part of Jili County, and the southeastern part of Honghu city, mainly due to the high regional forest coverage and low urbanization.
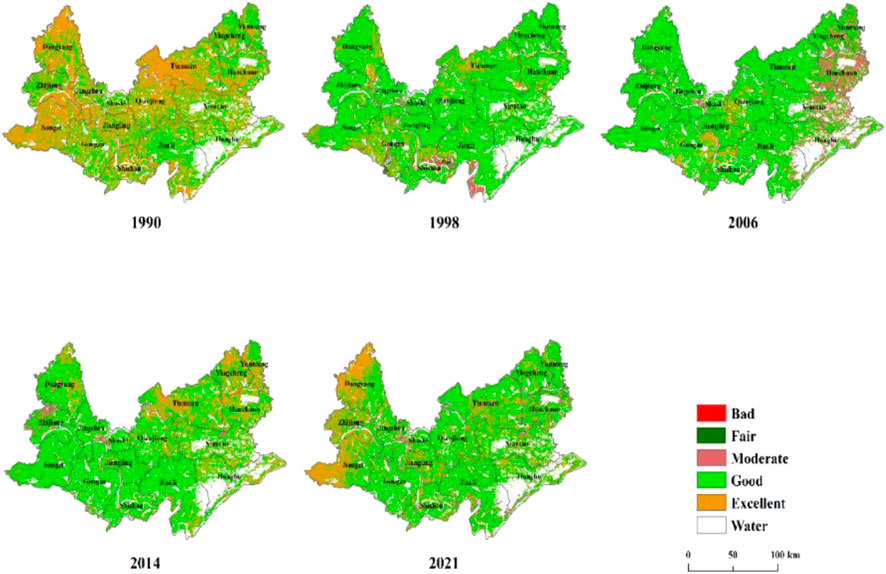
FIGURE 4. Spatial distribution of ecological environmental quality on Jianghan Plain from 1990 to 2021.
Combined with the temporal and spatial variation characteristics of eco-environmental quality in Jianghan Plain, further evidence research is carried out. Overall, 3,364 sample points are collected from the grid image, which is displayed in arcgis10.0; the eco-environmental quality index is divided into five categories by using the natural clustering zoning method. After taking the average value, they are “bad eco-environmental quality,” “fair eco-environmental quality,” “moderate eco-environmental quality,” “good eco-environmental quality,” and “excellent eco-environmental quality.” The spatial distribution of eco-environmental quality shows that from 1990 to 2021, the grid of good and good eco-environmental quality in Jianghan Plain is mainly distributed in the north and west of the town, and the grid of poor and poor eco-environmental quality is mainly distributed in the surrounding areas of Honghu city in the east. Among them, the overall eco-environmental quality deviation in the east in 2006 is consistent with Figure 4. Therefore, the temporal change of eco-environmental quality reflects the ecological model of Jianghan plain to a certain extent in Figure 5. Jianghan Plain is located in the economic core of the Yangtze River. In recent 30 years, the economic scale, urbanization, and industrialization level of the region have been continuously improved. By 2021, the GDP output value of Jianghan Plain will be 1771.676 billion yuan. The rapid development of the economy and society will inevitably bring corresponding changes to the ecological environment. Especially in recent years, the rapid economic growth the large-scale city construction, and the intensity of development of human activities will inevitably destroy its ecological environment quality.
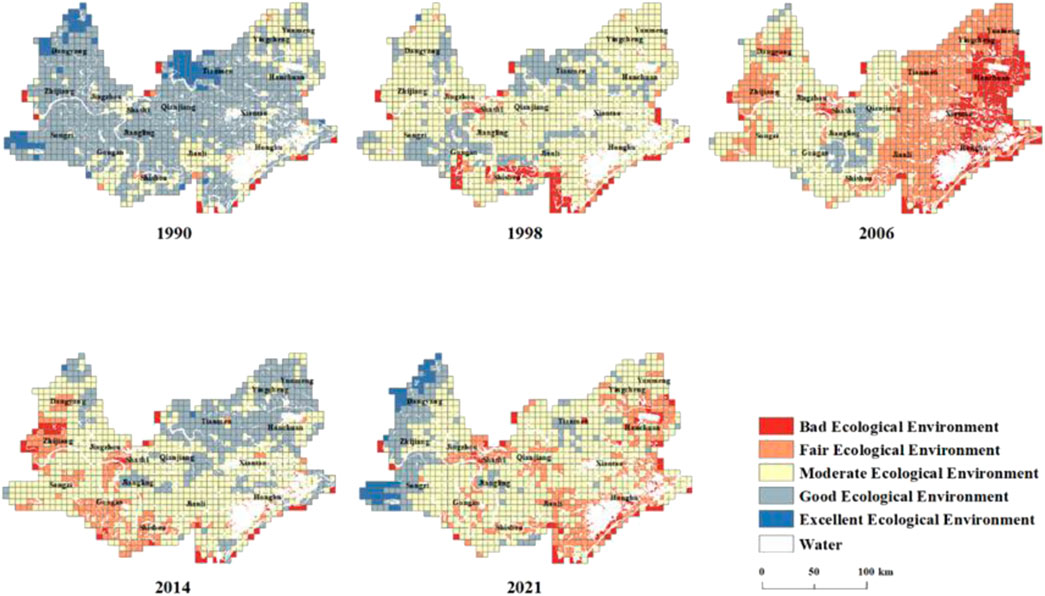
FIGURE 5. Regional distribution characteristics of eco-environmental quality in Jianghan Plain from 1990 to 2021.
The area and proportion of each ecological class (bad, fair, moderate, good, and excellent) were calculated based on the five RSEI maps corresponding to 1990, 1998, 2006, 2014, and 2021. Figure 6 shows the proportional changes in each ecological level, with the total proportion of “bad,” “fair,” and “moderate” RSEI gradually increasing from 1990 to 2006 and the total proportion of “good” and “excellent” RSEI gradually decreasing from 2006 to 2021. The overall ecological quality of Jianghan Plain showed a decreasing trend from 1990 to 2006 and an increasing trend from 2006 to 2021. The area and proportion of each RSEI level are shown in Table 4, and we calculated the total proportion of “bad,” “fair,” and “moderate” (PFM%) and “good” and “moderate,” respectively. The PFM% and GE% for 1990, 1998, 2006, 2014, and 2021 were 3.04%/96.96%, 7.1%/92.9%, 16.37%/83.63%, 6.54%/93.46%, and 10.94%/89.06%, respectively, with the highest PFM% and lowest GE% in 2006 compared with the other periods. Related literature shows that the strongest surface rainstorm occurred on the central Jianghan Plain during the night of 24 May 2006, causing soil, water disasters, and ecological imbalances, which in turn affected the quality of the ecosystem in that year (Zhang and Zhang, 2008). Except for 2006, PFM% increased and then decreased, and GE% decreased and then increased in the other periods.
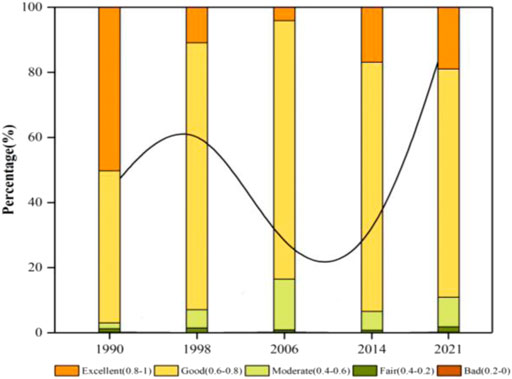
FIGURE 6. Area distribution of ecological environmental quality levels on Jianghan Plain from 1990 to 2021.
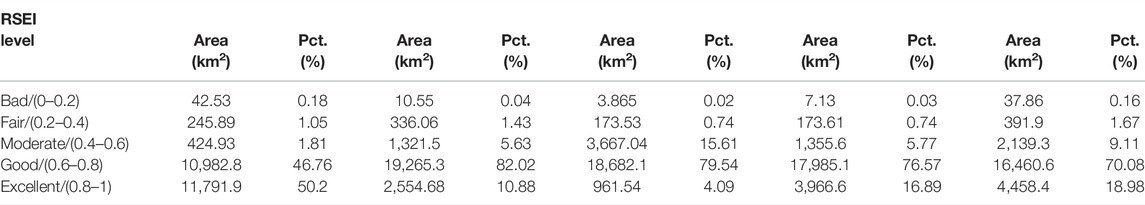
TABLE 4. Area and percentage changes of each RSEI level in different years.
Based on the results of the RSEI level grading in 1990, 1998, 2006, 2014, and 2021, the differences in RSEI performance and spatial and temporal area changes in ecological environmental quality on Jianghan Plain are shown in Table 5. The differences in changes were calculated for four periods (1990–1998, 1998–2006, 2006–2014, and 2014–2021). The results were classified into five classes: improvement obvious (IO), improvement slight (IS), invariability (IN), deterioration slight (DS), and deterioration obvious (DO). The results show that the ecological environmental quality was stable in most areas of Jianghan Plain, with the largest proportion of IN levels in each period being 51.38, 71.59, 67.14, and 64.38%, respectively. The proportion of IO and DO change levels was less than 1%, indicating that there was no significant change in ecological environmental quality from 1990 to 2021. The proportions of IS in the four periods were 3.59, 6.60, 26.64, and 16.70%, with the largest percentage in 2006–2014, and 44.86, 21.48, 6.21, and 18.75% in the four periods for DS, respectively, with a decreasing trend in 1990–2014, followed by an increasing trend in 2014–2021. The main reason for this was that the increase in urbanization and the expansion of urban areas led to the deterioration, followed by an improvement in ecological environmental quality on Jianghan Plain.
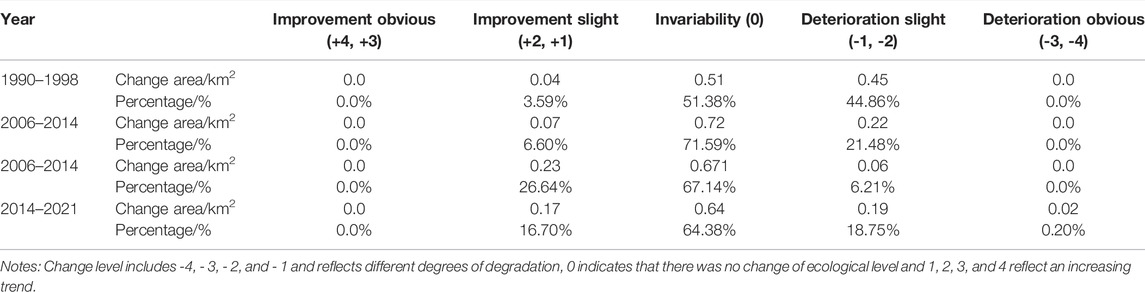
TABLE 5. Change detection of the RSEI level from 1990 to 2021.
The size of global spatial autocorrelation indicates the spatial convergence of eco-environmental quality in Jianghan Plain. Figure 7 is Moran’s I scatter diagram of eco-environmental quality in Jianghan Plain. The horizontal axis represents the eco-environmental quality index, and the vertical axis represents the spatial matrix weight of eco-environmental quality. Both of them have been standardized, and the slash represents the linear correlation between them. The slope of the slash (Moran’s I) indicates the global autocorrelation of the eco-environmental quality. As can be seen from Figure 7, Moran’s I indexes from 1990 to 2021 are 0.531, 0.529, 0.525, 0.540, and 0.545, respectively, indicating that the spatial distribution of the eco-environmental quality in Jianghan Plain is positively correlated, that is, the eco-environmental quality in Jianghan Plain does not show complete randomness in space. However, it shows strong spatial aggregation, and its spatial connection characteristics are the sampling grid with high ecological environment quality tends to be adjacent to the sampling grid with high ecological environment quality, and the sampling grid with low ecological environment quality tends to be adjacent to the sampling grid with low ecological environment quality. The calculation shows that Moran’s I showed a gradual downward trend from 1990 to 2006. Then it showed an upward trend from 2006 to 2021, of which Jianghan Plain had the strongest positive correlation in 2021. The changing trend of local clustering is consistent with the changing trend of the eco-environmental quality level in Figure 6.

FIGURE 7. Moran’s I of the RSEI on the Jianghan Plain from 1990 to 2021.
Local autocorrelation statistical variables can identify different spatial correlation patterns (or aggregation patterns) that may exist in different spatial locations, so as to observe the local instability of space and find the spatial heterogeneity between data. The local spatial autocorrelation is represented by Moran's I scatter diagram. In Figure 7, the first and third quadrants of Moran's I scatter diagram from 1990 to 2021 represent positive spatial correlation, and the second and fourth quadrants represent negative spatial correlation. Among them, the first quadrant represents the coverage of high-high units of ecological environment quality (H-H), the second quadrant represents that low-high units of ecological environment quality are covered by low-high units of ecological environment quality (L-H), the third quadrant represents that low-low units are covered by low-low units (L-L), and the fourth quadrant represents that high-low units are covered by high-low units (H-L). This paper uses geoda9 5 analyze the local spatial autocorrelation Lisa value of ecological environment quality of 3364 sampling grids in Jianghan Plain, as shown in Figure 8.
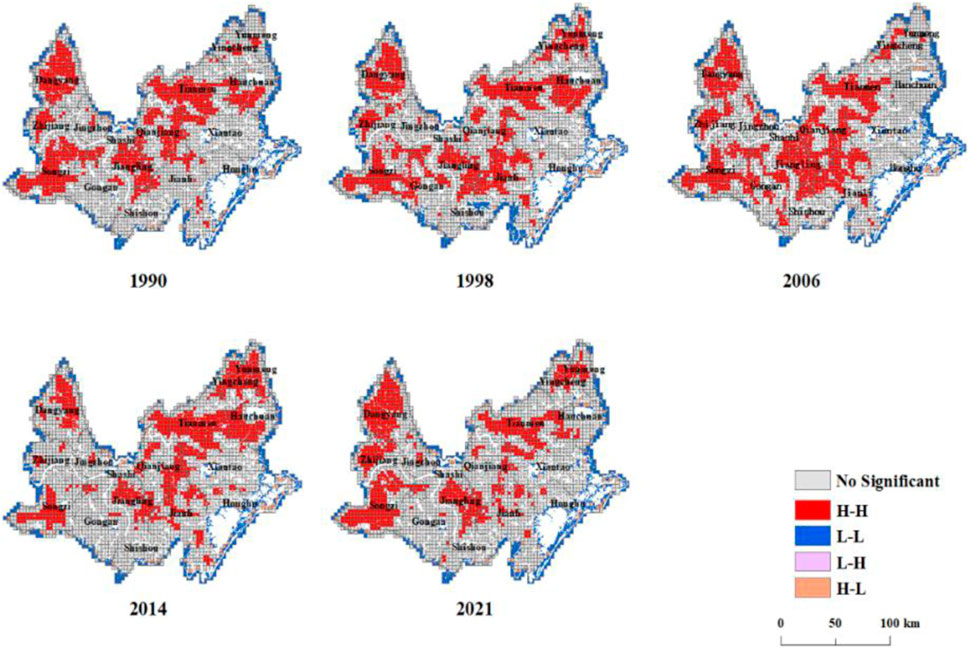
FIGURE 8. LISA of the RSEI on the Jianghan Plain from 1990 to 2021.
The LISA map of eco-environmental quality index of Jianghan Plain from 1999 to 2021 shows that it is not significant, and it is mainly distributed in some counties and districts of Jianghan Plain, such as Gongan County. H-H cluster areas are mainly distributed in the north and northwest. From 1990 to 2021, the grid cluster of the H-H cluster area with Jiangling County as the central area increased significantly, the cluster centers increased, and the ecological environment was better. The agglomeration area of L-L is mainly distributed around Honghu city in the east of Jianghan Plain. The reason is that this area is close to the metropolis Wuhan, with a dense population and frequent human activities, but the overall agglomeration characteristics have little change. After 1998, L-L cluster areas continued to increase, mainly due to the deterioration of ecological environmental quality caused by the accelerated development of urbanization. The analysis shows that the H-H of the urban edge is high, and the L-L of the urban edge is low. The spatial agglomeration characteristics of the eco-environmental quality of Jianghan Plain are affected by the landform and socioeconomic development to a certain extent. These reflect the characteristics of natural and socioeconomic development of Jianghan Plain to a certain extent. The agglomeration characteristics of LISA of eco-environmental quality in this study are consistent with the actual situation of Jianghan Plain.
Based on the RSEI model, the eco-environmental quality of Jianghan Plain from 1990 to 2021 is evaluated and monitored, which largely avoids the influence of human factors, comprehensively and objectively reflects the spatial distribution pattern and evolution trend of eco-environmental quality in Jianghan Plain in the past 31 years and reveals the eco-environmental quality and changes of cities and counties under the original jurisdiction of Jianghan Plain. It verifies the effect of ecological construction in Jianghan Plain and provides a scientific basis for ecological environmental protection and sustainable development in the next stage of Jianghan Plain. From the evaluation of the eco-environmental quality of Jianghan Plain, the overall eco-environmental quality of Jianghan Plain has been significantly improved in the past 31 years, which is consistent with the research conclusion of Su et al. (2021) and Jie et al. (2010) on the ecological comprehensive index of Jianghan Plain. From the evaluation of the eco-environmental quality of each district, city, and county in Jianghan Plain, the improvement of eco-environmental quality of each district, city, and county benefits from the relevant systems and regulations of “eco-environmental protection of the Yangtze River Economic Belt.” Ecological priority and green development. Respect the laws of nature, adhere to the sustainable development concept of “green water and green mountains are golden mountains and silver mountains,” and strengthen the management of urban land resource development and comprehensive monitoring of soil and water loss. We should pay attention to the management and restoration of mountains, water, forests, fields, lakes, grass, and sand, which is helpful to improve the quality of the ecological environment and is very important to further promote the good relationship between man and nature (Huang W et al., 2021; Zhao et al., 2021).
The novelty of this study is the setting of time thresholds for remote sensing images of Jianghan Plain for each year over 31 years to screen the annual cloud-free or lowest cloud images by using cloud removal and image median equalization to improve the original image quality and make the annual RSEI calculation more realistic and objective. In addition, the spatial autocorrelation of ecological environmental quality on Jianghan Plain was analyzed. Although our method demonstrated its effectiveness in the evaluation of spatial and temporal changes in ecological environmental quality, its limitations will be further overcome in future studies. For example, it is still debatable whether the four ecological environmental indicators of the remote sensing ecological index can represent the regional ecological quality comprehensively, and the addition of other indicators about the ecological environment can be considered for optimization in future studies, which is consistent with the direction of improvement of the RSEI in the future. Second, the relationship between ecological environmental quality and land use change needs to be further analyzed, considering the various impacts of land use change on the ecological environment and the trade-off between development strategies and environmental protection in the Yangtze River Economic Belt.
Based on the GEE platform and Landsat 5/TM and Landsat 8/OLI remote sensing data, the spatial and temporal dynamics of ecological and environmental quality on Jianghan Plain for the past 31 years were analyzed by using the RSEI, and the spatial differentiation characteristics of ecological and environmental quality on Jianghan Plain were explored. The results showed that the mean RSEI values in 1990, 1998, 2006, 2014, and 2021 were 0.667, 0.636, 0.599, 0.621, and 0.648, respectively. The overall ecological environmental quality was at a good level, with the largest invariance percentages in each time period being 51.38, 71.59, 67.14, and 64.38%, respectively, and the degradation was most serious in 1990–1998, accounting for 44.86% of the total area, and it improved the most in 2006–2014, accounting for 26.64% of the total area. Moran’s I values of ecological environmental quality in 1990, 1998, 2006, 2014, and 2021 were 0.531, 0.529, 0.525, 0.540, 0.545, and 0.545, respectively. It shows that the spatial distribution of ecological environment quality in the study area is positively correlated, with the H-H clusters on Jianghan Plain mainly distributed in the northern and western regions and the L-L clusters mainly distributed in the densely populated eastern regions with frequent human activities. In this study, we used Landsat images to construct the RSEI on the GEE platform, and the research method could assess the spatial and temporal changes in ecological and environmental quality on Jianghan Plain. In the future, combining this method, we can further explore the relationship between human activities and ecosystems more comprehensively and deeply from land use change and population and economic development perspectives.
The original contributions presented in the study are included in the article/Supplementary Material, further inquiries can be directed to the corresponding author.
Conceptualization, methodology, software, validation, formal analysis, data curation, writing—original draft preparation, visualization, and writing—editing: WR and HP. Project administration, funding, and review: WR and XZ. All authors have read and agreed to the published version of the manuscript.
This research was supported by the research is supported by the National Natural Science Foundation of China (grant number 42071455), the special scientific research project of Hubei Provincial Land Consolidation Center in 2021, and the special scientific research project of Hubei Research Station for Integrated Land Remediation and Restoration in Jianghan Plain in 2021.
The authors declare that the research was conducted in the absence of any commercial or financial relationships that could be construed as a potential conflict of interest.
All claims expressed in this article are solely those of the authors and do not necessarily represent those of their affiliated organizations, or those of the publisher, the editors, and the reviewers. Any product that may be evaluated in this article, or claim that may be made by its manufacturer, is not guaranteed or endorsed by the publisher.
Ariken, M., Zhang, F., Liu, K., Fang, C., and Kung, H.-T. (2020). Coupling Coordination Analysis of Urbanization and Eco-Environment in Yanqi Basin Based on Multi-Source Remote Sensing Data. Ecol. Indicators 114, 106331. doi:10.1016/j.ecolind.2020.106331
Baig, M. H. A., Zhang, L., Shuai, T., and Tong, Q. (2014). Derivation of a Tasselled Cap Transformation Based on Landsat 8 At-Satellite Reflectance. Remote Sensing Lett. 5, 423–431. doi:10.1080/2150704X.2014.915434
Bi, X., Chang, B., Hou, F., Yang, Z., Fu, Q., and Li, B. (2021). Assessment of Spatio-Temporal Variation and Driving Mechanism of Ecological Environment Quality in the Arid Regions of central Asia, Xinjiang. Ijerph 18, 7111. doi:10.3390/ijerph18137111
Boori, M. S., Choudhary, K., Paringer, R., and Kupriyanov, A. (2021). Spatiotemporal Ecological Vulnerability Analysis with Statistical Correlation Based on Satellite Remote Sensing in Samara, Russia. J. Environ. Manage. 285, 112138. doi:10.1016/j.jenvman.2021.112138
Chander, G., Markham, B. L., and Helder, D. L. (2009). Summary of Current Radiometric Calibration Coefficients for Landsat MSS, TM, ETM+, and EO-1 ALI Sensors. Remote Sensing Environ. 113, 893–903. doi:10.1016/j.rse.2009.01.007
Degefu, M. A., Argaw, M., Feyisa, G. L., and Degefa, S. (2021). Dynamics of Urban Landscape Nexus Spatial Dependence of Ecosystem Services in Rapid Agglomerate Cities of Ethiopia. Sci. Total Environ. 798, 149192. doi:10.1016/j.scitotenv.2021.149192
Feng, Y., He, S., and Li, G. (2021). Interaction between Urbanization and the Eco-Environment in the Pan-Third Pole Region. Sci. Total Environ. 789, 148011. doi:10.1016/j.scitotenv.2021.148011
Ferrario, F., Johnson, L. E., McKindsey, C. W., and Archambault, P. (2021). Ecosystem-Based Quality Index in a Harbor bay: Assessing the Status of a Heterogeneous System in a Functional Framework at a Local Scale. Ecol. Indicators 132, 108260. doi:10.1016/j.ecolind.2021.108260
Foga, S., Scaramuzza, P. L., Guo, S., Zhu, Z., Dilley, R. D., Beckmann, T., et al. (2017). Cloud Detection Algorithm Comparison and Validation for Operational Landsat Data Products. Remote Sensing Environ. 194, 379–390. doi:10.1016/j.rse.2017.03.026
Gao, W., Zhang, S., Rao, X., Lin, X., and Li, R. (2021). Landsat TM/OLI-based Ecological and Environmental Quality Survey of Yellow River basin, Inner Mongolia Section. Remote Sensing 13, 4477. doi:10.3390/rs13214477
Gomis-Cebolla, J., Jimenez, J. C., and Sobrino, J. A. (2018). LST Retrieval Algorithm Adapted to the Amazon evergreen Forests Using MODIS Data. Remote Sensing Environ. 204, 401–411. doi:10.1016/j.rse.2017.10.015
Han, Z., Jiao, S., Zhang, X., Xie, F., Ran, J., Jin, R., et al. (2021). Seeking Sustainable Development Policies at the Municipal Level Based on the Triad of City, Economy and Environment: Evidence from Hunan Province, China. J. Environ. Manage. 290, 112554. doi:10.1016/j.jenvman.2021.112554
He, G., Bao, K., Wang, W., Zhu, Y., Li, S., and Jin, L. (2021). Assessment of Ecological Vulnerability of Resource-Based Cities Based on Entropy-Set Pair Analysis. Environ. Tech. 42, 1874–1884. doi:10.1080/09593330.2019.1683611
Hu, X., and Xu, H. (2019). A New Remote Sensing index Based on the Pressure-State-Response Framework to Assess Regional Ecological Change. Environ. Sci. Pollut. Res. 26, 5381–5393. doi:10.1007/s11356-018-3948-0
Hu, X., and Xu, H. (2018). A New Remote Sensing index for Assessing the Spatial Heterogeneity in Urban Ecological Quality: A Case from Fuzhou City, China. Ecol. Indicators 89, 11–21. doi:10.1016/j.ecolind.2018.02.006
Huang, C., Li, X.-F., and You, Z. (2021). The Impacts of Urban Manufacturing Agglomeration on the Quality of Water Ecological Environment Downstream of the Three Gorges Dam. Front. Ecol. Evol. 8, 612883. doi:10.3389/fevo.2020.612883
Huang, W., Duan, W., and Chen, Y. (2021). Rapidly Declining Surface and Terrestrial Water Resources in Central Asia Driven by Socio-Economic and Climatic Changes. Sci. Total Environ. 784, 147193. doi:10.1016/j.scitotenv.2021.147193
Imhoff, M. L., Zhang, P., Wolfe, R. E., and Bounoua, L. (2010). Remote Sensing of the Urban Heat Island Effect across Biomes in the continental USA. Remote Sensing Environ. 114, 504–513. doi:10.1016/j.rse.2009.10.008
Jie, L., Jing, Y., Wang, Y., and Shu-Xia, Y. (2010). Environmental Impact Assessment of Land Use Planning in Wuhan City Based on Ecological Suitability Analysis. Proced. Environ. Sci. 2, 185–191. doi:10.1016/j.proenv.2010.10.022
Jing, Y., Zhang, F., He, Y., Kung, H.-t., Johnson, V. C., and Arikena, M. (2020). Assessment of Spatial and Temporal Variation of Ecological Environment Quality in Ebinur Lake Wetland National Nature Reserve, Xinjiang, China. Ecol. Indicators 110, 105874. doi:10.1016/j.ecolind.2019.105874
Karimi Firozjaei, M., Fathololoumi, S., Kiavarz, M., Biswas, A., Homaee, M., and Alavipanah, S. K. (2021). Land Surface Ecological Status Composition Index (LSESCI): A Novel Remote Sensing-Based Technique for Modeling Land Surface Ecological Status. Ecol. Indicators 123, 107375. doi:10.1016/j.ecolind.2021.107375
Khan, I., Hou, F., and Le, H. P. (2021). The Impact of Natural Resources, Energy Consumption, and Population Growth on Environmental Quality: Fresh Evidence from the United States of America. Sci. Total Environ. 754, 142222. doi:10.1016/j.scitotenv.2020.142222
Liaqat, M. U., Cheema, M. J. M., Huang, W., Mahmood, T., Zaman, M., and Khan, M. M. (2017). Evaluation of MODIS and Landsat Multiband Vegetation Indices Used for Wheat Yield Estimation in Irrigated Indus Basin. Comput. Electron. Agric. 138, 39–47. doi:10.1016/j.compag.2017.04.006
Liu, C., Yang, M., Hou, Y., Zhao, Y., and Xue, X. (2021). Spatiotemporal Evolution of Island Ecological Quality under Different Urban Densities: A Comparative Analysis of Xiamen and Kinmen Islands, Southeast China. Ecol. Indicators 124, 107438. doi:10.1016/j.ecolind.2021.107438
Liu, Q. (2021). RETRACTED ARTICLE: Application of Remote Sensing and GIS Technology in Urban Ecological Environment Investigation. Arab J. Geosci. 14, 1743. doi:10.1007/s12517-021-08118-8
Liu, X., Hu, G., Chen, Y., Li, X., Xu, X., Li, S., et al. (2018). High-resolution Multi-Temporal Mapping of Global Urban Land Using Landsat Images Based on the Google Earth Engine Platform. Remote Sensing Environ. 209, 227–239. doi:10.1016/j.rse.2018.02.055
Neteler, M. (2010). Estimating Daily Land Surface Temperatures in Mountainous Environments by Reconstructed MODIS LST Data. Remote Sensing 2, 333–351. doi:10.3390/rs1020333
Nie, X., Hu, Z., Zhu, Q., and Ruan, M. (2021). Research on Temporal and Spatial Resolution and the Driving Forces of Ecological Environment Quality in Coal Mining Areas Considering Topographic Correction. Remote Sensing 13, 2815–2822. doi:10.3390/rs13142815
Ning, L., Jiayao, W., and Fen, Q. (2020). The Improvement of Ecological Environment index Model RSEI. Arab. J. Geosci. 13, 403. doi:10.1007/s12517-020-05414-7
Polevshchikova, I. (2019). Disturbance Analyses of forest Cover Dynamics Using Remote Sensing and GIS. IOP Conf. Ser. Earth Environ. Sci. 316, 012053. Institute of Physics Publishing. doi:10.1088/1755-1315/316/1/012053
Qureshi, S., Alavipanah, S. K., Konyushkova, M., Mijani, N., Fathololomi, S., Firozjaei, M. K., et al. (2020). A Remotely Sensed Assessment of Surface Ecological Change over the Gomishan Wetland, Iran. Remote Sensing 12, 2989. doi:10.3390/RS12182989
Seelen, L. M. S., Teurlincx, S., Bruinsma, J., Huijsmans, T. M. F., van Donk, E., Lürling, M., et al. (2021). The Value of Novel Ecosystems: Disclosing the Ecological Quality of Quarry Lakes. Sci. Total Environ. 769, 144294. doi:10.1016/j.scitotenv.2020.144294
Shao, Z., Fu, H., Li, D., Altan, O., and Cheng, T. (2019). Remote Sensing Monitoring of Multi-Scale Watersheds Impermeability for Urban Hydrological Evaluation. Remote Sensing Environ. 232, 111338. doi:10.1016/j.rse.2019.111338
Shi, K., Yu, B., Zhou, Y., Chen, Y., Yang, C., Chen, Z., et al. (2019). Spatiotemporal Variations of CO2 Emissions and Their Impact Factors in China: A Comparative Analysis between the Provincial and Prefectural Levels. Appl. Energ. 233-234, 170–181. doi:10.1016/j.apenergy.2018.10.050
Su, X., Zhou, Y., and Li, Q. (2021). Designing Ecological Security Patterns Based on the Framework of Ecological Quality and Ecological Sensitivity: A Case Study of Jianghan Plain, China. Int. J. Environ. Res. Public Health 18, 8383. doi:10.3390/ijerph18168383
Su, X., Shen, Y., Xiao, Y., Liu, Y., Cheng, H., Wan, L., et al. (2022). Identifying Ecological Security Patterns Based on Ecosystem Services Is a Significative Practice for Sustainable Development in Southwest China. Front. Ecol. Evol. 9, 1–13. doi:10.3389/fevo.2021.810204
Tamiminia, H., Salehi, B., Mahdianpari, M., Quackenbush, L., Adeli, S., and Brisco, B. (2020). Google Earth Engine for Geo-Big Data Applications: A Meta-Analysis and Systematic Review. ISPRS J. Photogrammetry Remote Sensing 164, 152–170. doi:10.1016/j.isprsjprs.2020.04.001
Tang, P., Huang, J., Zhou, H., Fang, C., Zhan, Y., and Huang, W. (2021). Local and Telecoupling Coordination Degree Model of Urbanization and the Eco-Environment Based on RS and GIS: A Case Study in the Wuhan Urban Agglomeration. Sustain. Cities Soc. 75, 103405. doi:10.1016/j.scs.2021.103405
Vermote, E., Justice, C., Claverie, M., and Franch, B. (2016). Preliminary Analysis of the Performance of the Landsat 8/OLI Land Surface Reflectance Product. Remote Sensing Environ. 185, 46–56. doi:10.1016/j.rse.2016.04.008
Wang, C., Jia, M., Chen, N., and Wang, W. (2018). Long-term Surface Water Dynamics Analysis Based on Landsat Imagery and the Google Earth Engine Platform: A Case Study in the Middle Yangtze River Basin. Remote Sensing 10, 1635. doi:10.3390/rs10101635
Wang, L., Li, L., Cheng, K., and Pan, G. (2019). Comprehensive Evaluation of Environmental Footprints of Regional Crop Production: A Case Study of Chizhou City, China. Ecol. Econ. 164, 106360. doi:10.1016/j.ecolecon.2019.106360
Wu, T., Sang, S., Wang, S., Yang, Y., and Li, M. (2020). Remote Sensing Assessment and Spatiotemporal Variations Analysis of Ecological Carrying Capacity in the Aral Sea Basin. Sci. Total Environ. 735, 139562. doi:10.1016/j.scitotenv.2020.139562
Xiong, Y., Xu, W., Huang, S., Wu, C., Dai, F., Wang, L., et al. (2020). Ecological Environment Quality Assessment of Xishuangbanna Rubber Plantations Expansion (1995-2018) Based on Multi-Temporal Landsat Imagery and RSEI. Geocarto Int., 1–23. doi:10.1080/10106049.2020.1861663
Xiong, Y., Xu, W., Lu, N., Huang, S., Wu, C., Wang, L., et al. (2021). Assessment of Spatial-Temporal Changes of Ecological Environment Quality Based on RSEI and GEE: A Case Study in Erhai Lake Basin, Yunnan Province, China. Ecol. Indicators 125, 107518. doi:10.1016/j.ecolind.2021.107518
Xu, D., Yang, F., Yu, L., Zhou, Y., Li, H., Ma, J., et al. (2021). Quantization of the Coupling Mechanism between Eco-Environmental Quality and Urbanization from Multisource Remote Sensing Data. J. Clean. Prod. 321, 128948. doi:10.1016/j.jclepro.2021.128948
Xu, H. (2008). A New index for Delineating Built‐up Land Features in Satellite Imagery. Int. J. Remote Sensing 29, 4269–4276. doi:10.1080/01431160802039957
Xu, H., Wang, Y., Guan, H., Shi, T., and Hu, X. (2019). Detecting Ecological Changes with a Remote Sensing Based Ecological index (RSEI) Produced Time Series and Change Vector Analysis. Remote Sensing 11, 2345. doi:10.3390/rs11202345
Yu, B. (2021). Ecological Effects of New-type Urbanization in China. Renew. Sustain. Energ. Rev. 135, 110239. doi:10.1016/j.rser.2020.110239
Yuan, B., Fu, L., Zou, Y., Zhang, S., Chen, X., Li, F., et al. (2021). Spatiotemporal Change Detection of Ecological Quality and the Associated Affecting Factors in Dongting Lake Basin, Based on RSEI. J. Clean. Prod. 302, 126995. doi:10.1016/j.jclepro.2021.126995
Yue, H., Liu, Y., Li, Y., and Lu, Y. (2019). Eco-Environmental Quality Assessment in China's 35 Major Cities Based on Remote Sensing Ecological Index. IEEE Access 7, 51295–51311. doi:10.1109/ACCESS.2019.2911627
Zhang, D., and Zhang, B. (2008). Diagnostic Analyses of an Abrupt Torrential Rain at Jianghan Plain. Torrential Rain Disaster 02, 121–126. (In Chinese). doi:10.3969/j.issn.1004-9045.2008.02.005
Zhang, S., Yang, P., Xia, J., Qi, K., Wang, W., Cai, W., et al. (2021). Research and Analysis of Ecological Environment Quality in the Middle Reaches of the Yangtze River Basin between 2000 and 2019. Remote Sensing 13, 4475. doi:10.3390/rs13214475
Zhao, Z., Sharifi, A., Dong, X., Shen, L., and He, B.-J. (2021). Spatial Variability and Temporal Heterogeneity of Surface Urban Heat Island Patterns and the Suitability of Local Climate Zones for Land Surface Temperature Characterization. Remote Sensing 13, 4338. doi:10.3390/rs13214338
Zhou, Y., Dong, J., Xiao, X., Liu, R., Zou, Z., Zhao, G., et al. (2019a). Continuous Monitoring of lake Dynamics on the Mongolian Plateau Using All Available Landsat Imagery and Google Earth Engine. Sci. Total Environ. 689, 366–380. doi:10.1016/j.scitotenv.2019.06.341
Zhou, Y., Kong, Y., Sha, J., and Wang, H. (2019b). The Role of Industrial Structure Upgrades in Eco-Efficiency Evolution: Spatial Correlation and Spillover Effects. Sci. Total Environ. 687, 1327–1336. doi:10.1016/j.scitotenv.2019.06.182
Zhu, D., Chen, T., Zhen, N., and Niu, R. (2020). Monitoring the Effects of Open-Pit Mining on the Eco-Environment Using a Moving Window-Based Remote Sensing Ecological index. Environ. Sci. Pollut. Res. 27, 15716–15728. doi:10.1007/s11356-020-08054-2
Keywords: ecological environmental assessment, temporal and spatial variation, remote sensing ecological index (RSEI), Google Earth Engine (GEE), Jianghan Plain
Citation: Ren W, Zhang X and Peng H (2022) Evaluation of Temporal and Spatial Changes in Ecological Environmental Quality on Jianghan Plain From 1990 to 2021. Front. Environ. Sci. 10:884440. doi: 10.3389/fenvs.2022.884440
Received: 26 February 2022; Accepted: 28 March 2022;
Published: 16 May 2022.
Edited by:
Wenting Zhang, Huazhong Agricultural University, ChinaReviewed by:
Sanwei He, Zhongnan University of Economics and Law, ChinaCopyright © 2022 Ren, Zhang and Peng. This is an open-access article distributed under the terms of the Creative Commons Attribution License (CC BY). The use, distribution or reproduction in other forums is permitted, provided the original author(s) and the copyright owner(s) are credited and that the original publication in this journal is cited, in accordance with accepted academic practice. No use, distribution or reproduction is permitted which does not comply with these terms.
*Correspondence: Xuesong Zhang, emhhbmd4dWVzb25nQG1haWwuY2NudS5lZHUuY24=
Disclaimer: All claims expressed in this article are solely those of the authors and do not necessarily represent those of their affiliated organizations, or those of the publisher, the editors and the reviewers. Any product that may be evaluated in this article or claim that may be made by its manufacturer is not guaranteed or endorsed by the publisher.
Research integrity at Frontiers
Learn more about the work of our research integrity team to safeguard the quality of each article we publish.