 Mujibur Rahman1,2Yanhui Wang2*Kebin Zhang1Bilal Ahmad1,2,3Ashfaq Ali4Adnan Ahamd5Dost Muhammad6Muhammad Afzaal7Ziyou Zhang1,2Eve Bohnett8
- 1School of Soil and Water Conservation, Beijing Forestry University, Beijing, China
- 2Ecology and Nature Conservation Institute, Chinese Academy of Forestry, Beijing, China
- 3Institute of Agriculture Sciences and Forestry, University of Swat, Swat, Pakistan
- 4Department of Forestry, Range and Wildlife Management, Karakoram International University, Gilgit, Pakistan
- 5Department of Forestry, Shaheed Benazir Bhutto University, Sheringal, Pakistan
- 6Department of Soil and Environmental Sciences, The University of Agriculture Peshawar, Peshawar, Pakistan
- 7Department of Entomology, Faculty of Crop Protection, The University of Agriculture Peshawar, Peshawar, Pakistan
- 8Department of Landscape Architecture, University of Florida, Gainesville, FL, United States
Forests ecosystem plays a significant role in supplying multiple services given the unique properties of forest soils, in which the elements of C, N, and P are essential to support soil fertility and site productivity. However, soil properties at different soil depths between plantation forests (PF) and natural forests (NF) have not been well quantified. Therefore, the current study was carried out in the Qilian Mountains of northwest China to determine the difference between PF and NF in the soil properties, both physical (e.g., bulk density, BD) and chemical (e.g., pH value, the contents, stocks, and stoichiometry of soil organic carbon (SOC), total N (TN), and total P (TP)). Research analyzed soil samples at different depths (0–20, 20–40, 40–60, 60–80, and 80–100 cm). The results showed that the soils’ pH values and BD were significantly higher (p ≤ 0.05) in PF than in NF and increased with soil depth. The contents of SOC, TN, and TP decreased considerably with soil depth and then stabilized at the soil depth of 80–100 cm. The NF showed significantly higher (p ≤ 0.05) SOC, TN, and TP contents than PF, confirming that the soil quality of PF had not fully recovered yet. The stocks of SOC and TN quickly decreased with soil depth up to 40–60 cm and stabilized gradually. Additionally, the soil stoichiometry of C:P and N:P decreased significantly with rising soil depth, while the C:N ratio remained unchanged. The N:P and C:P ratios were lower in PF than in NF, while the C:N ratio was higher in PF than in NF. In conclusion, the results show that the soils of NF present significantly higher stocks of SOC and TN but lower (or nearly equal) TP stocks than PF (under the same age group and tree species composition). These results imply that maintaining NF and avoiding their replacement by PF can help keep higher soil quality and related ecosystem services.
Introduction
In global ecosystems, forest soil is a vital constituent as the primary source of plant nutrition. Carbon (C), nitrogen (N), and phosphorus (P) are the soil’s main nutritional and structural elements and the major limiting factors for global ecosystem health (Reed et al., 2015; Rahman et al., 2018). The stocks of total nitrogen (TN), total phosphorus (TP), soil organic carbon (SOC), and C:N:P stoichiometry are indicators of soil fertility and plant nutrient conditions (Sterner and Elser, 2002; Batjes, 2014; Ali et al., 2022). Researchers use stoichiometry frequently to associate plants with soil nutrients in various forest types (Moe et al., 2005; Liu et al., 2017; Yang et al., 2018). These nutrients continuously circulate among the soil depths through biogeochemical cycling, which confirms the even flow of energy and sustains the stability of ecosystems (Lü et al., 2017). However, some factors such as soil type, soil depths, forest types, forest conversion, and possibly forest species composition (Louman et al., 2010; Tadesse et al., 2014) can result in changes in the SOC, TN, and TP contents, stocks, and stoichiometry (Lin et al., 2018; Hu et al., 2019). Therefore, many studies showed a significant difference in the impact of the forest conversion between natural forest (NF) to plantation forest (PF) on the quality and quantity of SOC, TN, and TP (Guo et al., 2016; Lin et al., 2018; Ngaba et al., 2019). However, such studies were not carried out evenly among regions and are scarce in the dryland regions of the Qilian Mountains of northwest China, where plantation and natural forests exist in the same climatic zone.
In the last few decades, PF has sharply increased worldwide to meet the growing demand for domestic and industrial timber (Berthrong et al., 2009; Ahmad et al., 2018), slow down the increase of CO2 concentration in the atmosphere (Jackson et al., 2005; van Dijk and Keenan, 2007; Ahmad et al., 2021), protect soil against nutrient losses, and supply hydrological and many other ecosystem services. However, PF can alter the C, N, and P contents, stocks, and stoichiometry of forest soils due to changes in the species composition and many different stand structure parameters compared with surrounding or original natural forests (Wall and Hytönen, 2005; Freier et al., 2010; Ahmad et al., 2019), and the interferences of silviculture activities (Yang et al., 2005; Zheng et al., 2008). Such studies have reported significant effects of PF on physicochemical soil properties (Jackson et al., 2005; Berthrong et al., 2009; Laganiere et al., 2010). However, the research results are inconsistent, such as studies comparing non-forested lands to afforested lands from previous agricultural systems converted to plantations (Paul et al., 2002; Berthrong et al., 2009; Laganiere et al., 2010). Natural forests provide vital natural resources, goods, and services (Wang et al., 2020). It is of great value in soil–water conservation, adding C, N, and P to maintain and improve soil quality and fertility (Behera and Sahani, 2003; Ashagrie et al., 2005; Yang et al., 2005; Zheng et al., 2008). The NF can sustain the nutrient cycles of forest soils, especially SOC, TN, TP, and physicochemical soil properties such as BD and pH values (Han et al., 2019; Ngaba et al., 2019). Hence, questions have arisen about whether the PF can similarly provide beneficial soil properties after plantations (Gogoi et al., 2021).
NF is being converted into PF, especially in monoculture tree plantations worldwide, including in China (Chen et al., 2005). This transformation creates many problems and ultimately affects the physicochemical soil properties such as soil BD and pH value, the nutrient contents, stocks, and stoichiometry of SOC, TN, and TP (Yang et al., 2019; Sun et al., 2021; Yang et al., 2021). Furthermore, many studies demonstrated a considerable influence on soil properties, for example, when the broadleaved NF were converted to monoculture PF in subtropical China (Behera and Sahani, 2003; Chen et al., 2005; Lemma et al., 2006; Nsabimana et al., 2008). However, these results were not entirely reliable due to the interferences from the difference in age groups, tree species compositions (Yang et al., 2009; Wang et al., 2011), or climatic and site conditions. Hence, such studies recorded variations in soil properties after NF were transformed to PF but never reported the differences in soil properties between NF and PF with the same tree species composition (such as Picea crassifolia and Sabina przewalskii in the Qilian Mountains of northwest China) and age groups under the same topographic and climatic conditions. Therefore, the current study was carried out to assess variations and compare the physicochemical soils properties of PF and NF in the Qilian Mountains at soil depths within 0–100 cm.
Materials and Methods
Study Area
This study was conducted in the Qilian Mountains (Qifeng, Sidalong, and Xishui Forest Farms), Sunan Yugur Autonomous County (38°49′18.7″N 99°36′09.8″E), Zhangyi city, Gansu Province, northwest China (Figure 1). The elevation ranges from 2,450 to 3,300 m. The climate is arid and semi-arid, with mean annual precipitation of 410–540 mm, which increases with rising elevation (Wang et al., 2003). Most precipitation (86%) falls from May to September (Zhang et al., 2011). The mean annual air temperature varies from −0.3 to 8.1°C and decreases with rising elevation (Wang et al., 2009). The annual accumulated frost-free period is 127 days. About 60% of the daily photoperiodic is full sunshine, and the yearly pan evaporation is 1,785 mm (Yuan and Hou, 2015). The primary soil parent materials are slope deposits and residuals from limestone, shale, and conglomerate. The degree of downwards minerals transition was mostly indistinct/vague and obvious. The compactness was usually moderate, slightly loose, while less soils were compact and firmly loose. The soil structure was frequently massive or bulky and granular. The soil texture was commonly loam, sandy loam, and clay loam, while soil moisture was mostly moist/damp, but some soils were dry in the PF and NF.
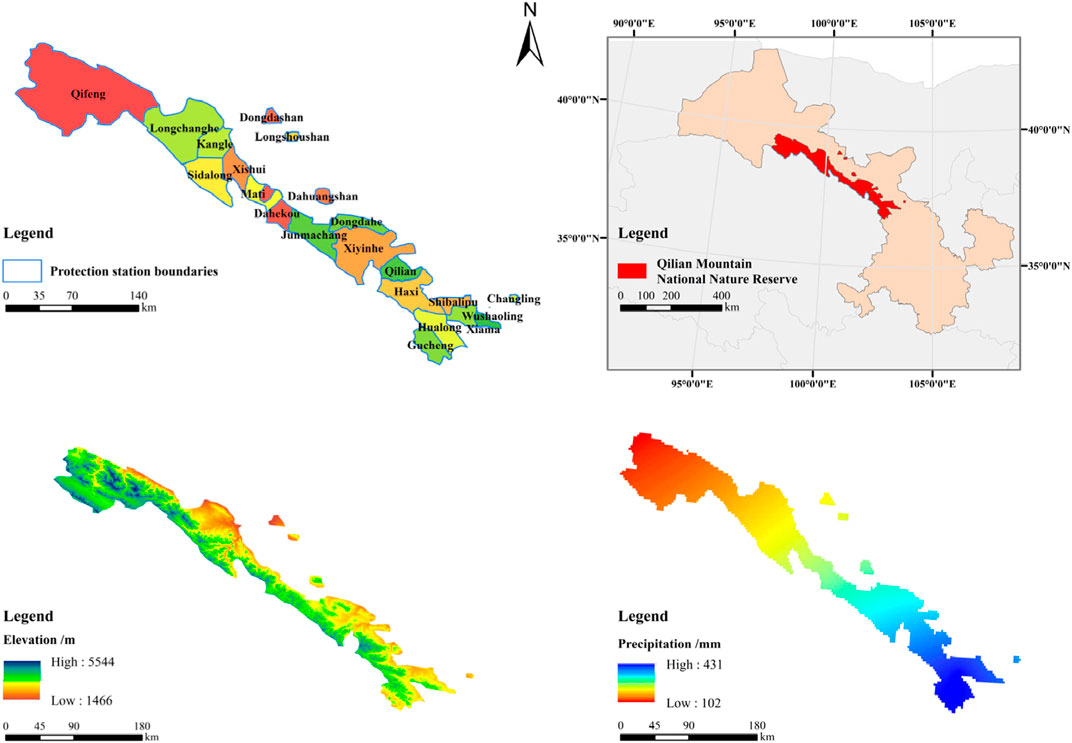
FIGURE 1. The geographic location of Qifeng, Xishui, and Sidalong Forest Farms in the National Nature Reserve of Qilian Mountains with the elevation and annual precipitation maps.
Most of the forests belong to the natural forests of Qinghai spruce (Picea crassifolia), which grow on the shady and semi-shady slopes within the elevation range of 1,750–3,550 m (but concentrated within 2,200–3,200 m), and also the natural forests of Qilian juniper (Sabina przewalskii), which grow on the dry and sunny slopes within the elevation range of 2,600–4,000 m (Rong et al., 2019). At the same time, the adjacent PF was also dominated by Qinghai spruce and Qilian junipers. Both PF and NF belong to the middle-aged groups. There are rich ground mosses on the floor of spruce forests due to their unique habitat. The dominant shrubs and herbs species were Berberis diaphana, Caragana jubata, Salix sylvestris, Sabina procumbens, Dasiphora fruticose, Carex oshimensis, Potentilla fruticose, Polygonum viviparum, and Agropyron cristatum under both forest types. The average tree density of the surveyed plots was 1,163 and 1,332 trees ha−1 for PF and NF, respectively. The average tree height was 5.8 and 7.82 m, and tree DBH was 16.7 and 24.7 cm for PF and NF, respectively. Similarly, the average height of dominant trees was 8.77 and 12.5 m, and the canopy density was 42% and 39% for PF and NF, respectively (Table 1).
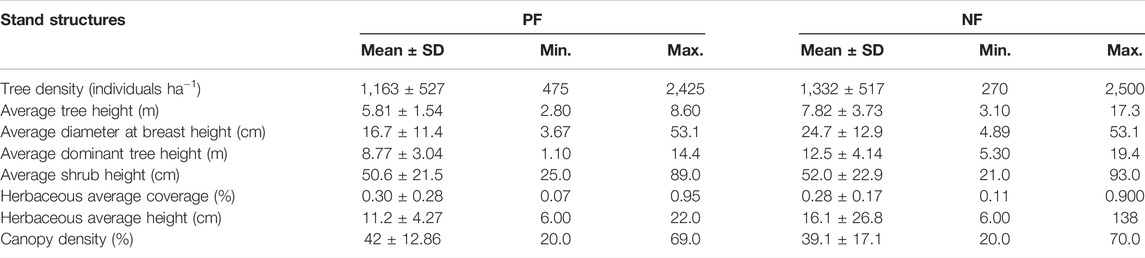
TABLE 1. The basic plant community properties of the PF and NF in the forest farms of Qilian Mountains.
Plot Setting and Soil Sampling
For both PF and NF, 46 sample plots were selected to investigate the physicochemical soil properties. The plot size was 20 m × 20 m, and a pit of 1 m2 was dug out at the forest floor and replicated three times for each soil profile. Each soil profile was classified into O, A, AB, B, BC, C, and other horizons, and a total of 230 soil samples (115 of each forest type) were collected. For physical analysis (soil bulk density, BD), the soil samples were collected at each soil depth using stainless-steel augers and oven-dried at 104°C for 48 h. The soil samples for chemical analysis were collected from the soil profiles using a multi-point mixed-method at the soil depths of 0–20, 20–40, 40–60, 60–80, and 80–100 cm. The litter, leaves, roots, insects, and larger residues were separated and removed. All soil samples were screened through a 2-mm sieve mesh. The soil samples were air-dried under the ceiling fan and stored at room temperature to determine physicochemical soil parameters. The stored soil samples were then analyzed with standard methods to determine the pH value, soil organic carbon (SOC), total N (TN), and total P (TP) contents and transformed into stocks (SOCs, TNs, TPs) and soil stoichiometry (C:N:P ratios) under the soil depth (SD) and forest types (FT).
Soil Chemical Analysis
The soil organic carbon content was determined by the K2Cr2O7–H2SO4 digestion method (Walkley, 1947). The content of total soil P was measured by dissolved nitric acid (NH3), perchloric acid digestion (HClO4), and hydrofluoric acid (HF) using an automated discontinuous analyzer. The content of total soil N was measured with a fully automatic Kjeldahl analyzer (dissolved by H2SO4 along with a catalyst). The soil pH value was measured with a pH-meter at 1:5 soil water suspension (Mclean, 1982).
Data Calculation and Statistical Analysis
The SOC stock at each soil depth was calculated as follows (Hu et al., 2018):
Similarly, the soil stocks of total N and P (TNs and TPs) were calculated using the above equation. Here, ST denotes the soil layer thickness (cm).
The data analysis was performed using one-way ANOVA (Analysis of Variance) to determine the impacts of FT and SD, respectively, on the physicochemical soil properties. Two-factor ANOVAs were conducted to investigate the impact of SD, FT, and their interactions on soil properties. The Tukey HSD all-pairwise comparison (least significant difference) test at p < 0.05 was used to compare the means. Origin Lab-2019 was used to evaluate the correlation between physicochemical soil parameters and perform the PCA (principal component analysis) for each forest type.
Results
Variation of BD and Soil pH Value with Soil Depth and Forest Types
The soil BD and pH values differed among soil depth and forest types significantly (p ≤ 0.05), showing an increase with rising soil depth for both forest types (Figure 2A). The mean BD of PF and NF increased from the lowest values of 0.833 and 0.813 at the topsoil depth (0–20 cm) to the highest values of 1.37 and 1.10 g cm−3 at the deepest soil depth (80–100 cm). Similarly, the pH values increased from 8.16 and 7.80 at the topsoil depth for PF and NF to 8.41 and 8.23 at the deepest soil depth (Figure 2B). The BD at all soil depths of PF was higher than those of NF, and this difference increased with rising soil depth, from 0.02 g cm−3 at the topsoil depth (0–20 cm) to 0.27 g cm−3 (based on the data pair) at the soil depth of 80–100 cm (Figure 2A).
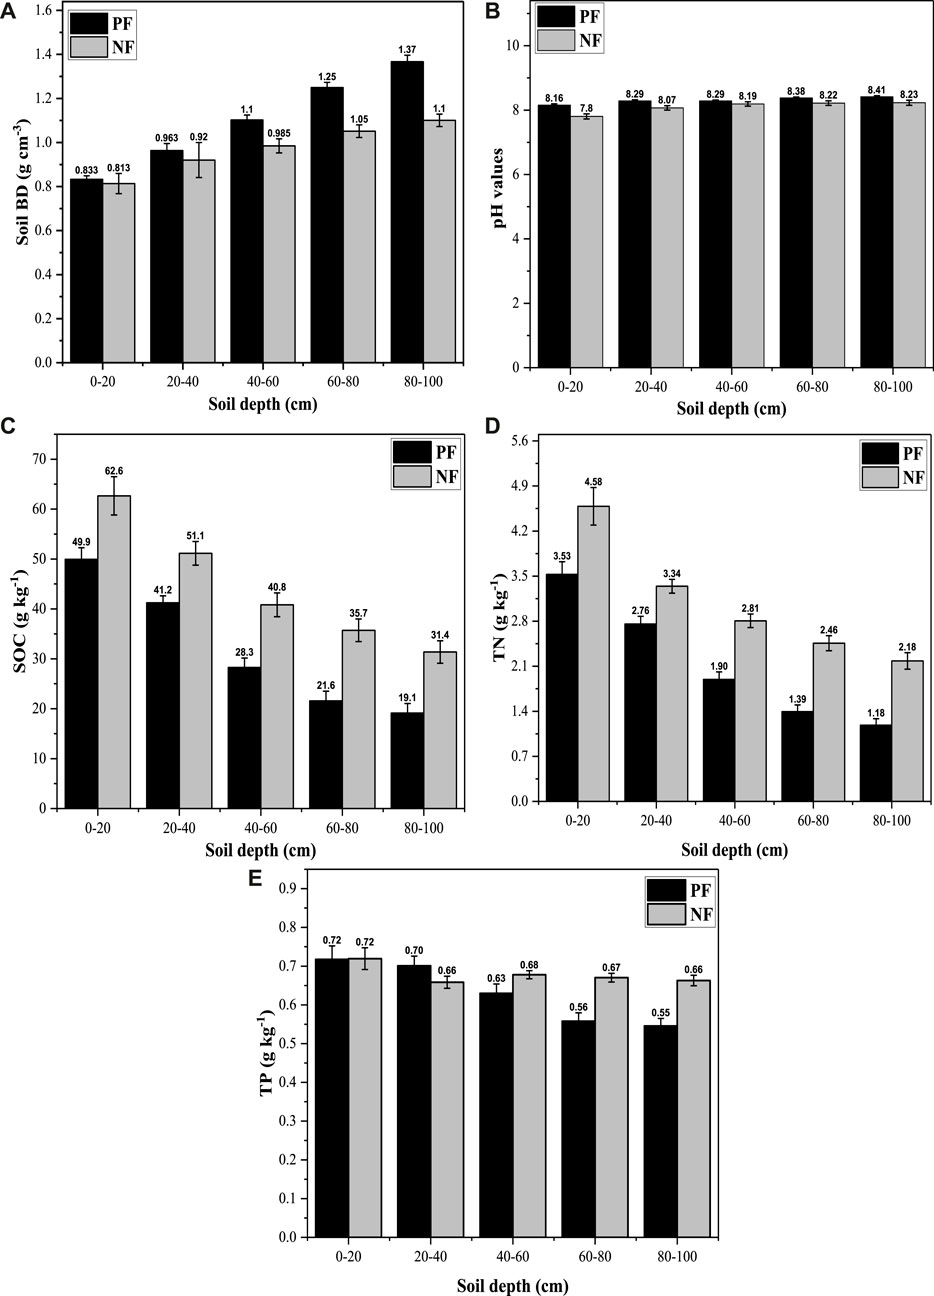
FIGURE 2. The physicochemical soil properties of different soil depths for PF and NF. The error bars represent standard error. The BD, SOC, TN, and TP indicate the soil bulk density, the contents of soil organic carbon, total nitrogen, and total phosphorus, respectively.
Similarly, the soil pH values at all soil depths of PF were higher than those of NF, but this difference decreased with rising soil depth, from 0.36 at the topsoil depth to 0.18 (based on the data pair) at the deepest soil depth (Figure 2B). The mean soil BD of 0–100 cm soil depth was 1.03 g cm−3 for PF, higher than the corresponding value of 0.97 g cm−3 for NF. Similarly, the mean soil pH value of 8.30 for 0–100 cm soil depth for PF was higher than the pH value of 8.10 for NF (Table 2).
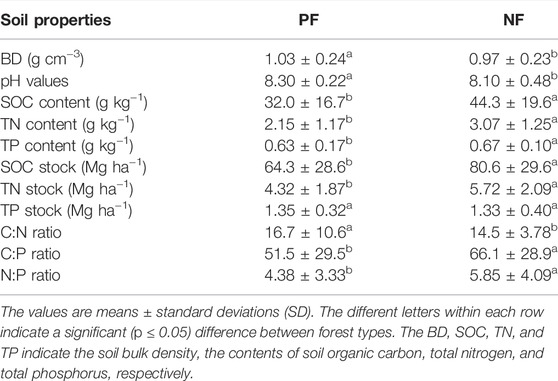
TABLE 2. The mean physicochemical soil properties of 0–100 cm soil depth for PF and NF.
Variation in SOC, TN, and TP Contents With Soil Depth and Forest Types
The contents of SOC, TN, and TP differed among soil depths (SD) and forest types (FT) significantly (p ≤ 0.05), showing a decrease with rising soil depth for both PF and NF. The SOC and TN contents at all soil depths of PF were lower than those of NF (Figures 2C, D). The difference in SOC content decreased from 12.7 g kg−1 (based on the data pair of 49.9 and 62.6 g kg−1) at the topsoil depth to 12.3 g kg−1 (based on the data pair of 19.1 and 31.4 g kg−1) at the deepest soil depth (Figure 2C). The mean SOC content of 0–100 cm soil depth for NF (44.3 g kg−1) was significantly (p ≤ 0.05) higher than that of PF (32.0 g kg−1) (Table 2). The difference in TN content decreased from 1.05 g kg−1 (based on the data pair of 3.53 and 4.58 g kg−1) at the topsoil depth to 1.00 g kg−1 (based on the data pair of 1.18 and 2.18 g kg−1) at the deepest soil depth (Figure 2D). The mean TN content of 0–100 cm soil depth for NF (3.07 g kg−1) was significantly higher (p ≤ 0.05) than that of PF (2.15 g kg−1) (Table 2).
The mean TP contents of PF and NF generally decreased from the highest values of 0.72 in both PF and NF at the topsoil depth to the lowest values of 0.55 and 0.66 at the deepest soil depth (Figure 2E). However, the variation pattern of TP content along soil depth differed from the continuously decreasing pattern of SOC and TN. For NF, the TP content declined non-significantly and leveled-off within the soil depth of 0–100 cm. For PF, the TP content decreased insignificantly within 0–40 cm and obviously within the depth of 60–100 cm; however, a significant difference existed only between 0–20 cm and 80–100 cm. The mean TP content of 0–100 cm for NF (0.67 g kg−1) was significantly higher than those of PF (0.63 g kg−1) (Table 2). At each soil depth, the percent contribution of overall average contents of SOC, TN, and TP was presented in Figure 4, showing a decrease in soil depth for PF and NF.
Variation in SOC, TN, and TP Stocks with Soil Depth and Forest Type
For both PF and NF, stocks of SOC and TN decreased significantly (p ≤ 0.05) in each soil depth, while that of TP increased (Figures 3A–C; Table 5). The highest SOC stocks, 82.6 and 96.8 Mg ha−1 for PF and NF, were at the topsoil depth (0–20 cm), and the lowest values, 48.4 and 66.7 Mg ha−1, were at the deepest soil depth (80–100 cm). Similarly, the maximum TN stocks of 5.83 and 7.19 Mg ha−1 for PF and NF were at the topsoil depth, while the lowest values of 3.02 and 4.73 Mg ha−1 were at the deepest soil depth. The TP stock was highest (1.47 Mg ha−1) for both PF and NF at the deepest soil depth, while the lowest values (1.19 Mg ha−1) for both PF and NF were at the topsoil depth. The SOC and TN stocks of NF were higher than PF at all soil depths. The SOC and TN stock differences between PF and NF increased with soil depth, from 14.2 and 1.36 Mg ha−1 in the topsoil depth to 18.3 and 1.71 Mg ha−1 (based on the data pair) at the deepest soil depth (Figures 3A, B). The average SOC stocks, 64.3 Mg ha−1 and 80.6 Mg ha−1 for PF and NF at soil depth (0–100 cm), showed that NF was significantly higher (p ≤ 0.05) (Table 2). Similarly, the average TN stocks, 4.32 Mg ha−1 and 5.72 Mg ha−1 for PF and NF at soil depth (0–100 cm), showed NF was significantly higher (p ≤ 0.05), while no significant difference existed for the TP stocks 1.35 Mg ha−1 and 1.33 Mg ha−1 for PF and NF at soil depth (0–100 cm) (Table 2). The percent contribution of SOC and TN stocks of each soil depth to their total stocks over 0–100 cm soil depth decreased with rising soil depth for both PF and NF, but increased in the case of TP stock (Figures 4B, E).
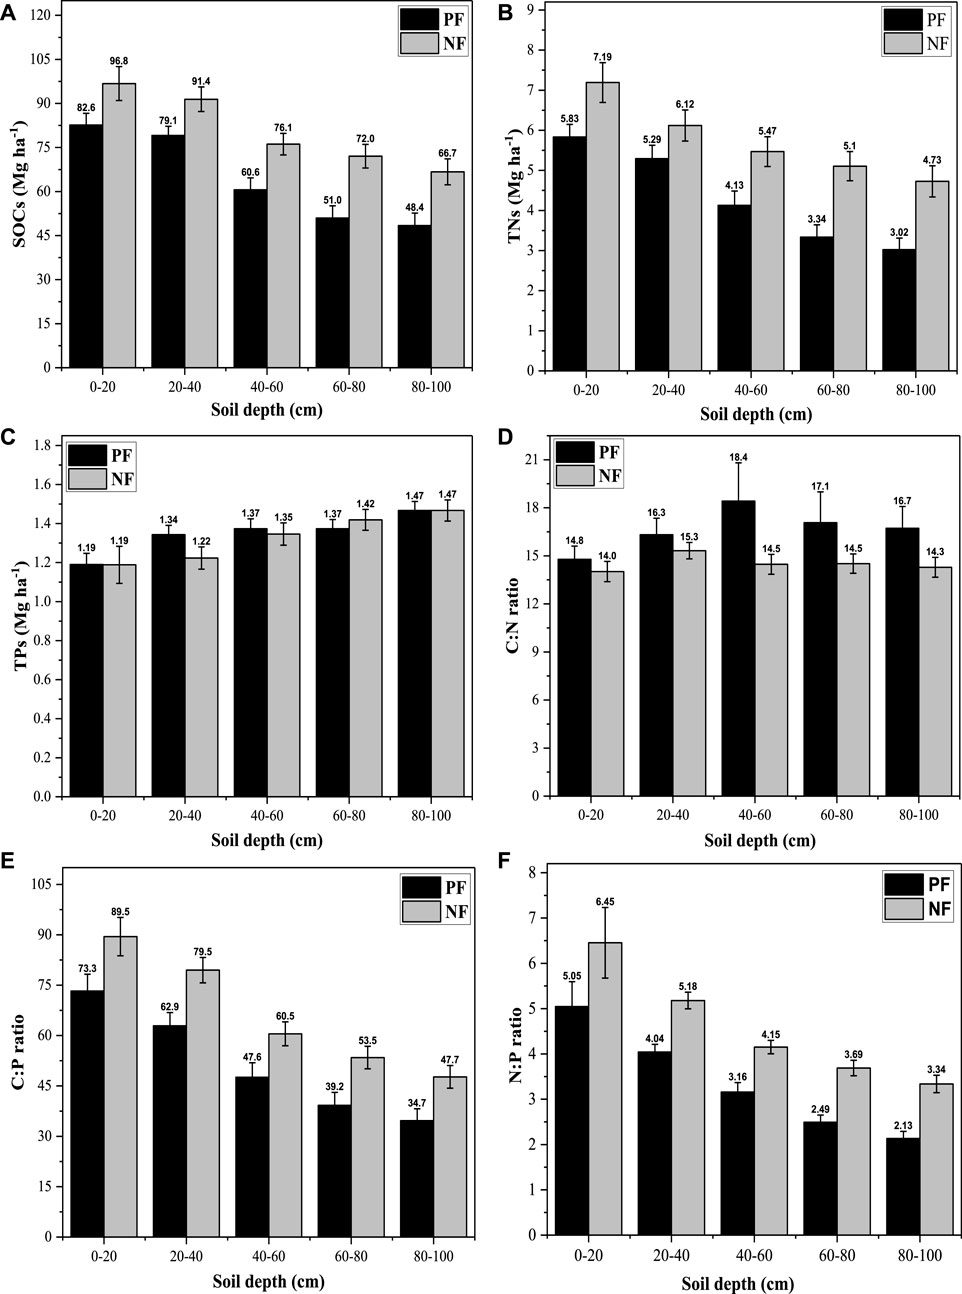
FIGURE 3. The SOC, TN, and TP stocks and stoichiometry under different soil depths for PF and NF. The error bars indicate standard error. The SOCs, TNs, and TPs indicate soil organic carbon, total nitrogen, and total phosphorus stocks respectively.
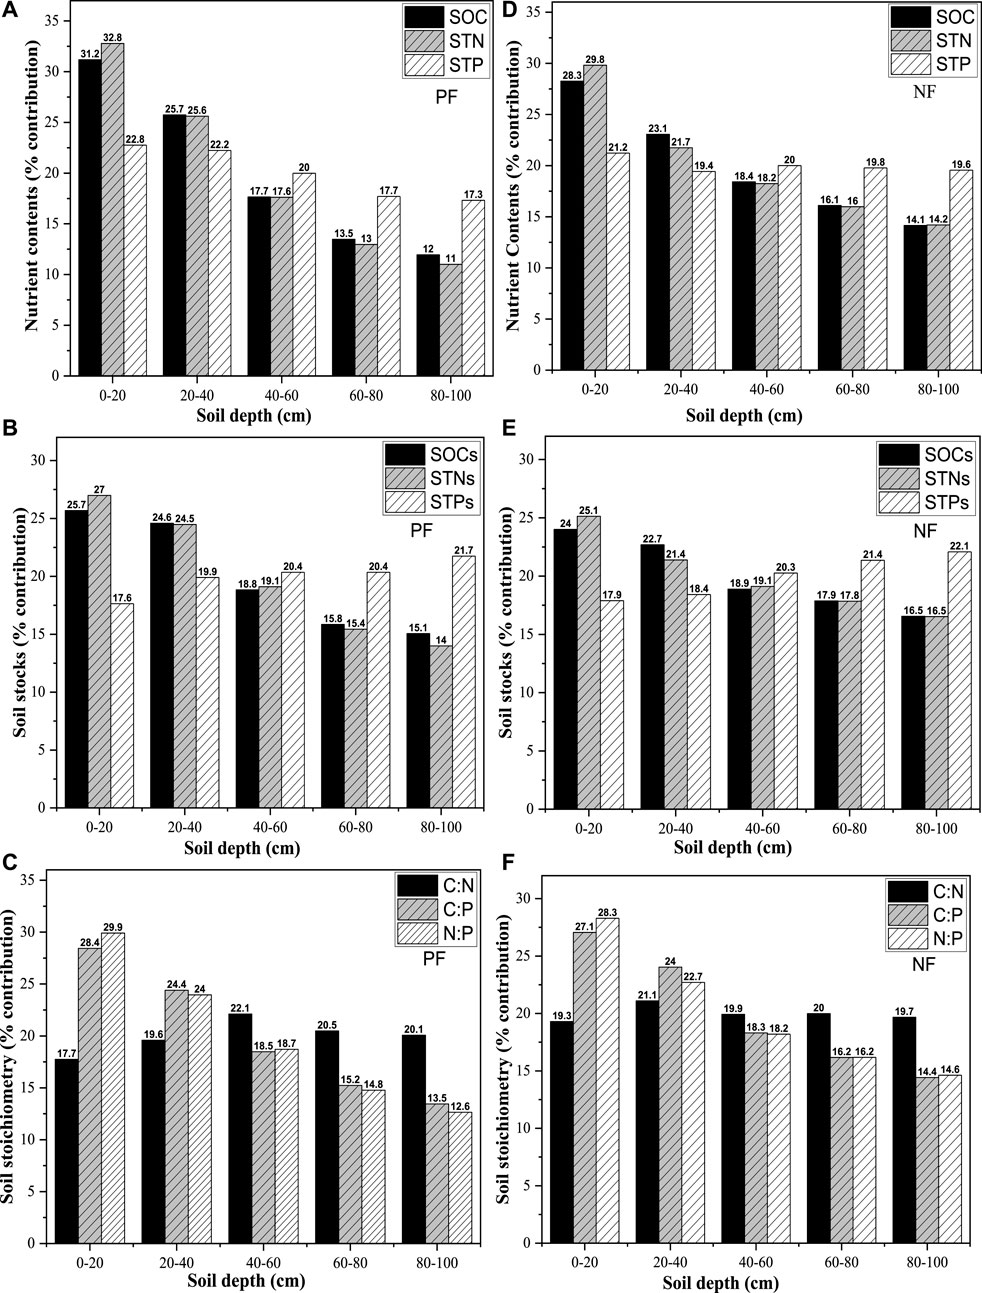
FIGURE 4. Percent contribution per soil depth to overall average contents, stocks, and stoichiometry of SOC, TN, and TP for PF (A–C) and NF (D–F).
Variation in C:N:P Stoichiometry with Soil Depth and Forest Type
The soil C:P and N:P ratios of PF and NF decreased significantly (p ≤ 0.05) with soil depth. The C:P ratios decreased from 73.3 and 89.5 for PF and NF at topsoil depth to 34.7 and 47.7 at the deepest soil depth. The N:P ratios decreased from 5.05 and 6.45 for PF and NF at the topsoil depth to 2.13 and 3.34 at the deepest soil depth (Figures 3E, F). The C:N ratios were similar among all soil depths for both PF and NF, although the variation range for PF was bigger than that for NF (Figure 3D).
The C:P and N:P ratios for NF were significantly higher than those for PF at all soil depths. The differences in C:P and N:P ratios decreased with rising soil depth, from 16.2 to 13.0 for C:P ratios and from 1.40 to 1.21 for N:P ratios, respectively (based on the data pairs in Figures 3E, F). The difference in the C:N ratio between PF and NF increased and then decreased with rising soil depth but was non-significant at all soil depths (Figure 3D). The average C:N ratios were 16.7 and 14.5 for PF and NF at soil depth (0–100 cm), where PF was significantly higher, while the C:P and N:P ratios for PF (51.5 and 4.38) were significantly lower than those for NF (66.1 and 5.85) (Table 2). The percent contributions of each soil depth to the overall stoichiometry of C:P and N:P of soil depth 0–100 cm were calculated for PF (Figure 4C) and NF (Figure 4F), showing decreasing percent contribution of each soil property with rising soil depth for both PF and NF, while the C:N ratios in PF showed an increase up to 40–60 cm and thereafter decreased, and were rather similar in NF.
The Effects of Soil Depth and Forest Type on Physicochemical Soil Properties
The soil depth and forest type intimately affected the physicochemical soil properties, while their interaction showed non-significant effects except for BD and TP content (Table 3). The soil BD, pH value, and the contents of SOC and TN were highly significantly correlated with both FT and SD. The TP content was positively associated with SD (p ≤ 0.001) and significantly correlated with FT (p ≤ 0.05). The stocks of SOC and TN were highly significantly correlated with both FT and SD (p ≤ 0.001), but the TP stock was only positively associated with SD (p ≤ 0.001) and non-significantly correlated with FT. The C:N ratio was somewhat significantly correlated with FT (p ≤ 0.05) but insignificantly correlated with SD. The C:P and N:P ratios were highly correlated (p ≤ 0.001) with FT and SD. Overall, most physicochemical soil properties were highly affected by SD and FT (except TP stock and C:N ratio).
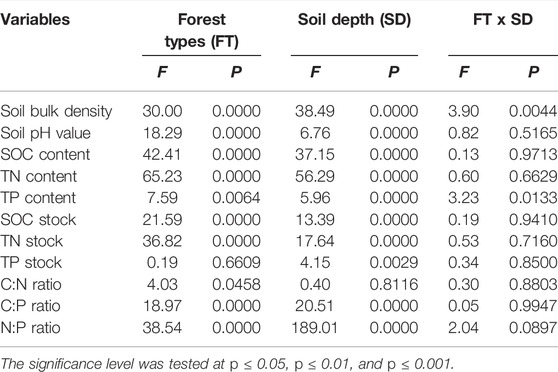
TABLE 3. Effects of SD, FT, and their interaction on soil properties based on two-way ANOVAs.
PCA for Physicochemical Soil Properties under the Soil Depth and Forest Types
The PC1 and PC2 define physiochemical soil parameters for PF and NF (Figures 5A, C). The sum of PC1 and PC2 explains 80.3% and 80.6% variations in physiochemical soil properties of PF and NF. The cumulative contribution rate of PC1 (59.7%) mainly reflects the soil BD, SOC, and TN for PF, while the contribution rate (56.6%) for NF mainly reflects the pH values, SOC, and TN. Similarly, the cumulative contribution rate of PC2 (20.6%) reflects the significant contribution of pH values for PF, while the contribution rate (24.0%) for NF defined the significant variability in soil BD and TP. The score plot for soil depth in each forest type was also developed (Figures 5B, D). The physicochemical soil properties under each soil depth occupied different sections of the diagrams. The soil depths (60–80 and 80–100 cm) were close for PF and NF and were in the analogous ordination space, resulting in the least significant differences. As a result, the correlation coefficient of soil parameters at these depths should be high. The soil properties occupying different positions in the diagram, such as the opposite location, reveal significant variation and quantitative changes between the soil properties. The soil depths (0–20 and 20–40 cm) for PF and NF were also lying closely, indicating minimal differences, though the overall differences for a soil depth of 0–20 cm were higher than those at 20–40.
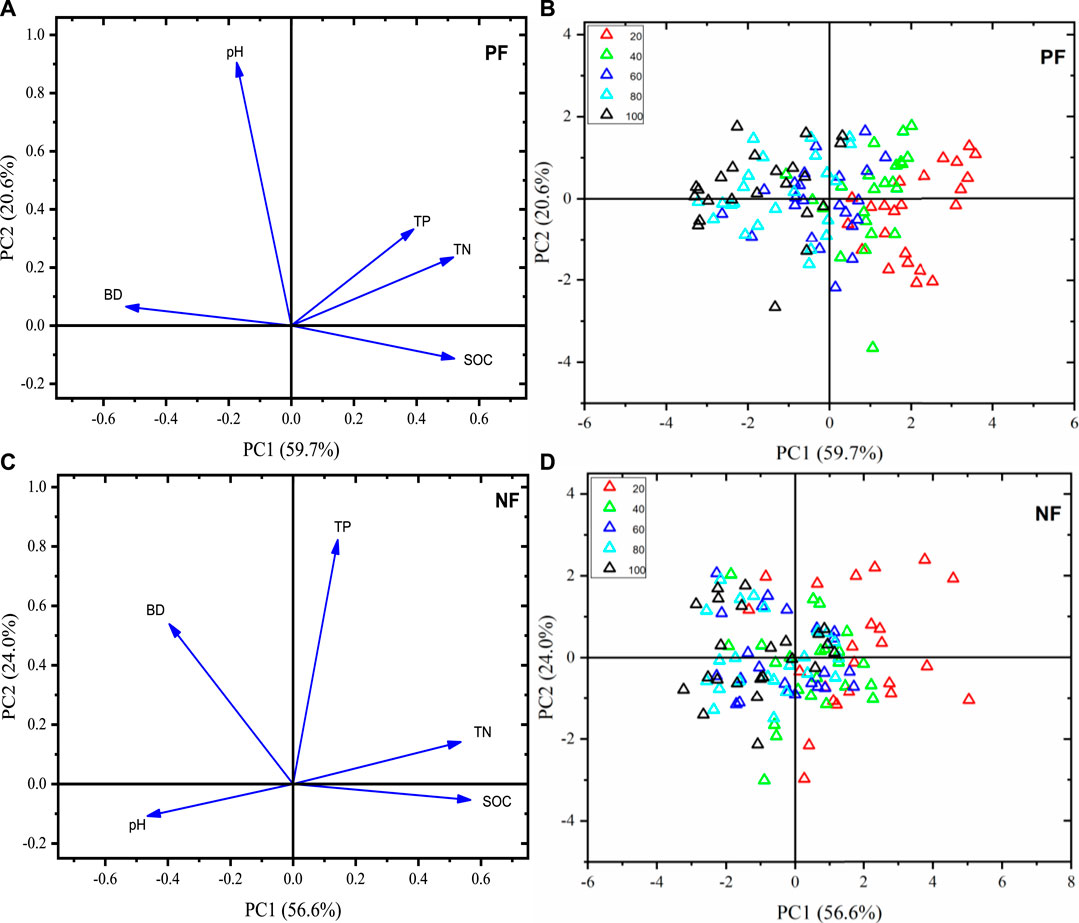
FIGURE 5. Principal component analysis for the physicochemical soil properties (loading and score plot). Panels (A, C) show the association of physicochemical soil parameters. At the same time, panels (B, D) represent the position of different soil depths (0–100 cm) under PF and NF.
Correlations among Physicochemical Soil Properties
The Pearson’s correlation analysis revealed a strong correlation among the physicochemical soil properties under PF and NF at 0–100 cm soil depth (Figure 6). The SOC was positively correlated with TN, and TP, while negatively correlated with pH (r = 0.78, 0.41, and −0.30, respectively) under PF (Figure 6A). Similarly, the SOC was positively correlated with TN and slightly correlated with TP, while a negative correlation was observed with pH for NF (r = 0.83, 0.17, and -0.66, respectively) (Figure 6B). The TN was positively correlated with TP (r = 0.54), while a negative correlation was found with pH for PF (r = −0.04). For NF, the TN was also positively correlated with TP (r = 0.30), and a negative correlation has existed with soil pH values (r = −0.61). The TP has negatively correlated with soil pH and BD for PF (r = −0.04, −0.51), while only negatively correlated with pH for NF (r = −0.16). The soil BD was strongly negatively correlated with SOC, and TN for PF and NF, while positively correlated with soil pH values (r = −0.78, −0.75, −0.64, −0.45, 0.28, and 0.30, respectively).
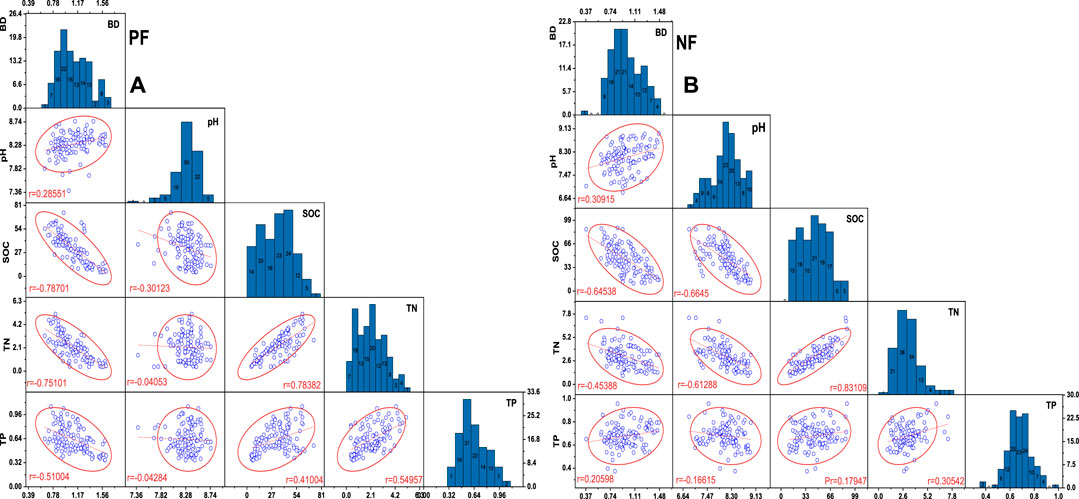
FIGURE 6. Pearson’s correlation scatter matrix for the physiochemical soil properties under PF and NF at 0–100 cm soil depth. The BD, SOC, TN, and TP indicate the soil bulk density, the contents of soil organic carbon, total nitrogen, and total phosphorus, respectively.
Discussion
Effects of Soil Depth and Forest Type on Soil BD and pH Value
The soil BD was significantly affected by soil depth and forest type (Figure 2A; Tables 3, 4). The increase of BD with rising soil depth is an integrated result of changing soil texture (Landsberg, 2003; Ali et al., 2019) and decreasing soil organic matter input from the humus layer and tree root litter due to the limited gaseous exchange (Tokunaga, 2006). However, the higher BD in PF than NF might be attributed to the poor growth and associated lower stand biomass, but unlikely due to mechanical compaction on the exposed surface soil by management activities (such as heavy harvest and human trampling) because the forest management for timber production has been prohibited in the natural reservation area for more than 4 decades. Of course, the natural forests were excluded from commercial use in this natural reservation area (Liao et al., 2012).
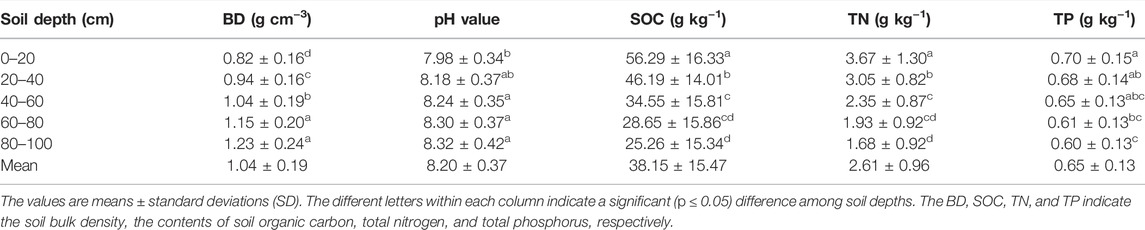
TABLE 4. The mean physicochemical soil properties in different soil depths from 0 to 100 cm.
The increased pH value with soil depth could be associated with less input of humus material (with organic acids) into the deeper soil depths (Table 4). A similar study (Balstrøm et al., 2013) reported that the organic acids present in the topsoil tend to break down before they reach the deeper soil depths, leading to higher pH values in deeper soil depths. The observed lower soil pH value under NF than PF confirmed the results of other studies (Chen et al., 2004). Thus, it may also be explained by the higher SOC content (SOM, correspondingly higher organic acid production) in NF than PF and the much longer time of forest cover and humus decomposition (Chen et al., 2016) in NF than in PF, which ultimately reduced the pH values of soil in a natural forest. Moreover, the better forest stand structure of NF than PF is also an influencing factor (Kafle, 2019).
Effects of Soil Depth and Forest Type on SOC, TN, and TP Contents
Soil depth is an important factor influencing the contents of SOC, TN, and TP (Berger et al., 2002; Olorunfemi et al., 2018). Our study showed a decreasing tendency in SOC, TN, and TP contents (Yang and Liu, 2019); this could be explained by the decreasing inputs of SOM with rising soil depth (Table 4) from both above and below-ground litterfall (Ngaba et al., 2019), especially by the decreasing influence of the humus layer covering the soil surface (Sperfeld et al., 2017; Zhang et al., 2018; Xu et al., 2019; Yang and Liu, 2019) and the decreasing activities of soil animals and microorganisms (Barreto et al., 2011). With rising soil depth, the soil permeability decreases, and the BD increases, limiting the input of dissolved SOM through leaching (Berger et al., 2002; Clemmensen et al., 2013; Rahman et al., 2022).
The lower contents of SOC, TN, and TP in PF compared with NF (Table 4) could be attributed to the lower accumulation of litterfall and the faster mineralization of SOM due to the more open stand structure, which leads to a higher soil temperature (Liao et al., 2010; Zhang et al., 2016; Wang et al., 2018). Furthermore, the harvesting of biomass and logging residues during site preparations for afforestation, the forest managing measures (e.g., weeding and thinning), and the quicker absorption of nutrients of trees in the fast-growing stage of a plantation may also contribute to the lower contents of SOC, TN, and TP in the soils of PF than NF (Paul et al., 2002; Jobbágy and Jackson, 2003; Berthrong et al., 2009; Liao et al., 2012).
Effects of Soil Depth and Forest Type on SOC, TN, and TP Stocks and Stoichiometry
The stocks of SOC and TN significantly decreased with soil depth irrespective of the forest types of PF or NF (Wang et al., 2016; Li et al., 2019; Ngaba et al., 2020) except for the TP stocks (Table 5). Our study showed that SOC and TN stocks firstly declined significantly with rising soil depth within the range of 0–60 cm and then stabilized or leveled-off thereafter within the soil depth range of 60–100 cm (Gao et al., 2020). The most important reason might be the highest biological activity in the topsoil, characterized by the highest SOM content and associated nutrient accumulation (Ngaba et al., 2020). Higher SOC and TN stocks in NF than PF in this study were comparable with previous studies (Gong et al., 2011; Wang et al., 2018), thought to be due to the more significant inputs of soil nutrients to the mineral soils in NF from their higher accumulated humus and litterfall compared with PF (Gong et al., 2011; Zhang et al., 2016). The TP stock likely increased with soil depth due to deep phosphorous parent materials or compounds down the soil profile (Xu et al., 2019). The similar stocks of TP (for PF and NF) in this study (Table 2) are in line with other studies (Hu et al., 2018), which indicated that forest conversion increases the TP stocks in the middle and deep soil depths (20–100 cm). This result is possibly due to the higher P input into the deeper soil depth because of the accelerated humus mineralization and leaching and the reduced P uptake by the young trees in the earlier growth stage of plantations (Xu et al., 2018).

TABLE 5. The mean SOC, TN, and TP stocks in different soil depths of 0–100 cm.
The differences in C:P and N:P ratios among soil depths were significant in this study, as reported in many studies (Liu et al., 2017; Xu et al., 2019; Liu et al., 2021), while it showed a non-significant difference in the C:N ratios among soil depths (Figure 3D; Table 6). A study in the Loess Plateau of China showed a similar result that the C:N ratios remained unchanged with soil depth (Deng et al., 2013). The C:N ratios of forest soils are negatively associated with the mineralization rate of SOM (Stevenson and Cole, 1999; Hu et al., 2019). Therefore, the lower C:N ratios in NF might be explained by the mineralization stage of SOM in the undisturbed NF. The C:P and N:P ratios could be used as indicators of the saturation or limitation of P and N (Sterner and Elser, 2002) and to assess the structure, health, and function conditions of forests that influence the quality and quantity of litter/humus as well as their mineralization (Wang et al., 2014; Yang et al., 2018). The observed variations of C:N:P ratios with soil depth and forest type in our study are consistent with other investigations (Gong et al., 2011; Zhang et al., 2016; Luo et al., 2019). Based on our results, the soil C:P and N:P ratios for NF were higher than those for PF, but the soil C:N ratios for NF were lower than that of PF, which could be associated with the element content changes, and litter decomposition rate (Yu et al., 2010; Zhang et al., 2016; Wang et al., 2018; Yang et al., 2018). Thus, we concluded that the NF present higher soil C:P and N:P ratios but lower C:N ratios than the PF with the same age group, tree species composition, and similar site conditions.
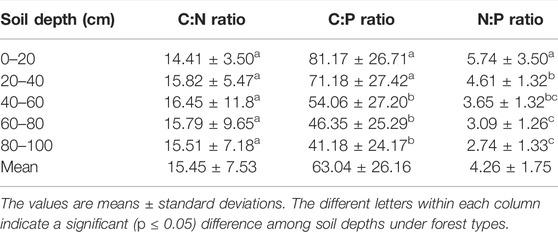
TABLE 6. The mean SOC, TN, and TP stoichiometry in different soil depths of 0–100 cm.
Conclusion
After characterizing the forest soil properties in the Qilian Mountains of northwest China, most physicochemical soil properties (except C:N ratio and TP stocks) differed significantly among soil depth and forest types. The soil BD, pH values, and TP stock increased with rising soil depth, while the contents of SOC, TN, and TP and their stocks and stoichiometry decreased with rising soil depth apart from the C:N ratio, which showed non-significant differences among soil depths. The physicochemical soil properties of NF are much better than those of PF since the NF soils present lower BD, favorable pH value range, higher contents of SOC and TN and TP, and higher SOC and TN stocks. Therefore, the physicochemical soil properties in terms of soil fertility in NF are unlikely to be restored in a short period through plantations, indicating that the replacement of NF with PF should be avoided to sustain ecosystem sustainability.
Data Availability Statement
The raw data supporting the conclusion of this article will be made available by the authors, without undue reservation.
Author Contributions
The author MR wrote up, prepared the original manuscript, and performed formal data analysis; YW generated funding acquisition, methodology, and also data availability; KZ supervised, added analysis, and reviewed the article; BA and AsA critically reviewed and edited the manuscript as well as help data computation and analysis; AdA conceptualized the study and data analysis; DM, MA, and ZZ curated data, reviewed the manuscript, visualized as well as incorporate their valuable suggestions regarding draft improvement. The author EB edited the manuscript for extensive revision and corrected English language and grammar related issues. All authors have read and agreed to the current version of the manuscript.
Funding
The research reported in this paper was financially supported by the National Natural Science Foundation of China under the project “The Formation and Compensation Mechanisms of Hydrological Functions of Forest−vegetation in the Jinghe Watershed of the Loess Plateau (U20A2085)” and the Chinese Academy of Forestry under the project “The vegetation dynamics and the optimization of multiple ecological and hydrological functions in the Jinghe Basin” (CAFYBB2021ZW002), the Key Laboratory of Forest Ecology and Environment and the Long-term Forest Ecological Station of Liupan Mountains of the National Forestry and Grassland Administration of China.
Conflict of Interest
The authors declare that the research was conducted in the absence of any commercial or financial relationships that could be construed as a potential conflict of interest.
Publisher’s Note
All claims expressed in this article are solely those of the authors and do not necessarily represent those of their affiliated organizations, or those of the publisher, the editors, and the reviewers. Any product that may be evaluated in this article, or claim that may be made by its manufacturer, is not guaranteed or endorsed by the publisher.
Acknowledgments
The authors are grateful to the National Natural Science Foundation of China and the Chinese Academy of Forestry for their financial support. The authors are thankful to Beijing Forestry University for providing a platform for study analysis and additional supervision.
References
Ahmad, B., Wang, Y., Hao, J., Liu, Y., Bohnett, E., and Zhang, K. (2018). Optimizing Stand Structure for Trade-Offs between Overstory Timber Production and Understory Plant Diversity: A Case-Study of a Larch Plantation in Northwest China. Land Degrad. Dev. 29, 2998–3008. doi:10.1002/ldr.3070
Ahmad, B., Wang, Y., Hao, J., Liu, Y., Bohnett, E., and Zhang, K. (2019). Optimizing Stand Structure for Tradeoffs between Overstory and Understory Vegetation Biomass in a Larch Plantation of Liupan Mountains, Northwest China. For. Ecol. Manage. 443, 43–50. doi:10.1016/j.foreco.2019.04.001
Ahmad, B., Wang, Y., Hao, J., Liu, Y., Bohnett, E., and Zhang, K. (2021). Variation of Carbon Density Components with Overstory Structure of Larch Plantations in Northwest China and its Implication for Optimal forest Management. For. Ecol. Manag. 496, 119399. doi:10.1016/j.foreco.2021.119399
Ali, A., Ahmad, A., Akhtar, K., Teng, M., Zeng, W., Yan, Z., et al. (2019). Patterns of Biomass, Carbon, and Soil Properties in Masson pine (Pinus Massoniana Lamb) Plantations with Different Stand Ages and Management Practices. Forests 10, 645. doi:10.3390/f10080645
Ali, A., Hussain, M., Ali, S., Akhtar, K., Muhammad, M. W., Zamir, A., et al. (2022). Ecological Stoichiometry in Pinus massoniana L. Plantation: Increasing Nutrient Limitation in a 48-Year Chronosequence. Forests 13, 469. doi:10.3390/f13030469
Ashagrie, Y., Zech, W., and Guggenberger, G. (2005). Transformation of a Podocarpus Falcatus Dominated Natural forest into a Monoculture Eucalyptus Globulus Plantation at Munesa, Ethiopia: Soil Organic C, N and S Dynamics in Primary Particle and Aggregate-Size Fractions. Agric. Ecosyst. Environ. 106, 89–98. doi:10.1016/j.agee.2004.07.015
Balstrøm, T., Breuning-Madsen, H., Krüger, J., Jensen, N. H., and Greve, M. H. (2013). A Statistically Based Mapping of the Influence of Geology and Land Use on Soil pH: A Case Study from Denmark. Geoderma 192, 453–462. doi:10.1016/j.geoderma.2012.08.024
Barreto, P. A. B., Gama-Rodrigues, E. F., Gama-Rodrigues, A. C., Fontes, A. G., Polidoro, J. C., Moço, M. K. S., et al. (2011). Distribution of Oxidizable Organic C Fractions in Soils under Cacao Agroforestry Systems in Southern Bahia, Brazil. Agroforest Syst. 81, 213–220. doi:10.1007/s10457-010-9300-4
Batjes, N. H. (2014). Total Carbon and Nitrogen in the Soils of the World. Eur. J. Soil Sci. 65, 10–21. doi:10.1111/ejss.12114_2
Behera, N., and Sahani, U. (2003). Soil Microbial Biomass and Activity in Response to Eucalyptus Plantation and Natural Regeneration on Tropical Soil. For. Ecol. Manage. 174, 1–11. doi:10.1016/s0378-1127(02)00057-9
Berger, T. W., Neubauer, C., and Glatzel, G. (2002). Factors Controlling Soil Carbon and Nitrogen Stores in Pure Stands of Norway Spruce (Picea Abies) and Mixed Species Stands in Austria. For. Ecol. Manage. 159, 3–14. doi:10.1016/s0378-1127(01)00705-8
Berthrong, S. T., Jobbágy, E. G., and Jackson, R. B. (2009). A Global Meta-Analysis of Soil Exchangeable Cations, pH, Carbon, and Nitrogen with Afforestation. Ecol. Appl. 19, 2228–2241. doi:10.1890/08-1730.1
Chen, C. R., Xu, Z. H., and Mathers, N. J. (2004). Soil Carbon Pools in Adjacent Natural and Plantation Forests of Subtropical Australia. Soil Sci. Soc. Am. J. 68, 282–291. doi:10.2136/sssaj2004.2820
Chen, G.-S., Yang, Y.-S., Xie, J.-S., Guo, J.-F., Gao, R., and Qian, W. (2005). Conversion of a Natural Broad-Leafed evergreen forest into Pure Plantation Forests in a Subtropical Area: Effects on Carbon Storage. Ann. For. Sci. 62, 659–668. doi:10.1051/forest:2005073
Chen, L.-F., He, Z.-B., Zhu, X., Du, J., Yang, J.-J., and Li, J. (2016). Impacts of Afforestation on Plant Diversity, Soil Properties, and Soil Organic Carbon Storage in a Semi-Arid Grassland of Northwestern China. Catena 147, 300–307. doi:10.1016/j.catena.2016.07.009
Clemmensen, K. E., Bahr, A., Ovaskainen, O., Dahlberg, A., Ekblad, A., Wallander, H., et al. (2013). Roots and Associated Fungi Drive Long-Term Carbon Sequestration in Boreal Forest. Science 339, 1615–1618. doi:10.1126/science.1231923
Deng, L., Wang, K.-B., Chen, M.-L., Shangguan, Z.-P., and Sweeney, S. (2013). Soil Organic Carbon Storage Capacity Positively Related to Forest Succession on the Loess Plateau, China. Catena 110, 1–7. doi:10.1016/j.catena.2013.06.016
Freier, K. P., Glaser, B., and Zech, W. (2010). Mathematical Modeling of Soil Carbon Turnover in Natural Podocarpus forest and Eucalyptus Plantation in Ethiopia Using Compound Specific δ13C Analysis. Glob. Change Biol. 16, 1487–1502. doi:10.1111/j.1365-2486.2009.02096.x
Gao, G., Tuo, D., Han, X., Jiao, L., Li, J., and Fu, B. (2020). Effects of Land-Use Patterns on Soil Carbon and Nitrogen Variations along Revegetated Hillslopes in the Chinese Loess Plateau. Sci. Total Environ. 746, 141156. doi:10.1016/j.scitotenv.2020.141156
Gogoi, A., Ahirwal, J., and Sahoo, U. K. (2021). Plant Biodiversity and Carbon Sequestration Potential of the Planted forest in Brahmaputra Flood plains. J. Environ. Manage. 280, 111671. doi:10.1016/j.jenvman.2020.111671
Gong, C., Wang, S., Zeng, Z., Deng, S., Chen, J., and Long, K. (2011). Carbon Storage and its Distribution Pattern of Evergreen Broad-Leaved Forests at Different Succession Stages in Mid-Subtropical China. Chin. J. Ecol. 30, 1935–1941. doi:10.1007/s11676-011-0141-4
Guo, X., Meng, M., Zhang, J., and Chen, H. Y. (2016). Vegetation Change Impacts on Soil Organic Carbon Chemical Composition in Subtropical Forests. Sci. Rep. 6, 29607. doi:10.1038/srep29607
Han, X., Gao, G., Li, Z., Chang, R., Jiao, L., and Fu, B. (2019). Effects of Plantation Age and Precipitation Gradient on Soil Carbon and Nitrogen Changes Following Afforestation in the Chinese Loess Plateau. Land Degrad. Dev. 30, 2298–2310. doi:10.1002/ldr.3422
Hu, L., Ade, L., Wu, X., Zi, H., Luo, X., and Wang, C. (2019). Changes in Soil C: N: P Stoichiometry and Microbial Structure along Soil Depth in Two Forest Soils. Forests 10, 113. doi:10.3390/f10020113
Hu, Y.-F., Shu, X.-Y., He, J., Zhang, Y.-L., Xiao, H.-H., Tang, X.-Y., et al. (2018). Storage of C, N, and P Affected by Afforestation with Salix Cupularisin an Alpine Semiarid Desert Ecosystem. Land Degrad. Dev. 29, 188–198. doi:10.1002/ldr.2862
Jackson, R. B., Jobbágy, E. G., Avissar, R., Roy, S. B., Barrett, D. J., Cook, C. W., et al. (2005). Trading Water for Carbon with Biological Carbon Sequestration. Science 310, 1944–1947. doi:10.1126/science.1119282
Jobbágy, E. G., and Jackson, R. B. (2003). Patterns and Mechanisms of Soil Acidification in the Conversion of Grasslands to Forests. Biogeochemistry 64, 205–229. doi:10.1023/a:1024985629259
Kafle, G. (2019). Vertical Distribution of Soil Organic Carbon and Nitrogen in a Tropical Community Forest of Nepal. Int. J. For. Res. 2019, 3087570. doi:10.1155/2019/3087570
Laganiere, J., Angers, D. A., and Pare, D. (2010). Carbon Accumulation in Agricultural Soils after Afforestation: A Meta‐Analysis. Glob. Change Biol. 16, 439–453. doi:10.1111/j.1365-2486.2009.01930.x
Landsberg, J. D. (2003). Bulk Density and Soil Resistance to Penetration as Affected by Commercial Thinning in Northeastern Washington. Portland, United States: US Department of Agriculture, Forest Service, Pacific Northwest Research Station.
Lemma, B., Kleja, D. B., Nilsson, I., and Olsson, M. (2006). Soil Carbon Sequestration under Different Exotic Tree Species in the Southwestern Highlands of Ethiopia. Geoderma 136, 886–898. doi:10.1016/j.geoderma.2006.06.008
Li, Q., Yang, D., Jia, Z., Zhang, L., Zhang, Y., Feng, L., et al. (2019). Changes in Soil Organic Carbon and Total Nitrogen Stocks along a Chronosequence of Caragana Intermedia Plantations in Alpine Sandy Land. Ecol. Eng. 133, 53–59. doi:10.1016/j.ecoleng.2019.03.003
Liao, C., Luo, Y., Fang, C., Chen, J., and Li, B. (2012). The Effects of Plantation Practice on Soil Properties Based on the Comparison between Natural and Planted Forests: A Meta‐Analysis. Shanghai, China: Wiley Online Library.
Liao, C., Luo, Y., Fang, C., and Li, B. (2010). Ecosystem Carbon Stock Influenced by Plantation Practice: Implications for Planting Forests as a Measure of Climate Change Mitigation. PloS one 5, e10867. doi:10.1371/journal.pone.0010867
Lin, Z., Li, Y., Tang, C., Luo, Y., Fu, W., Cai, X., et al. (2018). Converting Natural Evergreen Broadleaf Forests to Intensively Managed Moso Bamboo Plantations Affects the Pool Size and Stability of Soil Organic Carbon and Enzyme Activities. Biol. Fertil. Soils 54, 467–480. doi:10.1007/s00374-018-1275-8
Liu, J., Gou, X., Zhang, F., Bian, R., and Yin, D. (2021). Spatial Patterns in the C: N: P Stoichiometry in Qinghai Spruce and the Soil across the Qilian Mountains, China. Catena 196, 104814. doi:10.1016/j.catena.2020.104814
Liu, X., Ma, J., Ma, Z.-W., and Li, L.-H. (2017). Soil Nutrient Contents and Stoichiometry as Affected by Land-Use in an Agro-Pastoral Region of Northwest China. Catena 150, 146–153. doi:10.1016/j.catena.2016.11.020
Louman, B., Declerck, F., Ellatifi, M., Finegan, B., and Thompson, I. (2010). Forest Biodiversity and Ecosystem Services: Drivers of Change, Responses and Challenges. Vienna, Austria: IUFRO (International Union of Forestry Research Organizations) Secretariat.
Lü, J., Yan, M., Song, B., Guan, J., and Shi, W. (2017). Ecological Stoichiometry Characteristics of Soil Carbon, Nitrogen, and Phosphorus in an oak forest and a Black Locust Plantation in the Loess Hilly Region. Chin. Acta Ecologica Sinica 37, 3385–3393. doi:10.5846/stxb201603120437
Luo, X., Hou, E., Zhang, L., Zang, X., Yi, Y., Zhang, G., et al. (2019). Effects of Forest Conversion on Carbon-Degrading Enzyme Activities in Subtropical China. Sci. Total Environ. 696, 133968. doi:10.1016/j.scitotenv.2019.133968
Mclean, E. (1982). “Soil pH and Lime Requirement,” in Methods of Soil Analysis: Part 2 Chemical and Microbiological Properties. Editor A. L. Page. (Ohio, United States: American Society of Agronomy (ASA), and Soil Science Society of America (SSSA)), 199–224.
Moe, S. J., Stelzer, R. S., Forman, M. R., Harpole, W. S., Daufresne, T., and Yoshida, T. (2005). Recent Advances in Ecological Stoichiometry: Insights for Population and Community Ecology. Oikos 109, 29–39. doi:10.1111/j.0030-1299.2005.14056.x
Ngaba, M. J. Y., Hu, Y. L., Bol, R., Ma, X. Q., Jin, S. F., and Mgelwa, A. S. (2019). Effects of Land Use Change from Natural forest to Plantation on C, N and Natural Abundance of 13C and 15N along a Climate Gradient in Eastern China. Sci. Rep. 9, 16516. doi:10.1038/s41598-019-52959-z
Ngaba, M. J. Y., Ma, X.-Q., and Hu, Y.-L. (2020). Variability of Soil Carbon and Nitrogen Stocks after Conversion of Natural forest to Plantations in Eastern China. PeerJ 8, e8377. doi:10.7717/peerj.8377
Nsabimana, D., Klemedtson, L., Kaplin, B., and Wallin, G. (2008). Soil Carbon and Nutrient Accumulation under forest Plantations in Southern Rwanda. Afr. J. Environ. Sci. Technol. Health Care 2, 142–149. https://www.ajol.info/index.php/ajest/article/view/135578.
Olorunfemi, I. E., Fasinmirin, J. T., and Akinola, F. F. (2018). Soil Physico-Chemical Properties and Fertility Status of Long-Term Land Use and Cover Changes: A Case Study in forest Vegetative Zone of Nigeria. Eurasian J. Soil Sci. 7, 133–150. doi:10.18393/ejss.366168
Paul, K. I., Polglase, P. J., Nyakuengama, J. G., and Khanna, P. K. (2002). Change in Soil Carbon Following Afforestation. For. Ecol. Manag. 168, 241–257. doi:10.1016/s0378-1127(01)00740-x
Rahman, M., Muhammad, D., Mussarat, M., Sharif, M., Irfan, M., Ahmad, J., et al. (2018). Effect of Acidulated Levels and Application Techniques of Rock Phosphate on Phosphorus Use Efficiency and Yield of Wheat in Calcareous Soil of Peshawar-Pakistan. Pure Appl. Biol. 7, 1094–1103. doi:10.19045/bspab.2018.700128
Rahman, M., Zhang, K., Wang, Y., Ahmad, B., Ahmad, A., Zhang, Z., et al. (2022). Variations in Soil Physico-Chemical Properties, Soil Stocks, and Soil Stoichiometry under Different Soil Layers, the Major forest Region Liupan Mountains of Northwest China. Braz. J. Biol. 84, e256565. doi:10.1590/1519-6984.256565
Reed, S. C., Yang, X., and Thornton, P. E. (2015). Incorporating Phosphorus Cycling into Global Modeling Efforts: A Worthwhile, Tractable Endeavor. New Phytol. 208, 324–329. doi:10.1111/nph.13521
Rong, Z., Zhao, C., Liu, J., Gao, Y., Zang, F., Guo, Z., et al. (2019). Modeling the Effect of Climate Change on the Potential Distribution of Qinghai Spruce (Picea Crassifolia kom.) in Qilian Mountains. Forests 10 (1), 62. doi:10.3390/f10010062
Sperfeld, E., Wagner, N. D., Halvorson, H. M., Malishev, M., and Raubenheimer, D. (2017). Bridging Ecological Stoichiometry and Nutritional Geometry with Homeostasis Concepts and Integrative Models of Organism Nutrition. Funct. Ecol. 31, 286–296. doi:10.1111/1365-2435.12707
Sterner, R. W., and Elser, J. J. (2002). Ecological Stoichiometry: The Biology of Elements from Molecules to the Biosphere. Helsinski, Finlandia: Princeton University Press.
Stevenson, F. J., and Cole, M. A. (1999). Cycles of Soils: Carbon, Nitrogen, Phosphorus, Sulfur, Micronutrients. Urbana Champaign, United States: John Wiley & Sons.
Sun, M., Zhai, B.-C., Chen, Q.-W., Li, G., Tateno, R., Yamanaka, N., et al. (2021). Effects of Soil Nutrients and Stand Structure on Aboveground Net Primary Productivity of Oak Secondary Forests in the Forest-Steppe Transition Zone of Loess Plateau, China. Can. J. For. Res. 51, 1208–1217. doi:10.1139/cjfr-2020-0459
Tadesse, G., Zavaleta, E., and Shennan, C. (2014). Effects of Land-Use Changes on Woody Species Distribution and Above-Ground Carbon Storage of Forest-Coffee Systems. Agric. Ecosyst. Environ. 197, 21–30. doi:10.1016/j.agee.2014.07.008
Tokunaga, A. A. (2006). Effects of Bulk Density and Soil Strength on the Growth of Blue Wildrye (Elymus Glaucus Buckl.). Arcata, United States: Humboldt State University.
van Dijk, A. I., and Keenan, R. J. (2007). Planted Forests and Water in Perspective. For. Ecol. Manage. 251 (1-2), 1–9. Elsevier. doi:10.1016/j.foreco.2007.06.010
Walkley, A. (1947). A Critical Examination of a Rapid Method for Determining Organic Carbon in Soils-Effect of Variations in Digestion Conditions and of Inorganic Soil Constituents. Soil Sci. 63, 251–264. doi:10.1097/00010694-194704000-00001
Wall, A., and Hytönen, J. (2005). Soil Fertility of Afforested Arable Land Compared to Continuously. Plant Soil 275, 247–260. doi:10.1007/s11104-005-1869-4
Wang, G., Zhou, G., Yang, L., and Li, Z. (2003). Distribution, Species Diversity and Life-Form Spectra of Plant Communities along an Altitudinal Gradient in the Northern Slopes of Qilianshan Mountains, Gansu, China. Plant Ecol. 165, 169–181. doi:10.1023/a:1022236115186
Wang, H., Zhang, B., Jin, X., Zhang, H., Liu, J., and Dai, S. (2009). Spatio-Temporal Variations Analysis of Air Temperature and Precipitation in Qi Lian Mountainous Region Based on GIS. J. Desert Res. 29, 1196–1202. https://kns.cnki.net/kcms/detail/detail.aspx?dbcode=CJFD&dbname=CJFD2009&filename=ZGSS200906030&uniplatform=NZKPT&v=GtHRJk2d3Airi2j2-4IQUrqZNgGnJm3FNHf7y8pqY9re-m0mXYCeuBV1NW_eDgT5.
Wang, J.-Y., Wang, S.-Q., Li, R.-L., Yan, J.-H., Sha, L.-Q., and Han, S.-J. (2011). C: N: P Stoichiometric Characteristics of Four forest Types’ Dominant Tree Species in China. Chin. J. Plant Ecol. 35, 587. doi:10.3724/SP.J.1258.2011.00587
Wang, M., Chen, H., Zhang, W., and Wang, K. (2018). Soil Nutrients and Stoichiometric Ratios as Affected by Land Use and Lithology at County Scale in a Karst Area, Southwest China. Sci. Total Environ. 619-620, 1299–1307. doi:10.1016/j.scitotenv.2017.11.175
Wang, T., Kang, F., Cheng, X., Han, H., and Ji, W. (2016). Soil Organic Carbon and Total Nitrogen Stocks under Different Land Uses in a Hilly Ecological Restoration Area of North China. Soil Tillage Res. 163, 176–184. doi:10.1016/j.still.2016.05.015
Wang, W., Sardans, J., Zeng, C., Zhong, C., Li, Y., and Peñuelas, J. (2014). Responses of Soil Nutrient Concentrations and Stoichiometry to Different Human Land Uses in a Subtropical Tidal Wetland. Geoderma 232-234, 459–470. doi:10.1016/j.geoderma.2014.06.004
Wang, Y., Zhou, L., Yang, G., Guo, R., Xia, C., Liu, Y., et al. (2020). Performance and Obstacle Tracking to Natural Forest Resource Protection Project: A Rangers' Case of Qilian Mountain, China. Int. J. Environ. Res. Public Health 17 (16), 5672. doi:10.3390/ijerph17165672
Xu, C., Xiang, W., Gou, M., Chen, L., Lei, P., Fang, X., et al. (2018). Effects of Forest Restoration on Soil Carbon, Nitrogen, Phosphorus, and Their Stoichiometry in Hunan, Southern China. Sustainability 10, 1874. doi:10.3390/su10061874
Xu, H., Qu, Q., Li, P., Guo, Z., Wulan, E., and Xue, S. (2019). Stocks and Stoichiometry of Soil Organic Carbon, Total Nitrogen, and Total Phosphorus after Vegetation Restoration in the Loess Hilly Region, China. Forests 10, 27. doi:10.3390/f10010027
Yang, G., Li, J., and Zhou, L. (2021). Considerations on Forest Changes of Northwest China in Past Seven Decades. Front. Environ. Sci. 9, 589896. doi:10.3389/fenvs.2021.589896
Yang, H., Miao, N., Li, S.-C., Ma, R., Liao, Z.-Y., Wang, W.-P., et al. (2019). Relationship between Stand Characteristics and Soil Properties of Two Typical Forest Plantations in the Mountainous Area of Western Sichuan, China. J. Mt. Sci. 16, 1816–1832. doi:10.1007/s11629-018-5265-y
Yang, Y., Guo, J., Chen, G., Yin, Y., Gao, R., and Lin, C. J. P. (2009). Effects of Forest Conversion on Soil Labile Organic Carbon Fractions and Aggregate Stability in Subtropical China. Plant Soil 323 (1), 153–162. doi:10.1007/s11104-009-9921-4
Yang, Y., Liu, B.-R., and An, S.-S. (2018). Ecological Stoichiometry in Leaves, Roots, Litters and Soil Among Different Plant Communities in a Desertified Region of Northern China. Catena 166, 328–338. doi:10.1016/j.catena.2018.04.018
Yang, Y., and Liu, B. (2019). Effects of Planting Caragana Shrubs on Soil Nutrients and Stoichiometries in Desert Steppe of Northwest China. Catena 183, 104213. doi:10.1016/j.catena.2019.104213
Yang, Y. S., Guo, J., Chen, G., Xie, J., Gao, R., Li, Z., et al. (2005). Carbon and Nitrogen Pools in Chinese Fir and evergreen Broadleaved Forests and Changes Associated with Felling and Burning in Mid-Subtropical China. For. Ecol. Manage. 216, 216–226. doi:10.1016/j.foreco.2005.05.030
Yu, Q., Chen, Q., Elser, J. J., He, N., Wu, H., Zhang, G., et al. (2010). Linking Stoichiometric Homoeostasis with Ecosystem Structure, Functioning and Stability. Ecol. Lett. 13 (11), 1390–1399. doi:10.1111/j.1461-0248.2010.01532.x
Yuan, H., and Hou, F. (2015). Grazing Intensity and Soil Depth Effects on Soil Properties in alpine Meadow Pastures of Qilian Mountain in Northwest China. Acta Agric. Scand. - B Soil Plant Sci. 65 (3), 222–232. doi:10.1080/09064710.2014.992940
Zhang, H., Shi, L., Wen, D., and Yu, K. (2016). Soil Potential Labile but Not Occluded Phosphorus Forms Increase with forest Succession. Biol. Fertil. Soils 52, 41–51. doi:10.1007/s00374-015-1053-9
Zhang, K., Song, C., Zhang, Y., Dang, H., Cheng, X., and Zhang, Q. (2018). Global-Scale Patterns of Nutrient Density and Partitioning in Forests in Relation to Climate. Glob. Change Biol. 24 (1), 536–551. doi:10.1111/gcb.13860
Zhang, Y., Tian, Q., Gou, X., Chen, F., Leavitt, S. W., and Wang, Y. (2011). Annual Precipitation Reconstruction since AD 775 Based on Tree Rings from the Qilian Mountains, Northwestern China. Int. J. Climatol. 31, 371–381. doi:10.1002/joc.2085
Keywords: natural forests, plantation forests, stoichiometry, element stocks, Qilian Mountain
Citation: Rahman M, Wang Y, Zhang K, Ahmad B, Ali A, Ahamd A, Muhammad D, Afzaal M, Zhang Z and Bohnett E (2022) Variations in Soil C, N, P Stocks and Stoichiometry With Soil Depth and Forest Types in Qilian Mountains of Northwest China. Front. Environ. Sci. 10:882842. doi: 10.3389/fenvs.2022.882842
Received: 03 March 2022; Accepted: 11 April 2022;
Published: 25 May 2022.
Edited by:
Rosa Francaviglia, Council for Agricultural and Economics Research (CREA), ItalyReviewed by:
Yahya Kooch, Tarbiat Modares University, IranUttam Kumar Sahoo, Mizoram University, India
Lungmuana Singson, Indian Council of Agricultural Research (ICAR), India
Copyright © 2022 Rahman, Wang, Zhang, Ahmad, Ali, Ahamd, Muhammad, Afzaal, Zhang and Bohnett. This is an open-access article distributed under the terms of the Creative Commons Attribution License (CC BY). The use, distribution or reproduction in other forums is permitted, provided the original author(s) and the copyright owner(s) are credited and that the original publication in this journal is cited, in accordance with accepted academic practice. No use, distribution or reproduction is permitted which does not comply with these terms.
*Correspondence: Yanhui Wang, wangyh@caf.ac.cn