 Liang Yuan
 Renyue Li1
 Weijun He
 Dagmawi Mulugeta Degefu
 Thomas Stephen Ramsey
- 1College of Economics and Management, China Three Gorges University, Yichang, China
- 2School of Law and Public Administration, China Three Gorges University, Yichang, China
- 3School of Business, Hohai University, Nanjing, China
- 4Department of Architecture Science, Ryerson University, Toronto, ON, Canada
The Yangtze River Economic Belt (YREB) is an important growth pole of China’s economy, but it is also one of the most environmentally polluted basins in China. Maintaining the vitality of economic development while at the same time realizing the coordinated development of industry and ecosystems, is an important issue that needs in-depth discussion and research. This paper analyzes the degree of coordination regarding the industrial-ecological economy in the YREB, identifies important influencing factors, and puts forward measures for improvement. First, an evaluation model of the industrial-ecological economy is constructed. Second, a model is constructed for the measurement of the coordination degree of the industrial economy and industrial ecology based on the Lotka-Volterra Model. Third, the relationship is assessed with respect to competition versus cooperation. Finally, the important factors affecting coordination are identified using a Neural Network Model. Four main conclusions can be drawn: 1) The comprehensive development of the industrial economy and industrial ecology in 11 provinces and cities in the YREB is generally trending upward. 2) The coordination level of the industrial-ecological economy in the midstream area is high. The provinces Jiangsu, Jiangxi, Sichuan, and Guizhou are in a coordinated state. 3) The midstream area has a more balanced industrial-ecological economy with significant symbiosis between the industrial economy and industrial ecology. Jiangsu, Jiangxi, Sichuan, and Guizhou Provinces show a symbiotic relationship; Shanghai City, Chongqing City, and Anhui Province show a partially symbiotic relationship; and Zhejiang, Hubei, Hunan, and Yunnan Provinces show a mutually inhibitory relationship. 4) The industrial ecosystem is the largest factor in the degree of coordination, and intensity of R&D investment, regional GDP per capita, and proportion of tertiary-industry added-value in GDP also have a great impact. Based on this analysis, this paper proposes measures for high-quality development of the industrial-ecological economy of the YREB with regard to balanced development of the industrial economy, transformation and upgrading of the surrounding environment, along with coordinated and integrated development.
1 Introduction
As one of China’s national development strategies, the Yangtze River Economic Belt (YREB) plays a leading and exemplary role in promoting green development and achieving the Sustainable Development Goals in China. The YREB spans the major Eastern, Middle, and Western regions, covering 11 provinces and cities, which comprises 21.4% of China’s total land area and more than 40% of its population and economy. Under the background of the dual carbon goals proposed by China in 2021, promoting industrial upgrading, green development, and realizing a coordinated development of the industrial-ecological economy is a complex process that requires answering difficult theoretical and practical questions.
The idea of the industrial-ecological economy integrates both industrial and ecological concerns in one system, considering together the economic effects of industry and the environment. The industrial economic system involves various economic activities in the process of industrial development, and the industrial ecological system involves diverse ecological activities in the process of green production. From the economic benefits and the ecological efficiency of industrial development perspective to analyzing the economic and ecological framework as well as evolution of regional industrial structures, is a new direction for research on the industrial ecological economy. The in-depth excavation of such problems will play a forward-looking role in regional economic development and environmental improvement. Until now, studies of the relationship and interaction between the industrial economical system and the industrial ecological system have mostly centered on the Environmental Kuznets Curve (EKC), input-output analysis, system dynamics models, econometric models, and decoupling theory.
Grossman and Krueger (1991) put forward the idea of the EKC based on the original Kuznets Curve (Kuznets, 1955). It is a hypothetical inverted-U-shaped relationship between environmental problems and per capita income. Komen et al. (1997) found that pollutant emissions decrease after income surpasses the threshold level. Markandya et al. (2006) found an inverted-U-shaped relationship between per capita GDP and sulfur dioxide emissions in Western Europe. Rauf et al. (2018), Baležentis et al. (2019); Zafar et al. (2019), and Bibi and Jamil (2021) have discussed the impact of energy consumption and economic growth on environmental problems. Aziz et al. (2020) found data consistent with the EKC in the relationships among economic growth, agricultural production, renewable energy, forest area, and environmental degradation in Pakistan. Tenaw and Beyene (2021) used a modified EKC hypothesis to study sustainability-oriented development in 20 countries in Sub-Saharan Africa.
Input-output analysis is a method of quantitative economic analysis that has been used to study the interdependence between input and output in the industrial-ecological economy (Zhang and Zhang, 2018; Chapagain et al., 2020; Castelão et al., 2021; Zheng et al., 2020) established a dynamic wastewater-induced input-output model, revealed the driving relationship between the development of industrial sectors such as paper, computer, machinery, and service manufacturing and wastewater discharge. Shmelev (2012) used input-output analysis to evaluate the sustainability of investments in various economic sectors, and found that economic policy could reduce environmental pollution and improve the efficiency of resource use. Han and Ji (2016) applied input-output analysis to establish industrial carbon emission standards that could reduce the negative impact of carbon emissions and promote economic development. Kanitkar et al. (2019) used input-output analysis to establish a comprehensive economic-environmental model framework, showing the investment model that affects the economy needs to focus on environmental factors. Nguyen et al. (2019) and Liu et al. (2020) developed an environmentally extended input-output model and identified the key sectors for greenhouse gas emissions mitigation. De Jesus Teixeira et al. (2020) found that strategic investment in more polluting sectors could reduce greenhouse gas emissions based on an input-output matrix. Chandrakumar et al. (2020) applied multi-regional input-output analysis to study the relationship between economic operation and environmental changes.
System dynamics models can deal with complex, nonlinear, high-order, and multivariate time-varying phenomena with multiple feedbacks through long-term dynamic and strategic simulation analysis. This is a useful tool in the study of complex nonlinear systems of the economy and environment (Yuan et al., 2021a). Chen (2004) constructed an ecological-economic social feedback regulation mechanism based on the relationship between economic demand and ecological supply, and provided a practical scheme for coordinated development. Gao et al. (2019) used circular economy theory incorporated into a system dynamics model, to establish a comprehensive regional economic evaluation framework, and to show the relationship between the use of different environmental pollutants and economic improvement. Singh and Uma Devi (2020) used a system dynamics model to analyze the impact of energy on economic and environmental systems.
The econometric model is a powerful tool for quantitative analysis that can effectively describe the characteristics of the industrial-ecological economy and explore the relationship between economy and ecology (Chow and Li, 2014; Haseeb et al., 2018; Mensah et al., 2021). Spatial econometric models can further analyze spatial interaction and spatial structure uniformity (Abdo et al., 2020; Jiang, 2020; Hille and Lambernd, 2021). Appiah et al. (2019) explored the causal relationship between energy use and carbon emissions using feasible generalized least squares and panel correction standard errors. Mohsin et al. (2021) applied Random Effect Model and Hausmann-Taylor Regression to understand the interaction among the economy, energy, and environment in 25 Asian developing countries. Anser et al. (2021) applied the fully modified ordinary least squares method to analyze the relationship among energy, economy, and carbon dioxide emissions.
Decoupling theory has often been used in the assessment of the relationship between the environment and the economy in recent years (Kong et al., 2019). Szigeti et al. (2017) studied the relationship between ecological footprint and GDP through decoupling theory and found that 117 countries have experienced strong or weak decoupling. Wang et al. (2017) used decoupling analysis to study the relationship between economic growth and energy consumption as well as environmental issues. Jaligot and Chenal (2018) used decoupling theory to assess the relationship between economic activity and its impact on the environment. Luo et al. (2021) described the relationship between economic growth, resources, and the environment by designing a decoupling index. Lundquist (2021) used the decoupling theory to provide empirical evidence of the decoupling of economic growth and carbon emissions. Zhang D et al., 2021 used a theory of “triangular decoupling” to analyze the level and the driving factors of the decoupling of economic output from pressure on the water environment. Kong et al. (2021) used decoupling theory to analyze the relationship between water footprint and economic growth, and explored sustainable development paths toward strong decoupling of the water footprint and economic growth.
The previous research methods provided rich perspectives and assessments for the discussion of this relationship. However, coordination of the industrial-ecological economy is dynamic change and evolution which depends on the interaction and development level between the industrial economy and industrial ecology (Zhang et al., 2019; Xu et al., 2021). On one hand, the development of the industrial economy will drive industrial technological innovation and improve the level of industrial ecology, however, it will also lead to the consumption of resources and the discharge of pollutants, which at the same time hinders the development of the industrial economy. On the other hand, development of the industrial ecology will drive the development of low-carbon industries and circular economy, thereby promoting the development of the industrial economy. It will also cause some enterprises to stop production or close down, which inhibits the development of the industrial economy. It can be seen that there is a complex dynamic relationship between the industrial economy and industrial ecology. Therefore, the above methods and models lack a description of changes in coordination between the industrial economy and industrial ecology. Research on the internal relationship of the systems in the development process is also lacking, and does not analyze the development, interaction, coupling of the economy and ecology in detail, or, explore the degree of interaction and coordination within the industrial-ecological economy. Furthermore, this research lacks identification of factors affecting the coordination degree of the industrial-ecological economy, the proposed recommendations are not very instructive.
Therefore, the authors tried to assess the comprehensive level of development of the industrial-ecological economy, analyze the evolution of the interaction between the industrial economy and industrial ecology within the industrial-ecological economy, and discuss the evolutionary relationship of multiple economic regions. Next, we calculate the degree of coordination between the industrial economy and industrial ecology, depict the industrial characteristics and ecological development pattern of each province, identify the factors driving this coordination, put forward countermeasures and suggestions that can improve the industrial ecological economic system. The finding of this paper will help policymakers formulate new policies for economic development, promote the improvement of the modern industrial system, and provide a strong reference for the development of a green industrial structure that takes into account the ecology. The rest of this research article is structured as follows. Section 2 describes the methodology used. Section 3 presents the results obtained by applying the methods to the case study. Section 4 discusses the reason for the results. Section 5 summarizes and concludes the paper.
2 Materials and Methods
2.1 Study Area
The YREB covers an area of 2.05 million square kilometers, 21.4% of China’s total land area, and includes 11 provinces and cities as shown in Figure 1, which can be divided into downstream (Shanghai City and Jiangsu, Zhejiang, and Anhui Provinces), midstream (Jiangxi, Hubei, and Hunan Provinces), and upstream (Chongqing City and Sichuan, Guizhou, and Yunnan Provinces). The YREB has gradually developed into one of the regions with the strongest comprehensive strength and the greatest strategic supporting role in China. However, the YREB has faced many difficulties and problems, such as severe ecological environmental situations, regional development imbalance, arduous task of industrial transformation and upgrading, and imperfect regional cooperation mechanisms for many years. Studying the current development status and interaction between the industrial economy and industrial ecology in the provinces and cities along the YREB will help accelerate transformation of the industrial ecology, promote the overall improvement of the ecological environment, and make this region a typical example of China’s leading high-quality economic development.
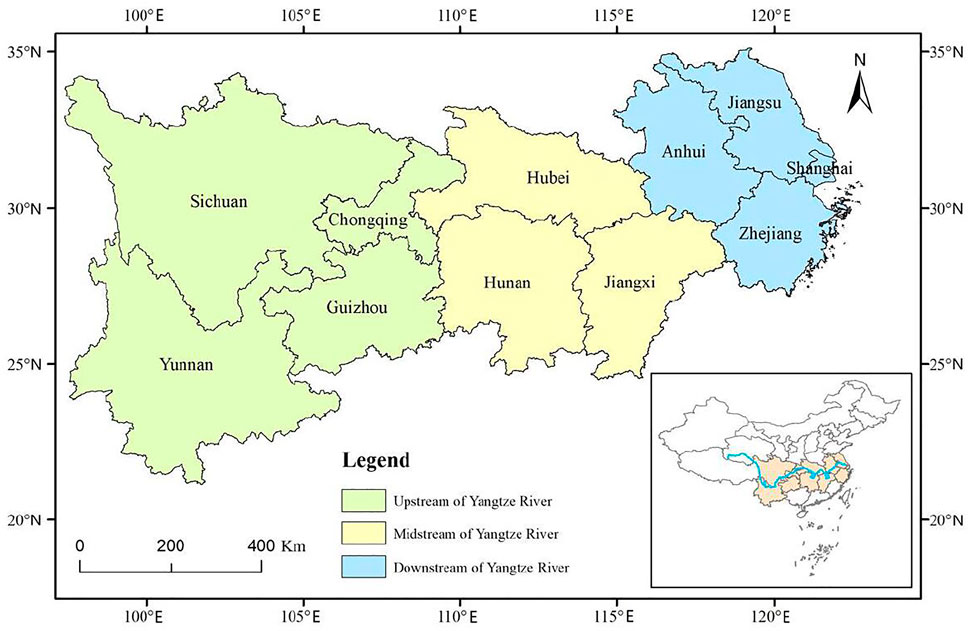
FIGURE 1. Map of the yangtze river economic belt.
2.2 Method
2.2.1 Comprehensive Evaluation of the Industrial-Ecological Economy
The industrial-ecological economy can be decomposed into two subsystems: industrial economy and industrial ecology. The industrial economic subsystem can then be divided into four layers: economic growth, economic development (Sun et al., 2020a), industrial structure (Sun et al., 2020b), and industrial development (Zhou and Wang, 2014). The industrial ecological subsystem has five layers: ecological pressure (Iqbal et al., 2021), resource consumption (Yang et al., 2021), ecological management, green technology (Fang et al., 2022; Irfan et al., 2022), and policy impact level (Wan and Liu, 2020; Sun et al., 2021; Zhang Y et al., 2021). The indexes corresponding to these nine layers are described in Table 1.
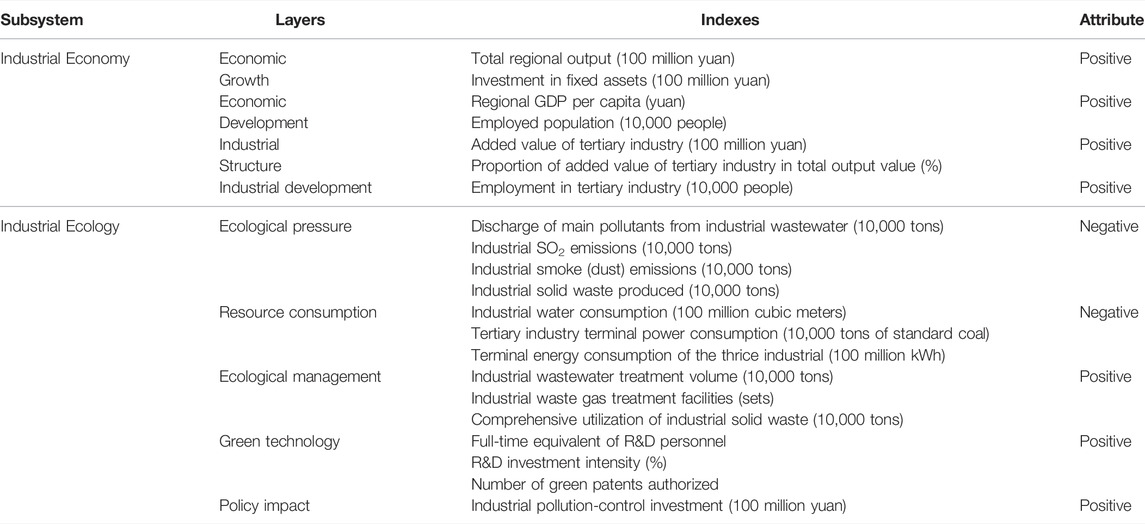
TABLE 1. Index system of the industrial-ecological economy.
Assume the value of each indicator is
In order to avoid a meaningless calculation, linear interpolation was used to perform the dimensionless processing of raw data (Huang et al., 2015). For positive attribution indexes, the standard value
For negative attribution indexes, the standard value
where
The proportion of the standard value of region
The entropy value of the index
where
The coefficient of variation
The weight of different indicators
The comprehensive development level of the industrial-ecological economy
2.2.2 Evaluation of the Degree of Coordination of the Industrial-Ecological Economy
The interaction of industrial economy and industrial ecology can be analyzed through the Lotka-Volterra model, which is combined with the model of Lotka, 1926 and Volterra (1926a), Volterra (1926b). The Lotka-Volterra model not only describes the relationship such as symbiosis, parasitism, and competition, but also provides the foundation of coordination evaluation. Therefore, the Lotka-Volterra model and the coordination-degree model are applied to explore the degree of coordination between the two subsystems: industrial economy and industrial ecology. Assuming the Lotka-Volterra model of the industrial-ecological economy is:
where
Assuming that
According to the projection relationship between the gray derivative and even logarithm (Li et al., 2004),
Assuming that:
Then:
The influence coefficients are:
2.2.3 The Relationship Between the Industrial Economy and Industrial Ecology
According to the evolutionary characteristics of competition and cooperation in the Lotka-Volterra model, there are four possible relationships simplified between the industrial economy and industrial ecology: mutually beneficial, symbiosis of promotion, symbiosis of restraint, and mutual inhibition as shown in Table 2 (Wang and Wang, 2017).
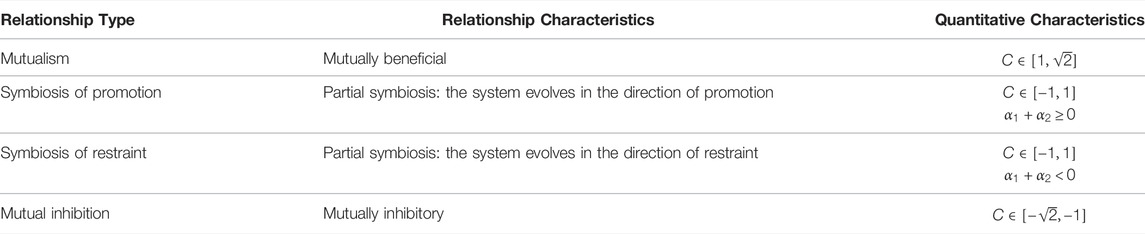
TABLE 2. Evolutionary relationship between industrial economy and industrial ecology.
From the perspective of unilateral effects, if
From the perspective of bilateral effects, if
2.2.4 Driving Factors of Coordinated Development
Identifying the factors that affect the degree of coordination could guide us in promoting the coordination and development of the industrial-ecological economy (Yang and Hu, 2018). This paper uses the Neural Network Model (NNM) to identify those factors. An NNM can use the data set to obtain a nonlinear continuity function that conforms to the basic characteristics of the change in coordination of the industrial-ecological economy. The input layer uses the 21 indicators of the industrial-ecological economy as shown in Table 1, the output layer gives the degree of coordination of the industrial-ecological economy, and the hidden layer is set according to the input and output conditions.
The influence of the index data on the coordination level can be divided into two stages: first the influence of the input layer on the hidden layer and then the influence of the hidden layer on the degree of coordination. To improve the validity of the model, the data set is first trained, and then the weight coefficients between neurons are calculated (Sun and Wang, 2001).
The correlation significance coefficient
where
The correlation coefficient
Finally, the index factor contribution
In summary, this paper analyzed the degree of coordination of the industrial-ecological economy and puts forward measures to improve it. First, we used the Entropy Method to evaluate the comprehensive level of the industrial economy and the industrial ecology. Second, we applied the Symbiosis Coordination Function to analyze the coordination of development of the industrial-ecological economy. Third, we analyzed competition versus cooperation between the industrial-ecological economy according to the degree of coordination and the Lotka-Volterra Model. Finally, we used an NNM to identify the factors that affect coordination. The framework of the article is shown in Figure 2.
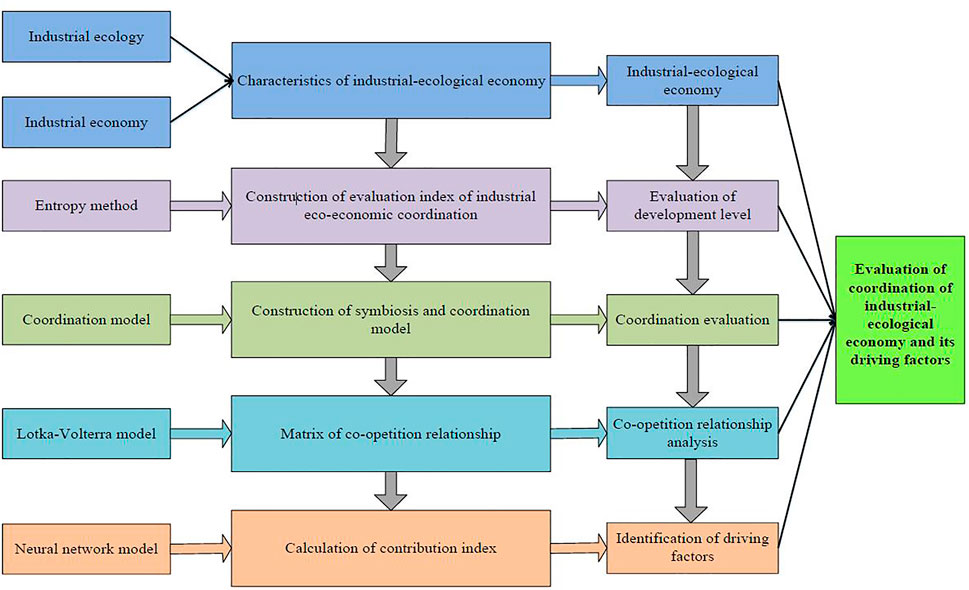
FIGURE 2. Evaluation of coordination of industrial-ecological economy and its driving factors.
2.2.5 Data Sources
The data are from 2009 to 2018. They are mainly from the Economy Prediction System Data (epsnet.com.cn), the China Statistical Yearbook (2009–2018), statistical yearbooks of provinces and cities, the China Environmental Statistical Yearbook, the China Science and Technology Statistical Yearbook, the China Energy Statistical Yearbook, as well as the Statistical Communiqué of National Economic and Social Development.
3 Results
3.1 Evaluation of the Level of Comprehensive Development
The level of comprehensive development of the industrial economy in the upstream, midstream, and downstream regions of the YREB is shown in Figure 3. Compared to the upstream area, development is somewhat higher in the midstream area and much higher in the downstream area. The downstream area is the engine, where rich and diverse resources provide the fuel for economic development. The industrial economy of the midstream area is an in-between situation, whereby this region takes advantage of convenient transportation and focuses on creating local economic characteristics that play a key role in development. The upstream area is limited by primitive infrastructure and a dearth of skilled workers, and the pace of industrial development is relatively slow.
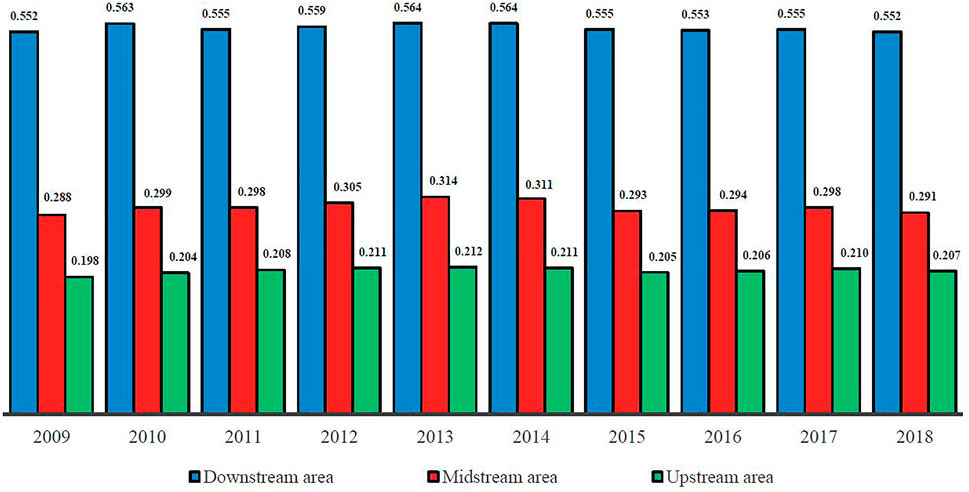
FIGURE 3. Regional development level of industrial economy in the YREB from 2009 to 2018.
The development of the industrial economy in the 11 provinces and cities of the YREB is shown in Figure 4. The majority of them are increasing gradually and the industrial economy is advancing steadily. However, Hubei and Sichuan Provinces, and Chongqing City show a more significant upward trend, and Guizhou Province shows an obvious downward trend. Shanghai City declines and then rises, while Jiangsu Province rises and then declines. The others are relatively stable. Shanghai City, Jiangsu, and Zhejiang Provinces have a moderately higher developed industrial economy. Convenient transportation, abundant resources, and abundant talent in these regions have strongly promoted prosperity and development in the economy and society. Guizhou and Yunnan Provinces are relatively undeveloped with low industrial economic levels.
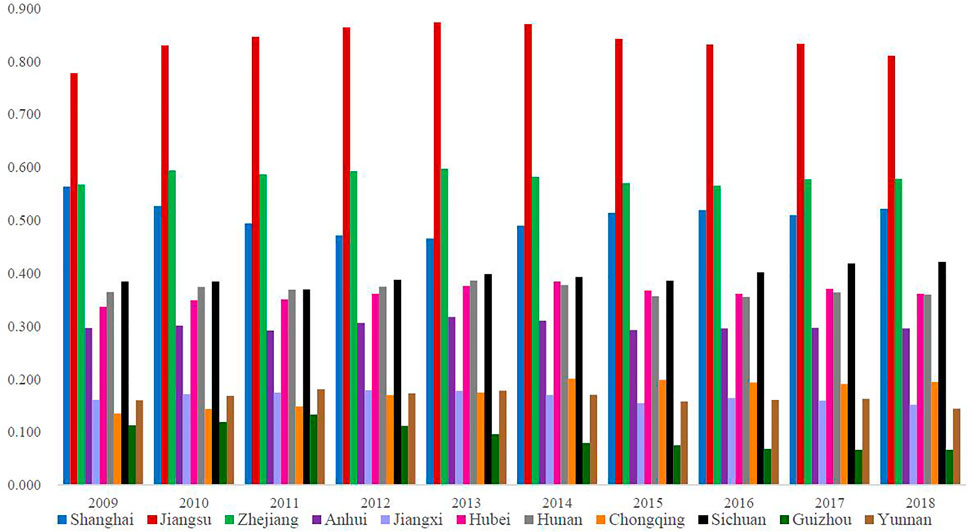
FIGURE 4. Provincial development level of industrial economy in the YREB from 2009 to 2018.
The development of industrial ecology in the YREB is shown in Figure 5. The level in the downstream area is relatively high and there is no significant difference between the midstream and downstream areas. Based on the advanced development concepts and complete industrial chain in the downstream area, this area has been able to promote green upgrades in the industry. The midstream area lacks these advantages, and the industrial structure is relatively backward. However, the midstream area has gradually improved in vigorously promoting the Sustainable Development Goals and leveraging the power of economic growth. The upstream area has a good ecological environment but it is gradually being destroyed in the process of promoting economic and social progress. This region’s economy lacks a driving force and public awareness of environmental protection is lacking.

FIGURE 5. Regional development level of industrial ecology in the YREB from 2009 to 2018.
The development of industrial ecology in the 11 provinces and cities of the YREB is shown in Figure 6. The level is relatively high in Shanghai City and Zhejiang and Jiangsu Provinces. Anhui and Hubei Provinces and Chongqing City already have a certain growth efficiency, and their advantages will gradually increase. The differences between Jiangxi, Hunan, Sichuan, Guizhou, and Yunnan Provinces in each year are not obvious.
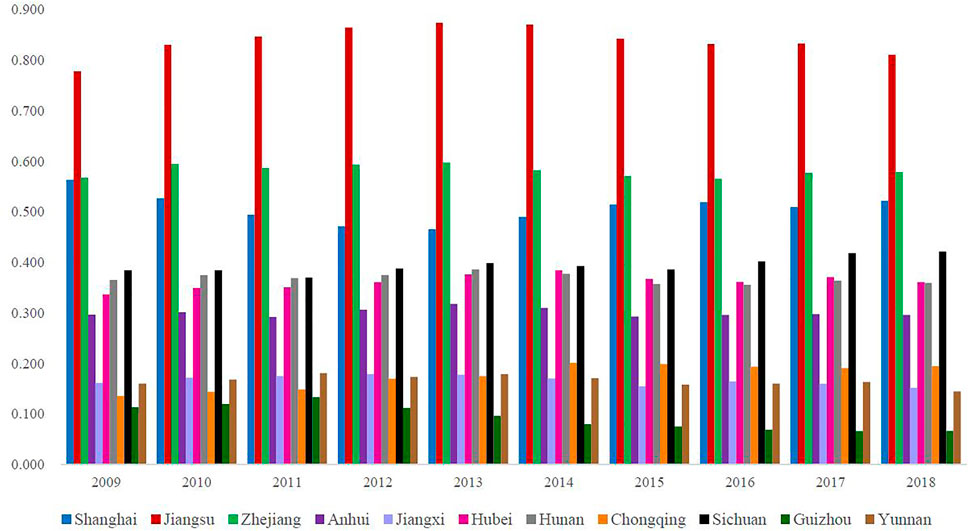
FIGURE 6. Provincial development level of industrial ecology in the YREB from 2009 to 2018.
3.2 Calculation of the Degree of Coordination
The coordination levels of the industrial-ecological economy in the upstream, midstream, and downstream areas of the YREB are shown in Table 3. There is a problem of internal disharmony in the industrial-ecological economy in the downstream and upstream areas, and coordination in the downstream area is weak.

TABLE 3. Coordination of industrial-ecological economy in the YREB.
The level of coordination of the 11 provinces and cities in the YREB are shown in Figure 7. Jiangsu, Jiangxi, Sichuan, and Guizhou Provinces are in a coordinated state. Jiangsu Province has the highest degree of coordination. Shanghai City, Chongqing City, and Zhejiang, Anhui, Hubei, Hunan, and Yunnan Provinces are not in a state of coordination. Hunan Province has the worst coordination. There is no direct correlation between the degree of coordination and level of development across regions. This shows that comprehensive evaluation of development should not be used as a single reference standard in the analysis of the degree of coordination in a region.
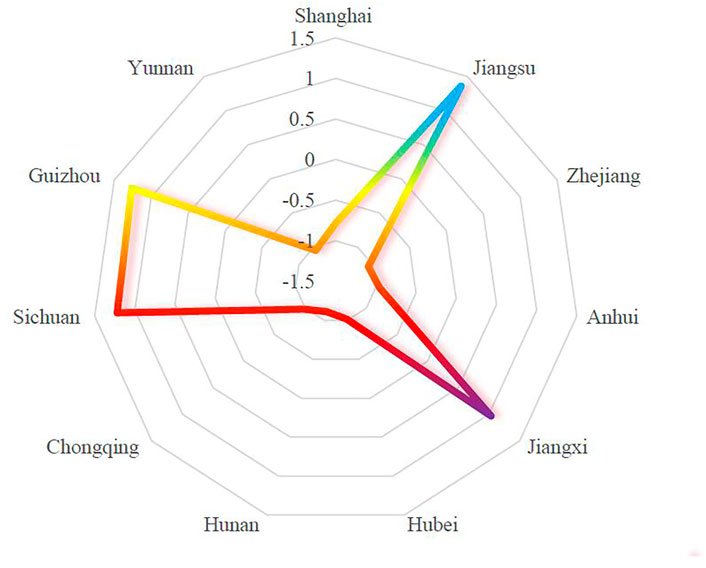
FIGURE 7. Coordination of industrial-ecological economy in 11 provinces and cities in the YREB.
3.3 Competition Versus Cooperation in the Industrial-Ecological Economy
The competition-versus-cooperation assessment of the industrial-ecological economy in the upstream, midstream, and downstream areas of the YREB is shown in Table 4. The upstream area has a partially symbiotic relationship. Industrial ecology promotes the industrial economy but the development of the industrial economy will restrain industrial ecology. Due to the protection of the natural environment, the development process in the upstream area has been slow, leading to slow economic development and a poor foundation for industrial growth. Therefore, the current economic development in the upstream area cannot support the improvement of industrial ecology, which is manifested in a clear inhibition of industrial ecology. The economic development of the midstream area is in an intermediate position, yet the midstream area has a more balanced industrial-ecological economy, with the significant symbiosis between the industrial economy and industrial ecology. The downstream area is in the leading position of economic development. However, regional economic development has a large inhibitory effect on industrial ecology as compared with the inhibitory effect of industrial ecology on the industrial economy.
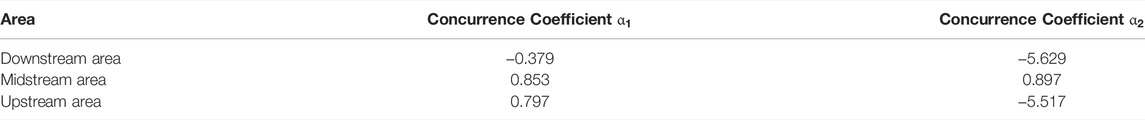
TABLE 4. Competition-versus-cooperation coefficient of the industrial ecological-economy in the YREB.
Thus, we find that the midstream does not have great advantages in the industrial economy and industrial ecology, but this area can maintain some symbiosis between the two. The phenomenon of mutual restraint in the downstream area, with their better economic conditions, indicates that strategies such as green upgrading and co-promotion of economic and environmental development should be prioritized. Implementation of these strategies will enhance the coordinated progress of the economy and environment.
The competition-versus-cooperation relationship of the industrial-ecological economy of the provinces and cities in the YREB is shown in Table 5. The coefficient varies greatly across the YREB.
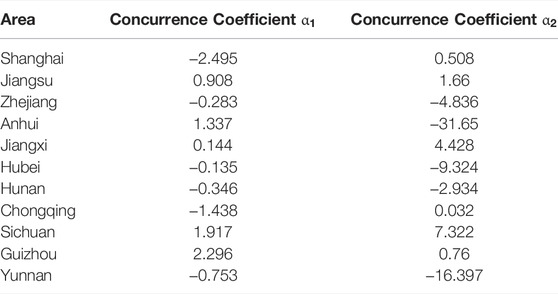
TABLE 5. Competition-versus-cooperation coefficient of the industrial-ecological economy in 11 provinces and cities of the YREB.
The relationship between the industrial economy and industrial ecology is symbiotic in Jiangsu, Jiangxi, Sichuan, and Guizhou Provinces. Jiangsu Province is the leader in economic development and industrial ecology, and its level of comprehensive development is high. Its economic progress has an obvious positive effect on the green transformation and upgrading of industry, and the green transformation of industry promotes economic growth. In Sichuan Province, the gap between industrial economic development and industrial ecological development is very small, and the degree of mutual coordination between them is high. In Jiangxi and Guizhou Provinces, although industrial economic development is weaker than industrial ecological development, the interaction between the two is mutually beneficial.
Shanghai City, Chongqing City, and Anhui Province have a partially symbiotic relationship between the industrial economy and industrial ecology. Shanghai City is the economic, scientific, technological, and cultural center of the YREB, and there the industrial economy unilaterally promotes the development of industrial ecology. In Anhui Province, the development of the industrial economy and industrial ecology is not synchronous: its industrial economy has an obvious restraining effect on the development of industrial ecology for concentration of resources and strength to develop the economy. In Chongqing City, ecological development is slightly stronger than industrial development. Its economy has an encouraging effect on industry upgrading to a green ecology environment, but industrial ecology has an inhibitory effect on the industrial economy.
In Zhejiang, Hubei, Hunan, and Yunnan Provinces, the industrial economy and industrial ecology have a mutually inhibitory relationship. The levels of the industrial economy and industrial ecology in the three provinces are similar, except that in Yunnan Province there are some gaps in the comparison between the industrial economy and industrial ecology. In these four provinces, economic development and ecological development inhibit each other, which is unfavorable for both.
3.4 Factors Driving Coordination of the Industrial-Ecological Economy
After training and testing the data with MATLAB, the maximum deviation between the sample value and the fitting value is 0.0812, indicating that the model is credible. Combining the correlation significance coefficient, the correlation coefficient, and the absolute influence coefficient, a coordinated impact index was obtained. The proportion of industrial economy in the driving factors of coordination is 38%, and the proportion of industrial ecology is 62%. Thus, industrial and ecological indicators both have a major effect on the coordination of the industrial-ecological economy. Furthermore, R&D expenditure investment intensity, regional GDP per capita, and the proportion of added-value of tertiary industry in total output value each have great impact on the degree of coordination as shown in Figure 8. On the other hand, total regional output value, investment in fixed assets, and comprehensive utilization of industrial solid waste have little impact.
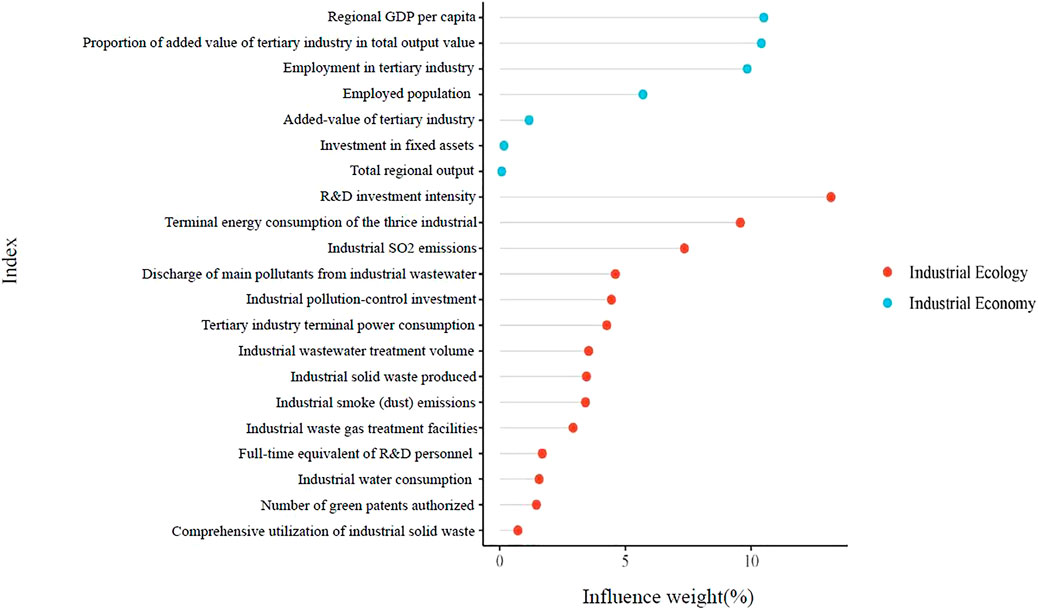
FIGURE 8. Degree of influence of various indicators on the degree of coordination.
4 Discussion
Through comprehensive evaluation, coordination measurement, competition-versus-cooperation analysis, and identification of the driving factors of the degree of coordination of the industrial-ecological economy in the YREB, we found that industrial economic development differs greatly among regions and the process of industrial-ecological development is slow. It is necessary to improve the coordination of the industrial-ecological economy and promote symbiosis between the industrial economy and industrial ecology.
A comprehensive evaluation of the industrial economy in the YREB finds that development is uneven at the provincial level. The geographical span of the YREB is large. Regional advantages, ease of infrastructure construction, and stage of economic development differ between regions are the main reasons for the industrial imbalance across the YREB. Thus, there is more mature development in the downstream area and insufficient industrial construction in the upstream area. Also, in terms of resource allocation and policy guidance, the regulations of different provinces and cities vary greatly (Degefu et al., 2016).
To realize the balanced development of an industrial economy across regions, the government needs to make effective use of the regulatory role of industrial transfer, coordinate and optimize the industrial structure of the upstream, midstream, and downstream area, enhance policy guidance, and foster an atmosphere of innovation (Zhang, 2020). At the same time, combine the efforts of the government and enterprises to understand the resource characteristics of different regions, effectively integrate and allocate resources such as talents, funds, materials, and information. Accelerating the economic development of underdeveloped regions to promote regional coordination. First of all, transfer some industrial chains effectively from the downstream area to the upstream area. This will vigorously promote industrial development and economic growth in the upstream area and narrow the development gap between regions. Second, make full use of advanced science and technology to optimize the level of industrial structure in various regions and promote the rationalization, upgrading, and efficient development of industrial structure (Wu and Zhou, 2020). Third, strengthen the appeal of investment in the central and western regions, and improve the infrastructure and information network construction in economically underdeveloped areas. This will greatly promote the efficient allocation of skills and resources across regions (Wang, 2018). Fourth, strengthen policy guidance and environmental regulations to promote high-quality development of the industrial economy. Finally, create an atmosphere that promotes corporate innovation, promote technological invention and industrial upgrading and transformation with the innovative and transformative spirit of enterprise employees (Naseem et al., 2022), and accelerate the pace of green development of enterprises in various industries.
The level of industrial ecology in the downstream area is higher than in the midstream and upstream, the level is about the same in the midstream and upstream. Furthermore, there is some range in the level of industrial ecology in provinces and cities. The level is relatively high in Shanghai City, Zhejiang and Jiangsu Provinces, a growth trend is clear in Anhui, Hubei Provinces, and Chongqing City, the industrial-ecology gap in other regions is small and the range of fluctuation is stable. However, the current process of development of industrial ecology is relatively slow in the YREB, mainly because some enterprises lack the power and resources for transformation and upgrading. The low availability of skilled labor has hampered industrial innovation and upgrading in the central and western regions and the lack of technological innovation has delayed ecological transformation. In addition, some regions lack an international perspective on ecological concepts because of insufficient opening-up to the outside world.
Industrial ecology is the inevitable requirement of high-quality, green and sustainable industrial development. The YREB needs to strengthen efforts to promote ecological processes in industry, to drive the upgrading of supply chains and transformation of the traditional industrial structure. Provinces and cities (Guizhou, Yunnan, Chongqing, and Jiangxi, etc.) with a low level of industrial ecology should try to implement green and efficient industrial development models, and at the same time seek cooperation in the technical field in regions with a high level of green technology. The enterprises should practice “ecological priority and green development” in industrial development (Gao et al., 2020), guide industry with respect to the direction of industrial development, technological breakthroughs and value creation, and continue to consolidate the tone of green and sustainable development in action. The government needs to promote the ecological transformation and upgrading of industry, punish pollution emitters, guide the integration and development of low-efficiency traditional enterprises with new technologies, support emerging science and technology enterprises, emphasize green innovation, and effectively use green innovation to ameliorate technical and structural problems (Yuan et al., 2018; Gao, 2021). Enterprises should also formulate relevant strategies for attracting technical and managerial talents, provide generous benefits and ensure support for the fundamental elements of industrial development under national policies and regulations. Finally, the government and enterprises must continue to expand their opening-up policy, make effective use of the advanced technology and management ideas from foreign enterprises, and let the spillover effect of cutting-edge technology boost industrial reform in the YREB (Gao, 2019).
The upstream, midstream, and downstream areas show partial symbiosis, full symbiosis, and mutual inhibition, respectively, between industry, and ecology. Jiangsu, Jiangxi, Sichuan, and Guizhou Provinces show a symbiotic relationship. Shanghai City, Chongqing City, and Anhui Province show a partially symbiotic relationship. Zhejiang, Hubei, Hunan, and Yunnan Provinces show a mutually inhibitory relationship. In terms of the factors influencing the degree of coordination, R&D expenditure investment intensity, regional GDP per capita, and the proportion of added-value of tertiary industry in total output value are the three most influential, and industrial-ecological indicators account for the main influence. With regard to competition versus cooperation as well as coordination and its influencing factors within the industrial-ecological economy, the government should try to improve the coordinated development of the various provinces and cities in the YREB and the integrated development of the whole basin (Degefu et al., 2018; Yuan et al., 2019).
Specific measures should be based on factors that have a greater impact on coordination, which can promote the symbiosis of the industrial economy and industrial ecology in various provinces and cities. First, the R&D expenditure investment intensity should be increased, starting with key science and technology breakthroughs and using technology to promote industrial reform. Second, continue to improve employment rates and per capita income in all these regions to ensure basic income, upgrade consumption and improve public awareness of ecological and environmental protection. Third, the government should grasp the development of the three industries from the macro perspective, upgrade the secondary industry, increase the proportion of the tertiary industry, and optimize the layout of the three industries in economic development. Finally, the R&D department of the enterprises should strive to develop new clean energy, such as wind, hydro, solar, and bioenergy (Su, 2019). Improving the treatment of pollutants such as industrial waste gas, industrial wastewater, and industrial solid waste can improve environmental quality and promote coordination between the economy and the environment (An et al., 2018).
To enhance integration in the YREB, the government should carry out top-level planning of industrial development, make an overall plan for the development of the YREB in system regulations, legal documents, development planning and other documents, and reflect the development objectives and strategies in the whole basin from a long-term perspective (Xu et al., 2019). The officials who can make decisions should reasonably cross administrative regional barriers, promote the efficient flow of different types of resources in the whole basin, improve the economic vitality of the YREB, and work towards integrated economic development (Yuan et al., 2021b). The enterprises and government should jointly promote high-quality development of the industrial economy, realize the transformation and optimization of the environment through high-quality development, and shift the economy-resource-environment system toward the long-term goal of collaborative progress with the help of the power of development (Li et al., 2020; Yuan et al., 2020).
5 Conclusion
5.1 Practical Implication of the Study
The development of the industrial-ecological economy has a profound impact on the quality and level of economic and social development. Therefore, this paper described and analyzed the coordination of the industrial-ecological economy in the YREB, China. With the application of the Entropy Method, Coordination-degree Model, Lotka-Volterra Model, and Neural Network Model, we have analyzed the comprehensive level of development, the degree of coordination, the interaction relationship, and the driving factors of the industrial-ecological economy in the YREB from 2009 to 2018. First, the level of the industrial economy and industrial ecology in the YREB has gradually increased, but there is great variation in industrial economic development among provinces and cities and the pace of development of industrial ecology is slow. Second, among the three regions, coordination is best in the midstream area. Among the different provinces and cities, the coordination of Jiangsu Province is the best and that of Hunan Province is the worst. Third, the interactive relationships of partial symbiosis, mutualism, and mutual inhibition are apparent in the upstream, midstream, and downstream areas, respectively. Fourth, R&D expenditure investment intensity, regional GDP per capita, and the proportion of value-added of tertiary industry in total output value are the main factors affecting the degree of coordination. The findings of this paper will help the YREB integrate its ecological advantages into its development advantages, drive development of the industrial economy and industrial ecology, promote the development of ecological industry, ecological agriculture, and ecological service industries, cultivate and strengthen the green economy, improve the industrial system of the YREB, establish a regional coordinated development pattern, and promote the high-quality development of the YREB.
5.2 Limitation of This Research
This article constructed an evaluation index system of the industrial ecological economic system based on the industrial economic system and industrial ecological system. However, the industrial ecological economic system is a complex system, including complex relationships between various variables, as far as the index construction of the system is concerned, only a part of the representative indicators are selected. In addition, the article dynamically described and analyzed the interaction between the industrial economic system and industrial ecosystem based on the Lotka-Volterra Model and there is a lack of specific analysis of the interaction mechanism between the two subsystems. Finally, this paper identified the driving factors of coordination degree of the industrial-ecological economy, however, lacking the in-depth analysis of the impact mechanism of the driving factors.
5.3 Future Direction of Study
These are the directions and topics worthy of further research in the future: Firstly, how to define the industrial ecological economic system more systematically and build a more reasonable index system will help to understand the industrial ecological economic system of the YREB more comprehensively. Secondly, further analyze the interaction principle and rule between the two subsystems in the industrial ecological economic system, identify the conditions of the interaction between the two subsystems, and analyze the threshold for the transformation of the interaction between the two subsystems, which will help optimize the environment of the industrial ecological economy in YREB. Finally, identify the relationship between the internal factors of the industrial ecological economic system, describe the impact mechanism and path of the driving factors on the coupling of the industrial ecological economic system, which will promote the high-quality development of the industrial ecological economic system in the YREB.
Data Availability Statement
The original contributions presented in the study are included in the article/Supplementary Material, further inquiries can be directed to the corresponding author.
Author Contributions
LY: Conceptualization, Methodology, Software, Writing. RL: Writing, Formal analysis, Software, Methodology. WH: Conceptualization, Supervision, Software. XW: Methodology, Writing. YK: Methodology, Writing. DD: Visualization, Investigation. TR: Writing- Reviewing and Editing.
Funding
This work was supported by the Major Program of National Social Foundation of China (No.19ZDA089), the National Natural Science Foundation of China (No.72104127, 71874101, and 72004116), the Ministry of Education (MOE) of China, Project of Humanities and Social Sciences (No.20YJCGJW009), the Center for Reservoir Resettlement, China Three Gorges University (No.2021KFJJ02).
Conflict of Interest
The authors declare that the research was conducted in the absence of any commercial or financial relationships that could be construed as a potential conflict of interest.
Publisher’s Note
All claims expressed in this article are solely those of the authors and do not necessarily represent those of their affiliated organizations, or those of the publisher, the editors and the reviewers. Any product that may be evaluated in this article, or claim that may be made by its manufacturer, is not guaranteed or endorsed by the publisher.
References
Abdo, A.-B., Li, B., Zhang, X., Lu, J., and Rasheed, A. (2020). Influence of FDI on Environmental Pollution in Selected Arab Countries: a Spatial Econometric Analysis Perspective. Environ. Sci. Pollut. Res. 27 (22), 28222–28246. doi:10.1007/s11356-020-08810-4
An, M., Butsic, V., He, W., Zhang, Z., Qin, T., Huang, Z., et al. (2018). Drag Effect of Water Consumption on Urbanization-A Case Study of the Yangtze River Economic Belt from 2000 to 2015. Water 10 (9), 1115. doi:10.3390/w10091115
Anser, M. K., Usman, M., Godil, D. I., Shabbir, M. S., Sharif, A., Tabash, M. I., et al. (2021). Does Globalization Affect the green Economy and Environment? the Relationship between Energy Consumption, Carbon Dioxide Emissions, and Economic Growth. Environ. Sci. Pollut. Res. 28, 51105–51118. doi:10.1007/s11356-021-14243-4
Appiah, K., Du, J., Yeboah, M., and Appiah, R. (2019). Causal Correlation between Energy Use and Carbon Emissions in Selected Emerging Economies-Panel Model Approach. Environ. Sci. Pollut. Res. 26 (8), 7896–7912. doi:10.1007/s11356-019-04140-2
Aziz, N., Sharif, A., Raza, A., and Rong, K. (2020). Revisiting the Role of Forestry, Agriculture, and Renewable Energy in Testing Environment Kuznets Curve in Pakistan: Evidence from Quantile ARDL Approach. Environ. Sci. Pollut. Res. 27 (9), 10115–10128. doi:10.1007/s11356-020-07798-1
Baležentis, T., Streimikiene, D., Zhang, T., and Liobikiene, G. (2019). The Role of Bioenergy in Greenhouse Gas Emission Reduction in EU Countries: An Environmental Kuznets Curve Modelling. Resour. Conservation Recycling 142, 225–231. doi:10.1016/j.resconrec.2018.12.019
Bibi, F., and Jamil, M. (2021). Testing Environment Kuznets Curve (EKC) Hypothesis in Different Regions. Environ. Sci. Pollut. Res. 28 (11), 13581–13594. doi:10.1007/s11356-020-11516-2
Castelão, R. A., de Souza, C. C., and Frainer, D. M. (2021). Southern Mato Grosso State (Brazil) Productive System and its Impact on Emissions of Carbon Dioxide (CO2). Environ. Dev. Sustainability 23 (3), 4134–4148. doi:10.1007/s10668-020-00760-8
Chandrakumar, C., McLaren, S. J., Malik, A., Ramilan, T., and Lenzen, M. (2020). Understanding New Zealand's Consumption-Based Greenhouse Gas Emissions: an Application of Multi-Regional Input-Output Analysis. Int. J. Life Cycle Assess. 25 (7), 1323–1332. doi:10.1007/s11367-019-01673-z
Chapagain, S. K., Mohan, G., and Fukushi, K. (2020). An Extended Input-Output Model to Analyze Links between Manufacturing and Water Pollution in Nepal. Water Air Soil Pollut. 231 (12), 570. doi:10.1007/s11270-020-04940-0
Chen, Z. H. (2004). Recognition of the Coordinated Development of Environment and Economy. Reg. Res. Dev. 4, 21–24. CNKI:SUN:DYYY.0.2004-04-005.
Cheng, W., Xi, H., Sindikubwabo, C., Si, J., Zhao, C., Yu, T., et al. (2020). Ecosystem Health Assessment of Desert Nature reserve with Entropy Weight and Fuzzy Mathematics Methods: A Case Study of Badain Jaran Desert. Ecol. Indicators 119, 106843. doi:10.1016/j.ecolind.2020.106843
Chow, G. C., and Li, J. (2014). Environmental Kuznets Curve: Conclusive Econometric Evidence for CO2. Pac. Econ. Rev. 19 (1), 12048. doi:10.1111/1468-0106.12048
De Jesus Teixeira, M. D., Nogueira, J. M., Imbroisi, D., and de Melo Faria, A. M. (2020). Strategic Sectors for Greenhouse Gas Mitigation Investment: Assessment Based upon the Brazil's Input-Output Matrix. Mitig Adapt Strateg. Glob. Change 25 (2), 261–283. doi:10.1007/s11027-019-09873-6
Degefu, D. M., He, W., Yuan, L., and Zhao, J. H. (2016). Water Allocation in Transboundary River Basins under Water Scarcity: a Cooperative Bargaining Approach. Water Resour. Manage. 30 (12), 4451–4466. doi:10.1007/s11269-016-1431-6
Degefu, D. M., Weijun, H., Zaiyi, L., Liang, Y., Zhengwei, H., and Min, A. (2018). Mapping Monthly Water Scarcity in Global Transboundary Basins at Country-basin Mesh Based Spatial Resolution. Sci. Rep. 8, 2144. doi:10.1038/s41598-018-20032-w
Fang, Z., Razzaq, A., Mohsin, M., and Irfan, M. (2022). Spatial Spillovers and Threshold Effects of Internet Development and Entrepreneurship on green Innovation Efficiency in China. Tech. Soc. 68, 101844. doi:10.1016/j.techsoc.2021.101844
Gao, C., Gao, C., Song, K., and Fang, K. (2020). Pathways towards Regional Circular Economy Evaluated Using Material Flow Analysis and System Dynamics. Resour. Conservation Recycling 154, 104527. doi:10.1016/j.resconrec.2019.104527
Gao, J. C. (2019). Evaluation of the Green Development Level of the Yangtze River Economic Zone and Research on its Spatial Effects. Zhongnan University of Economics and Law. http://iras.lib.whu.edu.cn:8080/rwt/401/https/NNYHGLUDN3WXTLUPMW4A/KCMS/detail/detail.aspx?dbname=CMFD202002&filename=1019863471.nh.
Gao, W. (2021). An Empirical Analysis of the Coupling Effect of Industrial Transformation and Upgrading and Ecological Environment Quality——Based on the test of data from 11 provinces (cities) in the Yangtze River Economic Zone. Contemp. economy 06, 34–40. CNKI.SUN.DAJJ.0.2021-06-009.
Gao, X., Shen, J., He, W., Sun, F., Zhang, Z., Zhang, X., et al. (2019). Changes in ecosystem services value and establishment of watershed ecological compensation standards. Ijerph 16 (16), 2951. doi:10.3390/ijerph16162951
Grossman, G. M., and Krueger, A. B. (1991). Environmental Impacts of a North American Free Trade Agreement. NBER Working Paper No. w3914. Available at: https://ssrn.com/abstract=232073.
Han, M., and Ji, X. (2016). Alternative industrial carbon emissions benchmark based on input-output analysis. Front. Earth Sci. 10 (4), 731–739. doi:10.1007/s11707-016-0574-3
Haseeb, A., Xia, E., DanishBaloch, M. A., Baloch, M. A., and Abbas, K. (2018). Financial development, globalization, and CO2 emission in the presence of EKC: evidence from BRICS countries. Environ. Sci. Pollut. Res. 25 (31), 31283–31296. doi:10.1007/s11356-018-3034-7
Hille, E., and Lambernd, B. (2021). Has Korean growth become greener? Spatial econometric evidence for energy use and renewable energy. Ann. Operations Res. doi:10.1007/s10479-021-04197-8
Huang, P., Guo, M., and Lan, S. (2015). Dynamic evaluation and comparison of the land eco-security of Fujian province with the methods of AHP and Entropy Weight. J. Shenyang Agric. Univ. (Social Sci. Edition) 17 (3), 337–341. doi:10.3969/j.issn.1008.9713.2015.03.020
Iqbal, W., Tang, Y. M., Chau, K. Y., Irfan, M., and Mohsin, M. (2021). Nexus between air pollution and NCOV-2019 in China: Application of negative binomial regression analysis. Process Saf. Environ. Prot. 150, 557–565. doi:10.1016/j.psep.2021.04.039
Irfan, M., Elavarasan, R. M., Ahmad, M., Mohsin, M., Dagar, V., and Hao, Y. (2022). Prioritizing and overcoming biomass energy barriers: Application of AHP and G-TOPSIS approaches. Technol. Forecast. Soc. Change 177, 121524. doi:10.1016/j.techfore.2022.121524
Jaligot, R., and Chenal, J. (2018). Decoupling municipal solid waste generation and economic growth in the canton of Vaud, Switzerland. Resour. Conservation Recycling 130, 260–266. doi:10.1016/j.resconrec.2017.12.014
Jiang, Y. (2020). “Establishment of the Evaluation Index System for the Economic and Environmental Coordination Evaluation Based on the Spatial Durbin Econometric Model,” in Frontier Computing. FC 2019. Lecture Notes in Electrical Engineering. Editors J. Hung, N. Yen, and J. W. Chang (Singapore: Springer), 51. doi:10.1007/978-981-15-3250-4_194
Kanitkar, T., Banerjee, R., and Jayaraman, T. (2019). An integrated modeling framework for energy economy and emissions modeling: A case for India. Energy 167, 670–679. doi:10.1016/j.energy.2018.11.025
Komen, M. H. C., Gerking, S., and Folmer, H. (1997). Income and environmental R&D: Empirical evidence from OECD countries. Envir. Dev. Econ. 2 (4), 505–515. doi:10.1017/s1355770x97000272
Kong, Y., He, W., Yuan, L., Shen, J., An, M., Degefu, D. M., et al. (2019). Decoupling Analysis of Water Footprint and Economic Growth: A Case Study of Beijing-Tianjin-Hebei Region from 2004 to 2017. Int. J. Environ. Res. Public Health 16 (23). doi:10.3390/ijerph16234873
Kong, Y., He, W., Yuan, L., Zhang, Z., Gao, X., Zhao, Y. e., et al. (2021). Decoupling economic growth from water consumption in the Yangtze River Economic Belt, China. Ecol. Indicators 123, 107344. doi:10.1016/j.ecolind.2021.107344
Li, N., Shi, M. J., Zhang, Z. Y., and Chen, Z. G. (2020). Analysis of the effect of the integration policy of the Yangtze River Economic Belt based on the multi-regional CGE model. Chin. J. Manage. Sci. 28 (12), 67–76. doi:10.16381/j.cnki.issn1003-207x.2020.12.007
Li, X. L., Shen, H. L., and Feng, Y. G. (2004). Research on Grey Estimation Method of Logistic and Lotka-Volterra Model Parameters. Coll. Maths. 06, 82–87. CNKI.SUN.GKSX.0.2004-06-018.
Liu, L., Huang, G., Baetz, B., Cheng, G., Pittendrigh, S. M., and Pan, S. (2020). Input-output modeling analysis with a detailed disaggregation of energy sectors for climate change policy-making: A case study of Saskatchewan, Canada. Renew. Energ. 151, 1307–1317. doi:10.1016/j.renene.2019.11.136
Lotka, A. J. (1926). The Frequency Distribution of Scientific Productivity. J. Wash. Acad. Sci. 16 (12), 317–323.doi:10.1016/s0016-0032(26)91166-6
Lundquist, S. (2021). Explaining events of strong decoupling from CO2 and NOx emissions in the OECD 1994-2016. Sci. Total Environ. 793, 148390. doi:10.1016/j.scitotenv.2021.148390
Luo, H., Li, L., Lei, Y., Wu, S., Yan, D., Fu, X., et al. (2021). Decoupling analysis between economic growth and resources environment in Central Plains Urban Agglomeration. Sci. Total Environ. 752, 142284. doi:10.1016/j.scitotenv.2020.142284
Markandya, A., Golub, A., and Pedroso-Galinato, S. (2006). Empirical analysis of national income and SO2 emissions in selected European countries. Environ. Resource Econ. 35 (3), 221–257. doi:10.1007/s10640-006-9014-2
Mensah, I. A., Sun, M., Omari-Sasu, A. Y., Gao, C., Obobisa, E. S., and Osinubi, T. T. (2021). Potential economic indicators and environmental quality in African economies: new insight from cross-sectional autoregressive distributed lag approach. Environ. Sci. Pollut. Res. 28, 56865–56891. doi:10.1007/s11356-021-14598-8
Mohsin, M., Kamran, H. W., Atif Nawaz, M., Sajjad Hussain, M., and Dahri, A. S. (2021). Assessing the impact of transition from nonrenewable to renewable energy consumption on economic growth-environmental nexus from developing Asian economies. J. Environ. Manage. 284, 111999. doi:10.1016/j.jenvman.2021.111999
Naseem, S., Mohsin, M., Zia-Ur-Rehman, M., Baig, S. A., and Sarfraz, M. (2022). The influence of energy consumption and economic growth on environmental degradation in BRICS countries: an application of the ARDL model and decoupling index. Environ. Sci. Pollut. Res. 29 (9), 13042–13055. doi:10.1007/s11356-021-16533-3
Nguyen, H. T., Kojima, N., and Tokai, A. (2019). An input-output linear programming model for assessing climate policy considering economic growth. Environ. Syst. Decis. 39 (1), 34–48. doi:10.1007/s10669-018-9699-0
Rauf, A., Liu, X., Amin, W., Ozturk, I., Rehman, O. U., and Hafeez, M. (2018). Testing EKC hypothesis with energy and sustainable development challenges: a fresh evidence from belt and road initiative economies. Environ. Sci. Pollut. Res. 25 (32), 32066–32080. doi:10.1007/s11356-018-3052-5
Shmelev, S. E. (2012). “Economic Models and the Environment: Input–Output Analysis,” in Ecological Economics. 10.1007/978-94-007-1972-9_6.
Singh, S., and Uma Devi, G. (2020). System Dynamics Simulation Modeling of Transportation Engineering, Energy, and Economy Interaction for Sustainability. Lecture Notes Civil Eng. 69. doi:10.1007/978-981-15-3742-4_24
Su, M. (2019). Research on the coordinated development of energy in the Yangtze River Economic Zone. Macroeconomic Manage. 12, 37–41. 10.19709/j.cnki.11-3199/f.2019.12.008.
Sun, H., Edziah, B. K., Kporsu, A. K., Sarkodie, S. A., and Taghizadeh-Hesary, F. (2021). Energy efficiency: The role of technological innovation and knowledge spillover. Technol. Forecast. Soc. Change 167, 120659. doi:10.1016/j.techfore.2021.120659
Sun, H. J., and Wang, X. H. (2001). Apply artificial neural network to determine the weight of evaluation index. J. Shandong Univ. Sci. Tech. (Natural Sci. Edition) 03, 84–86. 10.16452/j.cnki.sdkjzk.2001.03.025.
Sun, H., Kporsu, A. K., Taghizadeh-Hesary, F., and Edziah, B. K. (2020a). Estimating environmental efficiency and convergence: 1980 to 2016. Energy 208, 118224. doi:10.1016/j.energy.2020.118224
Sun, H., Pofoura, A. K., Adjei Mensah, I., Li, L., and Mohsin, M. (2020b). The role of environmental entrepreneurship for sustainable development: Evidence from 35 countries in Sub-Saharan Africa. Sci. Total Environ. 741, 140132. doi:10.1016/j.scitotenv.2020.140132
Szigeti, C., Toth, G., and Szabo, D. R. (2017). Decoupling - shifts in ecological footprint intensity of nations in the last decade. Ecol. Indicators 72, 111–117. doi:10.1016/j.ecolind.2016.07.034
Tenaw, D., and Beyene, A. D. (2021). Environmental sustainability and economic development in sub-Saharan Africa: A modified EKC hypothesis. Renew. Sustain. Energ. Rev. 143, 110897. doi:10.1016/j.rser.2021.110897
Volterra, V. (1926a). Fluctuations in the Abundance of a Species considered Mathematically1. Nature 118, 558–560. doi:10.1038/118558a0
Volterra, V. (1926b). Variazioni e fluttuazioni del numero d’individui in specie animali conviventi. Memoria Della Regia Accademia Nazionale Del. Lincei Ser. 62, 31–113.
Wan, Y., and Liu, Z. Y. (2020). Environmental Regulation and Green Technological Innovation in the Yangtze River Economic Belt—An Empirical Test Based on Balanced Panel Data. Technology Economy 33 (05), 31–35. 10.14059/j.cnki.cn32-1276n.2020.05.007.
Wang, H.-T., and Wang, T.-C. (2017). The diffusion process, competitive relationship, and equilibrium analysis of smartphone operating systems. Tech. Anal. Strateg. Manage. 29 (4), 414–424. doi:10.1080/09537325.2016.1215420
Wang, W., Li, M., and Zhang, M. (2017). Study on the changes of the decoupling indicator between energy-related CO 2 emission and GDP in China. Energy 128, 11–18. doi:10.1016/j.energy.2017.04.004
Wang, Y. (2018). Research on Cross-Regional Collaborative Optimization of Industrial Ecological Economic System in the Yangtze River Economic Zone. Southeast University. http://iras.lib.whu.edu.cn:8080/rwt/401/https/NNYHGLUDN3WXTLUPMW4A/KCMS/detail/detail.aspx?dbname=CMFD201901&filename=1019822054.nh.
Wu, C. Q., and Zhou, X. Y. M. (2020). Research on the rationalization, advancement and efficiency of the industrial structure of the Yangtze River Economic Belt. Reg. Econ. Rev. 02, 112–120. 10.14017/j.cnki.2095-5766.2020.0039.
Xu, S., He, W., Shen, J., Degefu, D. M., Yuan, L., and Kong, Y. (2019). Coupling and Coordination Degrees of the Core Water-Energy-Food Nexus in China. Ijerph 16 (9), 1648. doi:10.3390/ijerph16091648
Xu, S., He, W., Yuan, L., Degefu, D. M., Yang, Y., and Li, H. (2021). The Relationship between Coordination Degree of the Water-Energy-Food System and Regional Economic Development. Sustainability 13 (3), 1305. doi:10.3390/su13031305
Yang, H. J., and Hu, J. H. (2018). Research on Coordination Degree of Eco-economic System in Yunnan Minority Regions Based on Lotka-Volterra Model. Ecol. Economy 34 (05), 60–65. 10.CNKI.SUN.STJJ.0.2018-05-012.
Yang, Z., Abbas, Q., Hanif, I., Alharthi, M., Taghizadeh-Hesary, F., Aziz, B., et al. (2021). Short- and long-run influence of energy utilization and economic growth on carbon discharge in emerging SREB economies. Renew. Energ. 165, 43–51. doi:10.1016/j.renene.2020.10.141
Yuan, L., He, W., Degefu, D. M., Kong, Y., Wu, X., Xu, S., et al. (2021a). Elucidating competing strategic behaviors using prospect theory, system dynamics, and evolutionary game: a case of transjurisdictional water pollution problem in China. Environ. Sci. Pollut. Res. 29, 20829–20843. doi:10.1007/s11356-021-17034-z
Yuan, L., He, W., Degefu, D. M., Liao, Z., Wu, X., An, M., et al. (2020). Transboundary water sharing problem; a theoretical analysis using evolutionary game and system dynamics. J. Hydrol. 582, 124521. doi:10.1016/j.jhydrol.2019.124521
Yuan, L., He, W., Degefu, D. M., Wan, Z., Ramsey, T. S., and Wu, X. (2021b). “A system dynamics simulation model for water conflicts in the Zhanghe River Basin, China,” in International Journal of Water Resources Development. doi:10.1080/07900627.2021.1873107
Yuan, L., He, W., Liao, Z., Degefu, D., An, M., Zhang, Z., et al. (2019). Allocating water in the Mekong River Basin during the dry season. Water 11 (2), 400. doi:10.3390/w11020400
Yuan, L., He, W., Liao, Z., Degefu, D. M., An, M., and Zhang, Z. (2018). “Simulating water resource disputes of transboundary river: a case study of the Zhanghe River Basin, China,” in IOP Conference Series: Earth and Environmental Science (Institute of Physics Publishing), 111. 012001. doi:10.1088/1755-1315/111/1/012001
Zafar, M. W., Mirza, F. M., Zaidi, S. A. H., and Hou, F. (2019). The nexus of renewable and nonrenewable energy consumption, trade openness, and CO2 emissions in the framework of EKC: evidence from emerging economies. Environ. Sci. Pollut. Res. 26 (15), 15162–15173. doi:10.1007/s11356-019-04912-w
Zhang, D., Mohsin, M., Rasheed, A. K., Chang, Y., and Taghizadeh-Hesary, F. (2021). Public spending and green economic growth in BRI region: Mediating role of green finance. Energy Policy 15, 1122563. doi:10.1016/j.enpol.2021.112256
Zhang, Y.-J., and Zhang, K.-B. (2018). The linkage of CO2 emissions for China, EU, and USA: evidence from the regional and sectoral analyses. Environ. Sci. Pollut. Res. 25 (20), 20179–20192. doi:10.1007/s11356-018-1965-7
Zhang, Y. G. (2020). Interregional Industrial Transfer Mode and Gradient Advantage Reconstruction—The Yangtze River Economic Belt as an Example. Chin. Soft Sci. 3, 87–99. doi:10.3969/j.issn.1002-9753.2020.03.009
Zhang, Y., Sun, M., Yang, R., Li, X., Zhang, L., and Li, M. (2021). Decoupling water environment pressures from economic growth in the Yangtze River Economic Belt, China. Ecol. Indicators 122, 107314. doi:10.1016/j.ecolind.2020.107314
Zhang, Z., He, W., Shen, J., An, M., Gao, X., Degefu, D. M., et al. (2019). The driving forces of point source wastewater emission: Case study of COD and NH4-N discharges in Mainland China. Ijerph 16 (14), 2556. doi:10.3390/ijerph16142556
Zheng, B., Huang, G., Liu, L., Guan, Y., and Zhai, M. (2020). Dynamic wastewater-induced research based on input-output analysis for Guangdong Province, China. Environ. Pollut. 256, 113502. doi:10.1016/j.envpol.2019.113502
Zhou, T. T., and Wang, W. P. (2014). Research on the Coordination of Provincial Industrial Ecological Economic System Based on Lotka-Volterra Model. Chin. J. Manage. Sci. 22 (S1), 240–246. 10.16381/j.cnki.issn1003-207x.2014.s1.052.
Keywords: Yangtze River economic belt, driving factors, coordination, Lotka-Volterra model, industrial-ecological economy
Citation: Yuan L, Li R, He W, Wu X, Kong Y, Degefu DM and Ramsey TS (2022) Coordination of the Industrial-Ecological Economy in the Yangtze River Economic Belt, China. Front. Environ. Sci. 10:882221. doi: 10.3389/fenvs.2022.882221
Received: 23 February 2022; Accepted: 31 March 2022;
Published: 25 April 2022.
Edited by:
Muhammad Mohsin, Hunan University of Humanities, Science and Technology, ChinaCopyright © 2022 Yuan, Li, He, Wu, Kong, Degefu and Ramsey. This is an open-access article distributed under the terms of the Creative Commons Attribution License (CC BY). The use, distribution or reproduction in other forums is permitted, provided the original author(s) and the copyright owner(s) are credited and that the original publication in this journal is cited, in accordance with accepted academic practice. No use, distribution or reproduction is permitted which does not comply with these terms.
*Correspondence: Liang Yuan, bGlhbmd5dWFuQGN0Z3UuZWR1LmNu