 Rebekke Muench
 Emil Cherrington
 Robert Griffin2,3
- 1Earth System Science Center, The University of Alabama in Huntsville, Huntsville, AL, United States
- 2NASA SERVIR Science Coordination Office, NASA Marshall Space Flight Center, Huntsville, AL, United States
- 3Department of Atmospheric and Earth Science, The University of Alabama in Huntsville, Huntsville, AL, United States
- 4AGRHYMET Regional Center, Niamey, Niger
- 5SERVIR-West Africa, Niamey, Niger
Recent studies have estimated annual flood loss at over two billion USD dollars in damage per year globally. This figure is likely to increase as populations grow, people move to flood prone areas, and flooding dynamics change. Digital Elevation Models are a primary input into many flood models; therefore, the accuracy and resolution of these data sets have implications for model accuracy that are not completely understood. An increasing number of DEMs are becoming open and freely available, which presents analysts with the challenge of selecting the most appropriate inputs for their specific use case, especially in countries such as Niger where these global DEMs have not been formally evaluated. This study compares the absolute vertical accuracy of four global and freely available DEMs: Shuttle Radar Topography Mission, ASTER, Advanced Land Observing Satellite, and MERIT, with reference to a high-resolution LiDAR DEM, in southern Niger. Specifically, the Height Above Nearest Drainage (HAND) model is used to investigate the impact of resolution and error on simulated flood extent. There are currently no studies that assess the vertical accuracy of global DEMs in Niger nor that investigate the impact of the DEM geometric variability on flood extents. The ALOS DEM showed the lowest Root Mean Square Error of 1.19 m when compared to the LiDAR DEM, while ASTER had the highest RMSE of 4.2 m. The results of the Height Above Nearest Drainage model showed that at floods under 3 m in depth, the higher resolution DEMs simulated less flood extent; however, once the flood depth exceeded 3 m, the higher the resolution the DEM, the larger the flood extent. These findings suggest that both absolute error and relative error, as well as resolution, should be addressed when applying a DEM to a flood model.
1 Introduction
Accurate elevation data are important in determining areas susceptible to flooding and the decisions made based upon that information (Hawker et al., 2018). While very high spatial resolution (<10 m) Digital Elevation Models (DEMs) are ideal in these cases, these datasets can be expensive and difficult to obtain (Rayburg et al., 2009; Schumann et al., 2014; Watson et al., 2019). Regions that lack easy access to these high-resolution datasets rely on openly available data for analysis (Jarihani et al., 2015; Archer et al., 2018), such as the near-global Advanced Spaceborne Thermal Emission and Reflection Radiometer (ASTER) and Shuttle Radar Topography Mission (SRTM) DEMs. Since the public release of these DEMs, and the movement into an age of open-data access with the opening of the Landsat archive in 2008 (Tellman, 2018), more global DEMs have become available, including the Advanced Land Observing Satellite World 3D-30m (AW3D30) derived from the ALOS satellite. The Multi-Error-Removed Improved Terrain (MERIT) DEM is an enhancement to the SRTM (Yamazaki et al., 2017). The ASTER, SRTM, and ALOS DEMs are Digital Surface Models (DSMs) while the MERIT DEM is closer to a Digital Terrain Models (DTMs). DTMs are elevation models of the earth’s terrain, while DSMs include the height of vegetation canopies and buildings as a part of the elevation (Pandjaitan et al., 2019).
Errors and uncertainty in DEMs are related to the processing mechanisms, the source of the data used to create the DEM (e.g., spaceborne, airborne, or ground-based), the time between the acquisition date of the DEM and subsequent terrain changes, and measurement errors due to positional accuracy (Wechsler, 2007; Hawker et al., 2018). Errors should be acknowledged and understood when using any DEM for analyses such as flood models. In recent years, several studies have analyzed the absolute vertical accuracy through the Root Mean Square Error (RMSE) of various global DEMs across the world as a way of better understanding these differences (Jarihani et al., 2015; Bhuyian and Kalyanapu, 2018; Kramm and Hoffmeister, 2019). In addition to the absolute vertical accuracy, the spatial distribution of DEM elevation differences needs to be considered, as the RMSE solely reflects the error across the study area, not where these differences occur (Kramm and Hoffmeister, 2019).
Limited information exists regarding the accuracy of the free and open global DEMs for the Sahel, let alone Niger, where floods are the most common recurring natural hazard (GFDRR, 2017). Over 2.3 billion people have been affected by flooding globally in the past 20 years (UNSIDR, 2015), and it is expected that by 2050 over two billion more will be vulnerable to flood-related disasters (United Nations University, 2004). This increase in vulnerability is due to a combination of settlement in flood prone areas (Schultz, 2006; Massazza et al., 2019), and changing precipitation patterns across the world. In 2019 alone, for example, floods in Niger killed over 50 people and affected over 200,000 individuals through the destruction of homes and crops and the loss of livestock (Schlein, 2019). Efforts have been made in Niger to create flood suitability systems which are used to inform decisions on infrastructure and zoning (Andersson et al., 2017). As with many flood models, the focus in adjusting the models is on the model variables rather than the input elevation model (Hawker et al., 2018).
Although previous research has compared resolutions of DEMs to determine the implications on simulated flood extent (Jarihani et al., 2015; Bhuyian and Kalyanapu, 2018), several studies suggest that the spatial resolution of the DEM is not the dominant factor that influences the accuracy of flood extent simulations (e.g., Li and Wong, 2010). Rather, recent studies point to the vertical accuracy and relative elevation differences in DEMs as the most critical factors. To further test this paradigm in southern Niger, this study compares the absolute vertical accuracy of four global and freely available DEMs: SRTM, ASTER, ALOS, and MERIT, with reference to a high-resolution LiDAR DEM, and investigates the impact of resolution and vertical error on simulated flood extent by applying the Height Above Nearest Drainage (HAND) model.
2 Methodology
2.1 Study Area
Niger is a country located within the semi-arid Sahelian zone of West Africa, south of the Sahara Desert. Southern Niger is characterized by intense rainfall events from June to September with little rainfall in the dry season from October to May (Boko et al., 2020). Temperatures range from 15 to 45°C on average with a mean annual rainfall of approximately 500 mm (Andersson et al., 2017; Boko, et al., 2020). In recent years, land cover change and variable rainfall have resulted in higher flood peaks that arrive progressively earlier in the season (Mahe et al., 2009; Amogu et al., 2010; Aich et al., 2016). These climatic changes, combined with continued occupation of flood-prone areas and rising population growth rates of over 3% (May 2019), have led to an increase in the number of people vulnerable to floods in Niger (Fiorillo et al., 2018), although it is difficult to quantify such vulnerability due to the lack of direct and indirect studies of flood impacts on rural communities in remote areas across Niger.
The region for this study is located along the border of Mali and Niger, about 180 km northwest of Niamey, the capital of Niger (Figure 1). This area is approximately 1,500 square kilometers and located along the Niger River and at an elevation range of 200–300 m. Many areas in Niger are of difficult access due to poor infrastructure and terrorism making it difficult to obtain ground data that can be used for validating DEMs. This study area was selected due to the availability of LiDAR data, collected by the Kandaji Dam Commission Authority, the availability of in-situ data, and the climatic similarity to other flood-prone areas in Niger.
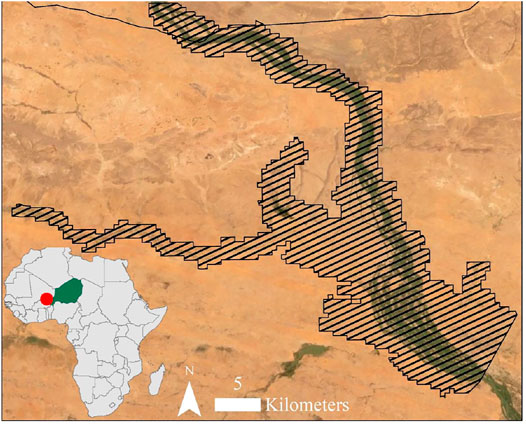
FIGURE 1. Map showing the study area in Southern Niger indicated by the hatch marks.
2.2 Datasets
2.2.1 LiDAR
The LiDAR data were acquired in 2014 by the Kandaji Dam Commission Authority via an airborne LiDAR system. The LiDAR was flown on a Furgo plane that flew at an altitude of 700 m and a speed of 110 kts. The image has a 15 cm resolution with a point density of four points per square meter. As is typical in LiDAR point cloud data, noise was removed from the point cloud by applying a filter which removes any points that are outliers from its adjacent points. The LiDAR point cloud points were used to create a DTM raster for the given study area.
2.2.2 Global Digital Elevation Models
Four global openly available Digital Elevation Models (DEMs) were used in this comparison. These were produced using methods ranging from interferometric synthetic aperture radar (InSAR) to photogrammetric processing of stereo-pair imagery. Photogrammetric stereo-pair processing uses optical data and is a representation of the Earth’s surface rather than the terrain, while DEMs derived from InSAR techniques depend upon the wavelength of the radar as to what the DEM represents in terms of surface or terrain. In this case, the radar wavelength creates a DEM that includes trees and buildings. Additionally, the data used to produce this set of DEMs span 20 years—SRTM data was acquired in 2000 and AW3D30 data was acquired over the past 5 years (Table 1). The different processing methods, types, and dates of the data contribute to the global DEMs having a range of published vertical errors from 5 to 12 m. The impact of the date of data acquisition can vary depending on if there were built structures or extensive changes to vegetation between the date and today. While these DEMs were acquired through different means and at different periods, they are commonly used for flood applications; therefore, they were selected as comparisons to the LiDAR dataset in this application. All of the global DEMs used in this study have published global RMSEs which have been calculated based upon information from representative regions around the world; however, they do not have information specifically for Niger or in application to floods.
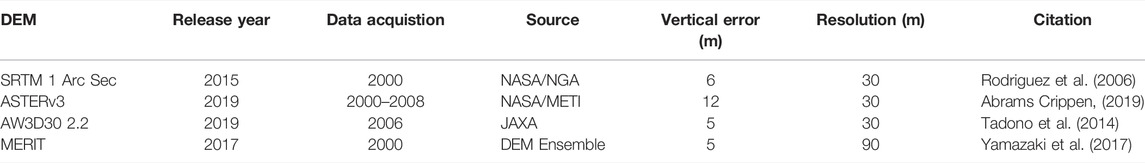
TABLE 1. Global DEMs with their respective sources and accuracies.
The SRTM DEM was produced by the U.S. National Aeronautics and Space Administration (NASA) and the National Geospatial Intelligence Agency (NGA) through an interferometric synthetic aperture radar technique (USGS, 2009) using data acquired in February 2000 from the Space Shuttle Endeavour. This data was made publicly available in 2015 as a 30 m resolution DEM. The data was further edited over the past several years through the addition of IceSat data for elevation corrections and further refinement of high topographic relief areas, yielding the 30 m resolution DEM called the SRTM 1 Arc Sec DEM that was used for this study (Rodríguez et al., 2006). This DEM was created with a C-band radar wavelength, which penetrates partially into the canopies of trees (Meyer, 2019). Therefore, buildings and vegetation can cause artifacts in the SRTM DEM that could affect the topography in comparison to a true digital terrain model (Meyer, 2019).
The ASTER GDEM was generated by NASA and the Japanese Ministry of Economy, Trade, and Industry (METI), using photogrammetric processing of near infrared (0.78–0.86 μm) 15 m resolution stereo images. The images were acquired by the ASTER sensor from the Terra satellite from 2000 to 2008 (Hirano et al., 2003), with the first version being released in 2009. The dataset has been updated twice since the first version, with version two and three released in 2011 and 2019, respectively. For each version, additional stereo-pairs were added, and the algorithm to create the DEM was adjusted to improve the spatial resolution, and the horizontal and vertical accuracies (NASA, 2020). The most recent version, ASTERv3, was used for this study, which will be referred to as ASTER throughout the remainder of the paper.
The first version of the Advanced Land Observing Satellite (ALOS) World DEM 3D (AWD3D30) was openly released in 2015. Subsequently, updated versions have been released which incorporate corrections based on IceSat data, several low-quality areas, and correct for cloud and snow pixels. The most recent release of the AWD3D was in 2019. AW3D30 2.2, which was used for this study, improvements include an updated coastline and the inclusion of missing tiles over land areas from other existing DEMs (JAXA, 2020).
The Multi-Error-Removed-Improved-Terrain (MERIT) DEM was developed by removing several errors that were present in existing global DEMs, such as stripe noise, absolute bias, speckle noise, and tree height bias (MERIT, 2018). The two main input DEMs for this were the SRTM v2.1 and the ALOS World 3D DEM v1. Both of the input DEMs are 30 m resolution; however, the resulting MERIT DEM is 90 m. Additional data that were used to help improve the DEM included IceSat/GLAS, Landsat NDVI, and JAMSTEC water body data (Yamazaki et al., 2017).
2.3 DEM Comparison
Two standard methods to compare DEMs are through Root Mean Square Error (RMSE) and spatial differencing. RMSE represents the absolute vertical variance, while a spatial differencing represents a spatial analysis of DEM elevation differences across the landscape. To appropriately compare the DEMs to one another, they were re-projected to the one common projection and vertical datum (Figure 2).
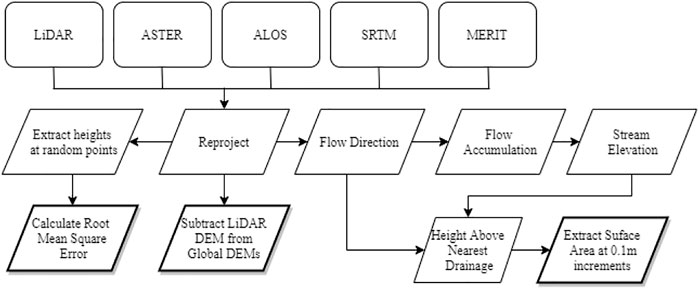
FIGURE 2. Flow chart of the three primary comparisons performed between the DEMs.
2.3.1 Root Mean Square Error
To determine the absolute vertical error for each of the global DEMs, random points were selected that intersect both the LiDAR DEM and the global DEMs. The elevation values for each of these respective DEMs were extracted and the Root Mean Square Error (RMSE) was calculated for each of the DEMs. The RMSE is a way to estimate error between two datasets and is always positive with a value of zero indicating a perfect fit to the data. The RMSE is calculated using the equation below:
Where
2.3.2 Absolute Height Difference
Each of the global DEMs was subtracted from the LiDAR DEM (Figure 2; Eq. 1). The resultant rasters illustrate the deviations in elevation by the global DEMs in comparison to the LiDAR DEM. This highlights the relative accuracies across the study area.
2.4 Height Above Nearest Drainage
The Height Above Nearest Drainage (HAND) is a terrain model which normalizes the topography to the local relative heights along a drainage network and is widely accepted for simple hydrologic applications (Rodda, 2005; Nobre et al., 2011). HAND has been applied to a variety of applications from the creation of synthetic rating curves (Zheng et al., 2018) to simple flood modeling (Garousi-Nejad et al., 2019). The primary inputs into HAND are a flow accumulation raster and an extracted stream elevation raster (Figure 2). These inputs require additional DEM pre-processing including hydrologically conditioning by filling for sinks and calculating the flow direction before determining the flow accumulation. The resultant HAND raster shows the height of each pixel above the nearest drainage point. From the HAND raster, the surface area at incremental flood depths is calculated by selecting the pixels that are below a specified height above the nearest drainage.
3 Results
3.1 DEM Comparison
The AW3D30 2.2 had the lowest RMSE with a value of 1.19 m while the ASTERv3 had the highest overall RMSE of 4.22 m. SRTM 1 Arc Sec and MERIT fell in between with RMSEs of 2.38 and 1.98 m, respectively. The low RMSE of the AW3D30 2.2 indicates the DEM differed the least from the LiDAR DEM while the higher RMSE of the ASTERv3 indicates the DEM differed the greatest from the LiDAR DEM.
The RMSE was also evaluated for 10-m elevation increments from 200 to 280 m to determine if there was a relationship between the RMSE and the elevation heights. The elevation ranges were equal in elevation range but not size; therefore, sample points were randomly selected in proportion to the percentage of the total area. The higher in elevation the band, the larger the RMSE for the given DEM. The AW3D30 had the smallest range of RMSEs from 1.74 to 4.61 while the MERIT DEM had the largest range of RMSEs from 1.63 to 12.55 (Table 2).
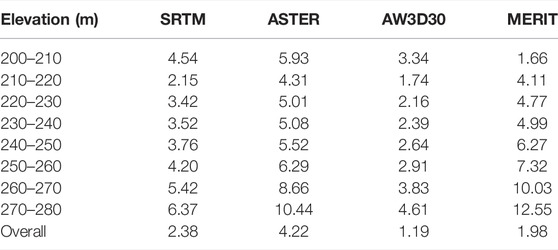
TABLE 2. RMSE for each DEM at 10-m elevation intervals of the LiDAR DEM.
Based on the histograms of the DEM difference rasters in Figure 3, the SRTM and MERIT DEMs appear to underestimate the height, the AW3D30 overestimates the height, and ASTER both overestimates and underestimates the height across the study area. On average, SRTM and MERIT underestimated by 2.82 and 4.44 m, respectively, while AW3D30 overestimated by 1.92 m. Generally, the AW3D3 DEM 0slightly overestimated across the entire study area (Figure 3A). The SRTM DEM underestimated the elevation primarily in the northern part of the study area (Figure3B), overall these differences are fairly small compared to the MERIT DEM. The MERIT DEM underestimated primarily around the rivers, particularly along the braided channel in the southern part of the study area (Figure 3C).
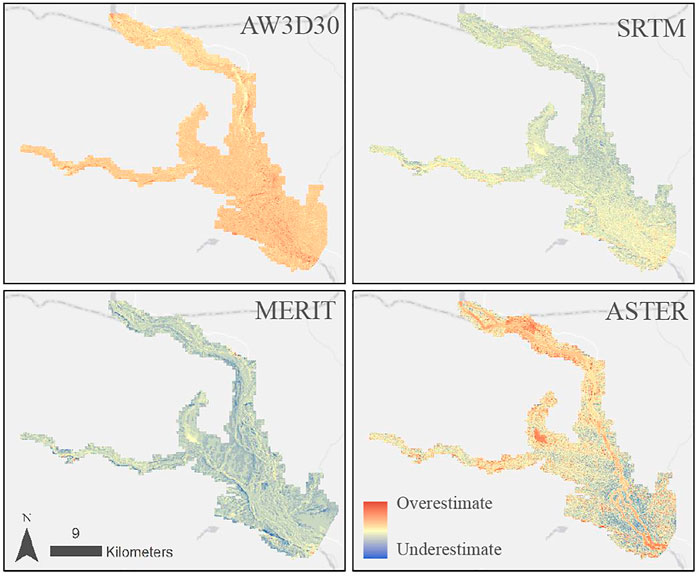
FIGURE 3. Spatial differences of the global DEMs from the LiDAR DEM. Red represents areas that are positive and the global DEM overestimates height compared to the LiDAR DEM, yellow no difference in the global DEM and the LiDAR, and blue is negative meaning the global DEM underestimates the height, compared to the LiDAR DEM.
In contrast, the ASTER elevation differences across the study area were on both extremes of overestimating and underestimating the elevation which averaged to an overall underestimation of 0.92 m. ASTER overestimated elevation along the primary Niger River riverbeds and underestimated in the land surrounding the braided channel (Figure 3D). These elevation differences are highlighted in Figure 3D as the only DEM with the largest range of elevation differences.
3.2 Height Above Nearest Drainage
The 1,500 square kilometer study area is characterized by low topographic relief and small tributaries that flow into the larger Niger River. The flood surface area derived from the HAND model was calculated at 1 m flood depth increments, shown in Table 3. At the 1-m flood depth, ASTER covered the most surface area with 156.48
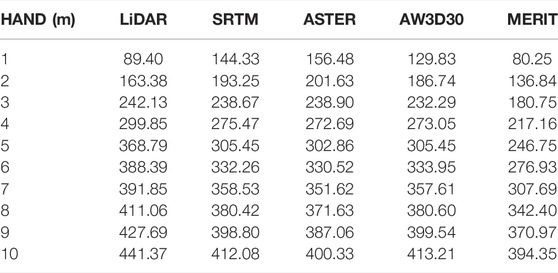
TABLE 3. Flood extents derived from each DEM for each 1-m flood depth interval in square kilometers.
The RMSE was calculated for the HAND values of the global DEMs were compared to the LiDAR HAND values at 1-m increments. There is no distinctive pattern of a higher or lower HAND value being better in the global DEMs. The RMSEs of the HAND values for the whole study area were 2.98, 3.49, 2.44, and 3.05 for the SRTM, ASTER, AW3D30, and MERIT DEMs respectively. The ASTER RMSE was on the lower side for the first two HAND levels, but one of the highest for the remainder. The AW3D30 RMSEs remained one of the lowest RMSEs throughout all HAND levels (Table 4).
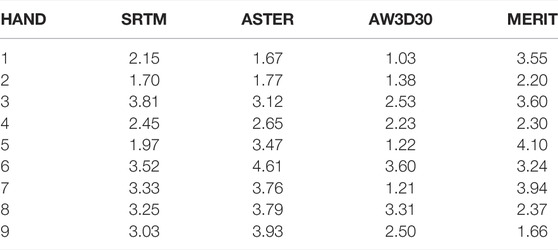
TABLE 4. RMSE of each HAND value in 1-m increments for the global DEMs.
The flood extent values for the DEMs were graphed to better depict how the extents changed per the DEM as the flood level increased (Figure 4). The general trend seen at higher flood levels (greater than 3 m) is the LiDAR DEM had the greatest surface area, while the MERIT DEM had the least surface area. Under 3 m flood depth, the MERIT DEM still had the least surface area, but the LiDAR DEM also had less surface area than the AW3D30, ASTER, and SRTM DEMs in contrast to situations in which the flood depth is greater than 3 m (Table 2; Figure 4).
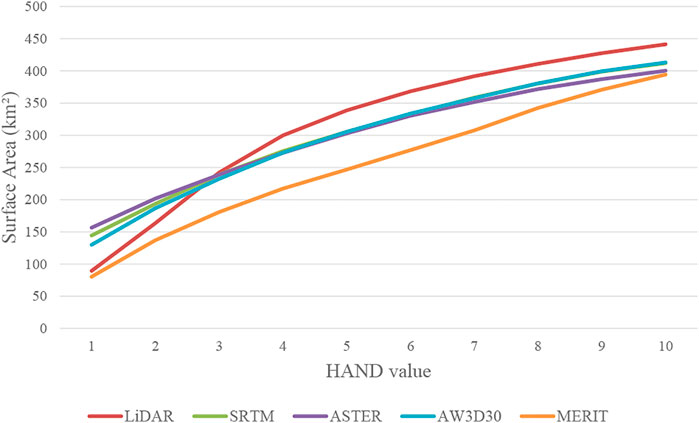
FIGURE 4. Differences in flood extent as the flood depth increases from 0 to 10 m for the LiDAR and global DEMs.
The differences in the flooded surface area are more evident in certain parts of the study area, such as at the convergence of the rivers in the middle of the study area at the 6-m flood depth (Figure 5). The 6-m flood depth depicts the DEM flood extent differences well, where the LiDAR has the largest flooded surface area, the 30 m DEMs are about the same surface area, and the MERIT has the least flooded surface area.
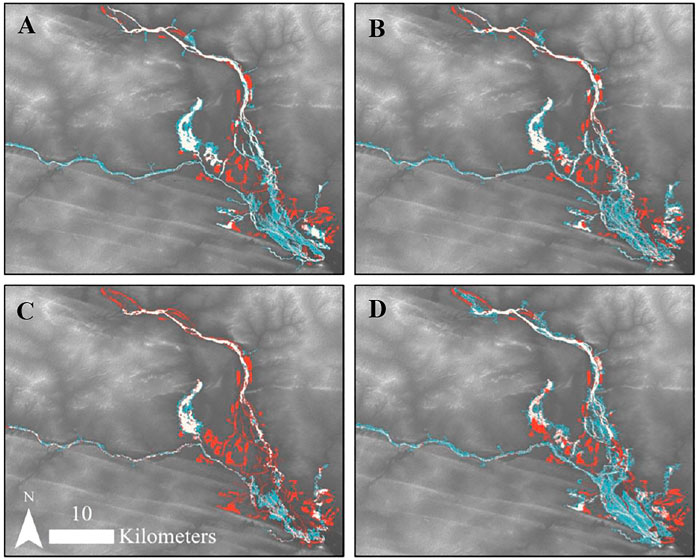
FIGURE 5. Comparisons of AW3D30, SRTM, MERIT, and ASTER DEMs [(A–D), respectively] derived flood extents to the LiDAR DEM derived flood extents from the HAND model where white is agreement, red is the LiDAR DEM, and blue is the global DEM.
The primary driver of the differences in the flood surface area is the resolution of the DEM (5, 30, or 90 m). Figure 5 depicts an example of how the DEM affects the flood surface area when the flood depth is at 6 m. There is one area in the middle of the image, northwest of the larger part of the river, where a large difference can be seen between the DEMs. The LiDAR flooded area almost covers the whole section, whereas the MERIT is not flooded. The AW3D30, ASTER, and SRTM flooded areas have somewhere in between the LiDAR and MERIT, with SRTM having a more flooded surface area in the region than ASTER and AW3D30.
Differences in flood extents derived from the HAND model were caused by the elevation differences (Figure 6). At the 2 m flood height, the overall surface area of ASTER was greater than the LiDAR DEM flood surface area at 201.63
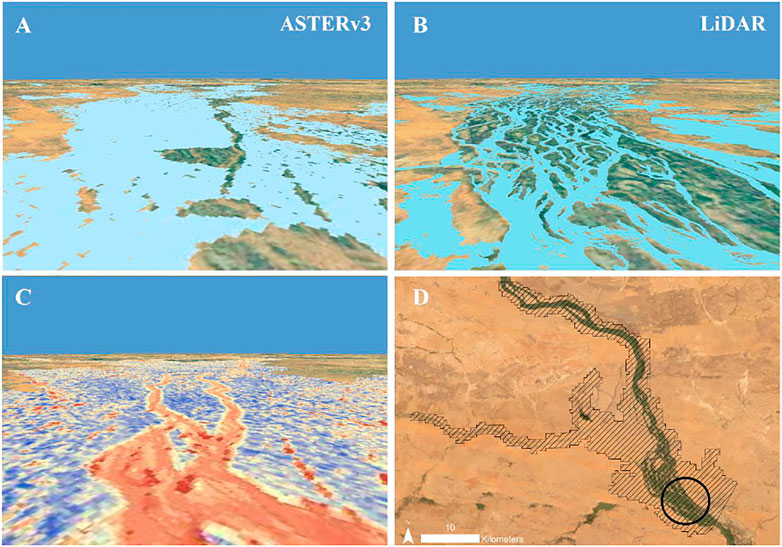
FIGURE 6. ASTER and LiDAR DEM extents at 2 m flood height in (A,B), respectively. (C) ASTER and LiDAR distribution of elevation differences where red overestimates elevation and blue underestimates elevation (D) location indicator within the study area of A, B and C.
4 Discussion
4.1 DEM Comparison
The range of RMSEs are a result of differences in land cover, processing methods, and date of data acquisition. The four global DEMs were edited and/or released in the last 5 years; however, much of the input data to create the DEMs are 10–20 years old. Landscape changes due to tree growth, the formation sand dunes, and flood plain erosion and sedimentation, all contribute to uncertainties in freely available global DEMs. Land use changes and other built structures can heavily influence flood extent in ways that global DEMs cannot capture. Vegetation can increase the DEM elevation error by 5 m or more, depending on the vegetation type (Weydahl et al., 2007; LaLonde et al., 2010). In semi-arid regions, such as the Sahel in West Africa, it is common for the presence of riparian vegetation and sparse vegetation throughout the rest of the landscape. The presence of vegetation along the rivers, and limited elsewhere, can significantly impact the flow of the rivers and the delineation of the drainage basin (Oksanen and Sarjakoski, 2005).
Along with date of data acquisition and land cover, the input data were acquired and processed differently. SRTM 1 data was acquired via C-band radar while ASTERv3 data were stereo-pair optical imagery. The acquisition processes result in variations in the portrayal of elevation in the DEM. The optical imagery represents the tops of trees as the elevation at a given point, while the radar can penetrate partially into the tree canopy, resulting in a lower elevation. The AW3D30 DEM data were also optical stereo images, while the MERIT DEM is an ensemble of multiple DEMs with different input data types. The input data for the DEMs determined the data processing techniques which are characterized by specific errors. InSAR, the process to create the DEM from radar data, is characterized by random errors through speckle noise (Farr et al., 2007), while the stereo-pair processing can lead to blunders and stripping in the DEM (Tarekegn and Sayama, 2013). These errors impact the overall accuracy and RMSE.
The RMSEs for all four DEMs were lower than those of previous studies as well as the global RMSEs (Florinsky et al., 2018; Kramm and Hoffmeister, 2019; Yap et al., 2019). All four of the DEMs had a RMSE of at least 4 m less than their globally published RMSEs (Table 1). SRTM products differed from previous literature for RMSE and the overall elevation. In this study, on average, the SRTM DEM was lower than the LiDAR DEM by 2.82 m; however, studies found that previous versions of the SRTM DEM are on average higher globally than truth datasets which is why local studies such as this one are important (Li and Wong, 2010; Jarihani et al., 2015; Bhuyian and Kalyanapu, 2018). The ASTER DEM coincided with these studies as on average it was lower in elevation than the LiDAR DEM. The discrepancy in the average elevation differences for the SRTM DEM and the RMSEs for all DEMs could be attributed to the version of the DEM used in the study as well as the study area characteristics. This study used the most recently released versions of the DEMs, while most of the studies used earlier versions. Additionally, most DEM comparison studies are in areas with high topographic relief and vegetation, in contrast to the low topographic relief and sparse vegetation of Niger (Florinsky et al., 2018; Watson et al., 2019). There are strong correlations between vegetation height and DEM error (Kellndorfer et al., 2004), therefore the presence or absence of vegetation is a plausible driving factor in the RMSE and elevation differences between previous studies and this study.
4.2 Flood Applications
The study corroborated previous studies that found the DEM resolution may impact the flood model (Poulter and Halpin, 2008; Gallegos et al., 2009) as demonstrated in the flood depths from three to 10 m where as spatial resolution increased, the flood extent area decreased (Table 2). However, the flood depths below the 3 m HAND value did not correlate to the resolution. Before the 3-m depth, the 30 m resolution DEMs had the largest flood extent, then the 5 m DEM, followed by the 90 m DEM. This suggests that DEM resolution is not the only factor and may not be the dominant factor that influences variations among flood results (Li and Wong, 2010).
While resolution and total flood extent surface area are related, there are differences amongst the DEMs for where flooding occurs at a given flood depth which is not directly correlated with the resolution. For example, at the 6-m flood depth (Figure 5), the intersection of the two main branches in the study area is flooded in the LiDAR DEM and not flooded in the MERIT DEM based HAND model flood extents. While these differences coincide with the resolution, the 30 m DEMs vary in their flood extents. ASTERv3 is almost completely flooded in this area, like the LiDAR DEM, while AW3D30 and SRTM are less flooded. If resolution were the only factor influencing flood estimation, these DEMs should have similar flood estimates (Hawker et al., 2018). The variations in the flood extent within the 30 m resolution DEMs must then be related to the other sources of error such as random error, blunders, or processing methodologies.
ASTER, SRTM, and AW3D30 all had different spatial distributions of elevation differences (Figure 3) which translated into variations in flood extent at the different flood heights. For example, the elevation of the DEM has an impact flood extent where the ASTER elevation is higher than the LiDAR along the central western edge of the study area. AW3D30 overestimates elevation in this area which translates into no flooded area in the 6-m flood height, while SRTM underestimates the elevation and is flooded for this area (Figures 3, 4). The location and distribution of the elevation differences for a given DEM impact where the model simulates flood extent. In the southern part of ASTER, the riverbed elevations are higher than the LiDAR DEM (Figure 6). This overestimation of elevation leads to one of the rivers not being flooded in the 2-m flood height while in the LiDAR DEM the river is flooded. The relative accuracy and relationship of the elevation measurements to one another are further demonstrated with the RMSEs of the HAND values. As each of the DEMs over or underestimates elevations are various points in the study area in comparison to the LiDAR, their HAND values also differ from the LiDAR DEM. The AW3D30 DEM had the lowest RMSE for both the absolute accuracy and the relative accuracy when compared to the LiDAR DEM while the ASTER DEM had the highest RMSE for both. While these two assessments agree which of these two DEMs are most like the LiDAR DEM, the SRTM and MERIT DEMs are flipped. This illustrates that it is important to understand the holistic impact the choice of the DEM may have on the analysis in selecting one for analysis. While a higher resolution DEM such as the LiDAR DEM would provide the most detail and information for a decision maker, this is not realistic, especially in data sparse areas. Therefore, the information from this study can be used to assist in the selection of the input DEM for the flood analyses.
Local water management authorities often rely on one flood model with one DEM input to understand which areas are most vulnerable to flooding and to make decisions on providing support. The differences in DEM resolution as well as the overall absolute and relative accuracy impact the results of flood models. The coarser the resolution of the DEM, the less the smaller tributaries are captured in the topography and the less the smaller differences in elevation change are captured resulting in less flooded surface in the models. In areas with low topographic relief, such as Niger, where 2-m RMSE is the difference to a house flooding, high-resolution DEMs are important for flood planning. The recently released Forest and Building Removed Copernicus DEM (FABDEM) (Hawker et al., 2022) may improve upon the effects of the riparian vegetation impacts. Additionally, the high-resolution 2-m EarthDEM is an upcoming DEM that will be open to the public (NCSA, 2021) and can be used in applications that require elevation data higher resolution than 30 m. As these new technologies become available it is important to increase the understanding of the impact of DEMs on flood modeling and move beyond the impact of the other hydrologic components (Bhuyian and Kalyanapu, 2018) so decision makers can plan accordingly with the best information possible.
5 Discussion
The objectives of this study were to compare the differences of commonly used, open, quasi-global DEMs and understand how these differences affect simulated flood extent when used in the Height Above Nearest Drainage model. When comparing absolute elevations with a local LiDAR dataset, AW3D30 had the lowest RMSE followed by MERIT and SRTM, with ASTERv3 having the highest RMSE. Overall, MERIT, SRTM and ASTERv3 have lower elevations than the LiDAR DEM while AW3D30 has a higher elevation than the LiDAR. These differences were spatially different; where the DEM overestimated or underestimated elevation were geographically independent. Based upon the study’s results, the AW3D30 DEM would be the best suited for the flood applications in areas similar to the study area. The spatial distribution of the elevation differences combined with the DEM horizontal resolution resulted in variations in the flood extent at various flood heights. The variations in the flood extents portrayed the importance in understanding the potential errors and impacts different DEMs have on the overall flood extent when using a HAND-based model. Depending on the DEM used, officials would make predictions on future flood regions and make decisions based on those predictions. As more data becomes available in this age of free and open data, it is important to understand the implications of choosing one dataset over another for decision making.
Data Availability Statement
The raw data supporting the conclusion of this article will be made available by the authors, without undue reservation.
Author Contributions
RM conducted the analysis, writing, and formulation of the idea. EC, RG, and BM supported the formulation of the idea and provided comments on the content of the paper.
Funding
This work was funded through Co-operative agreement number: NNM11AA01A.
Conflict of Interest
The authors declare that the research was conducted in the absence of any commercial or financial relationships that could be construed as a potential conflict of interest.
Publisher’s Note
All claims expressed in this article are solely those of the authors and do not necessarily represent those of their affiliated organizations, or those of the publisher, the editors and the reviewers. Any product that may be evaluated in this article, or claim that may be made by its manufacturer, is not guaranteed or endorsed by the publisher.
Acknowledgments
Thank you to SERVIR Global and the SERVIR Science Coordination Office for their technical support and encouragement. The Kandaji Dam Authority is thanked for providing the LiDAR data and relevant documentation. We thank AGRHYMET Regional Center and SERVIR-West Africa for their support in this research. ASTER GDEM is a product of NASA and METI. The AW3D30 DEM is provided by the Japan Aerospace Exploration Agency (JAXA) at http://www.eorc.jaxa.jp/ALOS/en/aw3d30/.
References
Abrams, M., and Crippen, R. (2019). ASTER GDEM V3 (ASTER Global DEM) User Guide. California: California Institute of Technology.
Aich, V., Koné, B., Hattermann, F., and Paton, E. (2016). Time Series Analysis of Floods across the Niger River Basin. Water 8 (4), 165. doi:10.3390/w8040165
Amogu, O., Descroix, L., Yéro, K. S., Le Breton, E., Mamadou, I., Ali, A., et al. (2010). Increasing River Flows in the Sahel? Water 2 (2), 170–199. doi:10.3390/w2020170
Andersson, J. C. M., Ali, A., Arheimer, B., Gustafsson, D., and Minoungou, B. (2017). Providing Peak River Flow Statistics and Forecasting in the Niger River Basin. Phys. Chem. Earth, Parts A/B/C 100, 3–12. doi:10.1016/j.pce.2017.02.010
Archer, L., Neal, J. C., Bates, P. D., and House, J. I. (2018). Comparing TanDEM-X Data with Frequently Used DEMs for Flood Inundation Modeling. Water Resour. Res. 54 (12), 10,205–10,222. doi:10.1029/2018wr023688
Bhuyian, M. N. M., and Kalyanapu, A. (2018). Accounting Digital Elevation Uncertainty for Flood Consequence Assessment. J. Flood Risk Manag. 11, S1051–S1062. doi:10.1111/jfr3.12293
Boko, B. A., Konat, M., Yalo, N., Berg, S. J., Erler, A. R., Bazi, P., et al. (2020). Watershed in Niamey. Niger, West Africa: MDPI Water.
Farr, T. G., Rosen, P. A., Caro, E., Crippen, R., Duren, R., Hensley, S., et al. (2007). The Shuttle Radar Topography Mission. Rev. Geophys. 45 (2), 183. doi:10.1029/2005rg000183
Fiorillo, E., Crisci, A., Issa, H., Maracchi, G., Morabito, M., and Tarchiani, V. (2018). Recent Changes of Floods and Related Impacts in Niger Based on the ANADIA Niger Flood Database. Climate 6 (3), 59. doi:10.3390/cli6030059
Florinsky, I. V., Skrypitsyna, T. N., and Luschikova, O. S. (2018). Comparative Accuracy of the AW3D30 DSM, ASTER GDEM, and SRTM1 DEM: A Case Study on the Zaoksky Testing Ground, Central European Russia. Remote Sens. Lett. 9 (7), 706–714. doi:10.1080/2150704X.2018.1468098
Gallegos, H. A., Schubert, J. E., and Sanders, B. F. (2009). Two-Dimensional, High-Resolution Modeling of Urban Dam-Break Flooding: A Case Study of Baldwin Hills, California. Adv. Water Resour. 32 (8), 1323–1335. doi:10.1016/j.advwatres.2009.05.008
Garousi‐Nejad, I., Tarboton, D. G., Aboutalebi, M., and Torres‐Rua, A. F. (2019). Terrain Analysis Enhancements to the Height above Nearest Drainage Flood Inundation Mapping Method. Water Resour. Res. 55 (10), 7983–8009. doi:10.1029/2019wr024837
GFDRR (2017). Niger: Community Based Disaster Risk Reduction. Available at: https://www.gfdrr.org/en/niger (Accessed January 15, 2020).
Hawker, L., Bates, P., Neal, J., and Rougier, J. (2018). Perspectives on Digital Elevation Model (DEM) Simulation for Flood Modeling in the Absence of a High-Accuracy Open Access Global DEM. Front. Earth Sci. 6, 233. doi:10.3389/feart.2018.00233
Hawker, L., Uhe, P., Paulo, L., Sosa, J., Savage, J., Sampson, C., et al. (2022). A 30 M Global Map of Elevation with Forests and Buildings Removed. Environ. Res. Lett. 17, 024016. doi:10.1088/1748-9326/ac4d4f
Hirano, A., Welch, R., and Lang, H. (2003). Mapping from ASTER Stereo Image Data: DEM Validation and Accuracy Assessment. ISPRS J. Photogrammetry Remote Sens. 57 (5–6), 356–370. doi:10.1016/S0924-2716(02)00164-8
Jarihani, A. A., Callow, J. N., McVicar, T. R., Van Niel, T. G., and Larsen, J. R. (2015). Satellite-Derived Digital Elevation Model (DEM) Selection, Preparation and Correction for Hydrodynamic Modelling in Large, Low-Gradient and Data-Sparse Catchments. J. Hydrology 524, 489–506. doi:10.1016/j.jhydrol.2015.02.049
JAXA (2020). ALOS Global Digital Surface Model "ALOS World 3D - 30m" (AW3D30). Available at: https://www.eorc.jaxa.jp/ALOS/en/aw3d30/index.htm (Accessed March 1, 2020).
Kellndorfer, J., Walker, W., Pierce, L., Dobson, C., Fites, J. A., Hunsaker, C., et al. (2004). Vegetation Height Estimation from Shuttle Radar Topography Mission and National Elevation Datasets. Remote Sens. Environ. 93 (3), 339–358. doi:10.1016/j.rse.2004.07.017
Kramm, T., and Hoffmeister, D. (2019). A Relief Dependent Evaluation of Digital Elevation Models on Different Scales for Northern Chile. ISPRS Int. J. Geo-Information 8 (10), 430. doi:10.3390/ijgi8100430
LaLonde, T., Shortridge, A., and Messina, J. (2010). The Influence of Land Cover on Shuttle Radar Topography Mission (SRTM) Elevations in Low-Relief Areas. Trans. GIS 14 (4), 461–479. doi:10.1111/j.1467-9671.2010.01217.x
Li, J., and Wong, D. W. S. (2010). Effects of DEM Sources on Hydrologic Applications. Comput. Environ. Urban Syst. 34 (3), 251–261. doi:10.1016/j.compenvurbsys.2009.11.002
Mahé, G., Bamba, F., Soumaguel, A., Orange, D., and Olivry, J. C. (2009). Water Losses in the Inner Delta of the River Niger: Water Balance and Flooded Area. Hydrol. Process. 23 (22), 3157–3160. doi:10.1002/hyp.7389
Massazza, G., Tamagnone, P., Wilcox, C., Belcore, E., Pezzoli, A., Vischel, T., et al. (2019). Flood Hazard Scenarios of the Sirba River (Niger): Evaluation of the Hazard Thresholds and Flooding Areas. Water 11 (5), 1018. doi:10.3390/w11051018
MERIT (2018). MERIT DEM: Multi-Error-Removed Improved-Terrain DEM. Available at: http://hydro.iis.u-tokyo.ac.jp/∼yamadai/MERIT_DEM/ (Accessed October 15, 2018).
Meyer, F. (2019). “Spaceborne Synthetic Aperture Radar – Principles, Data Access, and Basic Processing Techniques,” in SAR Handbook: Comprehensive Methodologies for Forest Monitoring and Biomass Estimation. Editors A. Flores, K. Herndon, and R. Thapa (Cherrington, UK: E. NASA). doi:10.25966/ez4f-mg98
NASA (2020). ASTER: Advanced Spaceborne Thermal Emission and Reflection Radiometer. NASA. Available at: https://asterweb.jpl.nasa.gov/index.asp (Accessed March 9, 2020).
NCSA (2021). Blue Water Supercomputer Helps Map the Earth. Available at: https://www.ncsa.illinois.edu/ncsas-blue-waters-supercomputer-helps-map-the-earth/ (Accessed December 17, 2021).
Nobre, A. D., Cuartas, L. A., Hodnett, M., Rennó, C. D., Rodrigues, G., Silveira, A., et al. (2011). Height above the Nearest Drainage - a Hydrologically Relevant New Terrain Model. J. Hydrology 404 (1–2), 13–29. doi:10.1016/j.jhydrol.2011.03.051
Oksanen, J., and Sarjakoski, T. (2005). Error Propagation Analysis of DEM‐based Drainage Basin Delineation. Int. J. Remote Sens. 26 (14), 3085–3102. doi:10.1080/01431160500057947
Pandjaitan, N., Sutoyo, S., Rau, M. I., Febrita, J., Dharmawan, I., and Akhmat, I. (2019). “Comparison between DSM and DTM from Photogrammetric UAV in Ngantru Hemlet, Sekaran Village, Bojonegoro East Java,” in Proc. SPIE 11372, Sixth International Symposium on LAPAN-IPB Satellite, Bogor, Indonesia, December 24, 2019., 1137223. doi:10.1117/12.2541839
Poulter, B., and Halpin, P. N. (2008). Raster Modelling of Coastal Flooding from Sea‐Level Rise. Int. J. Geogr. Inf. Sci. 22 (2), 167–182. doi:10.1080/13658810701371858
Rayburg, S., Thoms, M., and Neave, M. (2009). A Comparison of Digital Elevation Models Generated from Different Data Sources. Geomorphology 106 (3–4), 261–270. doi:10.1016/j.geomorph.2008.11.007
Rodda, H. J. E. (2005). The Development and Application of a Flood Risk Model for the Czech Republic. Nat. Hazards 36 (1–2), 207–220. doi:10.1007/s11069-004-4549-4
Rodríguez, E., Morris, C. S., and Belz, J. E. (2006). A Global Assessment of the SRTM Performance. Photogrammetric Eng. Remote Sens. 72 (3), 249–260. doi:10.14358/PERS.72.3.249
Schlein, L. (2019). Niger: Tens of Thousands Impacted by Devastating Floods. Washington, DC, USA: Voice of America. Available at: www.voanews.com/africa/niger-tens-thousands-impacted-devastating-floods.
Schultz, B. (2006). Flood Management under Rapid Urbanisation and Industrialisation in Flood-Prone Areas: A Need for Serious Consideration. Irrig. Drain. 55, S3–S8. doi:10.1002/ird.237
Schumann, G. J.-P., Bates, P. D., Neal, J. C., and Andreadis, K. M. (2014). Fight Floods on a Global Scale. Nature 507 (7491), 169. doi:10.1038/507169e
Tadono, T., Ishida, H., Oda, F., Naito, S., Minakawa, K., and Iwamoto, H. (2014). Precise Global DEM Generation by ALOS PRISM. ISPRS Ann. Photogramm. Remote Sens. Spat. Inf. Sci. II-4, 71–76. doi:10.5194/isprsannals-ii-4-71-2014
Tarekegn, T. H., and Sayama, T. (2013). Correction of Srtm Dem Artefacts by Fourier Transform for Flood Inundation Modeling. J. Jpn. Soc. Civ. Eng. Ser. B1 (Hydraulic Engineering) 69 (4), I_193–I_198. doi:10.2208/jscejhe.69.i_193
Tellman, B. (2018). Clandestine Political Economic Activity in Landscape Dynamics- Linking Patter to Process. People Pixels Revisted, 1–15.
United Nations University (2004). Two Billion Vulnerable to Floods by 2050; Number Expected to Double or More in Two Generations. ScienceDaily. Available at: www.sciencedaily.com/releases/2004/06/040614081820.htm (Accessed June 14, 2004).
UNSIDR (2015). The Human Cost of Weather Related Disasters. Available at: https://www.unisdr.org/files/46796_cop21weatherdisastersreport2015.pdf (Accessed February 5, 2020).
Watson, C., Kargel, J., Tiruwa, B., Watson, C. S., Kargel, J. S., and Tiruwa, B. (2019). UAV-Derived Himalayan Topography: Hazard Assessments and Comparison with Global DEM Products. Drones 3 (1), 18. doi:10.3390/drones3010018
Wechsler, S. P. (2007). Uncertainties Associated with Digital Elevation Models for Hydrologic Applications: A Review. Hydrol. Earth Syst. Sci. 11 (4), 1481–1500. doi:10.5194/hess-11-1481-2007
Weydahl, D. J., Sagstuen, J., Dick, Ø. B., and Rønning, H. (2007). SRTM DEM Accuracy Assessment over Vegetated Areas in Norway. Int. J. Remote Sens. 28 (16), 3513–3527. doi:10.1080/01431160600993447
Yamazaki, D., Ikeshima, D., Tawatari, R., Yamaguchi, T., O'Loughlin, F., Neal, J. C., et al. (2017). A High-Accuracy Map of Global Terrain Elevations. Geophys. Res. Lett. 44 (11), 5844–5853. doi:10.1002/2017GL072874
Yap, L., Kandé, L. H., Nouayou, R., Kamguia, J., Ngouh, N. A., and Makuate, M. B. (2019). Vertical Accuracy Evaluation of Freely Available Latest High-Resolution (30 M) Global Digital Elevation Models over Cameroon (Central Africa) with GPS/Leveling Ground Control Points. Int. J. Digital Earth 12 (5), 500–524. doi:10.1080/17538947.2018.1458163
Keywords: flood, DEM, RMSE, West Africa, HAND, SERVIR
Citation: Muench R, Cherrington E, Griffin R and Mamane B (2022) Assessment of Open Access Global Elevation Model Errors Impact on Flood Extents in Southern Niger. Front. Environ. Sci. 10:880840. doi: 10.3389/fenvs.2022.880840
Received: 21 February 2022; Accepted: 15 April 2022;
Published: 04 May 2022.
Edited by:
Ana Maria Tarquis, Polytechnic University of Madrid, SpainReviewed by:
Vagner Ferreira, Hohai University, ChinaGuy Jean-Pierre Schumann, University of Bristol, United Kingdom
Copyright © 2022 Muench, Cherrington, Griffin and Mamane. This is an open-access article distributed under the terms of the Creative Commons Attribution License (CC BY). The use, distribution or reproduction in other forums is permitted, provided the original author(s) and the copyright owner(s) are credited and that the original publication in this journal is cited, in accordance with accepted academic practice. No use, distribution or reproduction is permitted which does not comply with these terms.
*Correspondence: Rebekke Muench, cmViZWtrZS5tdWVuY2hAdWFoLmVkdQ==