 Jordan D. Muell
 Rabi H. Mohtar
 Eun Sung Kan
 Amjad T. Assi
 Valentini Pappa
94% of researchers rate our articles as excellent or good
Learn more about the work of our research integrity team to safeguard the quality of each article we publish.
Find out more
ORIGINAL RESEARCH article
Front. Environ. Sci., 24 August 2022
Sec. Environmental Systems Engineering
Volume 10 - 2022 | https://doi.org/10.3389/fenvs.2022.880839
This article is part of the Research TopicWater-Energy-Food-Health Solutions & Innovations for Low-Carbon, Climate-Resilient DrylandsView all 13 articles
Largely due to manure management, intensive livestock production is known to negatively impact air, water, and soil quality. Excessive manure is often applied to soil as fertilizer or stored in lagoon. However, some thermo-chemical methods, such as gasification and pyrolysis, can transform manure from waste into a valuable resource. The closed-loop dairy concept employs these methods to create biochar derived from cow manure for use as a soil amendment and a water filtration medium. This closed-loop concept has the potential to produce syngas and bio-oil for production of electricity, and to reduce excessive nutrients in liquid manure irrigation by filtering manure slurry stored in lagoons. It replaces solid manure with biochar in land applications to further reduce nutrient runoff and increase soil resilience against erosion. In this study, a Water-Energy-Food-Waste nexus-based analysis and resource allocation tool was developed to evaluate the economic, environmental, and social feasibility of the closed-loop dairy system. The tool utilizes several levers to simulate a user-specified dairy operation, such as number of livestock, acres farmed, quantity of effluent irrigation, distribution of manure and biochar products, and type of biomass conversions. Financial estimates from central Texas in 2018 were used to evaluate the profitability of these practices against the costs of a dairy and hay operation. The study showed that the closed-loop dairy system, while case dependent, could be profitable and, based on operational costs, a small dairy of approximately 200 cows could break even. Results also indicate that the benefits of biomass conversions to produce energy byproducts should increase with scale. This study can help many dairy farms that are considering the economic and environmental sustainability of the industry, which has been under scrutiny.
Agriculture is a major sector of the economy and human survival. It provides for food security and livelihood for many communities. It is, however, has a significant water and ecological footprint. The beef and dairy industry, in particular, is a major economic engine for many communities around the world. However, the circularity and the sustainability of these systems are in question (Jones et al., 2021).
The Texas beef and dairy industries represent one of the largest, fastest growing beef and dairy-sheds in the United States. These industries are significant producers of food and carry significant environmental footprints, with 4.4 million beef cows and 490,000 dairy cows (USDA NASS, 2017). According to Safferman and Wallace (2015), one cow requires 50 gallons of water daily, for drinking, cooling, milk cooling, and washing. In a study of 47 dairy farms in western France, van der Werf et al. (2009) reported an average of 338.6 kW-hours per hectare of electricity used annually on conventional farms, and reported producing an average of 946.06, 6.49, and 136.66 kg of carbon dioxide, nitrous oxide, and methane per hectare, respectively. Regarding the impact of conventional dairy farms on surface and groundwater quality, the same study reported an average yield of 305.26 and 1.07 kg of nitrate and phosphate per hectare. Dairies lie at the intersection of water, energy, food, and environmental dynamics.
Steinfeld et al. (2006) showed that manure management impacts air, water, and soil quality. Commonly, solid manure from animal production facilities is land-applied as fertilizer and exceeds crop nutrient needs. Such application occurs locally, as the weight and quantity of manure makes transport expensive. Emissions of nitrous oxide (N2O) result from nitrification and denitrification in the soil following manure application, and from livestock bedding and surface storage pits. Methane (CH4) is produced from the anaerobic decomposition of organic matter in manure and directly from livestock by enteric fermentation (Chadwick et al., 2011). Manure applied in excess can transport nitrate and phosphate to surface water bodies through runoff. Lagoons that store slurry can leach nutrients into groundwater over the long term. Excessive nutrients in surface water leads to eutrophication (Kato et al., 2009). Nitrogen and phosphorous are the main nutrients in dairy manure. According to Lorimor et al. (2004), the average value of both nitrogen and phosphorous nutrients in dairy manure ranges from 300 to 800 parts per million (ppm). Choi et al. (2019) found total nitrogen of 460–850 ppm, total phosphorus of 60–150 ppm and total (Chemical Oxygen Demand) COD of 1,000–3,000 ppm from manure pits and first and second lagoons at the dairy farm. Closed-loop dairy systems use manure-derived biochar to treat wastewater, recover nutrients, enhance biomethane production, and capture greenhouse gases through adsorption (Anzilotti, 2017; Jang et al., 2018; Choi et al., 2019). Biochar is resistant to erosion and can be used as a slow-release fertilizer (Sadeghi et al., 2020a) studies biochar impact on reducing soil erosion in Loess and Marl soils. When modified in the lab, biochar can capture antibiotics, pesticides, hormones, heavy metals, and other possible contaminants (Baronti et al., 2010; Choi and Kan 2019; Jang and Kan, 2019). Biochar is produced both from gasification and from pyrolysis, at approximately 30% and 50–60% respectively, of biomass input. It has demonstrated benefits, including carbon sequestration, increased soil fertility, increased efficiency of nutrient and water use, and reduced emissions (Baronti et al., 2010). In a study of biochar properties from different types of biomasses, Singh et al. (2010) found that biochar derived from cow manure has high electrical conductivity, relatively low carbon, moderate nitrogen, and high phosphorus. The carbon to nitrogen ratio and high phosphorus content of manure-derived biochar makes it the most available, nutrient rich source of biochar compared to plant biomass.
Pyrolysis and gasification are two thermo-chemical methods of processing manure into valuable resources. Pyrolysis heats biomass at high temperatures in the absence of oxygen (Mukhtar and Capareda, 2012), bringing about gaseous, liquid, and solid primary products in the absence of an oxidant. It produces synthesis gas (syngas), a combination of hydrogen and carbon monoxide. The liquid product is bio-oil, and the solid product is biochar, which have various agronomic benefits.
Produced syngas has various energy uses and can be processed into other fuel or burned to generate electricity. With follow-up treatment, a process that may require adjusting acid content and removing moisture and oxygenated compounds, bio-oil has several uses including transportation and electricity generation. The third component, biochar, can be used as a cost-effective adsorbent, catalyst and photocatalyst for the removal of various contaminants in water and can replace current expensive adsorbents and catalysts used for water treatment (Kim and Kan, 2016; Choi and Kan, 2019; Jang and Kan, 2019). Most syngas is formed at higher temperatures; most solid biochar is produced at lower temperatures. Liquid products are produced at moderate temperatures (400–600°C). Bio-oil yields are maximized at a shorter residence time or lower heating rate. According to Bridgwater (2012), a temperature of approximately 400°C with a residence time of hours to days, provides conditions to produce 35% biochar, 30% liquid, and 35% gaseous products, by weight.
As discussed by Fernandez-Lopez et al. (2016), an alternative to pyrolysis is gasification or the heating of biomass in a partial oxidation atmosphere to produce syngas and biochar. In gasification operations, the air to fuel (A/F) ratio is important. It is calculated by dividing the product of each element and its molecular weight in air by that of the fuel combusted. Thus, the percent elemental components of the fuel must be known. Without controlling the A/F ratio, as much as 50% of N2 gas, which has no energy content, can be present in the produced syngas, which can be converted to liquid fuel or electricity.
This research explores the technological and economic sustainability of the beef and dairy industry in Texas and how it can they be transformed into a more circular food system.
A systems model of the closed-loop system will relate water, wastewater reuse, nutrient management, energy, and agricultural productivity. By valuing the consumption and production of water, energy, emissions, and soil health for a unit of crop and animal production, the model reflects the nexus implications of agricultural systems (Mohtar, 2015). For this work, a farm scale water-energy-food nexus tradeoff analysis tool was developed to reflect an average size dairy farm in Texas. The tool can indicate the benefit to farmers of implementing the closed-loop system. To illustrate the benefits and embedded costs, the nexus-based tool depicts the tradeoffs between cost and income from respective water, energy, and food resources, and local environmental impacts of the system.
The specific objectives of the study are to: 1) build a system-based tool for tradeoff analysis and resource allocation for management of farm-scale dairy waste, agricultural yield, environmental impact, and costs; 2) evaluate the circularity of the dairy farm system using the resource tradeoffs of a closed-loop dairy system at farm scale for agricultural yield, environmental impacts, and costs.
The concept of Water-Energy-Food (WEF) Nexus describes a framework of resource modeling that considers the interactions and tradeoffs between sectors that normally operate in siloes (Mohtar and Daher, 2012). The concept is useful for achieving sustainable solutions to complex problems on local, regional, national, and international scales. The nexus perspective provides a platform for economic and policy decisions. Animal production systems are a nexus hotspot in Texas, for which the closed-loop system presents a holistic solution. A nexus hotspot is “a vulnerable sector or region at a defined scale, facing stresses in one or more of its resource systems due to resource allocation at odds with the interconnected nature of food, energy, and water resources” (Daher et al., 2018). As described above, dairy manure management exhibits an economic and environmental tradeoff from the waste disposal resulting from dairy operations and negatively impacts the region’s environment. This externality of the dairy business is a cost of producing food for the market. Additional tradeoffs for dairy food production lie in energy consumption, both electricity and liquid fuel, to run the dairy.
The research was based at a study site of the Southwest Regional Dairy Center, Stephenville, Texas (“Dairy Center”), located in the Brazos River Basin (Figure 1). The Dairy Center has approximately 400 cows and generates approximately 3.2 tons of manure and 32,500 pounds of raw milk daily. Free stalls are flushed by water in rotation as the cows are moved to milking. Manure collects in a pit system, from which solid manure is scraped every other day. A screen at the end of the pit system filters larger particles from the liquid manure slurry, which then moves into the first lagoon. Half of the effluent from the second lagoon is returned to a water tank at the free stalls for flushing and the remaining half is used to irrigate nearby fields (see also Figure 4).
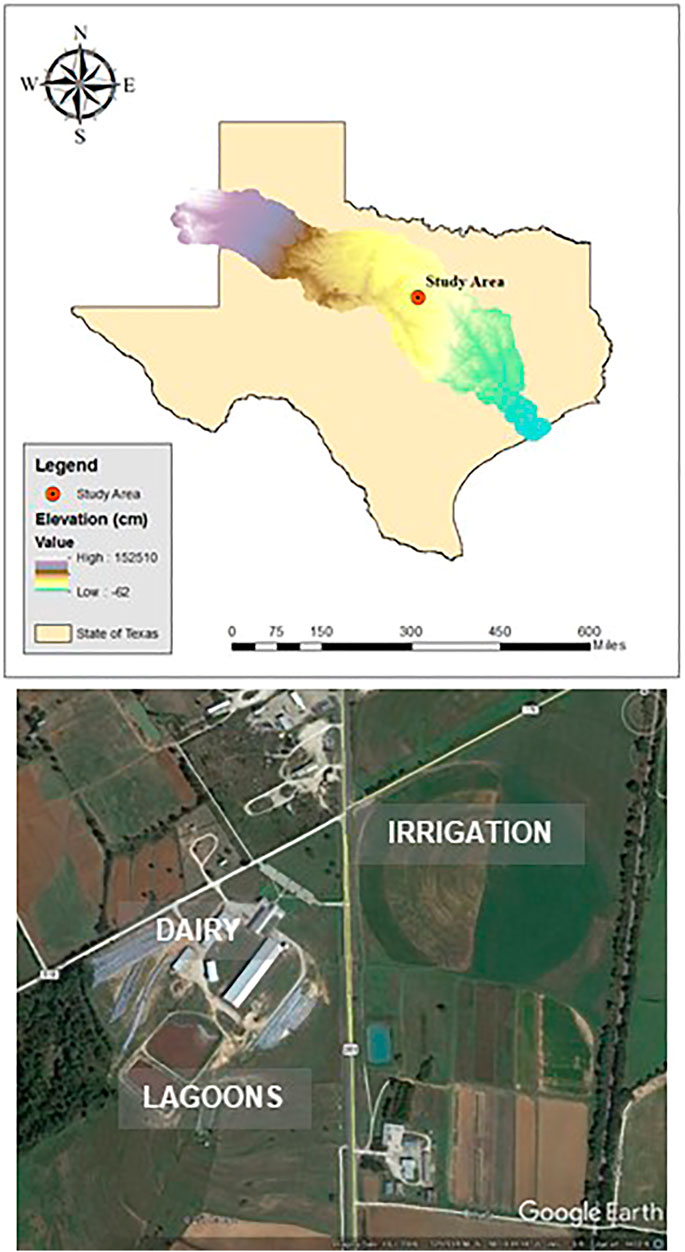
FIGURE 1. Study area: immediately north of Stephenville, Texas, in the Brazos River Basin.
This operation is representative of many medium-sized dairies in central Texas with the potential for application of the closed-loop dairy system. Figure 2 illustrates from a system perspective, the closed-loop dairy system processes. Stages of focus are designated as inputs (yellow), system processes and stages, such as lagoons within the Dairy Center (blue), and outputs (green). System “flows” are designated by Nexus type: water, energy, food, manure, or slurry. The only system input is freshwater. Two outputs (feed and electricity) are “closed-loop” and reenter the system as inputs. Outputs include dairy products, human wastewater, runoff, and infiltration. Land application of manure and biochar are considered a closed-loop input to influence the feed.
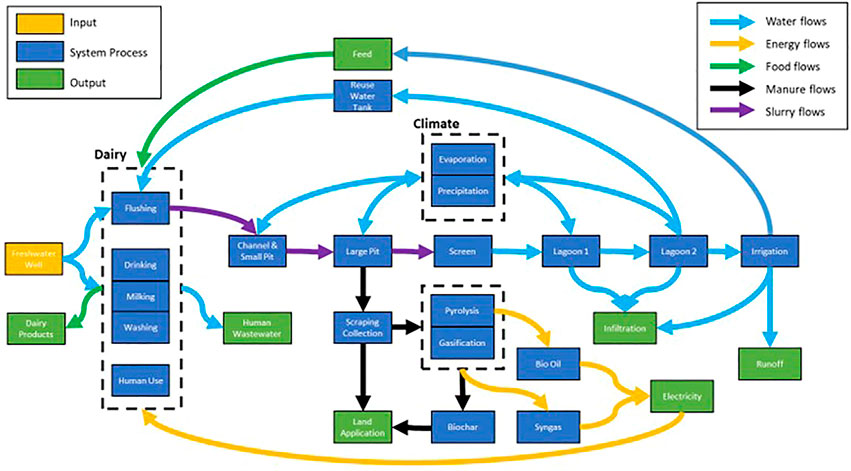
FIGURE 2. Nexus-based system schemata of the southwest regional dairy center.
Water quality is a main factor in identifying water reuse potential. Water samples were taken from the second wastewater treatment lagoon, the final point in the manure storage system (Figure 2; Table 1). To observe the effect of wastewater treatment as the manure effluent moves through the system, water samples were taken at pits, screen, and first wastewater treatment lagoon. To observe the effect of seasonal changes in climate on effluent water quality, samples were collected on three occasions from each location: May, June, and November 2017. Samples were tested for pH, oxygen demand (OD), nitrogen, phosphorus, ammonia, and bacteria. Five water samples of 500 ml each were drawn from radially equidistant locations around the edge of the lagoons. Five samples were taken from cascading wastewater directly from the screen, prior to flowing into lagoon 1. Five samples were collected from equidistant points throughout the pit system, starting just out of the free stalls and ending just before the solid mass of manure lying in front of the screen.
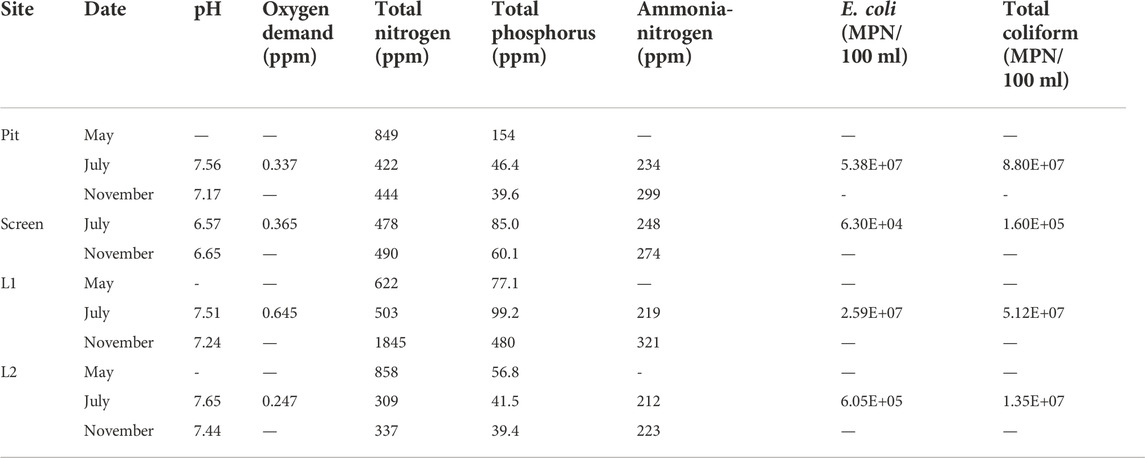
TABLE 1. Water quality from the wastewater treatment lagoon.
The Dairy Center provided detailed records of crops grown, lagoon water levels, effluent applications, and solid manure applications. The Winter-2017 growing season database showed that most of the 24 fields grew different types of hay or forage, and the majority (six) grew coastal Bermuda grass, the crop selected for analysis in this study. Two fields, New Kirk East and New Kirk West, were selected to provide respectively, study application rates and intervals of effluent and manure (Figure 1). Based on records from September 2016 to July 2017, New Kirk East received effluent irrigation approximately every 3 days, with a standard deviation of 6 days. Application of manure effluent is irregular and based on the necessities of draining the lagoon and withholding irrigation due to rain. New Kirk East, approximately 85 acres, was irrigated an average of 0.37 inches per month with a standard deviation of 0.26 inches, minimum of 0.11 inches, and a maximum of 0.74 inches. Volume of effluent irrigation varies seasonally and is generally less in winter and more in summer. No supplemental freshwater irrigation is applied to New Kirk East. During the period September 2013 to August 2017, New Kirk West received solid manure application approximately every 7 days, with a standard deviation of 12 days (most of the data was from April 2016 to August 2017). According to Dairy Center records, the field received an average of 0.54 tons of manure per acre (on dry basis) with a standard deviation of 0.49 tons/acre (on dry basis). It is important to note the high deviation of values in both the application interval and rate. These amendments were applied based on farmer experience and daily climate conditions.
Energy consumption is a major component of a dairy farm budget. The average monthly electricity use during the period June 2016 to June 2017 was provided by the Dairy Center. For this study, the amount did not include electricity for pumping water from a well reserved for the Dairy Center. Using the average local electricity rate ($0.113/kWh), the average monthly expense for the farm, and the potential savings from syngas electricity generation were calculated using local diesel prices from Stephenville in June 2020 ($1.80/gal) and potential savings from bio-oil production were estimated. The local operating costs for growing hay were obtained from Texas A&M AgriLife Extension (2018) District eight Crop and Livestock Budget Sheets, on a per-acre basis. The cost and income of milk production for the state of Texas in 2016 on a per-hundredweight (cwt) basis was taken from USDA ERS (2016). Overhead and fixed costs were ignored: while significant for a dairy farm budget, it is largely dependent on the financial conditions of the individual farm, including interest rates on loans. Focusing on the operating costs is sufficient to evaluate the closed-loop system for manure management and various outputs. The capital and operating cost of equipment needed for the closed-loop system biomass conversions were estimated from the literature.
According to Capareda (2013), the syngas yield from biochar is 2.11 m3 per ton of manure input and its heating value is 4.19 MJ/m3. Biochar yield from gasification was determined to be 15.0% by weight through pilot-scale research on dairy manure at Texas A&M. From pyrolysis, biochar yield was found to be 31.0% at a temperature of roughly 300°C (Cely et al., 2015). An average syngas yield of 17.6% by weight (standard deviation 5.65%) was assumed, based on literature review of a broad range of biomass (Cantrell et al., 2011; Capareda 2013; Crombie and Masek, 2014). The density of syngas (0.95 kg/m3) was used to find the volumetric yield (Brar et al., 2013). Using the same literature as for syngas, yield of bio-oil from pyrolysis was determined to be 32.4% by weight from a broad range of biomass, with a standard deviation of 5.98%. Raw bio-oil quality as fuel is incompatible with conventional fuel because of its high oxygen content. To be used as biofuel, in place of diesel or gasoline, bio-oil must be deoxygenized and refined; many methods exist, including integrated catalytic pyrolysis, decoupled hydrotreating, zeolite vapor cracking, esterification, and gasification to syngas followed by refining (Bridgwater, 2012). Some of these processes result in a loss of yield: an upgrading efficiency of 80% was assumed for this study, based on Bridgwater (2012).
Using the framework developed by Sadeghi et al., 2020b, a nexus-based tool was developed to capture the processes of the dairy farm system for purposes of the tradeoff analysis. Figure 3 portrays the tool framework and the specific calculations used. State independent variables are shown in yellow; system process calculations are in blue and using the calculation parameters listed in Table 2. Because crop yield data was unavailable, the Soil and Water Assessment Tool (SWAT) in ArcMap (ArcSWAT) was used to estimate yield and environmental impacts of the manure management (Texas A&M AgriLife Extension, 2018), as discussed below. SWAT uses water quality data to model effluent irrigation nutrient and water balance using climate and topographic data, generating estimates for both crop yield and environmental impacts. Processes performed using SWAT are shown in orange, and system outputs in green (Texas A&M AgriLife Extension, 2018). Figure 3 identifies the flows of water, energy, food, waste, and cash in the tool. The inputs were adjustable and used to create model scenarios. The tool is broken into two modules monthly: income and expenses. The income module has three submodules: crop yield, savings, and biomass conversions. The scenarios were created by adjusting the inputs and were evaluated in terms of relative financial and environmental impact.
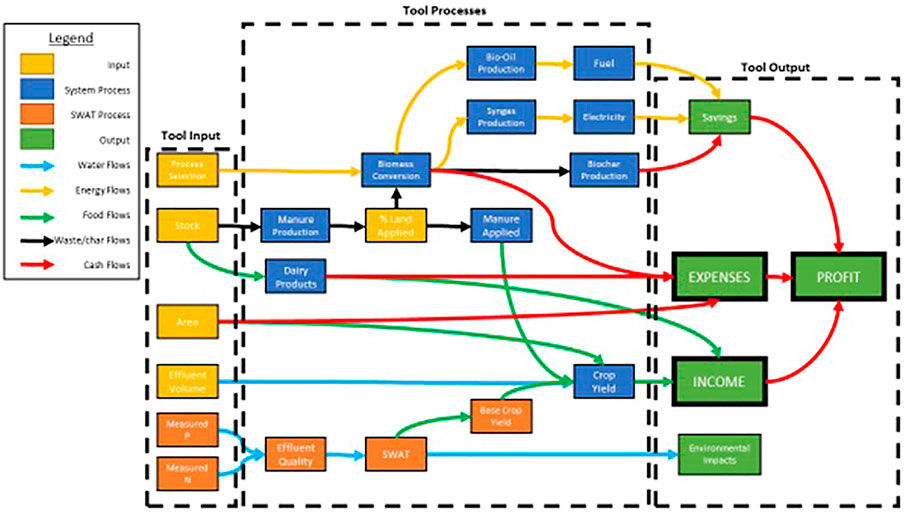
FIGURE 3. The nexus tool framework for Southwest Regional Dairy Farm. Inputs, resources flow and calculations, and outputs in the dairy system.

TABLE 2. Summary of process parameters.
The summary of process parameters is shown in Table 2. The input parameters include: 1) size of herd, 2) area farmed, 3) volume of effluent irrigation applied, and 4) the option of gasification or pyrolysis. Farm income is generated from crops grown on land that is irrigated with liquid manure effluent and with solid manure applied. According to the AgriLife budget sheets, a roll of hay is worth approximately $55. Fields can have some amount of biochar, produced by gasification or pyrolysis applied. Given 8.2 tons of manure produced daily by 400 cows, 0.62 tons per cow per month was used for the tool. The section on biomass conversions allows the user to choose between gasification and pyrolysis. For pyrolysis, the conditions of experimental research at Texas A&M AgriLife were used: temperature of 350°C and retention time of 3 h. The respective yield of syngas, bio-oil, and biochar factors were as discussed previously (Bridgwater, 2012). This pilot scale reactor was previously used at the Southwest Regional Dairy Center. The conditions of the Texas A&M Fluidized Bed Gasifier were assumed for gasification: the bed temperature was 762°C with an air flow of 0.42 m3/min and fuel feed rate of 339 g/min (Capareda, 2013).
To determine the amount of electricity produced for the farm, an electricity conversion efficiency of 30% was estimated per Capareda (2013). The outputs of the biomass conversions submodule include electricity, fuel, and biochar production. If the user selects pyrolysis, bio-oil will also be produced. A similar process is used to estimate the savings of bio-oil refined for fuel use (Eq. 3). Calculation of manure input to biomass conversions uses Eq. 1:
Where, M = manure input to biomass conversions (tons)
N = number of cows.
MP = manure production (ton/cow).
PM = percent of produced manure for land application (%)
Syngas can save considerable electricity consumed, the expected saving in electricity can be calculated such that:
Where, ESS = electricity savings from syngas ($)
YS = syngas yield from gasification or pyrolysis (m3/ton).
HVS = syngas heating value (MJ/m3).
ηE = electricity conversion efficiency (%).
C1 = unit conversion (0.28 kW h/MJ).
EV = electricity value ($/kWh).
Bio-oil can replace fossil fuel used in the dairy farm; the savings in fossil fuel consumption is calculated as follows:
Where, FS = fuel savings ($)
YBO = bio-oil yield from pyrolysis (%).
νBO = specific volume of bio-oil (m3/ton).
ηU = upgrade efficiency (%).
C2 = unit conversion (264.2 gal/m3).
Bio-oil can substitute for fuel oil in static application, including electricity generating turbines (Bridgwater, 2012). Thus, an additional user option was included to burn bio-oil for electricity instead of upgrading for biofuel. The heating value of 17 MJ/kg and the same electricity conversion efficiency as syngas were used. Notably in this study, using bio-oil produced from pyrolysis for electricity generation was always more profitable than fuel (Eq. 4).
Where, ESBO = electricity savings from bio-oil ($)
HVBO = heating value of bio-oil (MJ/kg).
C3 = unit conversion (907.2 kg/ton).
The module on expenses comprises dairy, hay, and biomass conversions per-unit costs. The budget sheet for dairy production was obtained from the USDA ERS (2016) and is specific to the state of Texas. From 2016, the operating costs per hundredweight included in this study were purchased feed ($10.94/cwt), labor ($2.44/cwt), and miscellaneous operating costs ($1.71/cwt) for a total of $15.09/cwt. The hay operation costs, specific to the 22-county District eight from Texas A&M AgriLife, were on a yearly basis and converted to a monthly average. The operating costs for the hay operation used for this study include insecticide ($0.56/ac), machinery labor ($1.19/ac), machinery repairs ($0.55/ac), and miscellaneous operating costs [cut and bale ($11.67/ac)] for a total of $13.97 per acre.
In this tool, the operating and maintenance (O&M) costs of Gasification and Pyrolysis facilities were included in the monthly estimate of expense. The drying and processing of dairy manure is approximately $10.71 per wet ton. In general, pyrolysis facilities require approximately 75% the O&M cost of Gasification (Thomas, 2018); therefore, the O&M cost of Pyrolysis was estimated as $8.03 per wet ton.
The Soil and Water Assessment Tool (SWAT) was used to estimate crop production and environmental impact at the farm. SWAT is a physical, watershed-scale model that functions as an extension in ArcGIS; it quantifies the impact of land management in complex watersheds of various soil, land use, and management. The model delineates watersheds and streams based on topographic data and a defined outlet. SWAT uses meteorological data, (precipitation, temperature, and humidity) to perform complex hydrologic calculations to aggregate overland flow and subsurface flow from sub-basins to compute streamflow routing and discharge. This includes water balance factors, evaporation, and infiltration, determined from soils data based on permeability.
To simulate the effect of manure application in the watershed, input tables were adjusted in ArcSWAT. The digital elevation model (DEM) was obtained from the National Hydrography Dataset (NHD), version 2. The USGS gauging station (08094800) located at Hico, Texas was used to calibrate the model based on daily streamflow. The model ran from 15 April 2013 to 31 December 2017. Using this time frame, 2013 was used as model warmup, 2014–2015 for calibration, and 2016–2017 for validation. The DEM, National Land Cover Dataset (2011), and ArcSWAT STATSGO were used to delineate the model watershed and hydrologic response units. Daily precipitation and temperature data from the National Oceanic and Atmospheric Administration (NOAA) National Center for Environmental Information used by SWAT. Precipitation data was obtained from two weather stations in Stephenville, Texas, and temperature data was obtained from a combination of weather stations in Stephenville and at Proctor Reservoir, Texas.
To simulate the manure management practices in the area, the Management Input Files were adjusted in SWAT. For this stage of modeling, the study watershed was further refined to the bounds of Sub-basin 6 (Figure 4), which contains the Dairy Center and adjacent fields where manure and effluent are applied. For this watershed, a specific set of management operation parameters were imposed on all land use defined as row crop, hay, or range. The following operations were used to simulate the manure management system of the Dairy Center: Auto Irrigation, Continuous Fertilizer, Planting, and Harvest Only. The fertilizer database and general management parameters were manually edited.
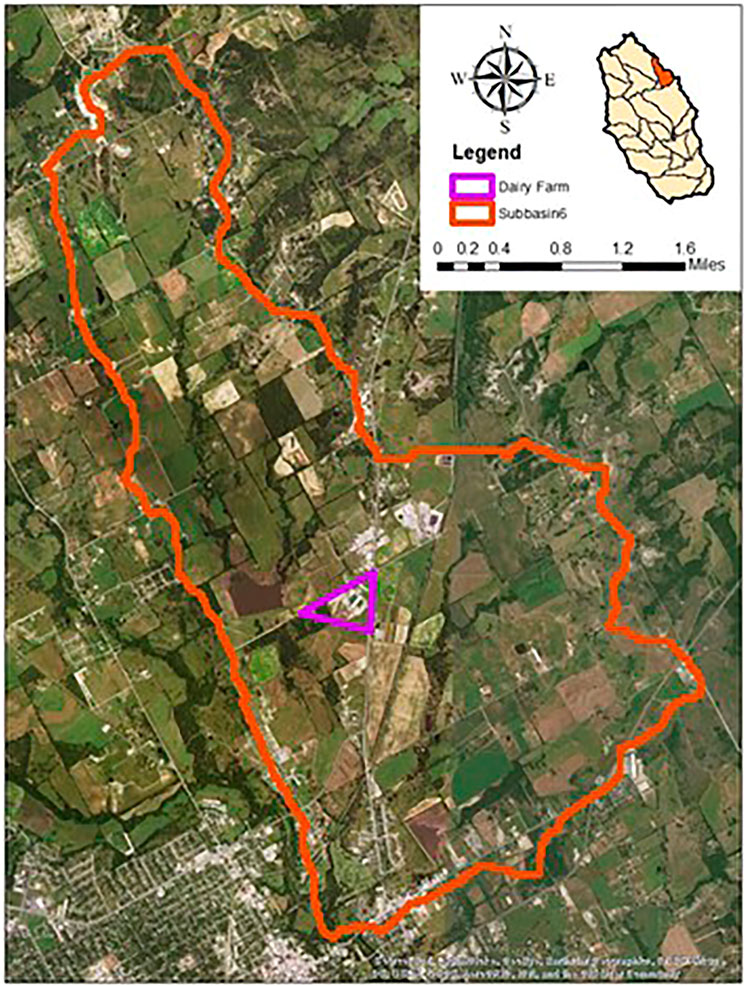
FIGURE 4. Location and satellite view of Subbasin 6, used in SWAT mode: the watershed was created by SWAT based on topography. It lies north of Stephenville and drains into the North Bosque River.
A new Fertilizer type was added to the database to represent the lagoon effluent. For this, the fraction of mineral N, mineral P, organic N, and organic P was entered manually based on the measured water quality data. In addition, the fraction of mineral N applied as ammonia was entered. Because there was no distinction between mineral and organic nutrients in the lab results of water quality samples in this study, the same ratios of the dairy manure fertilizer type in SWAT were used to separate the total N and total P into mineral and organic partitions (Table 3).
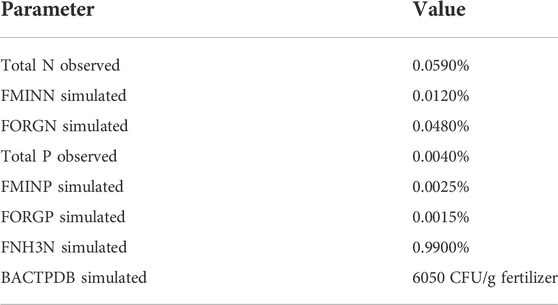
TABLE 3. Dairy effluent fertilizer input data for SWAT.
The model was run following rewriting of the Management and Fertilizer input files with the edited Management parameters. The Reach output file (.rch) holds the simulated stream flow for the watershed. This dataset was compared to the observed data from the same time frame as discussed previously. The Nash-Sutcliffe Efficiency (NSE) was used to evaluate the model variance (Moriasi et al., 2007) and the NSE calculation is shown in Eq. 5. The objective of SWAT is to determine the environmental impacts of manure application in this watershed, thus calibrations were based on watershed scale and then used in the Excel tool.
Where, Yiobs = ith observation of streamflow
Yisim = ith simulated value of streamflow.
Ymean = mean of observed streamflow.
n = total number of observations.
To obtain an NSE greater than 0.5, the SWAT Calibration and Uncertainty Programs package (SWAT CUP) was used to link SWAT input and output files, input observed flow data, and specify parameters to iteratively change and evaluate calibration statistics. The program SUFI2 (Sequential Uncertainty Fitting) was used to alter 8 parameters within a relative range of ±30% over 500 iterations (Table 4).
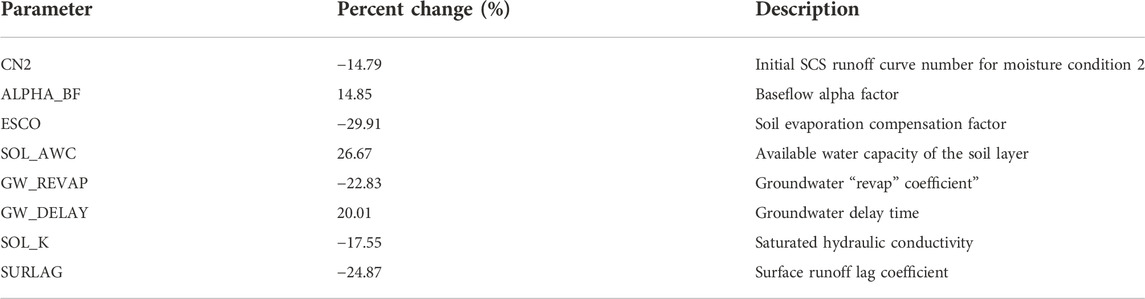
TABLE 4. SWAT CUP results, reflecting manually adjusted SWAT model parameters.
To complete the calibration, the model was manually calibrated by further reducing CN2 by 10%, reducing ESCO by 20%, and increasing SOL_AWC by 10%, and increasing GWQMN (the threshold depth of water in the shallow aquifer required to return flow to occur) by 20%, the calibration obtained an NSE of 0.81. With streamflow calibrated, the SWAT model hydrology is expected to be reliable. For this study, this was deemed acceptable to use the resulting estimate of crop yield and environmental impacts.
The results of SWAT were observed from the Management (.mgt) and Water Quality (.wql) output files. The crop yield was evaluated for Subbasin six only, where Management operations were changed from the default. The average crop yield was found from each HRU, which occurred once each year with the Harvest Only operation, for 2014–2017 (ignoring the warmup period). According to SWAT, the average annual crop yield was 18.9 tons/acre (42,336 kg/ha) with a standard deviation of 2.25 tons/acre (5,053 kg/ha). To match the period of the Excel-based tool, the yield was converted to a monthly basis. It is important to note that the income modeled by the tool is not uniform by month: both income and expenses of a dairy and/or hay farming operation are concentrated and seasonal throughout the year and vary from farm to farm. The monthly estimate for crop yield was calculated at 1.57 tons per acre per month.
Based on SWAT simulations with different quantities of continuous fertilizer applied the yield was approximated as directly proportional to the amount of effluent irrigation applied. In the Excel-based tool developed for our study, a modified yield per acre is calculated as a function of the effluent irrigation and biochar applied. Based on two studies, biochar was found to increase biomass yield by 23, 8, 150, and 98 percent when 10, 10, 15, and 20 metric tons/ha were applied, respectively (Baronti et al., 2010; Uzoma et al., 2011). The average percent increase and average application rate, 70% and 13.75 metric tons/ha, were used as a ratio to alter the modified yield (Eq. 6).
Where, Ym = modified yield per acre (ton/ac)
Yb = base hay yield per acre (1.57 ton/ac).
EI = effluent irrigation (gal).
EIb = base effluent irrigation (1027740 gal).
B = biochar produced (metric tons).
A = area farmed (ha).
Several water quality parameters were tracked from SWAT output, including organic N, ammonia, nitrite, nitrate, organic P, soluble mineral P, and CBOD. These results were also evaluated for Subbasin six and analyzed as an average of 1,722 daily concentrations from 2014–2017. Comparing results with and without effluent and manure application, the model suggests that the watershed nitrate loading to surface water was approximately 149 lbs/acre, as a monthly average for the year. Furthermore, the model suggests that the watershed nitrate loading to groundwater was approximately 33 lbs/acre and the soluble phosphorus loading to surface water was approximately 173 lbs/acre as a monthly average for the year. For both nitrate and phosphorus, the nutrient loading peaks in May, then gradually falls until negligible in the winter (January through March). From Dairy Center records, the monthly volume of effluent applied is approximately 3.15 ac-ft, and 2.85 ac-ft based on individual application volume as employed in SWAT.
Assumptions used in the model include the following: all manure, effluent, and biochar are evenly applied to farmed acres; SWAT input files (including DEM, soils, and land use) are accurate and up to date; SWAT produced reliable results for crop yield and water quality by calibrating the North Bosque River watershed streamflow at the Hico USGS; the SWAT HRU definition provided sufficient hydrologic resolution for the model; hay was grown from 2013 to 2017 on all land designated by the NLCD as row crop, hay, or range within Subbasin six and that within Subbasin 6, all land designated by the NLCD as row crop, hay, or range had the same management schedule and continuously applied a consistent amount of solid manure and lagoon effluent every 8 and 4 days respectively. It was further assumed that farmers did not practice contour farming; all effluent had the same water quality as measured from Lagoon two at the Dairy Center, and supply was never limited. SWAT default values for dairy manure were assumed to be the same as effluent water quality mineral and organic partitions; salinity, sodicity, pH, and organic matter were not considered. To prevent crop water stress falling below 90% in Subbasin 6, a constant volume of irrigation was occasionally applied. Irrigation efficiency was 75%, irrigation surface runoff ratio was 0.25. The harvest index override was 0.9 and hay was harvested once per year. Lastly, it was assumed that modifying the average monthly effluent irrigation volume uniformly modified the individual application volumes with the same interval; thus, the ratio between fertilizer by mass and yield by mass was used to modify estimated crop yield.
Each of the scenario levers was first altered individually around a baseline. Two biomass conversions settings were used: gasification or pyrolysis with bio-oil used for electricity. It was found that pyrolysis with bio-oil used for fuel was consistently less profitable than production of electricity, based on the offset cost of regular diesel fuel. In total, 43 scenarios were evaluated. For both gasification and pyrolysis, combinations of four levers (size of herd, acres farmed, volume of effluent irrigation, and milk price) were observed.
The financial success of the operation is a prerequisite and will be the main driver to its application. Figure 5 displays the monthly income components of a dairy with various herd size, overlaid by the expenses for gasification (a) and pyrolysis (b). Figure 6 displays the same data and format for gasification (a) and pyrolysis (b), omitting dairy yield to better observe the income components of energy production, crop yield, and biochar production. The expense data in Figure 6 is for the complete operation, including dairy production (as Figure 5). These data are based on a constant 85 acres farmed and 0.37 inches of effluent applied per month, both representative of the Dairy Center.

FIGURE 5. Components of monthly income using gasification (A) and pyrolysis (B).
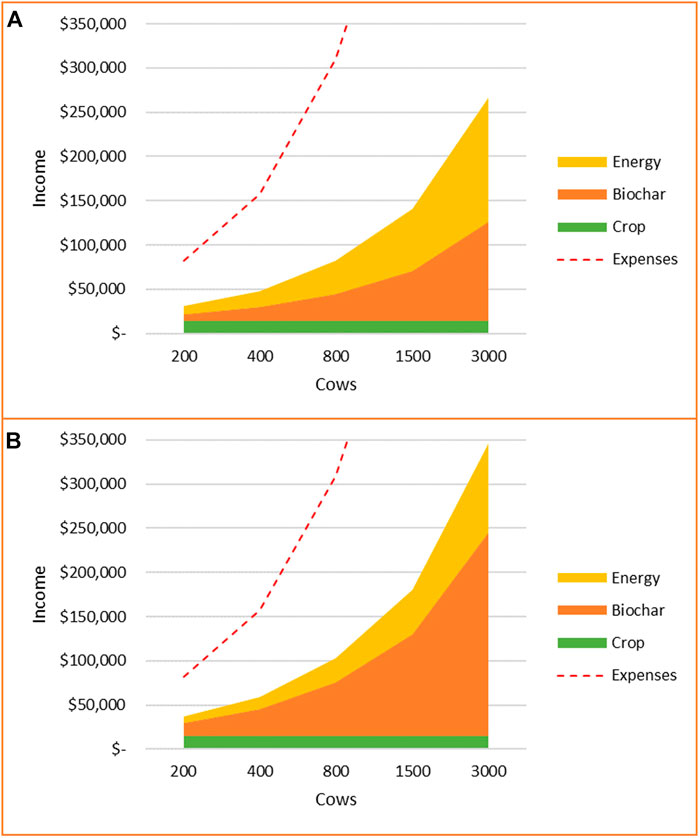
FIGURE 6. Components of Monthly Income [dairy omitted] Using Gasification (A) and Pyrolysis (B).
Not surprisingly, dairy production remains the dominant source of income for the farm, an average of 70 percent in these modeled scenarios. This is very sensitive to milk price, known to be volatile. Figure 7 displays the overall monthly profit for a small 400 cow dairy, such as the Dairy Center, using gasification and pyrolysis. Even with biomass conversion facilities to generate additional income, the dairy can become unprofitable if milk prices fall through the floor.
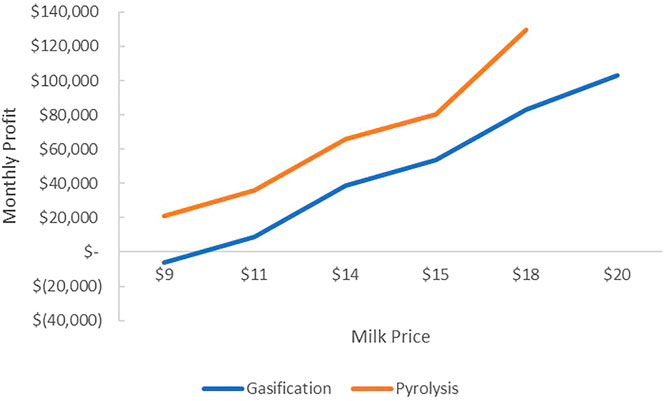
FIGURE 7. Monthly Income at varied milk price using Gasification and Pyrolysis.
In Figures 5–7 the number of acres farmed, and the effluent applied is set at the Dairy Center values to observe the relative income components of a dairy using manure gasification or pyrolysis. Many dairies farm much more land to supplement feed while disposing of manure effluent as irrigation. In Figure 8, the income components of various acreage are displayed. Crop yield greater than what is needed for the dairy herd is sold and further increases the income. Figure 9 displays five feed thresholds in both tons and dollars and illustrates the farmed acres required to produce enough feed for various sizes of dairies (a). The outcomes of SWAT gave various constituents based on the modeled watershed. The Dairy Center fields were modeled with management practices based on continuous application of manure effluent at a rate consistent with Dairy Center records. Nutrient loading rates were determined based on the 85-acre New Kirk East field and linearly extrapolated. Figure 9 also displays the level of nutrient loading at various acres farmed (b).
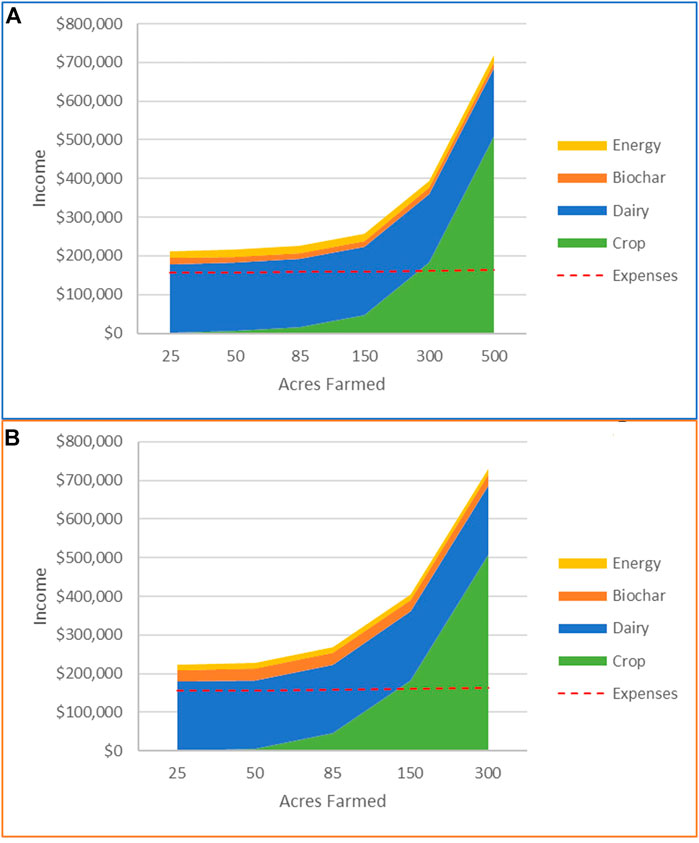
FIGURE 8. Components of Monthly Income Using Gasification, (A) and Pyrolysis (B) acres varied.
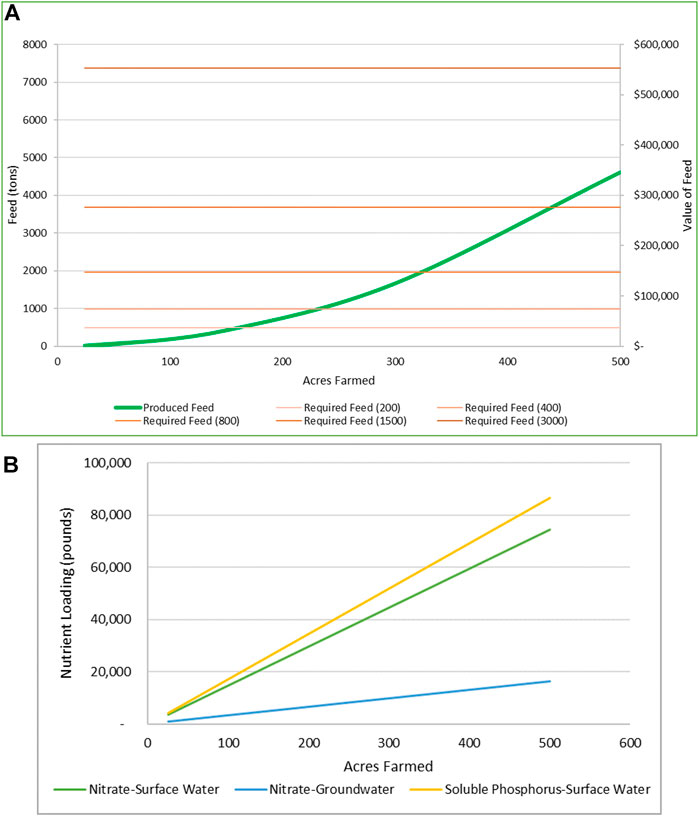
FIGURE 9. Thresholds of feed required (A) and nutrient loading (B) for dairy sizes and produced feed at various acres farmed.
The ten scenarios in Figures 5, 6 are all profitable as shown. While gasification can produce more (29%) energy than pyrolysis, and pyrolysis can produce more (52%) biochar. Across 21 comparative scenarios, pyrolysis generated averages of 4 percent more income and 31 percent more profit than gasification, due mainly to the greater production and value of biochar. Pyrolysis could be especially successful in periods of low milk prices. In these scenarios, income from biochar represents between 15 and 20 percent of the total income. Pyrolysis was between 40 and 128 percent more profitable than gasification (see Figure 7).
In Figures 5, 6, scenarios are represented in which the existing Dairy Center substantially increased the size of herd within the existing facilities (acres farmed, effluent applied, lagoon storage, and capacity of milk barn and free stalls). Substantial investment would be required to scale up to the herd sizes displayed, and additional effluent irrigation (whether from owned or neighboring fields) would be inevitable. To that point, one omission of this work is the increased manure effluent produced from a larger herd due to increased flushing of free stalls. This in turn would change the lagoon water balance and likely require construction of greater lagoon storage. While the increased effluent production would not necessitate the Dairy Center to farm more land, it would still need to be land applied very locally, or in significant excess. In addition, a great increase in demand for freshwater could cause the dairy to pump more groundwater, thus contributing to a regional water supply impact and increasing the dairy’s electricity bill.
At the Dairy Center, solid manure is flushed from free stalls through the pit system, screened, and enters the lagoons. For this tool, all manure is considered consumed for biomass conversions. However, a portion of manure must be carried, either dissolved or in suspension, through the screen and into the lagoons where it becomes a slurry or effluent. Thus, there is an omission in the quantity of manure available for biomass conversions. Overall, possible profits from pyrolysis and gasification at dairy farms will be strongly dependent on the cost of electricity, market price of biochar, and size of dairy herds. Additionally, the environmental benefits of pyrolysis and gasification of dairy manure could also be assessed, including greenhouse gas emission, and the pollution of water and soil from land application of manure. The outcomes from this study suggest that pyrolysis and gasification of dairy manure would be viable processes to enhance environmental and agricultural sustainability at dairy farms.
The closed-loop dairy system is shown to be profitable, in most cases, using gasification or pyrolysis. While all dairies are sensitive to milk price, pyrolysis provides a promising buffer that could be especially useful for small dairies, such as the Dairy Center. This work is based on the struggle to survive under increasing environmental regulation and industry pressure.
In all cases, the value of electricity generated from gasification exceeded that of pyrolysis. Using bio-oil produced from pyrolysis for fuel production was not worthwhile compared to its use for electricity generation. Furthermore, upgrading the bio-oil for use as fuel would increase the capital cost and reduce yield. This study indicated that increasing size of herd, acres, or effluent irrigation will almost always increase profit, while having a clear tradeoff with environmental quality due to high nutrient loading.
To determine recommendations based on this study, it is necessary to evaluate the capital cost of biomass conversions. Capital cost was not considered in this work and will vary based on location and size of dairy. Some industry estimates suggest the cost could be minimal (around $100,000); other estimates suggest a cost several times larger. In addition to capital cost, several expense parameters, e.g., cost of feed, operating cost of biomass conversions, could vary on a case-by-case basis.
This study could be improved by considering a few dimensions. Environmental impact, an extensively complicated area, is herein extrapolated one-dimensionally, although derived using a robust, physically based model. The assessment would be made more accurate by integrating data linking the effluent irrigation to the nutrient loading at local scale with vadose zone analysis.
In this study, all biochar was considered sold (none applied to the Dairy Center acres farmed). The benefits of biochar in reducing nutrient leaching, erosion, and runoff, are discussed but not accounted for in this analysis. It is suggested that biochar may mitigate emissions, to the benefit of air quality, and improve soil nutrient and water retention. The environmental impacts could be made more robust with literature-based estimates these suggestions.
The nexus tradeoff analysis tool could also include estimation of the financial impact of environmental fines to the farm. These are administered by the Texas Commission on Environmental Quality (TCEQ) and, according to the Dairy Center, vary greatly depending on circumstances, and could be related to manure input or monitored nutrient output. Regardless, it is of interest to estimate the environmental impact in terms of nutrient load added.
The capital cost of the gasification and pyrolysis, i.e., the cost of the furnace and the heat recovery units, were not included. The operating costs, particularly energy consumption, of pyrolysis would be lower than that of gasification because of target temperature. The continuous reactors in both processes need only very short residence time (batch process needs much longer time).
We believe this study is useful to small dairy systems as it describes how these farms can transform into circular production system with lower water and energy footprint while maintaining profitability. The study is limited with several assumptions that can be considered for future studies.
The raw data supporting the conclusion of this article will be made available by the authors, without undue reservation.
JM—Conceptualization, Methodology, Evaluation, Validation, Formal Analysis, Investigation, Data Curation, Writing the original draft and Review and Editing, Visualization RM—Conceptualization, Methodology, Evaluation, Validation, Resources, Data Curation, Writing, Review and Editing, Supervision, Project Administration, Funding Acquisition EK—Methodology, Evaluation, Validation, Resources, Data Curation, Writing, Review and Editing AA—Methodology, Evaluation, Validation, Data Curation, Writing, Reviewing, Editing VP—Evaluation, Validation, Data Curation, Writing, Reviewing, Editing.
The authors are grateful to the Texas A&M University System’s WEF Nexus Initiative and the WEF Nexus Research Group for financial support that enabled the conduct of this research. The authors also acknowledge Mary Schweitzer for her editing work. The authors would like to acknowledge the support form the national science foundation award number: 1739977.
The authors declare that the research was conducted in the absence of any commercial or financial relationships that could be construed as a potential conflict of interest.
All claims expressed in this article are solely those of the authors and do not necessarily represent those of their affiliated organizations, or those of the publisher, the editors and the reviewers. Any product that may be evaluated in this article, or claim that may be made by its manufacturer, is not guaranteed or endorsed by the publisher.
Anzilotti, E. (2017). FastCompany. The dairy of the future is A sustainable closed loop powered by cow poop. Available at: https://www.fastcompany.com/3069268/this-revolutionary-concept-could-make-dairy-farms-more-sustainable.
Baronti, S., Alberti, G., Delle Vedove, G., Di Gennaro, F., Fellet, G., Genesio, L., et al. (2010). The biochar option to improve plant yields: First results from some field and pot experiments in Italy. Ital. J. Agron. 5 (1), 3–12. doi:10.4081/ija.2010.3
Brar, J. S., Singh, K., Zondlo, J., and Wang, J. (2013). Co-gasification of coal and hardwood pellets. A Case Study 2 (1), 25–40. doi:10.7726/ajbb.2013.1005
Bridgwater, A. V. (2012). Review of fast pyrolysis of biomass and product upgrading. Biomass Bioenergy 38, 68–94. doi:10.1016/j.biombioe.2011.01.048
Cantrell, K. B., Hunt, P. G., Uchimiya, M., Novak, J. M., and Ro, K. S. (2011). Impact of pyrolysis temperature and manure source on physicochemical characteristics of biochar. Bioresour. Technol. 107, 419–428. doi:10.1016/j.biortech.2011.11.084
Capareda, S. (2013). Introduction to biomass energy conversions. Boca Ratan, FL: CRC Press. Taylor & Francis Group. ISBN: 978-1-4665-1333-4.
Cely, P., Gascó, G., Paz-ferreiro, J., and Méndez, A. (2015). Agronomic properties of biochars from different manure wastes. J. Anal. Appl. Pyrolysis 111, 173–182. doi:10.1016/j.jaap.2014.11.014
Chadwick, D., Sommer, S., Thorman, R., Fangueiro, D., Cardenas, L., Amon, B., et al. (2011). Manure management: Implications for greenhouse gas emissions. Animal Feed Sci. Technol. 166, 514–531. doi:10.1016/j.anifeedsci.2011.04.036
Choi, Y. K., Jang, H. M., Kan, E., Rose, A. R., and Sun, W. (2019). Adsorption of phosphate in water on a novel calcium hydroxide-coated dairy manure-derived biochar. Environ. Eng. Res. 24 (3), 434–442. doi:10.4491/eer.2018.296
Choi, Y. K., and Kan, E. (2019). Effects of pyrolysis temperature on the physicochemical properties of alfalfa-derived biochar for the adsorption of bisphenol A and sulfamethoxazole in water. Chemosphere 218, 741–748. doi:10.1016/j.chemosphere.2018.11.151
Crombie, K., and Masek, O. (2014). Pyrolysis biochar systems, balance between bioenergy and carbon sequestration. GCB Bioenergy 7, 349–361. doi:10.1111/gcbb.12137
Daher, B., Mohtar, R., Pistikopoulos, E., Portney, K., Kaiser, R., and Saad, W. (2018). Developing socio-techno-economic-political (STEP) solutions for addressing resource nexus hotspots. Sustainability 10 (2), 512. doi:10.3390/su10020512
Fernandez-Lopez, M., López-González, D., Puig-Gamero, M., Valverde, J. L., and Sanchez-Silva, L. (2016). CO2 gasification of dairy and swine manure: A life cycle assessment approach. Renew. Energy 95, 552–560. doi:10.1016/j.renene.2016.04.056
Jang, H. M., Choi, Y.-K., and Kan, E. (2018). Effects of dairy manure-derived biochar on psychrophilic, mesophilic, and thermophilic anaerobic digestions of dairy manure. Bioresour. Technol. 250, 927–931. doi:10.1016/j.biortech.2017.11.074
Jang, H. M., and Kan, E. (2019). A novel hay-derived biochar for removal of tetracyclines in water. Bioresour. Technol. 274, 162–172. doi:10.1016/j.biortech.2018.11.081
Jones, J., Verma, B., Basso, B., Mohtar, R., and Matlock, M. (2021). Transforming food and agriculture to circular systems: A perspective for 2050.
Kato, T., Kuroda, H., and Nakasone, H. (2009). Runoff characteristics of nutrients from an agricultural watershed with intensive livestock production. J. Hydrol. X. 368 (1–4), 79–87. doi:10.1016/j.jhydrol.2009.01.028
Kim, J. R., and Kan, E. (2016). Heterogeneous photocatalytic degradation of sulfamethoxazole in water using a biochar-supported TiO2 photocatalyst. J. Environ. Manage. 180, 94–101. doi:10.1016/j.jenvman.2016.05.016
Lorimor, J., Powers, W., and Sutton, A. (2004). Manure characteristics. Manure management systems series. Midwest plan service (MWPS) MWPS-18 section 1. Second edition. Ames: Iowa State University. Available at: http://msue.anr.msu.edu/uploads/files/ManureCharacteristicsMWPS-18_1.pdf.
Mohtar, R. H., and Daher, B. (2012). “Water, energy, and food: The ultimate nexus,” in Encyclopedia of agricultural, food, and biological engineering Second Edition. Editors D. R. Heldman, and C. I. Moraru (Abingdon, UK: Taylor & Francis), 1–15. doi:10.1081/E-EAFE2-120048376
Mohtar, R. H. (2015). Ven Te chow memorial lecture: Localizing water and food security. Water Int. 40 (4), 559–567. doi:10.1080/02508060.2015.1084209
Moriasi, D. N., Arnold, J. G., Van Liew, M. W., Bingner, R. L., Harmel, R. D., and Veith, T. L. (2007). Model evaluation guidelines for systematic quantification of accuracy in watershed simulations. Trans. ASABE 50 (3), 885–900. doi:10.13031/2013.23153
Mukhtar, S., and Capareda, S. (2012). Manure to energy: Understanding processes, principles and jargon produced by agricultural communications. The Texas A&M University System E-428 11/06 Retrieved January 2019 from Available at: https://aglifesciences.tamu.edu/baen/wp-content/uploads/sites/24/2017/01/E-428.-Manure-to-Energy.-Understanding-Processes-Principles-and-Jargon.pdf.
Sadeghi, S. H. R., Hazbavi, Z., Kiani-Harchegani, M., Younesi, H., Sadeghi, P. S., Angulo-Jaramillo, R., et al. (2020a). The hydrologic behavior of Loess and Marl soils in response to biochar and polyacrylamide mulching under laboratorial rainfall simulation conditions. J. Hydrology 592, 125620. doi:10.1016/j.jhydrol.2020.125620
Sadeghi, S. H. R., Kiani-Harchegani, M., Hazbavi, Z., Sadeghi, P. S., Angulo-Jaramillo, R., Lassabatere, L., et al. (2020b). Field measurement of effects of individual and combined application of biochar and polyacrylamide on erosion variables in loess and marl soils. Sci. Total Environ. 728, 138866. doi:10.1016/j.scitotenv.2020.138866
Safferman, S. I., and Wallace, J. M. (2015). Cow manure: Waste or resource? IEEE Potentials 34 (1), 25–29. doi:10.1109/MPOT.2014.2358271
Singh, B., Singh, B. P., and Cowie, A. L. (2010). Characterisation and evaluation of biochars for their application as a soil amendment. Soil Res. 48 (6–7), 516–525. doi:10.1071/SR10058
Steinfeld, H., Gerber, P., and Wassenaar, T. (2006). Livestock’s long shadow: Environmental issues and options, 391. ISBN 978-92-105571-7.(
Texas A&M AgriLife Extension (2018). Soil & water assessment tool (SWAT). https://swat.tamu.edu/software/arcswat. Coastal Bermudagrass Hay 2018 Estimated Cost and Returns per Acre Retrieved May 4, 2018 from: https://agecoext.tamu.edu/resources/crop-livestock-budgets/budgets-by-extension-district/district-8/2018-district-8-crop-and-livestock-budgets/.
USDA ERS (2016). Milk cost of production by state. Available at: https://www.ers.usda.gov/data-products/milk-cost-of-production-estimates/.
USDA NASS (2017). Texas 2016 state agricultural overview. Available at: https://www.nass.usda.gov/Quick_Stats/Ag_Overview/stateOverview.php?state=TEXAS.
Uzoma, K. C., Inoue, M., Andry, H., Fujimaki, H., Zahoor, A., and Nishihara, E. (2011). Effect of cow manure biochar on maize productivity under sandy soil condition. Soil Use Manag. 27 (2), 205–212. doi:10.1111/j.1475-2743.2011.00340.x
Keywords: biochar, manure management, water energy food nexus tool, circular dairy farm system, gasification
Citation: Muell JD, Mohtar RH, Kan ES, Assi AT and Pappa V (2022) Farm-scale water-energy-food-waste nexus analysis for a closed-loop dairy system. Front. Environ. Sci. 10:880839. doi: 10.3389/fenvs.2022.880839
Received: 22 February 2022; Accepted: 28 July 2022;
Published: 24 August 2022.
Edited by:
Elena Cristina Rada, University of Insubria, ItalyeReviewed by:
Esmat Zaidan, Qatar University, QatarCopyright © 2022 Muell, Mohtar, Kan, Assi and Pappa. This is an open-access article distributed under the terms of the Creative Commons Attribution License (CC BY). The use, distribution or reproduction in other forums is permitted, provided the original author(s) and the copyright owner(s) are credited and that the original publication in this journal is cited, in accordance with accepted academic practice. No use, distribution or reproduction is permitted which does not comply with these terms.
*Correspondence: Rabi H. Mohtar, bW9odGFyQHRhbXUuZWR1
Disclaimer: All claims expressed in this article are solely those of the authors and do not necessarily represent those of their affiliated organizations, or those of the publisher, the editors and the reviewers. Any product that may be evaluated in this article or claim that may be made by its manufacturer is not guaranteed or endorsed by the publisher.
Research integrity at Frontiers
Learn more about the work of our research integrity team to safeguard the quality of each article we publish.