 Xiaojie Chen
 Shengbin Chen
 Zhengwei He
 Dongjian Xue
 Guozheng Fang2
 Kaiwen Pan
- 1State Key Laboratory of Geohazard Prevention and Geo-environment Protection, Chengdu University of Technology, Chengdu, China
- 2College of Earth Sciences, Chengdu University of Technology, Chengdu, China
- 3Department of Surveying and Geo-informatics, College of Sichuan Water Conservancy, Chengdu, China
- 4College of Ecology and Environment, Chengdu University of Technology, Chengdu, China
- 5Chengdu Institute of Biology, Chinese Academy of Sciences, Chengdu, China
- 6Sichuan Research Institute of Land Science and Technology (Sichuan Satellite Application Technology Center), Chengdu, China
Eco-environmental quality assessment is an important process for ensuring sustainable regional development because it encourages the construction of an ecological civilization. This assessment also lays a foundation for informing digital management and decision-making for the ecological environment in the near future. Due to the particularity of mountainous areas, its Eco-environmental quality assessment needs to be deeply specific and may require re-working. Here, the AHP-Entropy model was developed and constructed to scientifically analyze and evaluate the Eco-environmental quality in mountainous Western Sichuan in 2009 and 2019 at the township (street) unit. It is based on indicators representing Biological richness, Vegetation cover, Water network density, Land stress, and Social-economic stress. This newly developed model offers a more complete assessment, is based on more easily acquired data and has a higher accuracy than past models. The Eco-environmental quality index (EQI) representing eco-environmental quality (EEQ) has five levels of rating: Better, Good, Moderate, Bad and Worse. After applying this model to the region, the results show that: 1) The ecological environmental quality in the Western Sichuan mountains has improved over the past 10 years. 2) The eco-environment in the study area is generally Good, with small areas receiving a rating of Moderate. 3) The areas considered Better are mainly distributed on Longmen Mountain, Daliang mountain and Qionglai mountain, while the Moderate areas are mainly distributed in the western Chengdu Plain, the Panzhihua urban area, and Shaluli mountain. 4) The areas rated Better earn their rating due to high vegetation coverage, high habitat quality, and low degree of land degradation, such as land desertification and soil erosion. The areas with moderate eco-environmental quality were mainly affected by frequent human activity or serious land degradation. This comprehensive regional Eco-environmental quality assessment can also be used in other areas with mountains.
1 Introduction
The Eco-environment increasingly bears the lasting effects of human activity. A good ecological environment is not only an important prerequisite for continued human development, but is also the basic condition that allows for human survival and social stability (Zhao et al., 2016). Adhering to a standard of sustainable development requires the ongoing assessment of Eco-environmental quality. However, regional Eco-environmental quality assessments are difficult because they survey a broad area. This extremely complex comprehensive assessment requires in-depth research on the local resources and the geographic area (Fu et al., 2001). The essence of a regional Eco-environmental quality (EEQ) assessment is to identify the state and direction of evolution of a regional eco-environment by exploring the main Eco-environmental problems and contradictions in the region, as well as the achievements of eco-environmental management. Taken together, the results inform digital decision-making for regional Eco-environmental management.
The Eco-environmental quality is directly affected by local factors representing natural conditions as well as by anthropogenetic activities (Boori et al., 2021). These factors can be quantitatively described by climate, terrain, land cover and vegetation data derived from remote sensing (Hu and Xu, 2019; Huang et al., 2021). The parameters and indicators that will represent the characteristics of a regional ecological environment must be scientifically and reasonably selected as part of the quantitative Eco-environmental quality (EEQ) assessment. The selected indicators here come from the remote sensing ecological index (RSEI), Ecological index (EI) and an indicator system based on the PSR (Boori et al., 2021) or DPSIR framework (Wang et al., 2018). The remote sensing ecological index (RSEI) is commonly used in EEQ assessment by many scholars in China (Xu et al., 2019; Jing et al., 2020; Liao and Jiang, 2020; Zhu et al., 2020; Huang et al., 2021), and these indicators were also used by Karbalaei Saleh (Karbalaei Saleh et al., 2021) to evaluate the Ecological quality of Isfahan in Iran. RSEI uses four environmental components (Greenness, Wetness, Dryness and Heat) to represent climate and terrestrial biophysical variables. The weight of each index is calculated using principal component analysis (PCA). Although it is objective and easy to calculate, RSEI does not fully reflect the EEQ because it fails to account for ecological stress caused by Social-economic factors. The Ecological index (EI) was revised to be the Technical Criterion for Ecosystem Status Evaluation (Ministry of Ecology and Environment the People’s Republic of China, 2015). The multifactor indicators of EI include Biological abundance index (B1), Vegetation coverage index (B2), Water network density index (B3), Land stress index (B4) and Pollution load index (B5). These five indicators reflect the richness of organisms in the assessment area, the height of vegetation cover, the amount of water, the stress intensity, and the pressure from pollutants, respectively. The weight of each index is calculated using the analytic hierarchy process (AHP) method. EI is commonly used in EEQ assessments by many scholars (Shan et al., 2019; Jing et al., 2020; Chen et al., 2021; Li L. et al., 2021; Sun et al., 2021; Ouyang et al., 2022; Wang et al., 2022), and is based on 15 indicators. It was used to evaluate the ecological quality of the Samara region in Russia, using the base PSR framework (Boori et al., 2021). The index system of the EI method reflects the comprehensive eco-environmental quality (EEQ) of the study area relatively well. Past assessment methods include AHP, the entropy method, the ecological footprint method (Miao et al., 2016), grey correlation degree (Guo and Farouk, 2021) and the fuzzy comprehensive assessment method. However, there is no single assessment model that can effectively assess the ecological environment quality of a mountainous area due to the complexity in its surface and terrain. Therefore, general technical guidelines cannot be copied and a new method must be devised.
The AHP-entropy method is applicable to the assessment of geological disaster susceptibility (Qi and Wang, 2021) and urban human settlement quality (Li et al., 2014) in mountainous areas, and it is also applicable to the eco-environmental quality assessment. AHP has been combined with remote sensing and GIS by many scholars to assess the eco-environmental quality (EEQ) (Li et al., 2007; Xiong et al., 2007; Zhang et al., 2021). This study attempts to develop an eco-environmental quality assessment system (AHP-Entropy Methods) in mountainous areas and takes the mountains in Western Sichuan as an example. The weight of both expert experience and objective evaluation factors is considered for this hybrid model. The multifactor indicators of the EI method are adopted and improved upon. For one, Landsat’s surface coverage and MODIS images are a better data source from which to extract evaluation factors. Considering that the pollution load index calculation in the original specification was obtained from statistical data based on the township unit, the accuracy was rather low. Instead, the model proposed here uses the Social-economic stress index (SESI), which has higher accuracy and is easier to be obtained. The assessment units are composed of a series of many factors that affect the Eco-environmental quality (EEQ). When a grid is used as the assessment unit, it is difficult to obtain such specific statistical data. On the other hand, the county as the assessment unit is too large and the accuracy is much lower. For China, township statistical data, which is at an intermediate scale, is available. Here, we were able to use township as the unit of Eco-environmental quality (EEQ) assessment.
The mountainous area in Western Sichuan, China, is an important part of the Sichuan-Yunnan Forest and the biodiversity of the Zoigê Steppe Marsh is a national key ecological function area in China (Li et al., 2015). It is an important water source in the upper reaches of the Yangtze River and the Yellow River and is an important barrier for China’s ecological security. At the same time, it also provides important ecosystem services to the world and is rightly an ecosystem protection priority area (Brooks et al., 2006; Naidoo et al., 2008). However, this area faces some ecological problems, such as wetland degradation, grassland desertification (Wen et al., 2013), serious rodent damage, serious soil erosion (Liu et al., 2005) and weakening of biodiversity service function (Yang et al., 2022). Through investigating and documenting the current state of the economy, society, ecological environment, natural geography and meteorology, the assessment of the regional ecological environment is the basis for informing the ecological protection and restoration of land space and the management and control of the use of natural ecological space.
2 Overview of the study area and methods
2.1 Overview of the study area
Western Sichuan (Figure 1) (26.02°N to 34.32°N and 97.3°E to 106.2°E) is characterized by plateau and mountains ranging from 189 to 7839 m, covering 78 counties and 1,341 townships. This area is at the southeast edge of the Qinghai-Tibet Plateau and crosses the first and second steps of China’s terrain. The soil types in this study area are mainly meadow, dark brown, yellow brown, and brown.
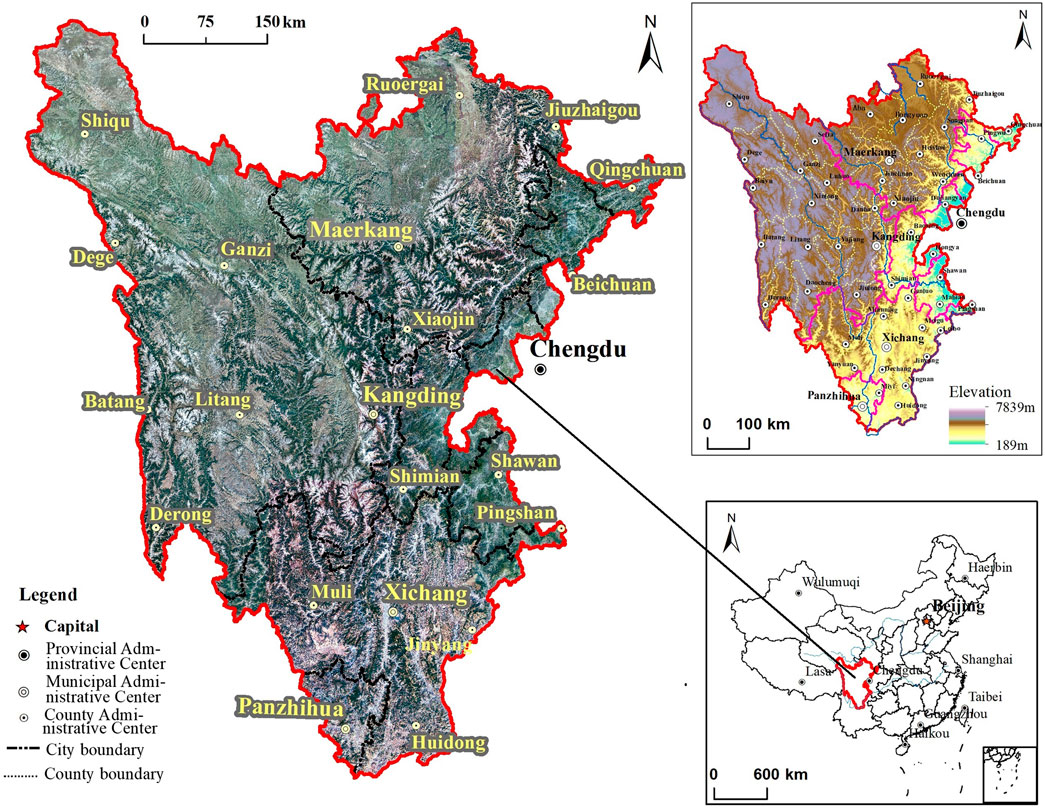
FIGURE 1. Location of the study area.
Because it is affected by the Indian Ocean and Pacific monsoon circulation, the region is dry and cold in winter, and wet and rainy in summer. Altitude plays an important role in regional climate variation. There are five climatic regions: cold temperate zone, temperate zone, warm temperate zone, central subtropical zone, and south subtropical zone. Ecosystem types in the study area are diverse, with meadows, broad-leaved shrubs, coniferous forests and broad-leaved forests as the main ones, followed by the less frequent mixed coniferous and broad-leaved forests and unvegetated deserts. As a green ecological barrier and an important water source in the upper reaches of the Yangtze River and the Yellow River, the region plays a very important strategic role in maintaining national ecological security. There are various types of vertical natural belts in mountainous areas of Western Sichuan. According to the structural characteristics of the basic zone, the vertical natural zone can be divided into subtropical humid type, middle subtropical humid type, south subtropical alternating type, warm temperate semi humid type, cold temperate semi humid type and sub cold zone semi-arid type (Zheng and Gao, 1984; Zheng and Yang, 1985). The landscapes of 2009 and 2019 in study area can be seen in Figure 2. The landscapes in the study area are mainly woodland and grassland.
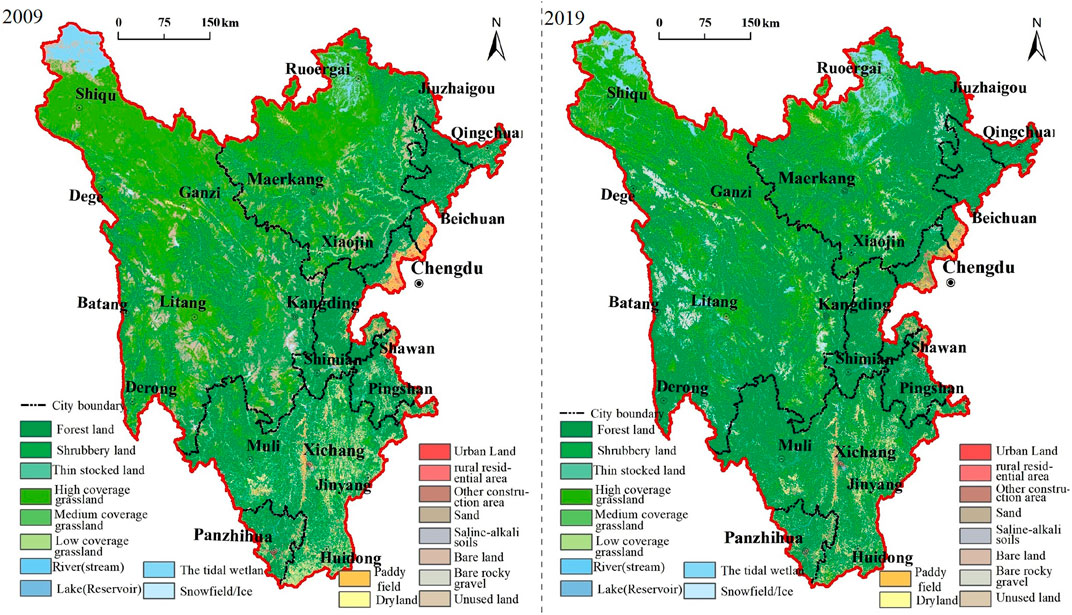
FIGURE 2. Landscapes of 2009 and 2019 in study area.
2.2 Data sources and methods
Constructing an assessment system suitable for the study area was the core of this revised ecological environment quality (EEQ) assessment, and it proved to be a complex process. Based on the data availability and regional characteristics of the Western Sichuan mountains, this paper develops a eco-environmental quality assessment system designed for mountainous regions (AHP-Entropy Method).
The methodology for evaluating EEQ used in this study consists of four steps: first, a system of indicators is established. Second, the AHP-entropy method is applied to determine the weight of each indicator. Third, the EQI values are calculated by the compound model. Fourth, the EQI performance is evaluated according to a defined classification. The full process is shown in Figure 3.
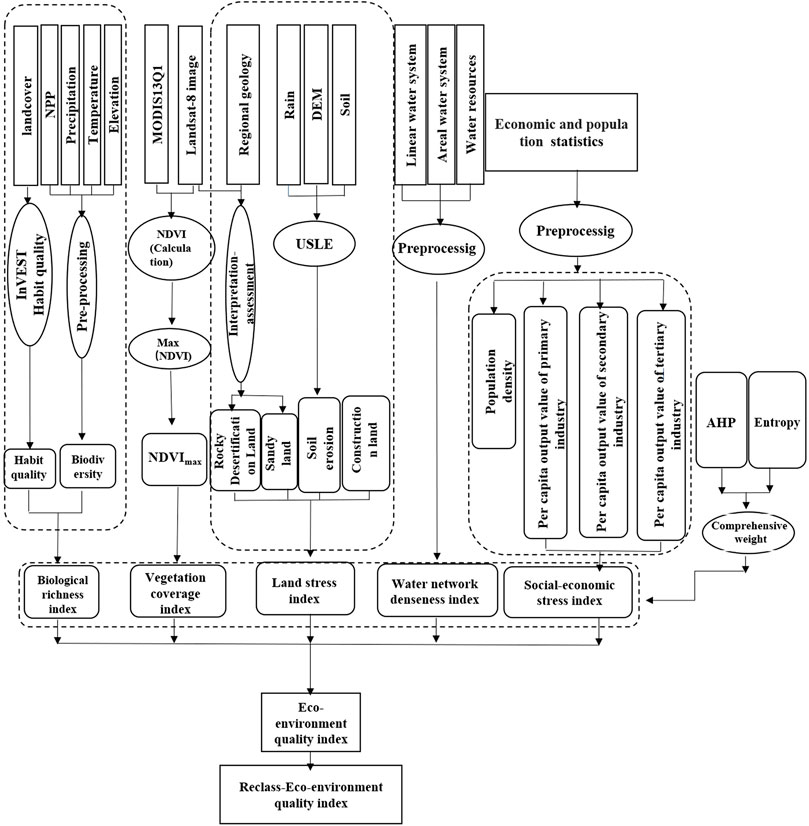
FIGURE 3. Technical processes of estimating EQI based on multisource data.
2.2.1 Data and pre-processing
The data used in this study mainly includes DEM, surface cover, soil, vegetation cover, remote sensing images, meteorology, hydrology, basic geology, socio-economic and demographic data (Table 1).
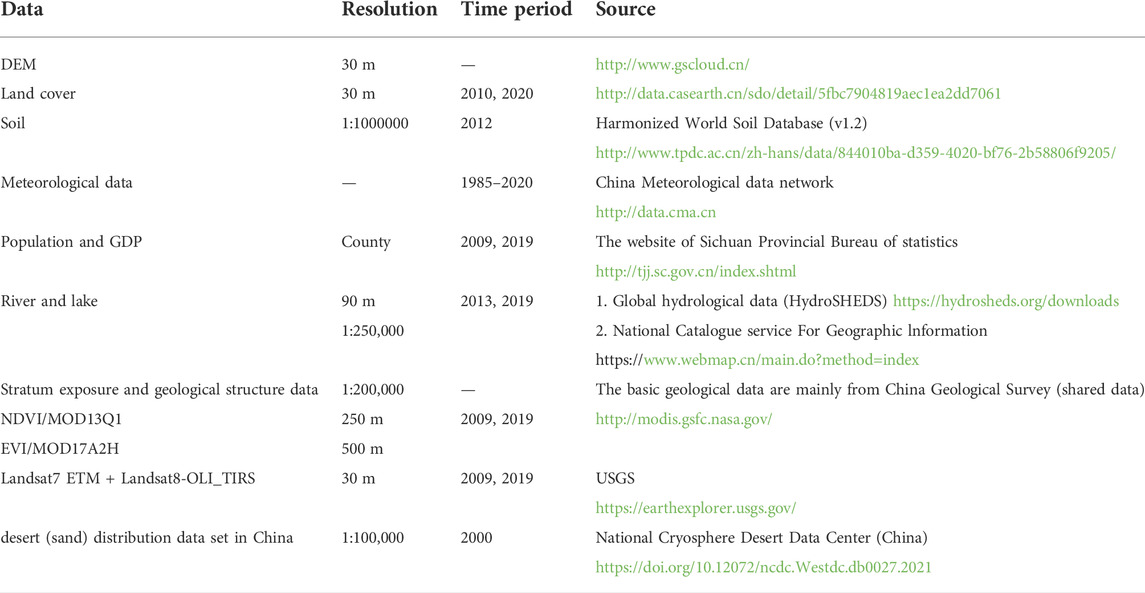
TABLE 1. Basic information of data sources.
The data processing method is as follows:
1) The slope, topographic relief and slope length were extracted from DEM data, normalized (maximum and minimum normalization) and resampled to obtain the slope and slope length factor map.
2) The surface coverage data was mosaiced and clipped by the region of the study area.
3) The soil erodibility factor was calculated according to the content ratio of sand, silt, clay and organic carbon in the soil (Wang et al., 2001).
4) The IDW interpolation method was used for spatial interpolation of meteorological stations to obtain the temperature and precipitation map.
5) The vegetation coverage of study area was extracted from MODIS data.
6) Based on the resident population, county area and regional tertiary industry GDP, the population density and per capita tertiary industry GDP were calculated.
7) The river and lake data sets of multiple 1:250,000 maps involved in the study area were mosaiced and clipped to obtain the factor for calculating the water network density index factor.
8) Extraction of carbonate rock outcropping area from formation rock types in regional geological map.
9) We used MODIS data (MOD09A1, NDVI/MOD13Q1, EVI/MOD17A2H) to estimate and analyze spatial and temporal distribution of NPP of the study area in 2009 and 2019, based on the Carnegie-Ames-Stanford Approach (CASA) model (Yuan et al., 2006; Yu et al., 2009).
2.2.2 Construction of assessment indicators system and standardization
The system of indicators for this Eco-environmental quality assessment (Table 2) was constructed using a Biological abundance index (BAI), Vegetation coverage index (VCI), Water network density index (WNDI), Land stress index (LSI) and Social-economic stress index (SESI), which respectively reflect the abundance of organisms, the level of vegetation cover, the abundance of water resources, land stress caused by land degradation, and environmental pressure brought by social and economic development.
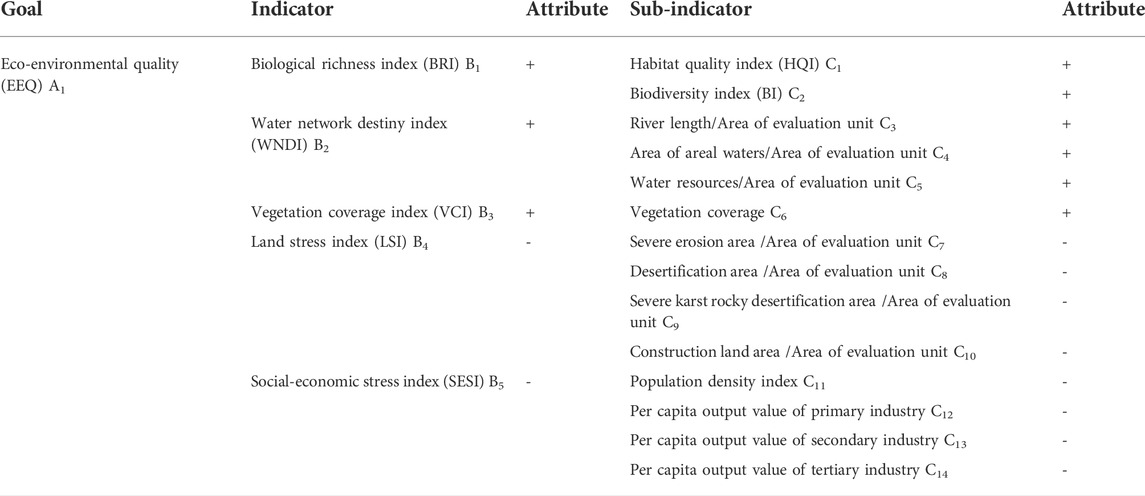
TABLE 2. Evaluation index system.
Non-dimensional quantitative model. With each indicator differing in its nature, the unit and dimensions were also inconsistent, and so standardization of indicators was necessary. We used Eq. 1,2 to standardize these data from various sources (Xie et al., 2012):For positive indicators:
For reverse indicators:
where
2.2.3 Calculation of sub-indicator
Some sub-indicators can be obtained directly through data pre-processing, while others needed to be obtained through model calculations.
2.2.3.1 Habitat quality index
The InVEST model introduced the habitat quality as a proxy for biodiversity assessment (Berta Aneseyee et al., 2020; Zhang et al., 2020). Habitat quality index refers to the comprehensive index reflecting the Eco-environmental quality of the assessed area.
The habitat suitability of each LULC type and the relative sensitivity of each habitat type versus its threat were determined by the Landscape types of low habitat suitability in the study areas (Table 3). The parameters of each threat’s relative impact weight, its maximum effective distance, and distance-decay function were determined according to the literature listed in Table 4.
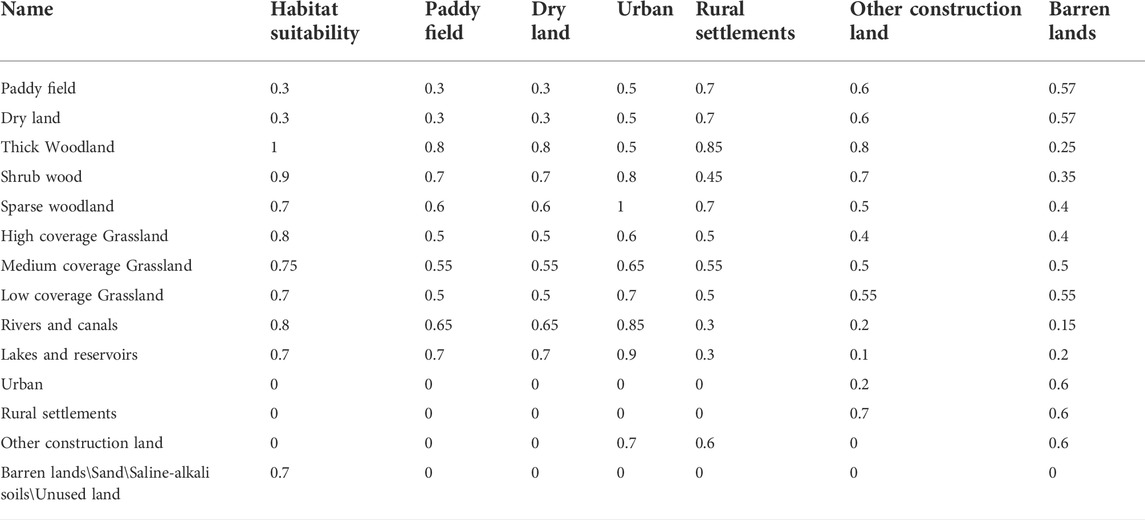
TABLE 3. The sensitivity of different landscapes to threat factors.
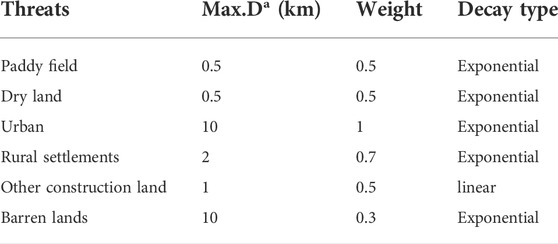
TABLE 4. Weights for threat factors of the study area.
2.2.3.2 Biodiversity index
Biodiversity and Net Primary Productivity (NPP) are intricately linked in complex ecosystems such that a change in the state of one of these variables can be expected to have an impact on the other (Costanza et al., 2007).
Biodiversity maintenance function is the key role an ecosystem plays in maintaining gene, species and ecosystem diversity. It is one of the most important functions provided by an ecosystem. NPP data sets, meteorological data sets and elevation data sets were used to evaluate biodiversity. The formula can be Seen in Eq. 3.
2.2.3.3 Land stress index
Land stress index was used to evaluate the degree of stress on land quality in the area, which was expressed by the stress types such as soil erosion, construction land, land desertification and land rocky desertification per unit area in the evaluation area (Xie et al., 2020).
The Universal Soil Loss Equation is the most widely used erosion equation (Okan and Nilgun, 2002; Alewell et al., 2019). The USLE equation is described as .
A = soil loss in tons ha−1yr−1;R = rainfall runoff factor in tons-m ha−1;K = soil erodibility factor;LS = topographic factor;C = cover and management factor;P = support practice factor.
The amount of soil erosion was calculated according to the USLE Model, and any area with an erosion modulus greater than 5,000 was regarded as an area of strong erosion.
Karst rocky desertification is a progressive process of land degradation where soil is seriously or thoroughly eroded. The sensitivity assessment of rocky desertification was based on such factors as limestone exposure, topography and vegetation coverage (Huang and Cai, 2006; Bai et al., 2013; Chen et al., 2019). The formula can be seen in Eq. 5.
The desertification results in 2009 and 2019 were interpreted and processed from ETM+ and landsat-8 images of a desert (sand) distribution data set in China (National Cryosphere Desert Data Center (China)). The results of the fifth desertification monitoring in Sichuan Province are used for reference.
2.2.4 AHP-entropy methods
The combination of the analytic hierarchy process and the entropy weight method not only makes full use of the judgment of expert knowledge, but it also leaves room for reasoning and evaluation of objective data. It has comparative advantages, and it is still scientific.
2.2.4.1 AHP method
Goal (A) was broken down into Indicator (B), and Sub-indicator (C) to establish the pair-wise comparison matrix. The matrix was expressed with
A represents a positive reciprocal matrix, which satisfies
Relative importance of B1, B2, B3, B4 and B5 were analyzed by Expert Judgment System. In this research, we analyzed the relationship between various factors in the system and established the hierarchical structure of the system (Table 5).
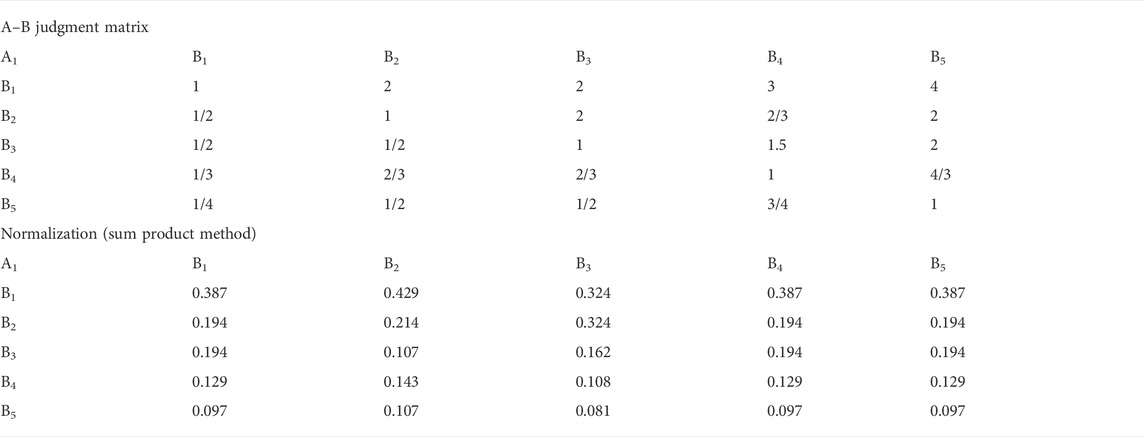
TABLE 5. A–B judgment matrix and Normalization of the AHP model.
To determine the consistency of a matrix, the eigenvectors of matrix A,
1) The matrix obtained by uniting the column vectors of the judgment matrix was recorded as:
The matrix obtained by uniting the column vectors of the judgment matrix was shown in Table 5.
2) The weights of B1, B2, B3, B4, and B5 could be obtained using the following formula:
Using the above method, the weights of B1, B2, B3, B4 and B5 were 0.383, 0.224,0.17, 0.128 and 0.096, respectively. (3)
where
4) Calculating the consistency index (CI):
5) Further, the consistency ratio (CR) can be calculated as follows:
Then using the method above, the normalized feature vector, consistency check and
2.2.4.2 Entropy weight method
The Entropy method employs an objective weighting method, which refers to determining the indicator weight according to the information provided by the observed values of each indicator.
1) A new judgment matrix
2) The proportion of the
3) If the entropy value of the
4) The weight of entropy of each evaluating indicator could be expressed as:
2.2.4.3 Determination of the overall weights
According to the weight
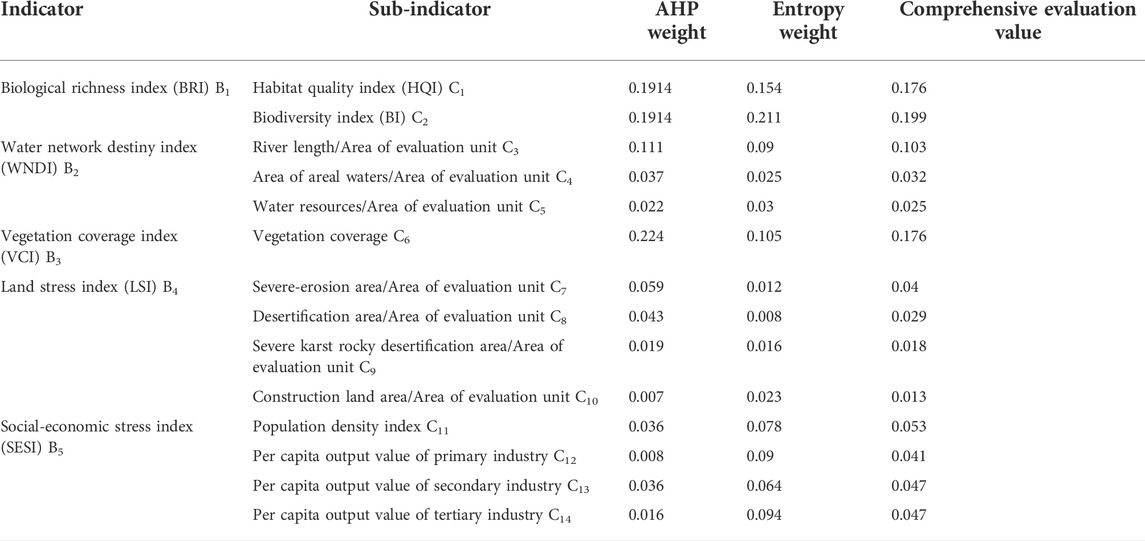
TABLE 6. AHP-entropy composite weight.
2.2.4.4 Calculation of indicator
The indicators were calculated from sub-indicators, the calculation formula can be Seen in .
where BAI represents the Biological abundance index, VCI represents Vegetation coverage index, WNDI represents Water network density index, LSI represents Land stress index and SESI represents Social-economic stress index.
2.2.4.5 Comprehensive index of Eco-environmental quality evaluation
The comprehensive index of Eco-environmental quality was obtained by the weighted sum of each index value, the formula can be seen in Eq. 18.
where
2.2.4.6 Classification of ecological environment
Following the Technical Criterion for Ecosystem Status Evaluation (HJ192-2015) (Ministry of Ecology and Environment the People’s Republic of China, 2015) issued in 2015 by the Ministry of Ecology and Environment of the People’s Republic of China, the Eco-environmental quality index (EQI) has been used by many scholars (Zhu et al., 2020; Li L. et al., 2021; Sun et al., 2021; Ouyang et al., 2022) to express the Eco-environmental quality (EEQ). With EQI, Eco-environmental quality is classified as one of five levels: Better (EQI≥75) Good (55 < EQI<75), Moderate (35 < EQI≤55), Bad (20 < EQI≤35) and Worse (EQI≤ 20). This standard of five levels was also adopted in this study. The change trend of EEQ (∆EQI) was classified into one of five levels: Significantly improving (∆EQI≥6), Slightly improving (2<∆EQI<6), Unchanged (-2<∆EQI≤2), Slightly declining (-6<∆EQI ≤ -2) and Significantly declining (∆EQI≤3).
3 Results
The basic data required for each Sub-indicator is shown in Figure 4 (2009) and Figure 5 (2019).
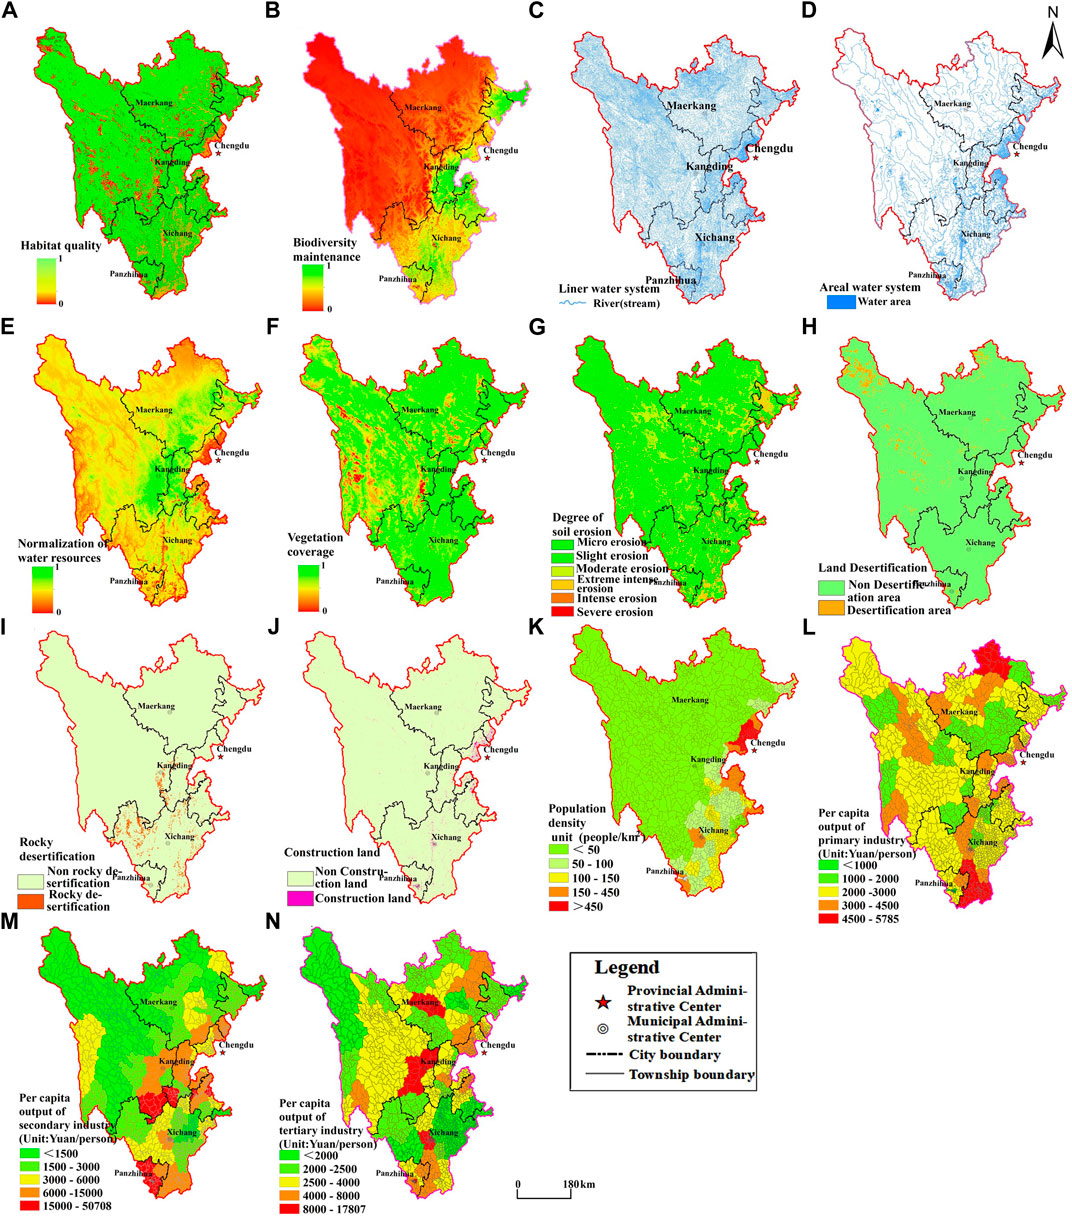
FIGURE 4. Spatial variation of source data corresponding to sub-indicators in 2009. (A) Habitat quality, (B) Biodiversity maintenance function, (C) Line water system, (D) Areal water system, (E) Normalization of water resources, (F) Vegetation coverage, (G) Degree of soil erosion, (H) Land Desertification, (I) Rocky desertification, (J) Construction land, (K) Population density, (L) Per capita output value of primary industry, (M) Per capita output value of secondary industry, (N) Per capita output value of tertiary industry.
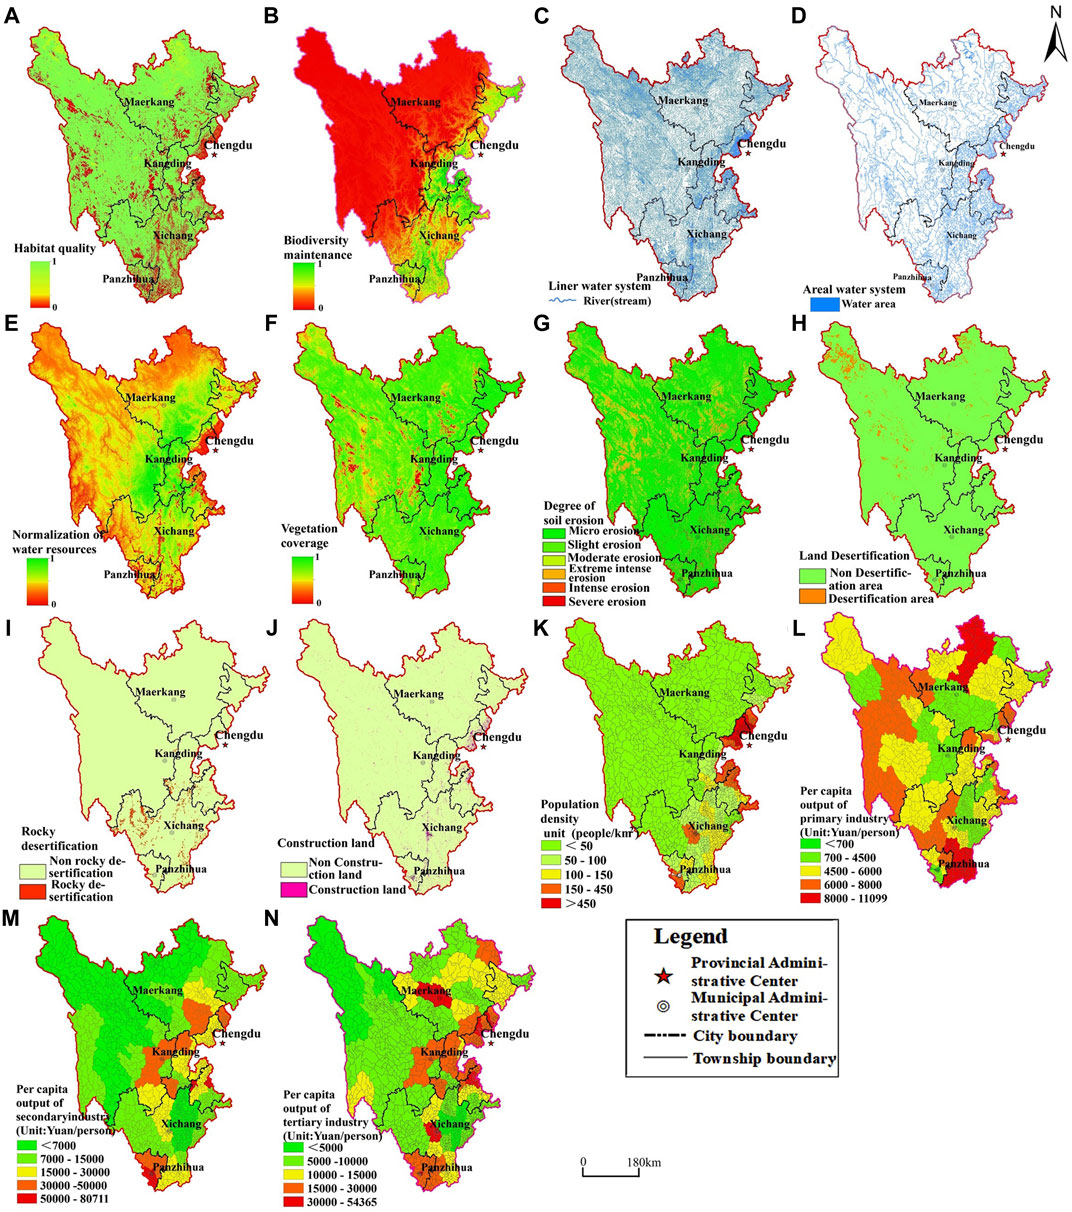
FIGURE 5. Spatial variation of source data corresponding to sub-indicators in 2019. (A) Habitat quality, (B) Biodiversity maintenance function, (C) Line water system, (D) Areal water system, (E) Normalization of water resources, (F) Vegetation coverage, (G) Degree of soil erosion, (H) Land Desertification, (I) Rocky desertification, (J) Construction land, (K) Population density, (L) Per capita output value of primary industry, (M) Per capita output value of secondary industry, (N) Per capita output value of tertiary industry.
3.1 Biological richness index
In the analysis, the areas with high habitat quality were mainly distributed in Longmen Mountain, Minshan Mountain, the southern section of Shaluli mountain and Daliang Mountain, while the areas with low habitat quality were mainly distributed in the towns on the edge of the Chengdu Plain and the Panzhihua urban area.
The biodiversity index was obtained using NPP, temperature, rainfall, and elevation factors. The biodiversity index was high in the south, low in the north, high in the east and low in the west. The regions with high biodiversity were mainly distributed in the eastern and southern mountain areas such as Longmen Mountain, Qionglai mountain system, Daliang Mountain and Jinping Mountain; The biodiversity index of Western Sichuan Plateau was low due to high altitude and low temperature. Similarly, the biodiversity index, derived from the biodiversity conservation function importance index, also mirrored this spatial distribution.
The areas with high biological richness were mainly distributed in the middle and high mountains around the basin of Sichuan Basin. The areas with low biological richness were mainly distributed in the extremely high mountain areas of Shaluli mountain and Shiqu country (Figures 6A, Figures 7A).
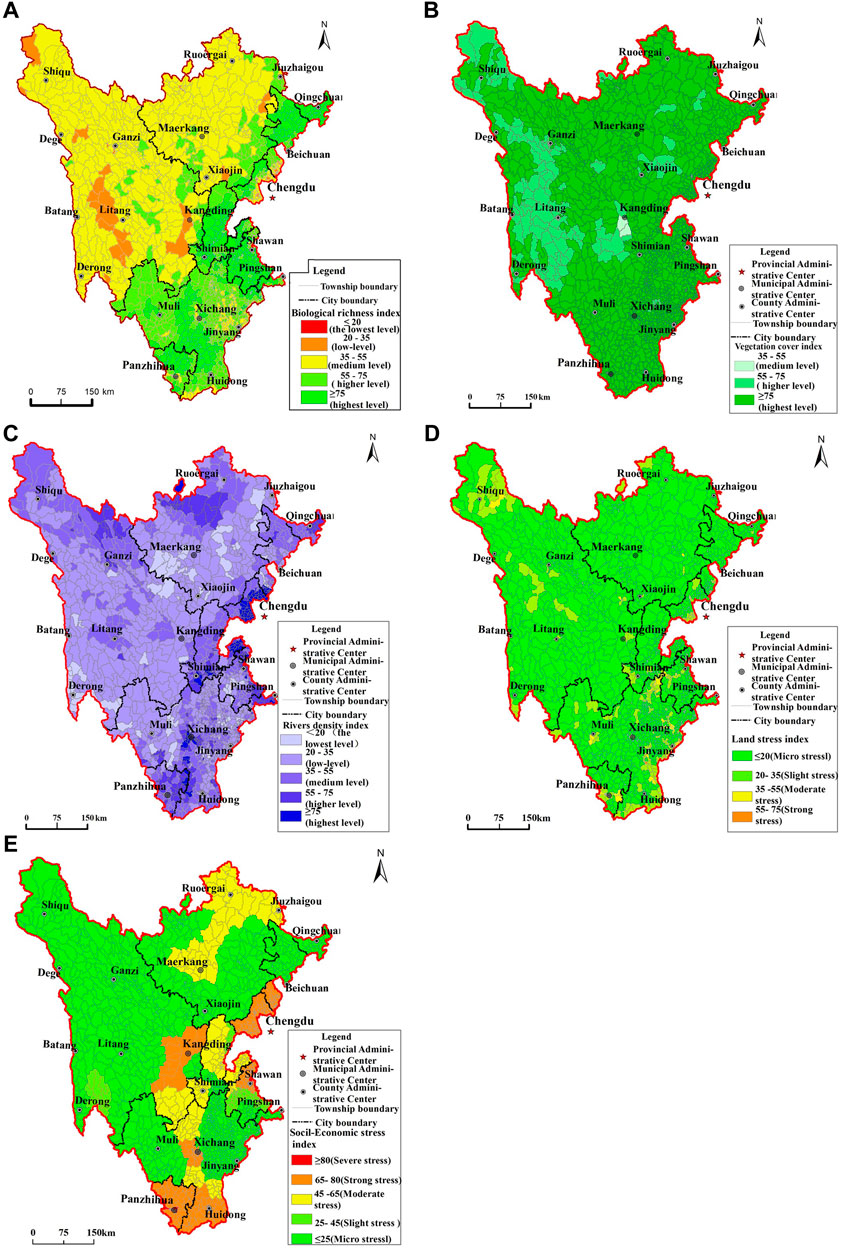
FIGURE 6. Assessment indicator in year 2009. (A) Biological richness index, (B) Water network density index, (C) Vegetation coverage index, (D) Land stress index, (E) Social-economic stress index.
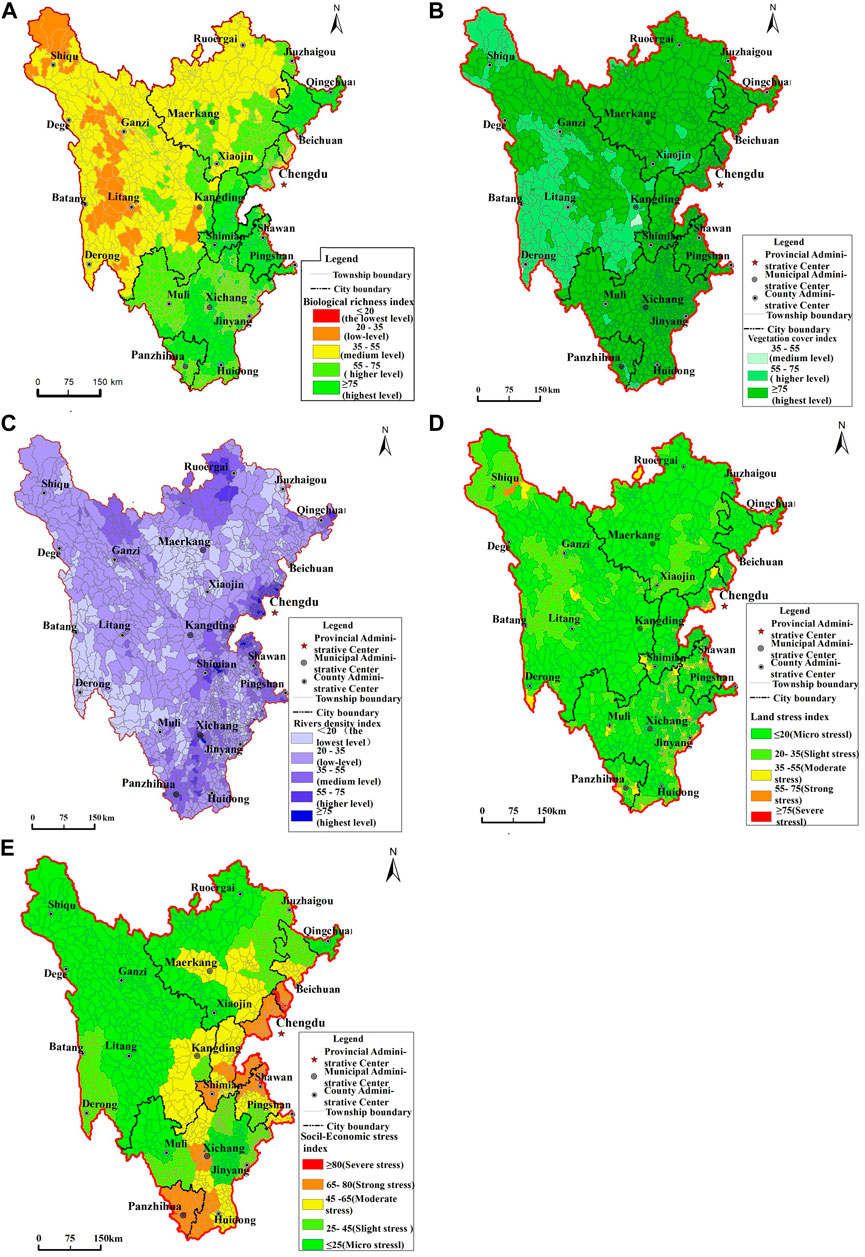
FIGURE 7. Assessment indicator in year 2019. (A) Biological richness index, (B) Water network density index, (C) Vegetation coverage index, (D) Land stress index, (E) Social-economic stress index.
3.2 Vegetation coverage index
First, the landsat-8 image was radiometrically calibrated, then the near-infrared band and red band were calculated to extract the NDVI value. Then the mean value of NDVI in each town was counted by using the zoning statistical tool. The areas with high vegetation coverage were mainly distributed in the Middle-Low mountains, around the basin of Sichuan Basin, and the areas with low vegetation coverage were mainly distributed in the extremely high mountain areas of Shaluli mountain, Daxue mountain and Qionglai mountain, the dry hot and dry river valley and the Grassland degradation area of Changsha-Gongma Nature Reserve Figures 6B, Figures 7B).
3.3 Water network density index
The water network in the study area was dense, and the main water systems included Jinsha River, Yalong River, Minjiang River and Dadu River in the Yangtze River Basin, Bai River and Heihe River in the Yellow River Basin, among which Jinsha River, Yalong River, Minjiang River, Dadu River and Yellow River Basin account for a high proportion of this area.
The water network density index was calculated according to the extracted water network line elements, area elements and water resources. According to the results of the analysis (Figures 6C, Figures 7C), the areas with high water network density index were mainly distributed in the Middle-Low mountains area at the edge of Sichuan Basin, Anning River Valley and Zoigê wetland.
3.4 Land stress index
The Universal Soil Loss Equation (USLE), which includes local rainfall, soil erodibility, slope gradient and slope length factors in its formula, was used to analyze the degree of soil erosion in the study area. The degree of soil erosion in the study area was mainly micro and mild. The areas with a high degree of soil erosion were mainly distributed in extremely high mountains and dry hot arid river valleys, and the high plains around the basin and plateau areas have a low degree of soil erosion. The degree of soil freeze-thaw erosion was high in extremely high mountain areas, and the dry hot arid valley areas were seriously affected by rainstorms in the summer.
According to the image analysis and surface coverage data, the desertification in the study area occurred across the Shiqu grassland wetland, Shaluli mountain, Panzhihua and Zoigê grassland wetland; The desertification in the west and north was mainly caused by the degradation of grassland and wetland, and the desertification in Danba and Xiaojin in the middle was mainly due to beach desertification (this region was distributed in a belt along the river).
The degree of rocky desertification in the study area was calculated using the carbonate exposure percentage, topographic slope, and vegetation coverage. The rocky desertification area accounted for 1.48% of the total area, and was mainly distributed in Muli, Yanyuan and on the Daliang mountain.
The degree of land stress in the study area was analyzed in combination with the results of soil erosion, land desertification, land rocky desertification and construction land analyses. The degree of land stress in the study area (Figure 6D, Figure 7D) mainly ranged from micro to mild. The area with a high degree of land stress was mainly distributed in the desertification area of Shiqu; the area with a high degree of freeze-thaw erosion was on Shaluli mountain, the dry valley area of Minjiang river and in Derong; and the area with strong soil erosion was in the middle reaches of the Jinsha river.
3.5 Social-economic stress index
Through analyzing population density and the value of per capita output of primary, secondary and tertiary industries, we found that the Social-economic stress index reflects the spatial distribution characteristics (Figures 6E, Figure 7E), with high levels in the east, low levels in the west, high levels in the south and low levels in the north. The areas with high stress were mainly distributed in the main urban areas of Panzhihua and Shifang, followed by Xichang, the subordinate counties of Chengdu, Deyang, Panzhihua, Leshan, and Meishan. The Social-economic stress index in Northwest Sichuan was low overall.
3.6 Eco-environmental quality
The Eco-environmental quality was calculated based on the various assessment factors and the Eco-environmental quality Index formula. The Eco-environmental quality of the study area was rated Moderate, Good, and Better (Figure 8), throughout. The Eco-environmental quality of the study area was mainly Good, with a small proportion of the area considered Moderate (Figure 9).
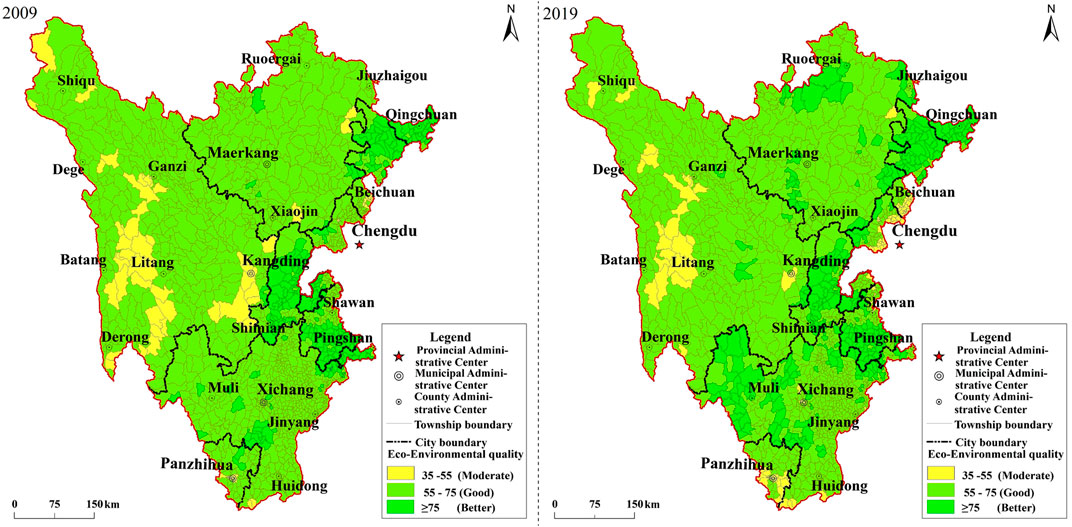
FIGURE 8. Eco-environmental quality index (EQI) in year 2009 (left) and 2019 (right).
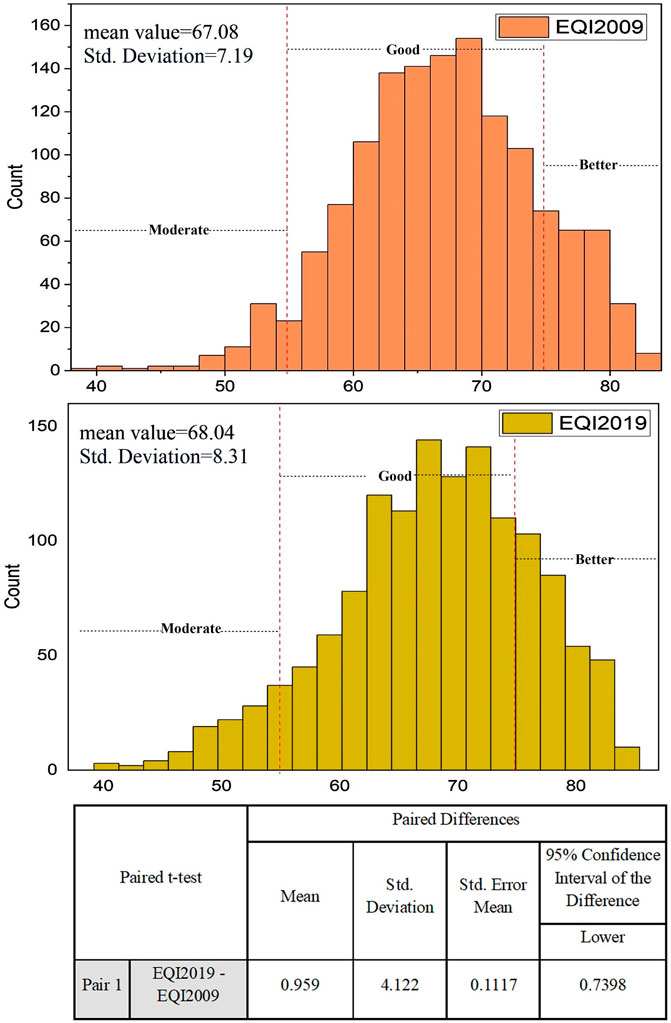
FIGURE 9. EQI value distribution in year 2009 and 2019 (Including paired t-test).
The areas with Better Eco-environmental quality were mainly distributed in the mountain area around the Sichuan basin, including the north section of the Longmen Mountain, the south section of the Longmen Mountain, the eastern part of Qionglai Mountain, Daliang Mountain, and in Muli County. The vegetation coverage in these areas was high. The land coverage was mainly forest, and the land stress and social-economic stress were both low.
The areas with Moderate Eco-environmental quality were mainly distributed in the transition zone from the Chengdu plain to the Western Sichuan mountains, the Panzhihua urban area and Shaluli mountain area. These areas had low vegetation coverage, poor habitat quality and great social-economic pressure.
In the 10-year period from 2009 to 2019, the change of Eco-environmental quality Index (∆EQI) was in the range of 4.5≥∆EQI>−7.6, (Figure 10). The areas with positive changes in Eco-environment are mainly distributed in Aba Prefecture, Daxue mountain and the south section of Shaluli mountain. In contrast, the Eco-environmental quality had deteriorated significantly on the edge of Sichuan Basin and in the towns of Panzhihua city.
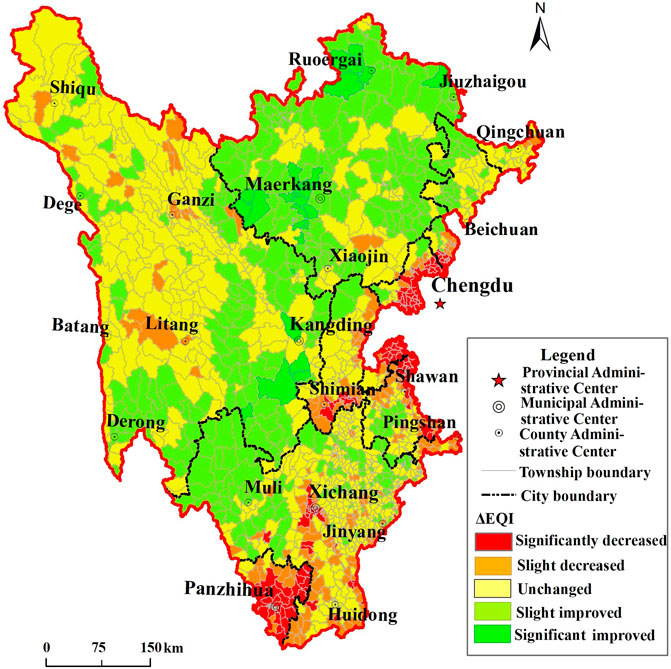
FIGURE 10. The changes of Eco-environmental quality Index between year 2009 and 2019 (ΔEQI).
According to the paired t-test of EQI values in 2009 and 2019 (Figure 9), the ecological environment experienced little change, and overall it tended to improve.
4 Discussion
4.1 Advantages and disadvantages to the proposed method
The assessment of regional ecological environment is required for ecological environment protection and restoration planning. Previous assessment methods have been based on the analytic hierarchy process (AHP) (Li et al., 2007; Xiong et al., 2007; Zhang et al., 2021) and Entropy method (Zhang et al., 2014; Zhao et al., 2018; Zhang et al., 2022). Analytic hierarchy process (AHP) alone cannot satisfy the relatively perfect rational assignment of index weights due to the scale of the region. On the other hand, the entropy method makes full use of the information provided by the original index to eliminate the subjectivity of the weight value of each factor. However, the entropy method also has some shortcomings. For one, the same evaluation factor will have different weight values under different evaluation schemes, ignoring the judgment of experienced decision makers.
The ecological environment assessment is built on the remote sensing ecological index (RSEI) and the EI index. Indicators required by RSEI method are greenness, humidity, dryness, and heat, which can only be extracted from remote sensing images. Although it is more objective, the indicators for Eco-environmental quality assessment are imperfect. The EI index method was first established by the Ministry of ecological environment in 2006 and was revised in 2015. The indicators are Biological richness index, Vegetation coverage index, Water network density index, Land stress index, Pollution load index and Restricted index, which altogether completely reflect the Eco-environment. However, the pollution stress index is mainly based off the statistical data obtained from sparse monitoring stations, so its accuracy is poor at a large-scale range.
This study adopted and improved the EI index system. AHP-Entropy Methods, which consider expert experience and data objectivity, were used to determine the indicator weight. Previous models for biodiversity assessment are based on the spatial distribution of rare animals and plants, but this data is difficult to simulate in space. This paper proposes using the NPP model to quantify the status of biodiversity (Barral and Oscar, 2012; Zhang et al., 2016). The pollutant emission was based on the quantitative monitoring at a single station, so the interpolation accuracy is low. The degradation of the ecological environmental is directly related with the growth of economic development of the region (He et al., 2014; Li Y. R. et al., 2021). A society and economics subsystem (residential density, GDP of per capita, population density) was used to evaluate regional eco-environmental quality (Li et al., 2007; Sun et al., 2013). The Social-economic stress index (SESI) reflects the degree of pollution in the ecological environment caused by the discharge of three wastes due to production and living activities.
However, the indicators listed here are still not perfect. In future research, we intend to rebuild the basic framework of Eco-environment assessments according to ecological pattern, ecological function, biodiversity and ecological stress.
4.2 Driving factors of EEQ change
The areas with Moderate Eco-environmental quality and obvious degradation are mainly distributed in the Marginal Towns of the Sichuan Basin in Chengdu, Deyang and Leshan, and in some towns in Panzhihua and the Anning River Valley (Figure 11). Through this analysis, we found that economic development is a major social and economic stress in these areas. For instance, the area of construction land is increasing due to ongoing urbanization in these areas, and conversely the area of ecological land, such as forest and grassland, is decreasing sharply.
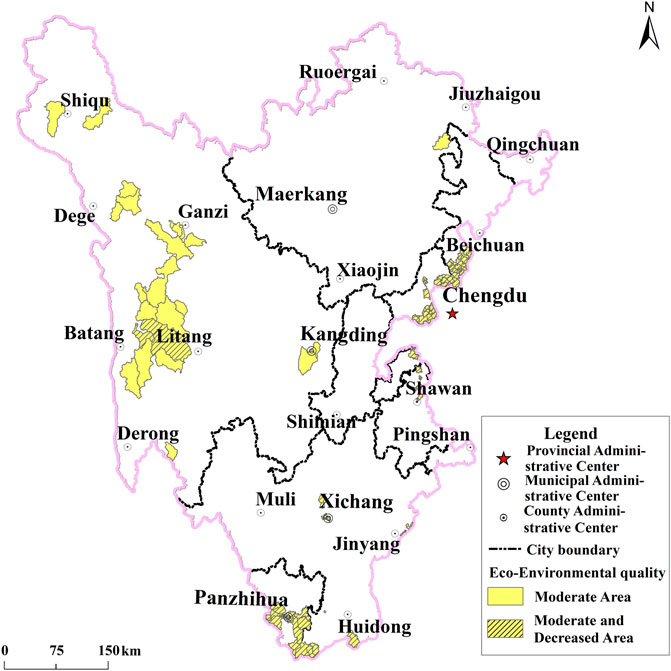
FIGURE 11. Moderate Eco-environmental quality and obvious degradation area.
The areas where the eco-environment is improving are widely distributed and account for a large proportion of the Aba Prefecture (Figure 10). The 2008 Wenchuan earthquake caused great damage to the ecological environment and serious damage to vegetation in this area. By 2019, the ecological environment had improved, with vegetation coverage having increased and soil erosion gradually fading.
4.3 Suggestions on the implementation of ecological restoration
By using a township as the assessment unit, this analysis can assist local governments in making decisions, such as the determination of key areas of ecological restoration and the fund allocation of ecological restoration projects.
Because the areas with Moderate Eco-environmental quality and obvious degradation are mainly located in urban areas, relevant measures should be taken to improve the quality of the urban ecological environment. These measures may include: Building an urban internal ecological corridor, a suburban ecological protection green space, a forest belt around the city and a Country Park; Implementing sewage treatment, treatment of black and odorous water bodies and comprehensive treatment of water environment; Protecting and repairing urban green spaces, expanding storage space, and building an ecological infrastructure system; Improving the park system and greenway network.
Grassland desertification and degradation are serious issues in hilly plateau areas (Shiqu County and Shaluli mountains), and so measures such as minimizing grazing and planting artificial grass should be taken. The soil erosion along the Jinsha River in Panzhihua is also a serious concern, and so the control of water needs to be addressed to avoid soil loss.
5 Conclusion
To understand the ecological environment of the mountainous area, this study developed a comprehensive regional Eco-environmental quality assessment system specific to mountainous areas. 14 indicators from five aspects (biological richness, vegetation cover, water network density, land stress, and social-economic stress) were selected. The combination of chromatographic analysis and the entropy method helped objectively determine the factor weights, and finally, the ecological environment of Western Sichuan was comprehensively evaluated and analyzed through a spatial perspective. Township-level regions are an important part of China’s national economic and social structure and have relevant geographical, spatial, and administrative independence, which was conducive to the formulation and implementation of targeted policies. Therefore, this study takes the township administrative region as the research object, with the help of remote sensing data and GIS technology. A comprehensive assessment of Eco-environmental quality (EEQ) is key to regional environmental protection and sustainable development. This method combines traditional ecological principles with remote sensing, GIS technology, landscape ecology and ecosystem service assessment, and will potentially impact sustainable development strategies.
Data availability statement
The datasets presented in this study can be found in online repositories. The names of the repository/repositories and accession number(s) can be found in the article/supplementary material.
Author contributions
XC and SC performed field investigation. XC and DX organized the data and performed the analysis. XC wrote the original draft of the manuscript. ZH and WP reviewed and edited the manuscript. KF and GF performed the visualization. All authors contributed to the article and approved the submitted version.
Funding
This work was sponsored by the Natural Science Foundation of Sichuan Province, China (2022NSFSC1040) and supported by the Independent Research Project of the State Key Laboratory of Geohazard Prevention and Geoenvironment Protection Independent Research Project (SKLGP2021Z003).
Conflict of interest
The authors declare that the research was conducted in the absence of any commercial or financial relationships that could be construed as a potential conflict of interest.
Publisher’s note
All claims expressed in this article are solely those of the authors and do not necessarily represent those of their affiliated organizations, or those of the publisher, the editors and the reviewers. Any product that may be evaluated in this article, or claim that may be made by its manufacturer, is not guaranteed or endorsed by the publisher.
References
Alewell, C., Borrelli, P., Meusburger, K., and Panagos, P. (2019). Using the USLE: Chances, challenges and limitations of soil erosion modelling. Int. Soil Water Conservation Res. 7 (3), 203–225. doi:10.1016/j.iswcr.2019.05.004
Bai, X. Y., Wang, S. J., and Xiong, K. N. (2013). Assessing spatial-temporal evolution processes of karst rocky desertification land: Indications for restoration strategies. Land Degrad. Dev. 24 (1), 47–56. doi:10.1002/ldr.1102
Barral, M. P., and Oscar, M. N. (2012). Land-use planning based on ecosystem service assessment: A case study in the southeast pampas of Argentina. Agric. Ecosyst. Environ. 154, 34–43. doi:10.1016/j.agee.2011.07.010
Berta Aneseyee, A., Noszczyk, T., Soromessa, T., and Elias, E. (2020). The InVEST habitat quality model associated with land use/cover changes: A qualitative case study of the winike watershed in the omo-gibe basin, southwest Ethiopia. Remote Sens. 12 (7), 1103. doi:10.3390/rs12071103
Boori, M. S., Komal, C., Rustam, P., and Alexander, K. (2021). Eco-environmental quality assessment based on pressure-state-response framework by remote sensing and GIS. Remote Sens. Appl. Soc. Environ. 23, 100530. doi:10.1016/j.rsase.2021.100530
Brooks, T. M., Mittermeier, R. A., da Fonseca, G. A., Gerlach, J., Hoffmann, M., Lamoreux, J. F., et al. (2006). Global biodiversity conservation priorities. Science 313 (5783), 58–61. doi:10.1126/science.1127609
Chen, F., Wang, S. J., Bai, X. Y., Liu, F., Zhou, D. Q., Tian, Y. C., et al. (2019). Assessing spatial-temporal evolution processes and driving forces of karst rocky desertification. Geocarto Int. 36 (3), 262–280. doi:10.1080/10106049.2019.1595175
Chen, Z., Chen, J. P., Zhou, C. F., Liu, T., Jiang, P., and zhang, Q. P. (2021). Landuse types change and ecological environment assessment of Xiaoyangyidistrict of Daxing'an Mountains based on remote sensing. Geol. Surv. China 8 (6), 126–134. doi:10.19388/j.zgdzdc.2021.06.12
Costanza, R., Fisher, B., Mulder, K., Liu, S., and Christopher, T. (2007). Biodiversity and ecosystem services: A multi-scale empirical study of the relationship between species richness and net primary production. Ecol. Econ. 61 (2-3), 478–491. doi:10.1016/j.ecolecon.2006.03.021
Fu, B. J., Liu, S. L., and Ma, K. M. (2001). The contents and methods of integrated ecosystem assessment (IEA). Chin. J. Acta Ecol. Sin. 21 (11), 1885–1892.
Guo, L. F., and Farouk, A. (2021). Coupling coordination degree between new urbanization and eco-environment in shaanxi, China, and its influencing factors. Discrete Dyn. Nat. Soc. 2021, 1–8. doi:10.1155/2021/1555362
He, Q., Bertness, M. D., Bruno, J. F., Li, B., Chen, G., Coverdale, T. C., et al. (2014). Economic development and coastal ecosystem change in China. Sci. Rep. 4, 5995. doi:10.1038/srep05995
Hu, X., and Xu, H. (2019). A new remote sensing index based on the pressure-state-response framework to assess regional ecological change. Environ. Sci. Pollut. Res. 26 (6), 5381–5393. doi:10.1007/s11356-018-3948-0
Huang, H. P., Chen, W., Zhang, Y., Qiao, L., and Du, Y. Y. (2021). Analysis of ecological quality in lhasa metropolitan area during 1990–2017 based on remote sensing and google earth engine platform. J. Geogr. Sci. 31 (2), 265–280. doi:10.1007/s11442-021-1846-8
Huang, Q. H., and Cai, Y. L. (2006). Assessment of karst rocky desertification using the radial basis function network model and GIS technique: A case study of Guizhou Province, China. Environ. Geol. 49 (8), 1173–1179. doi:10.1007/s00254-005-0162-4
Jing, Y. Q., Zhang, F., He, Y. F., Kung, H.-t., Johnson, V. C., and Arikena, M. (2020). Assessment of spatial and temporal variation of ecological environment quality in ebinur lake wetland national nature Reserve, xinjiang, China. Ecol. Indic. 110, 105874. doi:10.1016/j.ecolind.2019.105874
Karbalaei Saleh, S., Amoushahi, S., and Gholipour, M. (2021). Spatiotemporal ecological quality assessment of metropolitan cities: A case study of central Iran. Environ. Monit. Assess. 193 (5), 305. doi:10.1007/s10661-021-09082-2
Li, L., Ni, W. K., Cheng, Y. X., Wang, H. M., Yuan, K. Z., and Zhou, B. (2021). Evaluation of the eco-geo-environment in the qaidam basin, China. Environ. Earth Sci. 80 (1), 27. doi:10.1007/s12665-020-09312-9
Li, S., Wei, H., Ni, X. l., Gu, Y. W., and Li, C. X. (2014). Evaluation of urban human settlement quality in Ningxia based on AHP and the entropy method. Chin. J. Appl. Ecol. 25 (9), 2700–2708.
Li, Y. Q., Lu, C. X., Deng, O., and Chen, P. P. (2015). Ecological characteristics of China's key ecological function areas. J. Resour. Ecol. 6 (6), 427–433. doi:10.5814/j.issn.1674-764x.2015.06.011
Li, Y. R., Zhang, X. C., Cao, Z., Liu, Z. J., Lu, Z., and Liu, Y. S. (2021). Towards the progress of ecological restoration and economic development in China's Loess Plateau and strategy for more sustainable development. Sci. Total Environ. 756, 143676. doi:10.1016/j.scitotenv.2020.143676
Li, Z. W., Zeng, G. M., Zhang, H., Yang, B., and Jiao, S. (2007). The integrated eco-environment assessment of the red soil hilly region based on GIS—a case study in Changsha city, China. Ecol. Model. 202 (3-4), 540–546. doi:10.1016/j.ecolmodel.2006.11.014
Liao, W. H., and Jiang, W. G. (2020). Evaluation of the spatiotemporal variations in the eco-environmental quality in China based on the remote sensing ecological index. Remote Sens. 12 (15), 2462. doi:10.3390/rs12152462
Liu, G. C., Zhang, J. H., Tian, G. L., and Wei, C. F. (2005). The effects of land uses on purplish soil erosion in hilly area of sichuan Province, China. J. Mt. Sci. 2 (1), 68–75. doi:10.1007/s11629-005-0068-3
Miao, C. L., Sun, L. Y., and Yang, L. (2016). The studies of ecological environmental quality assessment in Anhui Province based on ecological footprint. Ecol. Indic. 60, 879–883. doi:10.1016/j.ecolind.2015.08.040
Ministry of Ecology and Environment the People's Republic of China (2015). Technical criterion for eco-environmental status evaluation. Beijing: China Environmental Science Press.
Naidoo, R., Balmford, A., Costanza, R., Fisher, B., Green, R. E., Lehner, B., et al. (2008). Global mapping of ecosystem services and conservation priorities. Proc. Natl. Acad. Sci. U. S. A. 105 (28), 9495–9500. doi:10.1073/pnas.0707823105
Okan, F., and Nilgun, B. H. (2002). Integration of GIS with USLE in assessment of soil erosion. Water Resour. Manag. 16, 447–467. doi:10.1023/A:1022282125760
Ouyang, L., Ma, H. Y., Wang, Z. M., Lu, C. Y., Wang, C. L., Zhang, Y. S., et al. (2022). Dynanic evaluation of ecological environment in Honjin sandy land based on remote sensing and geographic information data. Acta Ecol. Sin. 42 (14). doi:10.5846/stxb202004230977
Qi, Y. N., and Wang, L. (2021). Application of AHP-entropy weight method in hazards susceptibility assessment in mountain town. Bull. Surv. Mapp. (6), 112. doi:10.13474/j.cnki.11-2246.2021.0187
Shan, W., Jin, X. B., Ren, J., Wang, Y. C., Xu, Z. G., Fan, Y. T., et al. (2019). Ecological environment quality assessment based on remote sensing data for land consolidation. J. Clean. Prod. 239, 118126. doi:10.1016/j.jclepro.2019.118126
Sun, D. Q., Zhang, J. X., Hu, Y., Jiang, J. L., and Zhou, L. (2013). Spatial analysis of China’s eco-environmental quality: 1990–2010. J. Geogr. Sci. 23 (4), 695–709. doi:10.1007/s11442-013-1038-2
Sun, L. X., Yu, Y., Gao, Y. T., He, J., Yu, X., Malik, I., et al. (2021). Remote sensing monitoring and evaluation of the temporal and spatial changes in the eco-environment of a typical arid land of the tarim Basin in western China. Land 10 (8), 868. doi:10.3390/land10080868
Wang, G. X., George, G., Liu, X. Z., and Alan, A. (2001). Uncertainty assessment of soil erodibility factor for revised universal soil loss equation. CATENA 46 (1), 1–14. doi:10.1016/S0341-8162(01)00158-8
Wang, Q. Z., Gao, M. F., and Zhang, H. J. (2022). Agroecological efficiency evaluation based on multi-source remote sensing data in a typical county of the Tibetan plateau. Land 11 (4), 561. doi:10.3390/land11040561
Wang, W. Q., Sun, Y. H., and Wu, J. (2018). Environmental warning system based on the DPSIR model: A practical and concise method for environmental assessment. Sustainability 10 (6), 1728. doi:10.3390/su10061728
Wen, L., Dong, S., Li, Y., Li, X., Shi, J., Wang, Y., et al. (2013). Effect of degradation intensity on grassland ecosystem services in the alpine region of Qinghai-Tibetan Plateau, China. PLoS One 8 (3), e58432. doi:10.1371/journal.pone.0058432
Xie, C. S., Dong, D. P., Hua, S. P., Xu, X., and Chen, Y. J. (2012). Safety evaluation of smart grid based on AHP-entropy method. Syst. Eng. Procedia 4, 203–209. doi:10.1016/j.sepro.2011.11.067
Xie, H. L., Zhang, Y. W., Wu, Z. L., and Lv, T. G. (2020). A bibliometric analysis on land degradation: Current status, development, and future directions. Land 9 (1), 28. doi:10.3390/land9010028
Xiong, Y., Zeng, G. M., Chen, G. Q., Tang, L., Wang, K. L., and Huang, D. Y. (2007). Combining AHP with GIS in synthetic evaluation of eco-environment quality—a case study of hunan Province, China. Ecol. Model. 209 (2-4), 97–109. doi:10.1016/j.ecolmodel.2007.06.007
Xu, H. Q., Wang, Y. F., Guan, H. D., Shi, T. T., and Hu, X. S. (2019). Detecting ecological changes with a remote sensing based ecological index (RSEI) produced time series and change vector analysis. Remote Sens. 11 (20), 2345. doi:10.3390/rs11202345
Yang, S., Wang, X., and Hu, J. (2022). Mountain frog species losing out to climate change around the Sichuan Basin. Sci. Total Environ. 806 (2), 150605. doi:10.1016/j.scitotenv.2021.150605
Yu, D. Y., Shi, P. J., Shao, H. B., Zhu, W. Q., and Pan, Y. Z. (2009). Modelling net primary productivity of terrestrial ecosystems in East Asia based on an improved CASA ecosystem model. Int. J. Remote Sens. 30 (18), 4851–4866. doi:10.1080/01431160802680552
Yuan, J. G., Niu, Z., and Wang, C. L. (2006). Vegetation NPP distribution based on MODIS data and CASA model—a case study of northern hebei Province. Chin. Geogr. Sci. 16 (4), 334–341. doi:10.1007/s11769-006-0334-5
Zhang, H., Zhang, C., Hu, T., Zhang, M., Ren, X. W., and Hou, L. (2020). Exploration of roadway factors and habitat quality using InVEST. Transp. Res. Part D Transp. Environ. 87, 102551. doi:10.1016/j.trd.2020.102551
Zhang, L. N., Zhang, H. Q., and Xu, E. Q. (2022). Information entropy and elasticity analysis of the land use structure change influencing eco-environmental quality in Qinghai-Tibet Plateau from 1990 to 2015. Environ. Sci. Pollut. Res. 29 (13), 18348–18364. doi:10.1007/s11356-021-17978-2
Zhang, L. W., Fu, B. J., Lü, Y. H., Dong, Z. B., and Li, Y. J. (2016). The using of composite indicators to assess the conservational effectiveness of ecosystem services in China. Acta Geogr. Sin. 71 (5), 768–780. doi:10.11821/dlxb201605006
Zhang, X. Q., Wang, C. B., Li, E. K., and Xu, C. D. (2014). Assessment model of ecoenvironmental vulnerability based on improved entropy weight method. Sci. World J. 2014, 1–7. doi:10.1155/2014/797814
Zhang, Y. H., Guo, J. R., Zhuang, Y., and Xiujun, T. (2021). Eco-environmental quality evaluation of Wuleidaowan national wetland based on Analytic Hierarchy Process(AHP) approach. IOP Conf. Ser. Earth Environ. Sci. 769 (2), 022013. doi:10.1088/1755-1315/769/2/022013
Zhao, J. C., Ji, G. X., Tian, Y., Chen, Y. L., and Wang, Z. (2018). Environmental vulnerability assessment for mainland China based on entropy method. Ecol. Indic. 91, 410–422. doi:10.1016/j.ecolind.2018.04.016
Zhao, Q. G., Huang, G. Q., and Ma, Y. Q. (2016). The·ecological environment conditions and construction·of an ecological civilization·in·China. Acta·Ecologica Sin. 36 (19), 6328–6335. doi:10.5846/stxb201410081968
Zheng, D., and Yang, Q. Y. (1985). Some problems on the altitudinal belts in southeast Qinghai-Xizang (Tibetan) plateau. Acta Geogr. Sin. 40 (1), 60–69.
Zheng, Y. C., and Gao, S. H. (1984). Trial discussion on the nature zone of the mountains in west Sichuan. Mt. Res. 2 (4), 237–246.
Keywords: eco-environmental quality assessment, biological richness index, vegetation coverage index, land stress index, social-economic stress index, water network density index
Citation: Chen X, Chen S, He Z, Xue D, Fang G, Pan K and Fang K (2022) Developing a system for comprehensive regional Eco-environmental quality assessment in mountainous areas—A case study of Western Sichuan, China. Front. Environ. Sci. 10:879662. doi: 10.3389/fenvs.2022.879662
Received: 20 February 2022; Accepted: 19 July 2022;
Published: 28 September 2022.
Edited by:
Alexander Kokhanovsky, Max Planck Institute for Chemistry, GermanyReviewed by:
Qi Fu, Soochow University, ChinaWei Zhao, Institute of Mountain Hazards and Environment (CAS), China
Zhijie Wang, Guizhou University, China
Xiaoyong Bai, Chinese Academy of Sciences (CAS), China
Copyright © 2022 Chen, Chen, He, Xue, Fang, Pan and Fang. This is an open-access article distributed under the terms of the Creative Commons Attribution License (CC BY). The use, distribution or reproduction in other forums is permitted, provided the original author(s) and the copyright owner(s) are credited and that the original publication in this journal is cited, in accordance with accepted academic practice. No use, distribution or reproduction is permitted which does not comply with these terms.
*Correspondence: Zhengwei He, aHp3QGNkdXQuZWR1LmNu