 Jinbing Zhang1
 Huiru Zhu1
 Pengyan Zhang1,2,3*Yongpeng Song1Ying Zhang1Yanyan Li1Tianqi Rong1Zhenyue Liu1Dan Yang1Yuanyuan Lou1
- 1College of Geography and Environmental Science, Henan University, Kaifeng, China
- 2Key Laboratory of Geospatial Technology for the Middle and Lower Yellow River Regions (Henan University), Ministry of Education, Kaifeng, China
- 3Regional Planning and Development Center, Henan University, Kaifeng, China
With continuous urbanization and the fragmentation of green areas that affect human well-being, the establishment of a green infrastructure (GI) network is important in future urban planning. As a National Central City, Zhengzhou has a large population and is undergoing rapid economic development, resulting in an urgent demand for green space within the city in recent years. We selected the main urban area of Zhengzhou as the study area based on the two phases of Landsat 8 satellite remote sensing image data, for 2016 and 2021, and used the patch-generating land use simulation (PLUS) model to predict the spatial distribution of GI in the future; compared with traditional methods, this method identified green spaces from a future perspective. A GI network—consisting of an open space with vegetation as the main body—was designed for the main urban area of Zhengzhou using the traditional landscape ecological pattern theory, integrating morphological spatial pattern analysis (MSPA), the minimum cumulative resistance (MCR) model, circuit theory, and other methods. Evidently, the area of green space in Zhengzhou City in 2021 was 36 231.6 hm2. GI prediction results indicate that continuous expansion of the main urban area did not result in significant changes in the size of GI in the city. The GI within the urban area was relatively fragmented, forming 15 GI hubs, most of which were densely distributed along the edges of the main urban area. This study proposed the construction of a GI network with a target corridor and target points based on the existing corridor. This included the identification of seven target corridors and 15 target hubs; the total length of the corridor was 77.032 km, with a total of 31 target points. In summary, the GI network pattern of “one protection barrier, two lines, three loops and more points” was proposed. With new urban problems constantly emerging, this research could provide a theoretical reference basis for the planning of GI in the main urban area of the National Central City. The study provides concrete evidence on the optimum pattern for the construction of GI networks in cities with large populations.
1 Introduction
The drastic changes in global climate and the rapid increase in urbanization and urban population rates (Zhang et al., 2020) have led to many urban ecological and environmental problems such as the deterioration of urban air quality, loss of biodiversity, and decline in human well-being, thereby resulting in the weakening of sustainable development capacity and decline in ecological resilience (Monteiro et al., 2020; Lee et al., 2021). With industrialization, intensive industrial production and urban population have increased, and the restoration of the natural environment and ecological landscape is an urgent problem that needs to be resolved (Liu et al., 2021). Constructing an ecological network of vegetation patches can effectively enhance biodiversity, regulate the urban landscape, resist floods within the city, and help adapt to climate change. Such a network can further promote urban ecological protection and restoration and subsequently help establish urban natural landscapes, including open forests and public parks, as part of relevant ecological planning (Ignatieva et al., 2011).
With drastic climate change, and the frequent natural disasters and other environmental problems associated with it that are becoming more and more serious, green infrastructure (GI) is playing an increasingly important role in maintaining biodiversity, and promoting the sustainable development of cities (Chung et al., 2021). The concept of GI was formally put forward in the report “ Towards a sustainable America: advancing prosperity, opportunity, and a healthy environment for the 21st century ” issued by the United States Commission for Sustainable Development in 1999 (President’s Council on Sustainable Development, 1999). It refers to a landscape entity that consists of an open space with vegetation as the main body, and its accompanying facilities; it can be a large open space like a park or a square, or it can refer to trees, fields, green roofs, or green plants that cling to walls (Weber et al., 2006). After the release of the report, there has been a gradual increase worldwide in research on GI concepts, mostly focusing on adapting to climate change (Ramyar et al., 2021), improving stormwater management capabilities (Ampomah et al., 2021), enhancing air quality (Pearce et al., 2021), improving public benefits and participation (Zhang J.et al., 2021), planning GI locations (Torres et al., 2021), and evaluating GI multifunctionality (Marando et al., 2019; Lee and Oh, 2019; Valenzuela-Levi and Abreu et al., 2021). Considering representative examples of research on urban planning and policy formulation from the United States (Meerow, 2020; Woodruff et al., 2021), Canada (Anderson and Gough, 2020; Anderson and Gough, 2021), Western Europe (Rodriguez et al., 2021; Zimmermann and Lee, 2021), and other regions, it is proven that GI can guarantee an ecological security pattern (ESP) at the national level, provide conditions to ensure development with benign effects on the natural environment while satisfying the needs of human settlements, and enhance the ability of urban environments to achieve ecological restoration. The form of GI is mostly based on a large area with many hubs as elements, with different types of corridors used as bridges to connect these hubs. GI elements form a network, enabling considerable information and material exchange among the elements (Little, 1990). Domestic research on GI in China mainly focuses on the review and amalgamation of concepts from abroad (Wang and Banzhaf, 2018), GI planning (Nesshöver et al., 2017), and the study of evaluation methods (Weber et al., 2006). With growing emphasis on sustainable urban development and eco-friendly construction, research on related theoretical and practical aspects have gradually increased; so have the integration and application of concepts such as GI and ESP (Fu et al., 2020), urban growth boundary (UGB) (Tayyebi et al., 2011), and ecological belts (EB) (Zhao et al., 2021; Cho et al., 2008). The development of China’s urban green infrastructure (UGI) involved the planned construction of cities with an optimized UGI network that included the identification of GI elements, network construction, and a planned research strategy (Fňukalová et al., 2021); it is beneficial for cities to retain their natural ecological landscape (Dennis et al., 2018), increase biodiversity (Hostetler et al., 2011), enhance carbon sequestration (Spatari et al., 2011), control the heat island effect (Marando et al., 2019), and reduce rainwater runoff (Li and Bergen, 2018). In this study, the landscape ESP of “source area-resistance surface-corridor” (Yu, 1999) is taken as the paradigm; the selection of source areas mostly revolves around theories of landscape pattern optimization (Ma and Wang, 2021), ecosystem service value (Wang and Pan, 2019), supply and demand (Lorilla et al., 2019; Bukvareva et al., 2017), biodiversity (Fattorini, 2014) ecological importance, and ecological sensitivity (Jin et al., 2021). Corridor design mostly uses methods such as the minimum cumulative resistance (MCR) model, morphological spatial pattern analysis (MSPA), circuit theory, and patch gravity model (Li et al., 2021), to build a small-scale GI network (Wang K. et al., 2020) Regional characteristics differ in terms of selection of source area and landscape connectivity index which is key to judging the connectivity between GI elements. To ensure rationality in use of land for GI development, and the integrity of its ecological process in sustainable urban development, the development of urban land requires reasonable prediction and simulation of the expected spatial distribution of GI, and the optimization of the regional GI network based on the results (Liquete et al., 2015).
As a National Central City, Zhengzhou is characterized by high resource allocation; it also possesses unique natural environmental characteristics. Efficiently using the advantages with regarded to policies and the natural environment of the city, rationally laying out GI, improving the efficiency of green space utilization, and enhancing the city’s ability to withstand natural disasters are the points of research focus in the quest to achieve Zhengzhou’s ecological civilization. Based on this vision, this study combines the MSPA method, landscape connectivity theory, MCR model, circuit theory, and other methods and introduces a patch-generating land use simulation (PLUS) model. The PLUS model in this paper is used to predict the general trend development of the urban area, seek changes in the scale of urban green space from direct land use changes, and has quantifiable characteristics in analyzing the future GI areas in Zhengzhou. In addition, a new method integrating MCR model and circuit theory is proposed. The combination of the two methods provides reliable evidence and research basis for constructing the GI network in the main urban area of Zhengzhou. Combined with landscape ecology, geography and urban planning and other disciplines, the suitability of Zhengzhou’s GI network layout is considered from multiple perspectives. As shown in Figure 1 a framework of “elements-corridors-network” is established to design a GI network for the main urban area of Zhengzhou to provide new ideas and insights for the optimization of UGI and prioritization of site selection and to provide a reference for the development of the main urban area of the metropolis.
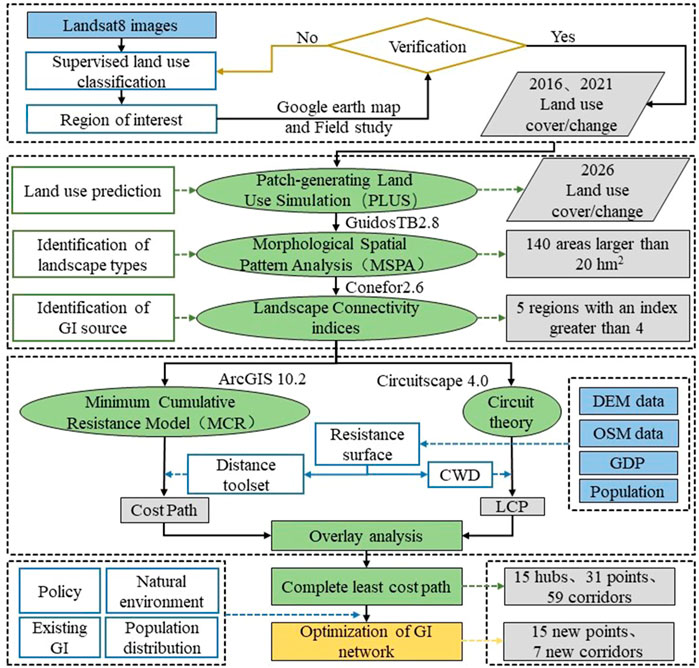
FIGURE 1. Flow chart showing research methodology.
2 Research Region
Zhengzhou City is located in the North China Plain—the alluvial plain of the lower Yellow River—and is characterized by high elevation in the west and low elevation in the east. In recent years, with the policy of ecological protection and high-quality development of the Yellow River Basin in place, and the development of central China, the urbanization of Zhengzhou City has been happening at an accelerated pace, and the phenomenon of urban agglomeration has been obvious. As per the seventh national census of November 2020, the permanent population of Zhengzhou City at the prefecture level was approximately 12.06 million, and the urban population was approximately 9.87 million, accounting for 78.40%.
The built-up land in the main urban area of Zhengzhou has recently expanded outward from the urban center, and the disappearance of GI outside the main urban area has been increasing. The heat island effect and waterlogging in urban centers have also become more pronounced. With the promulgation of “The Zhengzhou Forest Ecological Construction Plan (2020–2035),” the ecological civilization of Zhengzhou has become the focus of development. This study considers the main urban area of Zhengzhou, the area encompassing Zhongyuan, Jinshui, Erqi, Guancheng, and Huiji districts, as shown in Figure 2. The study area as a whole was 1,015.21 km2; by 2021, the area with green cover is expected to reach 362.32 km2 and the built-up land area to exceed 60% of the total area.
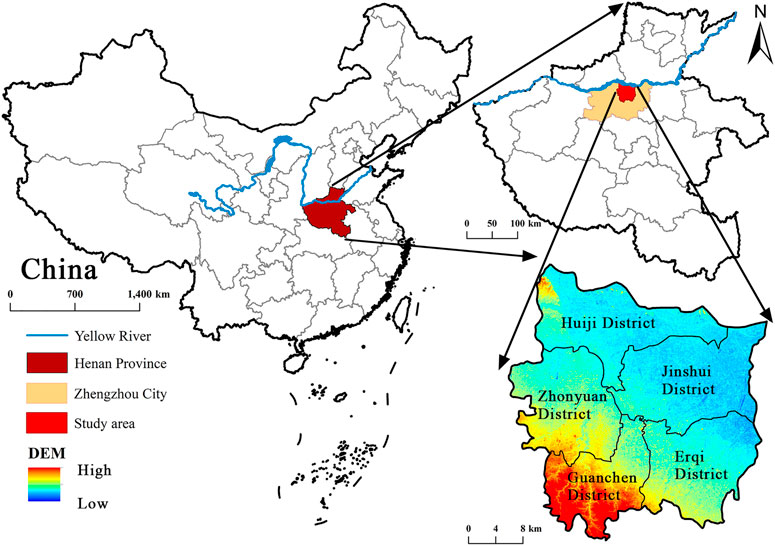
FIGURE 2. Map of study area.
3 Methods
3.1 PLUS Model
For steady development of the city, it is necessary to predict the type of land use in the city at specific periods of time in the future. The cellular automata (CA) model is typically used in simulation studies of urban land use changes (Aburas et al., 2017). However, the CA model has certain shortcomings with regard to the conversion rule mining strategy and the dynamic landscape change simulation strategy, considering the fuzzy and difficult operation of the model’s various conversion incentive mechanisms. The PLUS model was therefore used to simulate the land use type for the target year (Liang et al., 2021) (https://xgxy.cug.edu.cn/info/1031/3180. htm).
This study used the ENVI5.3 (Exelis Visual Information Solutions, EVIS. http://www.exelisvis.com/) supervised and classified satellite remote sensing image data for 2016 and 2021 and operated the interpretation results using the PLUS model. The main source of land use data for this study is the geospatial data cloud (http://www.gscloud.cn/), including Landsat 8 satellite remote sensing image data for 11 May 2016, and 22 March 2021; the pixel size was 30 m × 30 m. The development probability was set by analyzing the contribution of each driving factor to continue analyzing and studying differences in urban land use. The main formulas used in the PLUS model are as follows (1), (2):
where Pi,k1 represents the growth rate of land use type k in area i, and Dkt represents the impact of land use type k for the future time period t. r is a random value between 0 and 1, and μk is the new land use patch generation threshold for land use type k, while Ωi,kt represents the adjacent effect of i, which refers to the coverage ratio of the land use component of k in this neighborhood.
where Gct−1 is the difference C between the current availability of and future demand for land, for iteration t–1. Pi is the growth probability of land use type k at output unit i, δ is the attenuation factor for the decreasing threshold τ, and the range is [0,1]. r is a normal distribution random value with an average value of 1, and the range is [0,2]. One represents the decay progression. TMk,c is a transition matrix that defines whether the land use type k can be converted to type c. This step was used to simulate the approximate land-use conversion demand in the PLUS model and to set the threshold for the transfer between different land use types, and to identify new possibilities of land use changes to types that can expand freely under constrained conditions.
3.2 MSPA
The MSPA was used to analyze the differences in the morphological characteristics of urban GI. Data from the two phases for land use type were interpreted using the GuidosTB2.8 (https://forest.jrc.ec.europa.eu/en/) software. Adopting neighborhood diffusion level 8 at edge width 2, the landscape was divided into seven types, namely core, islet, perforation, edge, bridge, loop, and branch. The implications of each type are summarized in Table 1; the classification was based on the key elements identified for each area. Considering the entire study area and the locations of GI distribution, 140 core areas larger than 20 hm2 were selected as candidates for GI hubs.
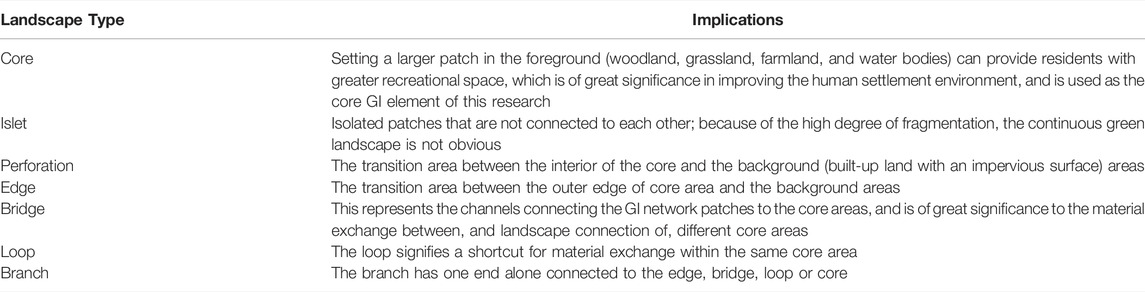
TABLE 1. Landscape type and meaning based on MSPA.
3.3 Landscape Connectivity Index Method
Landscape connectivity refers to the interrelationships between GI elements, and quantifies the strength of the connectivity between patches represented by the data. It is a key index that may be used for judging the connectivity between GI elements (Von Thaden et al., 2021). The 140 core areas were analyzed using the ArcGIS 10.2 (Environmental Systems Research Institute, ESRI. https://www.esri.com/en-us/home) platform and Conefor2.6 software (http://www.conefor.org/). The patch connectivity threshold chosen was 2,500 m, and the probability was set to 0.5. The integral index of connectivity (IIC), possibility index (PC), and patch importance value (dI) are expressed by Equations 3–5.
where n represents the number of landscape patches. ax and ay represent the areas of patches x and y, respectively, and p*xy is the maximum probability of patches x and y coalescing. The larger the value of PC, the higher is the connectivity among patches in the regional landscape, the value range being [0,1]. nlxy is the least-cost path between patches x and y, and AL is the value of the maximum landscape attribute, this is considered to be the total area of the study area. I is a landscape connectivity index, such as IIC or PC, and Iremove represents the value of the index after the patch is removed from the landscape. The larger the value of the IIC and PC, higher is the connectivity in the landscape. dI refers to the change in PC; the larger its value, the greater the importance of the landscape between the patches. Therefore, in this study, based on a numerical comparison of the dI (dPC) values of the 140 hubs, we selected 15 patches as urban GI hubs, choosing the patches with larger dI (dPC) values.3.4. MCR Model
Urban GI elements need to overcome multiple resistances between two hubs to achieve the functions of material exchange and biological migration. Therefore, the selection of a reasonable resistance surface can establish a channel connecting the two hubs. The MCR model was used to create the resistance surface. We used the cost distance and cost backtracking link tools in the distance analysis toolbox of ArcGIS 10.2 platform. In the process of creating a resistance surface as part of the UGI, it is necessary to build a comprehensive resistance surface by superimposing each resistance factor according to its weight (Zhang and Li, 2021). The equation is as follows (6).
where FN represents the resistance of the N grid. WM represents the proportion of the resistance value for the Mth resistance factor. ANM represents the resistance value displayed by the Nth raster data and the Mth resistance factor in the entire layer, and n represents the total number of resistance factors. The MCR model furnishes the sum of the minimum cost of breaking free of space resistance to move from one source to another, for the species in the hubs. The equation is as follows (7).
where MCR represents the minimum cumulative comprehensive resistance for the city’s GI hubs. DNM represents the unit distance from the hub unit M to the hub unit N, RN represents the resistance coefficient of the urban GI hub unit N, f is the positive correlation between the distance from any point in space to the GI hubs of all other cities and the landscape characteristics.
Based on previous research (Chen et al., 2020) and expert opinions, and considering the availability and rationality of the data in the study area, natural and human factors were selected as interference factors. The indicators and weights are shown in Table 2, which contains 11 factors namely elevation, slope, land use, landscape morphology, GDP per capita, distance to water, railways, highways, arterial roads, first-class roads, and build-up land. The digital elevation model (DEM) was derived from the Resource and Environmental Science and Data Center of the Chinese Academy of Sciences (https://www.resdc.cn/); the pixel size was 30 m × 30 m, and slope data were obtained through calculation and analysis based on the DEM. Vector data such as urban road data on highways, arterial roads, primary roads, and secondary roads as well as data on railways and the location of government buildings, were derived from Open Street Map (https://www.openstreetmap.org/), while the per capita GDP and population data were obtained from the Resource and Environmental Science and Data Center of the Chinese Academy of Sciences.
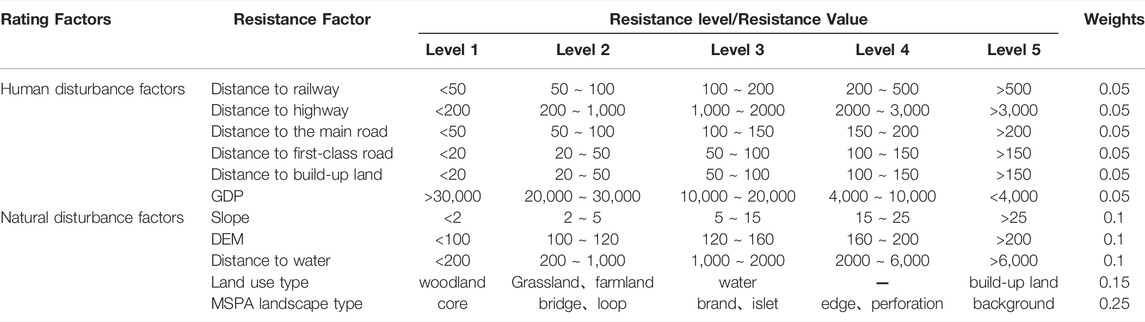
TABLE 2. Resistance surface.
3.5 Circuit Theory
This study aims to clarify the connectivity, importance, and diffusion probability of each hub. The Circuitscape 4.0 (https://circuitscape.org/) program was used to form the current. The circuit theory was first proposed by McRae (McRae and Kavanagh, 2011) and can be described as a theory that simulates the probability of species or gene flow spreading over a landscape area. As shown in Figure 3A, the entire research area is regarded as the conduction surface, and the information exchanged between the various hubs is regarded as electron movement, with a current of 1A connected to the circuit. A high value of current formed in the loop indicates low resistance, and is conducive to diffusion. Figure 3B shows the resistance surface formed by each resistance factor simulated as a landscape resistance surface. The darker the background color, the greater is the resistance. Landscape resistance surfaces with low resistance values can accomplish more frequent species migration and information exchange, and vice versa. In summary, the resistance surface of GI is established, with 15 patches selected for this study forming the GI hubs. The Linkage Mapper Tool was used to simulate the Least cost path (LCP) to obtain the corresponding corridor in the study area. The tool classifies the corridor based on the current between the GI elements; higher this value, narrower is the corridor at that location. The least cost path refers to the easiest path through each GI hubs under the influence of the resistance factor.
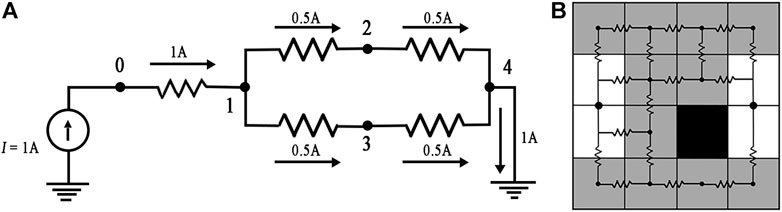
FIGURE 3. Circuitscape 4.0 Schematic diagram [(A) Landscape analog current, (B) Raster network].
3.6 Overlay and Recognition
The corridors furnished by the MCR model and circuit theory have their own advantages and can complement each other. The MCR model can simulate the LCP; the simulated path is the optimal path under the premise of a known landscape. The corridor simulated by circuit theory can identify the importance of the corridor and can show the probability of such parameters as free information, biology, material energy (Song and Qin, 2016), and so on in a randomly selected path. Therefore, we studied the corridors formed by the fusion of these two methods of path creation, superimposing the dominant areas among them, and observed the structural characteristics between the intersecting nodes and between the nodes and lines in the corridor graph. These nodes are used to form the traditional stepping stones of the GI elements, improve the landscape connectivity within the GI in the city, and utilize the advantages of the GI in the city to the maximum.
4 Result
4.1 GI Changes and Predictions
The change trends and spatial distribution of land use types were obtained through the supervision and classification of the two-period annual satellite remote sensing data (Figure 3). The planning of cities and regions is usually revised with the changes of the social development process, and the specific content of the planning can be adapted to the development of the city through continuous improvement. In China, a 5-year time period is usually used to judge the consistency and degree of completion of the policy direction. Therefore, we select the data of 5-year intervals for processing and use it to predict the land use situation in Zhengzhou in 2026. Due to the high utilization rate of land in the city and lack of clarity regarding unused land, used and unused land have not been considered separately. In recent years, as the width of the Yellow River has stabilized, and restrictions have been imposed on the drainage of the Yellow River, the area of water bodies within the urban area is unlikely to change much, so, the area of water bodies is considered constant. Figure 4 show that in 2016 and 2021, with a significant the outward expansion of built-up areas, the green space inside the central area of city continued to increase, However, the overall green space area has decreased, and the area covered by built-up land did not change significantly. The area of green space is expected to reduce by approximately 5%, from 37 793.3 hm2 in 2016 to 36 231.6 hm2 in 2021. It can be seen that as urban construction increased, GI such as green spaces and green corridors within the city have become denser, and its forms have become complex and diverse. For example, protection forests along rivers and roads have been restored to a good degree. The results are presented in Figure 4. By 2026, the area of green space is expected to increase, and the green area from parks, and the width of greenways will increase significantly.
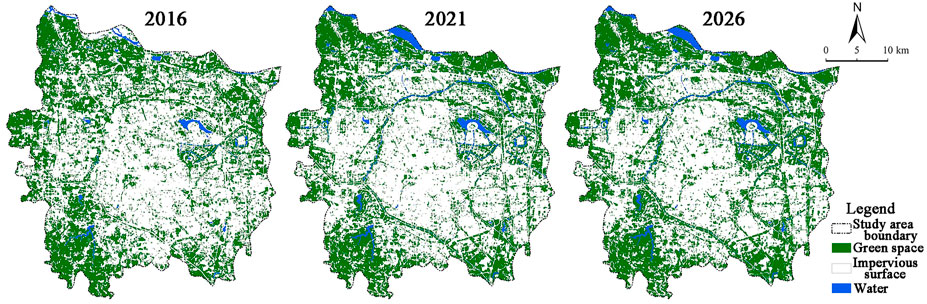
FIGURE 4. Current and predicted changes to distribution of green space in Zhengzhou City.
To forecast the situation in 2026, the PLUS model was first used to extract and analyze the data over 2 years. Through the land use expansion analysis strategy (LEAS) module, the contribution of various driving factors to the expansion of the areas of various land use types during the period was explored. Twelve socioeconomic, climatic and environmental data conditions were selected: DEM, GDP per capita, distance to government units, distance to high-speed railway stations, distance to the railway line, distance to the expressway, average population, distance to first-class road, distance to second-class road, distance to third-class road, distance to main road, and distance to water. The development probability of each type of land use, after restricting land use expansion, was obtained, and the results are shown in Table 3. The largest contributing factors to the development probability of forest land are the distance from water, distance from government units, and the distance from the railway line, while the largest contributing factors for grassland and farmland are the distance from third-class road, distance from water, distance from second-class road, and average population Distance to water, and distance to third-class road contribute the maximum to development probability of built-up land. According to the contribution value of the driving factor—used CA based on multi-type random patch seeds (CARS) module—combined with random seed generation and threshold decreasing rules, the development probability is used to simulate the generation of patches. As shown in Figure 5, the land use map for 2026 was simulated after accuracy verification.
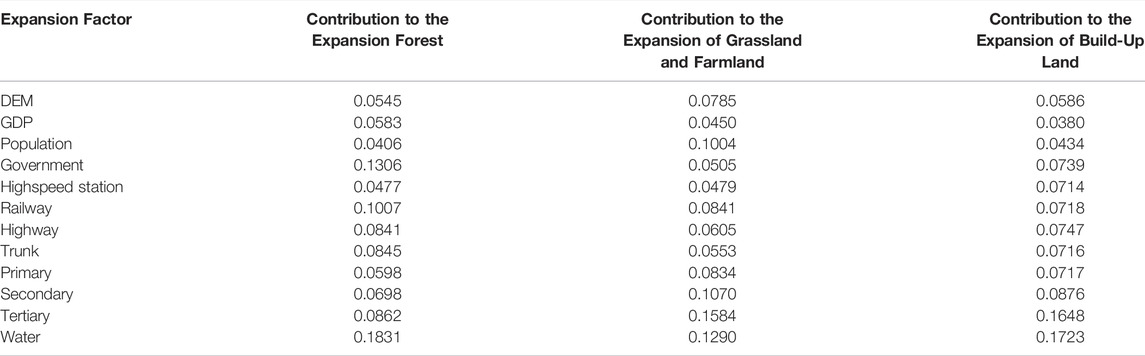
TABLE 3. Contribution of each driving factor.
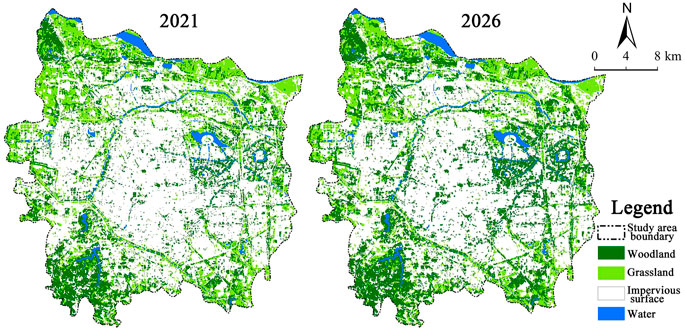
FIGURE 5. Land use types in Zhengzhou City–status quo and forecast for 2026.
4.2 Establishment of GI Network
This involves building corridors connecting the GI elements from the perspective of a GI network pattern combined with research on the types of GI landscape forms.
4.2.1 Distribution of GI Hubs
The MSPA method was used to determine the landscape morphology of GI hubs. While there is a large difference between forest land and other types of land in remote sensing satellite images, the band difference between farmland and grassland is small. To distinguish the spatial difference between UGI and gray infrastructure in the city, the combination of woodland, grassland, farmland, and water bodies was reclassified as foreground, with a pixel value of 2 (Rolf et al., 2020). Built-up land with an impervious surface was used as the background, with the pixel value set to 1. The results of mapping the landscape morphology type after reclassification of raster data are shown in Figure 6. The GI landscape foreground in Zhengzhou’s main urban area accounts for 42 994.17 hm2, which is 42.35% of the total study area. The core area measures 25 444.8 hm2, accounting for 59.18% of the foreground. The core areas are mostly distributed in the northwest, southwest, and northeast of the urban area, and are mostly covered by forests, farmlands and artificial waters. The background surrounded by the core area accounts for 1.39% of the total area, and the islets account for 1.15% of the foreground. It can be seen that the overall GI landscape in the main urban area of Zhengzhou was relatively good, while the GI distribution was relatively fragmented due to unplanned development and build-up in the area meant for GI in the core area of the original GI plan.
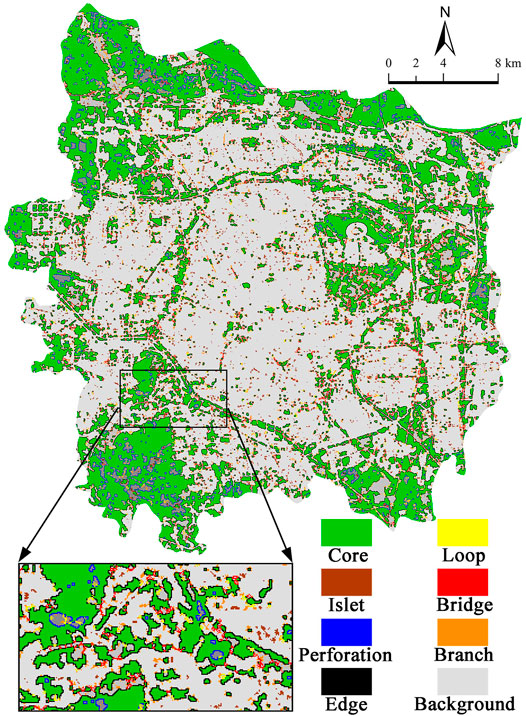
FIGURE 6. Map of GI landscape type based on MSPA.
The core area obtained via the MSPA method reflects the forms of the GI landscape, which is the key to studying the importance of and relationships among landscapes. As shown in Figure 7, the ArcGIS 10.2 platform was used to filter out 140 areas with foreground areas greater than 20 hm2 from the core area, to be classified as candidate hubs. Further, the Conefor 2.6 software was used to compare the landscape connectivity index among the 140 candidate hubs. The higher the landscape connectivity index, the higher the importance of the landscape. Based on this, 15 regions with dPC values greater than four were selected as GI hubs.
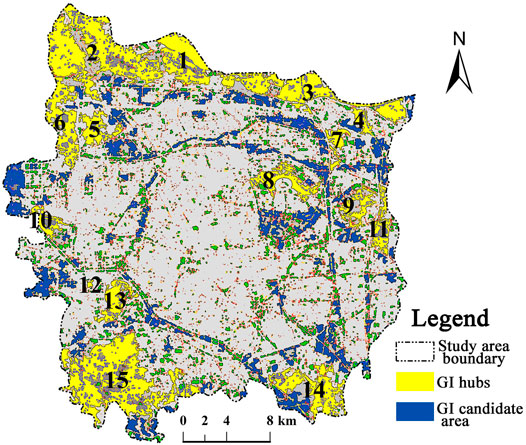
FIGURE 7. Selection of GI hubs based on landscape connectivity index method.
4.2.2 Characteristics of GI Corridor
Creation of a reasonable resistance surface is the basis for establishing the GI corridor. In this study, 11 resistance factors were selected (see Figures 8A–K). The superposition constitutes a comprehensive resistance surface (see Figure 8L) as an obstacle to communication among the 15 GI hubs. The resistance value refers to the probability that a GI may be planned and constructed, given the limiting factors. The lower the resistance value, the greater is the transmission and communication in this area. For example, the probability of planting trees along the sidewalk on both sides of the road is high, so the resistance values on both sides of the road are relatively low. Based on the establishment of the resistance surface, the LCP method of the MCR model is combined with the method of identifying the importance of the corridor in circuit theory. The intersection between the corridors identified by the two methods is the key to finding the most suitable corridor.
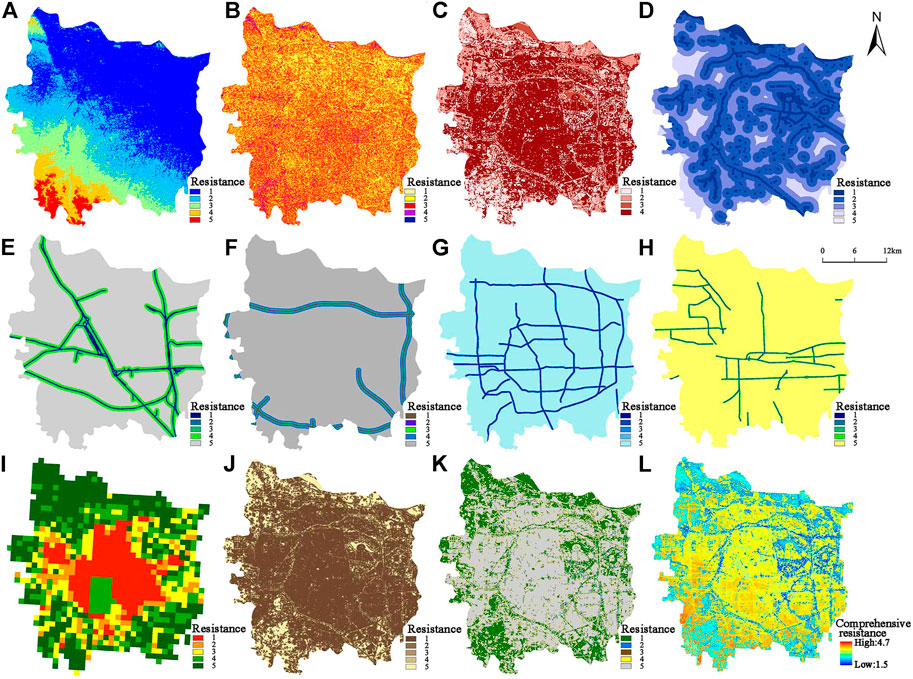
FIGURE 8. Resistance factor rating [(A): DEM, (B): slope, (C): land use type, (D): distance to water, (E): distance to railway, (F): distance to highway, (G): distance from main road, (H): distance to first-class road, (I): GDP per capita, (J): Distance to built-up land, (K): MSPA landscape type, (L): Comprehensive resistance level].
A path with a total distance of 553.334 km was obtained using the distance analysis tool in the ArcGIS 10.2 platform. From these paths, 35 first-level corridors representing the lowest cost of consumption were selected, with a length of 110.224 km. As shown in Figures 9A–C the others were regarded as secondary corridors, and included the remnants of Mangshan Mountain in the northwest of the main city, the green landscape along the Yellow River, the flood control belt, and the wetland park in the northeast. The first-level corridors are mainly distributed in the northern part of the main urban area, presenting a layout of local clusters that form a network. The network density was high, and its structure was complex and fragmented. However, the network of corridors in the south of the main urban area did not reach corridor-scale, the corridor distance was long, and there was a lack of protection for nodes in the middle. Especially in the southeast, it is difficult to establish contact between the central GI hub and other hubs; the communication between the landscape channels is not smooth and the potential for diffusion is low.
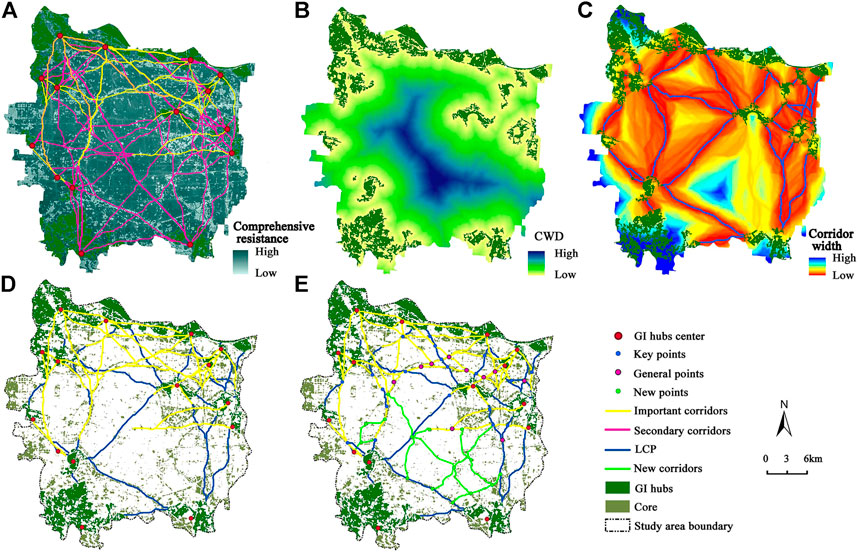
FIGURE 9. GI corridors and points design process [(A): Corridor map based on MCR model; (B): Cost weighted distance (CWD) diagram based on circuit theory; (C): least cost path (LCP) diagram based on circuit theory; (D): GI corridor diagram based on MCR model and circuit theory; (E): Graph showing target locations of green infrastructure].
The LCP formed by the MCR model can determine the approximate distribution of corridors, but the model cannot express well the importance of the corridors connecting the GI hubs. Therefore, the Circuitscape 4.0 software was used to simulate biological gene flow to determine the LCP. The current flowing through the landscape grid was calculated, and the diffusion resistance among the corridors in the landscapes was judged based on the current, thereby quantifying the importance of the corridors. Considering the geometric centers of the 15 GI hubs as the source points—which are the starting points for the outward diffusion from the GI hub—Linkage Mapper and Pinchpoint Mapper extension tools of the ArcGIS 10.2 platform were used to obtain the cost weighted distance (CWD) and LCP. As shown in Figure 8B, the resistance-cost-weighted CWD chart shows that the south-central area of Zhengzhou’s main urban area indicates high cost. This area is large, with fewer GI hubs, and therefore not conducive to the formation of a series of GI hubs. Based on cost distance weighting, the current density value between GI hubs was used as the corridor width. As shown in Figure 8C, a total of 24 LCPs with a total length of 188.479 km were formed, which embodies the probability of the GI hubs spreading outward to other GI elements. The lower the value of current density, the narrower the width of the corridor, and the more difficult it is for the GI to spread. The LCP calculated using the circuit theory is another convenient way to study the connections and communication among the GI hubs.
4.3 Design and Optimization of GI Network
In summary, the paths formed by the MCR model and circuit theory, which have more advantages and are shown in Figure 9D, are superimposed to provide a relatively complete map of the GI corridor, presenting a convenient channel for communication and diffusion among the 15 hubs. However, many patches in the core green area in the picture are not sufficiently correlated; therefore, they do not exert a good attraction and radiation influence on other green elements.
Therefore, following the plan to optimize, the existing corridors are divided into elements, corridors, and nodes. The GI hubs and their core areas are the basic elements, while the two LCPs are assigned as the corridors. They are named the first-level corridor and LCP. The intersection between the two LCPs is the key point, and the intersection of the corridors itself is a general node. Based on the original 15 centers, 31 points, and 59 corridors, the weaker GI elements were determined. As shown in Figure 9E, 15 target points and seven target corridors were established, with a total of 77.032 km of target corridors. Among these target points, some public parks, green spaces, and greenways have been included, such as the Zijin Mountain Park and Bishagang Park in the middle, Xiliu Lake Park, Sculpture Park, and Green Valley Park in the west, and Binhe Park and Butterfly Lake Park in the southeast. It also includes green vegetation on both sides of the river, such as plants and greenways along the South-to-North Water Transfer Project. At the same time, the establishment of the target corridor takes into account the ease of communication between different parts of the GI, the size of the original green space, noise pollution near the corridor, protection of nearby water bodies, and partitioning of the surrounding land for other uses.
The balanced layout of GI in the research area as proposed by this study, makes the GI network more complete. In the original layout of corridors and points, GI mainly included a main path along the Yellow River, along the road and along the canal, surrounding the main urban area of Zhengzhou, and the internal layout was not structured. After optimizing the GI layout, the different elements of the internal GI were connected by adding new points and corridors. A complete GI network was designed for the main urban area of Zhengzhou. This study provides a conceptual diagram of the GI network for the GI landscape, and proposes the concept of “a protection barrier, two lines, three loops, and more points.” As shown in Figure 10, “a protection barrier” was proposed due to the presence of the Yellow River in the north of Zhengzhou’s main urban area, which is a major natural feature. The terrain along the southern coast of the Yellow River displays undulation in the east-west direction, and the ground cover is basically green vegetation including woodland, parks, green areas of the Yellow River tourist area, farmland, etc. The proposal of “two lines” is due to the presence of two water lines in the main urban area, one along the two sides of the Jialu River, and the other along the two sides of the South-to-North Water Diversion Waterline; the Jialu River also has several tributaries in the main urban area. However, with the advancement of the urban development process, the waterways in the city have been ignored, and have lost their significance in making the landscape beautiful. Therefore, it is necessary to focus on maintaining a benign development of the original watercourse, cleaning up the river, clearing the garbage and silt in the river to prevent blockage, and introducing plants along the river on both sides. The “three loops” signifies the ring-shaped GI surrounding the urban area, spreading from the inside to the outside; as the ring becomes wider, the density of vegetation becomes lesser. According to remote sensing image data and field surveys, the foundation of the ring of the GI consists mainly of street trees, flower beds, and river shelter forests along both sides of key roads, while vegetation around public parks, intersections, key roads and bridges are more distributed. “More points” represents the discrete GI areas in the main urban area, and The closeness of their connections is inconsistent. Only on the basis of “more points” can the unique advantages of “one protection barrier, two lines and three loops” be utilized, so as to carry out the restoration, development and construction of green spaces. It includes protection of the quality of water in lakes, protection of mountain forests, protection of artificial turf in the city, development and construction of artificial waterways, and rational development and use of farmland. The goal is to improve the livability of the human settlements, enhance the ability of the city to withstand natural disasters, and maintain biodiversity.
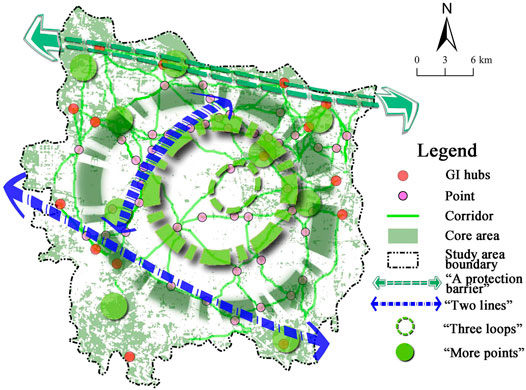
FIGURE 10. GI network in main urban area of Zhengzhou.
5 Discussion
This study is based on land use patterns for 2016 and 2021, and combines the PLUS, MSPA, MCR, and circuit theories. This model not only identifies and optimizes the original patches of GI and the corridors, but also optimizes the traditional urban green space system. It aims to identify green areas that are easily overlooked in urban development, and provide a theoretical reference for the promotion of landscape connectivity and livability of human settlements in the study area.
5.1 Land Use Prediction
The prediction of land use types in the main urban area of Zhengzhou is an important basis for analyzing the distribution characteristics of GI. In a previous study, Zhang (Zhang Y.-Z et al., 2021) used the future land use simulation (FLUS) model to predict the urban spatial structure of Beijing, and obtained the extent of urban expansion happening in Beijing. This research also uses predictive models to predict future land use structure, which indicates the direction of future changes in urban expansion and green space coverage. However, the PLUS model used in this study is different from models used in previous studies; the PLUS model supports high-precision simulation, and can produce more accurate and reliable landscape patterns. Different perspectives on the driving factors of land expansion can also provide decision makers with future land-use patterns for different development goals. Shade et al. (Shade and Kremer, 2019) used high-resolution land use/land cover change data combined with the CA-Markov model and machine learning to predict land use in Pennsylvania. Song (Song et al., 2021) used CLUE-s and the landscape ecological risk coupling method to study landscape ecological risk under different land use changes. This study uses Landsat 8 remote sensing image data. There are important rivers in the study area which is also a major producer of grains; owing to policy restrictions, areas near water bodies are set as non-convertible, while the conversion factor of farmland is also set to be small.
5.2 Corridor Supplement
In resistance surface selection and corridor design, most researchers use the MCR model (Lin et al., 2021) to simulate the corridor between targets. The use of a single model or method to design the corridors cannot fully reflect their significance. Therefore, this study chose circuit theory (Shi et al., 2018) to identify the importance of corridors. This theory is another version of the original theories of species migration and biological dissociation probability. At the same time, circuit theory includes many functions such as simulating the flow of people in the city, building the overall landscape, and exchanging biological information. It can therefore design urban GI corridors scientifically; target corridors and target nodes were designed on the basis of the corridors derived using circuit theory, adding seven target corridors, and 15 target nodes, with a total corridor length of 77.032 km. Wei (Wei et al., 2019) obtained the structure of “one core, three loops, seven lines” for the GI network in Pukou District, Nanjing, where a network pattern that includes a green protection barrier, two rivers, three ring-shaped green belts, and multiple green nodes was formed through an optimization plan. In the GI network structure, supplements to the nodes are added to improve the connection between the lines.
5.3 Choice of GI Hubs
Wang (Wang Y. et al., 2020) quantified the relationship between large-scale afforestation projects and spatial patterns of forests as a whole. It is seen that after new afforestation projects were undertaken, fragmentation in the core area of the forest has in fact increased. Most of the core areas covered in this study were covered by forests. With the increase in new GI projects, the number of isolated islands of forests in the core areas have increased. Therefore, it is necessary to build a new forest with the original forest space, avoiding fragmentation. In addition, the Yellow River flowing through the study area being an important river in China, it is very important to include the Yellow River and the forests on both banks of the river in the GI network (Din Dar et al., 2021). Liu’s (Liu et al., 2018) study also used satellite remote sensing interpretation methods and observed 25% green space coverage in the main urban area of Nanjing. As there are some mountains along the northwest and southwest edges of the main urban area of Zhengzhou, and the farmland has GI multifunctionality, farmland is included as an important GI in calculating green area coverage. Thus, the green area covers 35%, and the result is reasonable.
5.4 Interpretation and Prospects
The change in GI in the main urban area of Zhengzhou City over 5 years was analyzed based on the distribution of GI in the area. This study helps to better understand the spatiotemporal variations in Zhengzhou’s GI construction, and has important implications for urban GI planning and policy formulation as outlined below:1) The scale and layout of urban GI are critical to the establishment of and connectivity within the entire landscape network. 2) From the perspective of urban green space planning and policy formulation, green spaces within cities have become more fragmented, and large-scale GI tend to be standardized and planned. Therefore, green patches in nodes with weak GI should be expanded within reasonable limits to increase the connectivity of GI. 3) Water systems are crucial in the development of UGI; therefore, it is necessary to clear the water bodies, undertaking dredging and removal of obstacles in the various connected water systems, and increase the greenery around them. This research method is not only of great significance to GI in Zhengzhou, but also can be practiced in other cities. Zhengzhou is one of the rapidly rising cities in China in recent years. Under the current development situation in China, there are many cities with the same rapid urbanization, population surge, green space demand and unreasonable GI layout as Zhengzhou. The geographical location of this city is in the central region of China, and there are many cities that have similar topography and landforms to compare. In the long-term social development process, there are still many cities in China and even the world that can use the method of this study to design GI networks from the perspective of natural conditions and policies. For the model method, the model used in this study is highly inclusive, and the availability of multiple indicators is strong, which is suitable for research in various regions.
The PLUS model is used to predict land use, which can determine the contribution of each influencing factor to the land categories, and identify influencing factors that contribute more. However, no matter how good a land use prediction model is, it cannot predict the distribution of land use types absolutely and accurately, and the determination of the conversion factor involves some amount of subjectivity. However, the circuit theory ignores some details of the actual biological flow characteristics in the process of forming corridors. For example, biological migration may be affected by human factors such as roads and built-up areas. To further study the UGI in terms of index selection, it is possible to adopt such methods as referring to medical records of large and medium-sized hospitals in the city, and use records of diseases resulting from air pollution as the research factor. It is also possible to consider the influence of green roofs on urban surface temperature, and the corresponding heat island effect, and study how green roofs can be incorporated into the GI networks. Changes in local precipitation and surface runoff can also be considered, and it can be observed whether areas with large surface runoff values are areas with significant waterlogging. The gray-green infrastructure layout can be coordinated based on the above factors. In addition, GI can be classified in detail to understand the role of various forms of GI in urban landscape networks.
6 Conclusion
In the context of rapid urbanization, the design and optimization of a GI network for the main urban area of Zhengzhou using PLUS, MSPA, landscape connectivity tools, MCR, and circuit theories, that provides a development direction for urban GI, is attempted in this study. The results of our analyses show that built-up area is increasing, the current scale of GI is denser than it was before, and green spaces have been restored to a good degree. Optimizing the landscape pattern of green spaces and water bodies is crucial for the formation of GI networks. Zhengzhou’s main urban area continues to expand outward, and the GI area does not fluctuate significantly; however, the distribution of GI in the main urban area is still relatively fragmented. Due to environmental, terrain-related, and socioeconomic factors, GI elements are mostly distributed along the edges of the main urban area. Studies have shown that optimizing the GI network, prioritizing the protection of existing GI elements, and proper planning and design of new GI elements have a key impact on the sustainable development of urban built-up areas. The results of the study share the same thinking with the ideas proposed in The Zhengzhou Forest Ecological Construction Plan (2020–2035). Among them, it is pointed out that the green space in Zhengzhou is unevenly distributed. The forests in the west of Zhengzhou account for more than 60% of Zhengzhou, and the green infrastructure in the main urban area in the central area has a lot of room for development in the future. And unanimously, the establishment of ecological barriers along the Yellow River and the establishment of shelter forests along the South-to-North Water Diversion route are the key points. This research can provide theoretical basis and scientific reference for Zhengzhou’s green infrastructure planning in terms of policy. Also provide some different thinking, It is also important to ensure participation of the people while planning GI because human well-being is our ultimate goal. This requires managers and developers to take comprehensive measures to rationally plan the design and construction of GI, with the GI layout and population density as the leading factors to consider.
Data Availability Statement
The raw data supporting the conclusions of this article will be made available by the authors, without undue reservation.
Author Contributions
Conceptualization, PZ and JZ; methodology, JZ; software, TR; validation, PZ, YL and DY; formal analysis, YZ and TR; investigation, YL; resources, HZ; data curation, YZ and HZ; writing—original draft preparation, JZ; writing—review and editing, PZ and YS; visualization, ZL; supervision, PZ; project administration, PZ; funding acquisition, PZ. All authors have read and agreed to the published version of the manuscript.
Funding
This research was funded by the National Natural Science Foundation of China, grant number 41601175, 41801362, the Young Backbone Teachers Foundation from Henan Province, grant number 2018GGJS019, 2020GGJS114, the Program for Innovative Research Talent in University of Henan Province, grant number 20HASTIT017, 2021 Project of Henan Soft Science Funds, grant number 212400410250 and 2020 Philosophy and Social Science Planning Project of Henan Province, grant number 2020BJJ020.
Conflict of Interest
The authors declare that the research was conducted in the absence of any commercial or financial relationships that could be construed as a potential conflict of interest.
Acknowledgments
We also thank the Geographical Science Data Center of The Greater Bay Area for providing the relevant data in this study.
Publisher’s Note
All claims expressed in this article are solely those of the authors and do not necessarily represent those of their affiliated organizations, or those of the publisher, the editors and the reviewers. Any product that may be evaluated in this article, or claim that may be made by its manufacturer, is not guaranteed or endorsed by the publisher.
References
Aburas, M. M., Ho, Y. M., Ramli, M. F., and Ash’aari, Z. H. (2017). Improving the Capability of an Integrated CA-Markov Model to Simulate Spatio-Temporal Urban Growth Trends Using an Analytical Hierarchy Process and Frequency Ratio. Int. J. Appl. Earth Observation Geoinformation 59, 65–78. doi:10.1016/j.jag.2017.03.006
Ampomah, R., Hosseiny, H., Stoolmiller, S., Fares, M., Smith, V., and Wadzuk, B. (2021). Three-Dimensional Numerical Modeling of Urban Green Stormwater Infrastructure Curb Inlets. J. Irrig. Drain Eng. 147, 04021039. doi:10.1061/(ASCE)IR.1943-4774.0001589
Anderson, V., and Gough, W. A. (2020). Evaluating the Potential of Nature-Based Solutions to Reduce Ozone, Nitrogen Dioxide, and Carbon Dioxide through a Multi-type green Infrastructure Study in Ontario, Canada. City Environ. Interactions 6, 100043. doi:10.1016/j.cacint.2020.100043
Anderson, V., and Gough, W. A. (2021). Harnessing the Four Horsemen of Climate Change: A Framework for Deep Resilience, Decarbonization, and Planetary Health in Ontario, Canada. Sustainability 13, 379. doi:10.3390/SU13010379
Bukvareva, E., Zamolodchikov, D., Kraev, G., Grunewald, K., and Narykov, A. (2017). Supplied, Demanded and Consumed Ecosystem Services: Prospects for National Assessment in Russia. Ecol. Indicators 78, 351–360. doi:10.1016/j.ecolind.2017.03.034
Chen, C., Shi, L., Lu, Y., Yang, S., and Liu, S. (2020). The Optimization of Urban Ecological Network Planning Based on the Minimum Cumulative Resistance Model and Granularity Reverse Method: A Case Study of Haikou, China. IEEE Access 8, 43592–43605. doi:10.1109/access.2020.2976548
Cheng-xiang, M., and Jun-de, W. (2021). Ecological Optimization of Spatial Patterns of Water Conservancy Landscape in Qilian Mountains Based on Land Processes: a Case Study of Zamu River Basin in Upper Shiyang River Basin. IOP Conf. Ser. Earth Environ. Sci. 676, 012005. doi:10.1088/1755-1315/676/1/012005
Cho, S.-H., Poudyal, N., and Lambert, D. M. (2008). Estimating Spatially Varying Effects of Urban Growth Boundaries on Land Development and Land Value. Land Use Policy 25, 320–329. doi:10.1016/j.landusepol.2007.08.004
Chung, M. G., Frank, K. A., Pokhrel, Y., Dietz, T., and Liu, J. (2021). Natural Infrastructure in Sustaining Global Urban Freshwater Ecosystem Services. Nat. Sustain. 4, 1068–1075. doi:10.1038/s41893-021-00786-4
Dennis, M., Barlow, D., Cavan, G., Cook, P., Gilchrist, A., Handley, J., et al. (2018). Mapping Urban green Infrastructure: A Novel Landscape-Based Approach to Incorporating Land Use and Land Cover in the Mapping of Human-Dominated Systems. Land 7, 17. doi:10.3390/land7010017
Din Dar, M. U., Shah, A. I., Bhat, S. A., Kumar, R., Huisingh, D., and Kaur, R. (2021). Blue Green Infrastructure as a Tool for Sustainable Urban Development. J. Clean. Prod. 318, 128474. doi:10.1016/J.JCLEPRO.2021.128474
Fattorini, S. (2014). Urban Biodiversity Hotspots Are Not Related to the Structure of green Spaces: a Case Study of Tenebrionid Beetles from Rome, Italy. Urban Ecosyst. 17, 1033–1045. doi:10.1007/s11252-014-0375-y
Fňukalová, E., Zýka, V., and Romportl, D. (2021). The Network of Green Infrastructure Based on Ecosystem Services Supply in Central Europe. Land 10, 592. doi:10.3390/LAND10060592
Fu, Y., Shi, X., He, J., Yuan, Y., and Qu, L. (2020). Identification and Optimization Strategy of County Ecological Security Pattern: A Case Study in the Loess Plateau, China. Ecol. Indicators 112, 106030. doi:10.1016/j.ecolind.2019.106030
Hostetler, M., Allen, W., and Meurk, C. (2011). Conserving Urban Biodiversity? Creating green Infrastructure Is Only the First Step. Landscape Urban Plann. 100, 369–371. doi:10.1016/j.landurbplan.2011.01.011
Ignatieva, M., Stewart, G. H., and Meurk, C. (2011). Planning and Design of Ecological Networks in Urban Areas. Landscape Ecol. Eng. 7, 17–25. doi:10.1007/s11355-010-0143-y
Jin, X., Wei, L., Wang, Y., and Lu, Y. (2021). Construction of Ecological Security Pattern Based on the Importance of Ecosystem Service Functions and Ecological Sensitivity Assessment: a Case Study in Fengxian County of Jiangsu Province, China. Environ. Dev. Sustain. 23, 563–590. doi:10.1007/s10668-020-00596-2
Lee, D., and Oh, K. (2019). The Green Infrastructure Assessment System (GIAS) and its Applications for Urban Development and Management. Sustainability 11, 3798. doi:10.3390/su11143798
Lee, H., Song, K., Kim, G., and Chon, J. (2021). Flood-adaptive green Infrastructure Planning for Urban Resilience. Landscape Ecol. Eng. 17, 427–437. doi:10.1007/s11355-021-00458-7
Li, L., and Bergen, J. M. (2018). Green Infrastructure for Sustainable Urban Water Management: Practices of Five Forerunner Cities. Cities 74, 126–133. doi:10.1016/j.cities.2017.11.013
Li, Y.-Y., Zhang, Y.-Z., Jiang, Z.-Y., Guo, C.-X., Zhao, M.-Y., Yang, Z.-G., et al. (2021). Integrating Morphological Spatial Pattern Analysis and the Minimal Cumulative Resistance Model to Optimize Urban Ecological Networks: a Case Study in Shenzhen City, China. Ecol. Process. 10, 1–15. doi:10.1186/S13717-021-00332-2
Liang, X., Guan, Q., Clarke, K. C., Liu, S., Wang, B., and Yao, Y. (2021). Understanding the Drivers of Sustainable Land Expansion Using a Patch-Generating Land Use Simulation (PLUS) Model: A Case Study in Wuhan, China. Comput. Environ. Urban Syst. 85, 101569. doi:10.1016/j.compenvurbsys.2020.101569
Lin, Q., Eladawy, A., Sha, J., Li, X., Wang, J., Kurbanov, E., et al. (2021). Remotely Sensed Ecological Protection Redline and Security Pattern Construction: A Comparative Analysis of Pingtan (China) and Durban (South Africa). Remote Sensing 13, 2865. doi:10.3390/RS13152865
Liquete, C., Kleeschulte, S., Dige, G., Maes, J., Grizzetti, B., Olah, B., et al. (2015). Mapping green Infrastructure Based on Ecosystem Services and Ecological Networks: A Pan-European Case Study. Environ. Sci. Pol. 54, 268–280. doi:10.1016/j.envsci.2015.07.009
Liu, J., Yin, H., Kong, F., and Li, M. (2018). Structure Optimization of Circuit Theory-Based green Infrastructure in Nanjing, China. Acta Eco Sin 38, 4363–4372. doi:10.5846/stxb201801250199
Liu, Z., Xu, C., Xu, T., Jia, H., Zhang, X., Chen, Z., et al. (2021). Integrating Socioecological Indexes in Multiobjective Intelligent Optimization of green-grey Coupled Infrastructures. Resour. Conservation Recycling 174, 105801. doi:10.1016/j.resconrec.2021.105801
Lorilla, R. S., Kalogirou, S., Poirazidis, K., and Kefalas, G. (2019). Identifying Spatial Mismatches between the Supply and Demand of Ecosystem Services to Achieve a Sustainable Management Regime in the Ionian Islands (Western Greece). Land Use Policy 88, 104171. doi:10.1016/j.landusepol.2019.104171
Marando, F., Salvatori, E., Sebastiani, A., Fusaro, L., and Manes, F. (2019). Regulating Ecosystem Services and Green Infrastructure: Assessment of Urban Heat Island Effect Mitigation in the Municipality of Rome, Italy. Ecol. Model. 392, 92–102. doi:10.1016/j.ecolmodel.2018.11.011
McRae, B. H., and Kavanagh, D. M. (2011). Linkage Mapper Connectivity Analysis Software. The Nature Conservancy, Seattle WA. Available at: http://www.circuitscape.org/linkagemapper.
Meerow, S. (2020). The Politics of Multifunctional green Infrastructure Planning in New York City. Cities 100, 102621. doi:10.1016/j.cities.2020.102621
Monteiro, R., Ferreira, J., and Antunes, P. (2020). Green Infrastructure Planning Principles: An Integrated Literature Review. Land 9, 525. doi:10.3390/land9120525
Nesshöver, C., Assmuth, T., Irvine, K. N., Rusch, G. M., Waylen, K. A., Delbaere, B., et al. (2017). The Science, Policy and Practice of Nature-Based Solutions: An Interdisciplinary Perspective. Sci. Total Environ. 579, 1215–1227. doi:10.1016/j.scitotenv.2016.11.106
Pearce, H., Levine, J. G., Cai, X., and MacKenzie, A. R. (2021). Introducing the Green Infrastructure for Roadside Air Quality (GI4RAQ) Platform: Estimating Site-specific Changes in the Dispersion of Vehicular Pollution Close to Source. Forests 12, 769. doi:10.3390/F12060769
President’s Council on Sustainable Development (PCSD) (1999). Towards a Sustainable America: Advancing prosperity, Opportunity, and a Healthy Environment for the 21st century. Washington: The Council.
Ramyar, R., Ackerman, A., and Johnston, D. M. (2021). Adapting Cities for Climate Change through Urban green Infrastructure Planning. Cities 117, 103316. doi:10.1016/j.landurbplan.2005.02.00210.1016/j.cities.2021.103316
Rodriguez, M., Fu, G., Butler, D., Yuan, Z., and Sharma, K. (2021). Exploring the Spatial Impact of Green Infrastructure on Urban Drainage Resilience. Water 13, 1789. doi:10.3390/W13131789
Rolf, W., Diehl, K., Zasada, I., and Wiggering, H. (2020). Integrating farmland in Urban green Infrastructure Planning. An Evidence Synthesis for Informed Policymaking. Land Use Policy 99, 104823. doi:10.1016/j.landusepol.2020.104823
Shade, C., and Kremer, P. (2019). Predicting Land Use Changes in Philadelphia Following Green Infrastructure Policies. Land 8, 28. doi:10.3390/land8020028
Shi, X. M., Qin, M. Z., Li, B., Li, C. Y., and Song, L. L. (2018). Research on the Green Infrastructure Network in the Zhengzhou-Kaifeng Metropolitan Area Based on MSPA and Circuit Theory. J. Henan Univ. (Natural Science) 48, 631–638.
Song, K., Choi, Y.-E., Han, H.-J., and Chon, J. (2021). Adaptation and Transformation Planning for Resilient Social-Ecological System in Coastal Wetland Using Spatial-Temporal Simulation. Sci. Total Environ. 789, 148007. doi:10.1016/J.SCITOTENV.2021.148007
Song, L. l., and Qin, M. Z. (2016). Ecological Corridor and its Importance Identification Based on Integrated Circuit Theory. J. Appl. Ecol. 27, 3344–3352.
Spatari, S., Yu, Z., and Montalto, F. A. (2011). Life Cycle Implications of Urban green Infrastructure. Environ. Pollut. 159, 2174–2179. doi:10.1016/j.envpol.2011.01.015
Tayyebi, A., Pijanowski, B. C., and Tayyebi, A. H. (2011). An Urban Growth Boundary Model Using Neural Networks, GIS and Radial Parameterization: An Application to Tehran, Iran. Landscape Urban Plann. 100, 35–44. doi:10.1016/j.landurbplan.2010.10.007
Torres, M. N., Fontecha, J. E., Walteros, J. L., Zhu, Z., Ahmed, Z., Rodríguez, J. P., et al. (2021). City-scale Optimal Location Planning of Green Infrastructure Using Piece-wise Linear Interpolation and Exact Optimization Methods. J. Hydrol. 601, 126540. doi:10.1016/J.JHYDROL.2021.126540
Valenzuela-Levi, N., and Abreu, M. (2021). The Income equality Dividend in 'green' Infrastructure: Evidence from the Transport and Waste Sectors in the OECD. J. Clean. Prod. 315, 128088. doi:10.1016/j.jclepro.2021.128088
Von Thaden, J., Badillo-Montaño, R., Lira-Noriega, A., García-Ramírez, A., Benítez, G., Equihua, M., et al. (2021). Contributions of green Spaces and Isolated Trees to Landscape Connectivity in an Urban Landscape. Urban For. Urban Green. 64, 127277. doi:10.1016/J.UFUG.2021.127277
Wang, J., and Banzhaf, E. (2018). Towards a Better Understanding of Green Infrastructure: A Critical Review. Ecol. Indicators 85, 758–772. doi:10.1016/j.ecolind.2017.09.018
Wang, K., Li, Z., Zhang, J., Wu, X., Jia, M., and Wu, L. (2020). Built-up Land Expansion and its Impacts on Optimizing green Infrastructure Networks in a Resource-dependent City. Sustain. Cities Soc. 55, 102026. doi:10.1016/j.scs.2020.102026
Wang, Y., Brandt, M., Zhao, M., Xing, K., Wang, L., Tong, X., et al. (2020). Do afforestation Projects Increase Core Forests? Evidence from the Chinese Loess Plateau. Ecol. Indicators 117, 106558. doi:10.1016/j.ecolind.2020.106558
Wang, Y., and Pan, J. (2019). Establishment of Ecological Security Patterns Based on Ecosystem Services Value Reconstruction in an Arid Inland basin: A Case Study of the Ganzhou District, Zhangye City, Gansu Province. Acta Eco Sin 39, 3455–3467. doi:10.5846/stxb201803130495
Weber, T., Sloan, A., and Wolf, J. (2006). Maryland's Green Infrastructure Assessment: Development of a Comprehensive Approach to Land Conservation. Landscape Urban Plann. 77, 94–110. doi:10.1016/j.landurbplan.2005.02.002
Wei, J. X., Song, Y., Wang, Y. C., and Xiang, W. N. (2019). Urban green Infrastructure Building for Sustainability in Areas of Rapid Urbanization Based on Evaluating Spatial Priority: a Case Study of Pukou in China. Acta Ecologica Sinica 39, 1178–1188. doi:10.5846/stxb201808241802
Woodruff, S., Tran, T., Lee, J., Wilkins, C., Newman, G., Ndubisi, F., et al. (2021). Green Infrastructure in Comprehensive Plans in Coastal Texas. J. Environ. Plann. Manage. 64, 1578–1598. doi:10.1080/09640568.2020.1835618
Yu, K. J. (1999). Landescape Ecological Security Patterns in Biological Conservation. Acta Ecologica Sinica 1, 10–17. doi:10.1016/S0169-2046(96)00331-3
Zhang, J., Feng, X., Shi, W., Cui, J., Peng, J., Lei, L., et al. (2021). Health Promoting green Infrastructure Associated with green Space Visitation. Urban For. Urban Green. 64, 127237. doi:10.1016/J.UFUG.2021.127237
Zhang, P., Yang, D., Qin, M., and Jing, W. (2020). Spatial Heterogeneity Analysis and Driving Forces Exploring of Built-Up Land Development Intensity in Chinese Prefecture-Level Cities and Implications for Future Urban Land Intensive Use. Land Use Policy 99, 104958. doi:10.1016/j.landusepol.2020.104958
Zhang, W., and Li, B. (2021). Research on an Analytical Framework for Urban Spatial Structural and Functional Optimisation: A Case Study of Beijing City, China. Land 10, 86. doi:10.3390/land10010086
Zhang, Y.-Z., Jiang, Z.-Y., Li, Y.-Y., Yang, Z.-G., Wang, X.-H., and Li, X.-B. (2021). Construction and Optimization of an Urban Ecological Security Pattern Based on Habitat Quality Assessment and the Minimum Cumulative Resistance Model in Shenzhen City, China. Forests 12, 847. doi:10.3390/F12070847
Zhao, W., Wang, Y., Chen, D., Wang, L., and Tang, X. (2021). Exploring the Influencing Factors of the Recreational Utilization and Evaluation of Urban Ecological Protection Green Belts for Urban Renewal: A Case Study in Shanghai. Ijerph 18, 10244. doi:10.3390/IJERPH181910244
Keywords: circuit theory, green infrastructure, MSPA, plus model, zhengzhou city
Citation: Zhang J, Zhu H, Zhang P, Song Y, Zhang Y, Li Y, Rong T, Liu Z, Yang D and Lou Y (2022) Construction of GI Network Based on MSPA and PLUS Model in the Main Urban Area of Zhengzhou: A Case Study. Front. Environ. Sci. 10:878656. doi: 10.3389/fenvs.2022.878656
Received: 18 February 2022; Accepted: 25 March 2022;
Published: 14 April 2022.
Edited by:
Wenlong Jing, Guangzhou Institute of Geography, ChinaReviewed by:
Chengpeng Lu, Lanzhou University, ChinaZheye Wang, Rice University, United States
Feng Wang, Nanjing University of Information Science and Technology, China
Copyright © 2022 Zhang, Zhu, Zhang, Song, Zhang, Li, Rong, Liu, Yang and Lou. This is an open-access article distributed under the terms of the Creative Commons Attribution License (CC BY). The use, distribution or reproduction in other forums is permitted, provided the original author(s) and the copyright owner(s) are credited and that the original publication in this journal is cited, in accordance with accepted academic practice. No use, distribution or reproduction is permitted which does not comply with these terms.
*Correspondence: Pengyan Zhang, cGVuZ3lhbnpoQGhlbnUuZWR1LmNu