 Anqi Wang
 Xiaoning Xie
 Xiaodong Liu
 Zhengguo Shi
94% of researchers rate our articles as excellent or good
Learn more about the work of our research integrity team to safeguard the quality of each article we publish.
Find out more
ORIGINAL RESEARCH article
Front. Environ. Sci., 03 May 2022
Sec. Atmosphere and Climate
Volume 10 - 2022 | https://doi.org/10.3389/fenvs.2022.877874
This article is part of the Research TopicAtmospheric Dust: How it affects climate, environment and life on Earth?View all 7 articles
The direct radiative effect (DRE) of west Asian dust aerosols can modulate the Indian summer monsoon (ISM) through by directly heating the atmosphere (fast response) and cooling the sea surface (slow response). However, the relative contributions between fast and slow responses are unclear. In this study, the Community Atmospheric Model 4 (CAM4) with an updated Bulk Aerosol Model (BAM) has been used to identify these different responses of the ISM to the dust DRE. Our results show that the DRE of the west Asian deserts (WAD) dust significantly enhances ISM during the early monsoon season (May–June) but weakens it during the late monsoon (July–August). Further analysis shows that the fast response heats the lower troposphere over WAD and the adjacent ocean, strengthens the southwesterly flows over the Arabian Sea, and thus increases the precipitation in central and eastern India (CEI), which dominates the ISM enhancement during the early monsoon season. During the late monsoon season, the slow response cools the sea surface temperature (SST) and the lower troposphere over Arabian Sea, creates the easterly flows to inhibit the moisture transport and decreases the CEI precipitation, ultimately weakening the ISM. Additionally, observational evidence of the trends in the WAD and CEI precipitation from 1980 to 2015 supports our simulated results. Our results suggest that the dust DRE induced ocean feedback plays a non-negligible role in modulating cross-seasonal climate effect of dust aerosols.
Dust aerosols can modulate the atmospheric energy budget by absorbing and scattering short-wave and long-wave radiation (Tegen and Lacis, 1996; Miller and Tegen, 1998; Huang et al., 2014; Chen et al., 2017; Jin et al., 2021) and affect global and regional climate, especially various monsoon systems (Miller and Tegen, 1998; Lau and Kim, 2007; Lau et al., 2009; Chen et al., 2014; Gu et al., 2016; Xie et al., 2018; Shi et al., 2019; Jin et al., 2021).
Dust aerosol sources are widely distributed worldwide especially in the Northern Hemisphere, which mainly locate in north Africa, east Asia, west Asia (middle East), central Asia and south Asia (Prospero et al., 2002; Shao et al., 2011). The dust emissions in Asia account for about 50% of those all over the world (Zhang et al., 1997; Ginoux et al., 2001). As a representative dust source of the low-latitudes Asia, (Sun et al., 2020), the west Asian deserts (WAD) mainly include the Iran-Syria deserts and Saudi Arabia deserts. The values of the WAD dust emissions are high from May to September and the annual emissions can reach 43–496 Mt per year (Liu et al., 2013). Dust layers are observed at ∼ 5–7 km height in Saudi Arabian region especially in summer, which can get transported to the Indian summer monsoon (ISM) region (Parajuli et al., 2020). Dust aerosols over WAD can modulate local thermal equilibrium and further affecting the local precipitation (Islam and Almazroui, 2012; Bangalath and Stenchikov, 2015). Furthermore, the northwesterly “Shamal” winds transport the large amount of dust to the Arabian Sea, and then influence the regional climate far from the WAD (Jin et al., 2014; Ramaswamy et al., 2017). Many studies have shown that dust aerosols from WAD can influence the strength of ISM using the observational and the simulated results (Miller et al., 2004; Rahul et al., 2008; Vinoj et al., 2014; Solmon et al., 2015; Jin et al., 2018).
Dust DRE can warm the atmosphere and deserts, cool the sea surface and the land having low surface albedo (Miller et al., 2014). In order to clarify the climate effects of dust DRE, we divided the total climate responses induced by the DRE into two parts as in Hansen et al. (2005), one effect is heating the atmosphere identified as the fast response and the other is cooling the sea surface temperature (SST) as the slow response. Most studies concentrated on the fast response of atmosphere induced by the dust DRE (Rahul et al., 2008; Vinoj et al., 2014; Solmon et al., 2015). For instance, Rahul et al. (2008) identified the active and inactive years of sandstorms over the WAD which matched well with the stronger and weaker years of ISM using satellite datasets, and found that the increasing precipitation in India was due to the positive fast response of outgoing long-wave radiation induced by the dust DRE. Vinoj et al. (2014) pointed out that the atmosphere in the lower troposphere over the Arabian Sea is heated by the dust aerosols through the fast response to the dust DRE, which strengthens the atmospheric circulation and brings more moisture from the ocean, and then enhances the precipitation over the northern India about a week later. Solmon et al. (2015) confirmed the same positive correlation as Vinoj et al. (2014) over the southern India, on a decadal.
Other studies have shown that dust aerosols transported from the desert sources can influence the energy balance and the sea surface temperature, thus affect the monsoon systems which we called the slow response of monsoon to the dust DRE (Miller and Tegen, 1998; Yue et al., 2011; Jin et al., 2018). The effect of dust to the ISM precipitation may depend on the extent to which the dust DRE affects the thermal state of the ocean, and those are not exactly the same in experiments with prescribed and calculated SST (Miller and Tegen, 1998; Miller et al., 2004). Meanwhile, SST anomalies in the Arabian Sea can lead to subsequent changes in the ISM precipitation (Rao and Goswami, 1988).
As mentioned above, the responses of ISM to the WAD dust include the fast response of atmospheric temperature due to radiation and slow response of SST feedback caused by the dust aerosols. Both the fast and slow responses of the ISM to the DRE of dust aerosols are important, but their relative contributions are unclear. In this paper, the fast and slow responses of ISM to the DRE of west Asian dust aerosols are studied and compared by the ocean-atmosphere coupled model (CM) and uncoupled model (UM). The next section describes the datasets and model we have used in this study. Section 3 is the evaluation of simulations, which contains the distribution, the seasonal variations of dust emission and dust optical depth (DOD), the 850 hPa wind, 850 hPa geopotential height and precipitation. Section 4 analyses the fast and slow responses of ISM to the dust DRE. The discussion and conclusion are in Section 5 and Section 6, respectively. Our study does not consider other aerosols except dust.
The Modern-Era Retrospective Analysis for Research and Applications, version 2 (MERRA-2) was developed by NASA’s Global Models and Assimilation Office (GMAO) aiming to establish an integrated Earth system analysis datasets coupled with four segments: atmosphere, ocean, land and chemistry (Randles et al., 2017). MERRA-2 assimilates the meteorological observations and the aerosol data retrieved by satellite through a global data assimilation system. The atmospheric module of this dataset contains common meteorological factors: wind, temperature, pressure, humidity, etc. The aerosol module contains the dust emissions, dust mass mixing ratios and DOD (Gelaro et al., 2017). Although Xian et al. (2020) claimed that there exists a large uncertainty in the reanalysis datasets, MERRA-2 have been proved as a reliable product including both aerosol characteristics and meteorological factors (Jordan et al., 2020; Sun et al., 2020). Here, the MERRA-2 datasets are used to verify the simulated results in this paper. The monthly mean dust emission, DOD, 850 hPa wind and geopotential height from 1980 to 2015 with a horizontal resolution of 0.625° × 0.5° are used to evaluate the simulated results. All the data can be downloaded online at: https://disc.gsfc.nasa.gov/.
The Global Precipitation Climatology Project (GPCP) is an international research project with a monthly average data set of global precipitation (Huffman, 1997). The datasets combine the microwave data from the low-orbit satellites, the infrared data from the geosynchronous orbit satellites, and the rain gauge observations from the ground stations. The high precision microwave low-earth orbit datasets are used to calibrate and adjust the orbit satellite infrared remote sensing data, and the gridded datasets based on the rain gauge ground observation data are used to further adjust the rainfall distributions (Adler et al., 2003). The monthly averaged precipitation datasets with a horizontal resolution of 2.5° × 2.5° from 1980 to 2015 are used to validate the simulated model results for models in our study (https://climatedataguide.ucar.edu/climate-data/gpcp-monthly-global-precipitation-climatology-project).
The Community Atmospheric Model version 4 with a Bulk Aerosol Model (CAM4-BAM) consists of the following components: dust emission, dust transport, wet and dry depositions and radiation scheme (Neale et al., 2010). The released version has been described by Neale et al. (2010). The Dust Entrainment and Deposition (DEAD) model (Zender et al., 2003) has been used as the dust emission scheme in CAM4-BAM. The size distribution is fixed in four bins based on a log-normal distribution (Zender et al., 2003). This model has been successfully applied within the Community Earth System Model (CESM) in simulating dust emission over the Middle East and North Africa (MENA) region (Parajuli et al., 2016). The soil texture data set is from the International Geosphere-Biosphere Programme (IGBP, Bonan et al., 2002). The vertical dust mass flux has been calculated according to the source modes and wind speed (Schulz et al., 1998). The dust transport processes come from the CAM4 tracer advection scheme (Neale et al., 2010) and the dry deposition processes include the gravitational and turbulent parts (Zender et al., 2003). The wet deposition processes consist of the in- and below-cloud precipitation based on a prescribed dust solubility of 0.15 (Neale et al., 2010). For the optical parameters, CAM4 uses the OPAC scheme (optical properties of aerosols and clouds) with the short-wave radiation (Hess et al., 1998). The radiation scheme is from the CAM radiative transfer (CAMRT) scheme (Collins et al., 2006). However, there are some issues in the released version of CAM4-BAM in simulating the dust cycle (Albani et al., 2014), hence, we used the updated version with the following improvements in this study from Albani et al. (2014): 1) The soil erodibility maps have been optimized based on the observation. 2) The emitted dust size distribution is “scale invariant” in four bins (the ratio: 0.011, 0.087, 0.277 and 0.625), which is based on the brittle fragmentation theory (Kok, 2011). 3) The shortwave and longwave optical parameters are from Yoshioka et al. (2007) which has been found closer to the observations. 4) The dust solubility in the wet deposition process is increased from 0.15 to 0.3 based on the observation. The simulating data is at 1.25° × 0.9° horizontal resolution and the model simulations are conducted at 26 vertical levels.
The dust parameters (such as the dust size distribution, dust surface mass concentration and the deposition have been extensively evaluated by Albani et al. (2014). Regarding the radiative effect, a lot of comparison work has been done by Neale et al. (2013) based on the Clouds and the Earth’s Radiant Energy System (CERES) datasets, in situ datasets and reanalysis datasets. CAM4-BAM has been widely used to reveal the aerosol-climate interactions (Albani et al., 2014; Xie et al., 2018; Shi et al., 2019).
In order to investigate the roles of the fast and slow responses of ISM to the DRE of dust aerosols respectively, two sets of experiments were carried out: Coupled model with dust radiative feedback (CMD) and coupled model without dust radiative feedback (CMN). Similarly, two additional sets of simulations, uncoupled model with dust radiative feedback (UMD) and uncoupled model without dust radiative feedback (UMN), were also conducted. Therefore, the difference CMD-CMN can represent the total climate response, the difference UMD-UMN represents the fast response, and finally the difference (CMD-CMN)-(UMD-UMN) reflects the slow response induced by the dust DRE. For the CM experiments, both the CMD and CMN experiments were simulated for 60 years with the SST calculated and interacted synchronously with the atmosphere, and the simulated results for the last 30 years are taken for the analysis, allowing the first 30 years for spin up. For the UM experiments, we take the results of the last 15 years of the 21-years simulations with the prescribed-fixed SST getting from the monthly mean corresponding to 2000 AD.
According to the MERRA-2 reanalysis results, the highest dust emission flux (Figure 1A) and the DOD (Figure 1D) values in the WAD are mainly concentrated in the Nafud desert, the Dahna desert and the Rubal Khali desert in the Arabian Peninsula. The spatial distribution of the dust emission flux simulated by the CMD (Figure 1B) and the UMD (Figure 1C) corresponds well with the MERRA-2 reanalysis results in the most parts of the WAD, however, they underestimate in Oman, the United Arab Emirates, and overestimate in Iran. The DOD shows larger value over the Arabian Peninsula, the northern Arabian Sea and the Iranian Plateau (Figure 1D), which are also reproduced by the CMD and UMD simulated results. Both the coupled and uncoupled models can mainly capture the spatial distributions of the annual averaged dust emission flux and dust optical depth (DOD) in the WAD as compared to the MERRA-2 reanalysis. As for the annual averaged dust emission flux values and the DOD values, it shows that the simulations from the CMD are closer to MERRA-2 reanalysis comparing with those from the UMD simulations (Table 1).
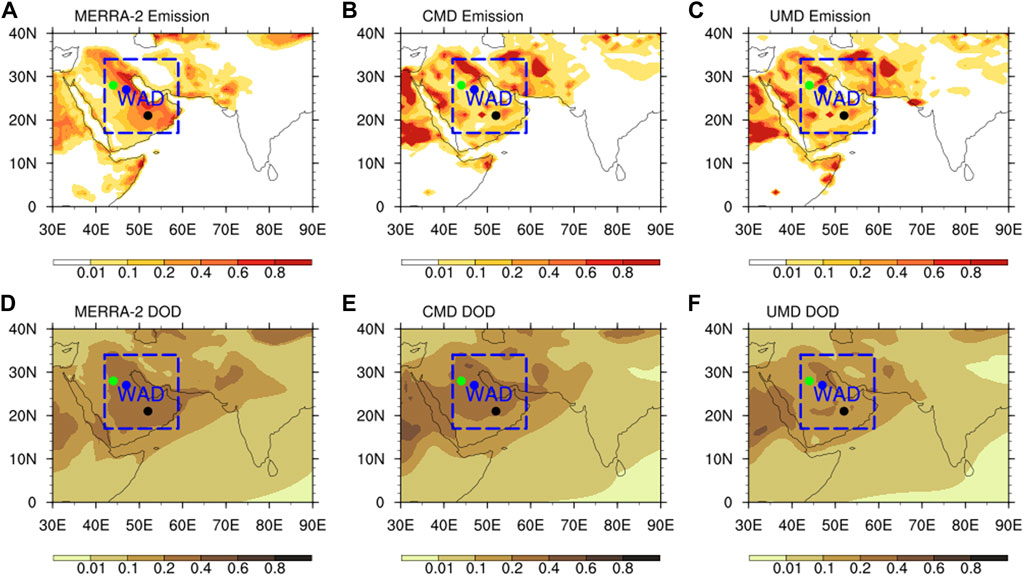
FIGURE 1. Distributions of annual averaged dust emission flux (A–C, unit: 10−8 kg/m2/s) and DOD (D–F) from the MERRA-2 reanalysis (A,D), the CMD simulation (B,E) and the UMD simulation (C,F). The dashed boxes represent the regions of west Asian deserts (WAD, 17–34°N, 42–59°E). The green dots represent the Nafud desert, the blue dots represent the Dahna desert and the black dots represent the Rubal Khali desert.

TABLE 1. Annual averaged dust emission flux (unit: 10−8 kg/m2/s) and DOD based on the MERRA-2 reanalysis and simulated results in the WAD.
Our model not only captures the spatial distributions of dust emission flux and the DOD, but also their annual cycle characteristics (Figure 2). The annual cycle characteristics of the dust emission flux and DOD regional averaged values in the WAD simulated by the CMD and UMD are basically consistent with the reanalysis results. For the dust emission flux (Figure 2A), the MERRA-2 reanalysis shows the higher values are in summer and then in spring (blue line). Both the CMD (red line) and UMD (black line) can capture these features, but the values in summer are higher than those in the reanalysis results. Meanwhile, the highest DOD values occurred from May to August (Figure 2B) and the simulated variations are in agreement with the reanalysis results. We conclude that both the CMD and UMD simulated results can well represent the spatio-temporal features of the WAD dust.
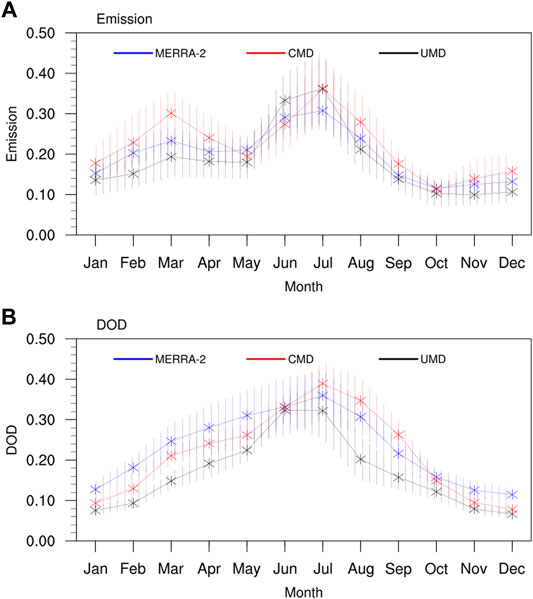
FIGURE 2. Annual cycles of climatological averaged dust emission flux (A) and DOD (B) of west Asian deserts (WAD) obtained by MERRA-2 and simulations. The blue, red, and black lines represent MERRA-2, the CMD simulation, and the UMD simulation, respectively. Vertical lines represent the standard deviation of DOD.
Dust aerosols in the WAD can be transported to the remote Arabian Sea and then influence the precipitation in India through the radiative effects (Jin et al., 2014; Vinoj et al., 2014). Such long-range transport is possible because high dust concentration is observed at 5–7 km height in the Saudi Arabian region in MPL-LIDAR data (Parajuli et al., 2020). In this study, we mention the CEI region (Figure 3A) as the main study domain, which is highly correlated with the precipitation trend at the central grid (23°N, 83°E) of ISM region following Jin et al. (2014), Vinoj et al. (2014). The annual cycle of the regional averaged precipitation showed that the precipitation values begin to increase in May and June compared with those in winter and then peak in July and August (Figure 3B), which we called the early monsoon season and the late monsoon season, respectively (Lau and Kim, 2007).
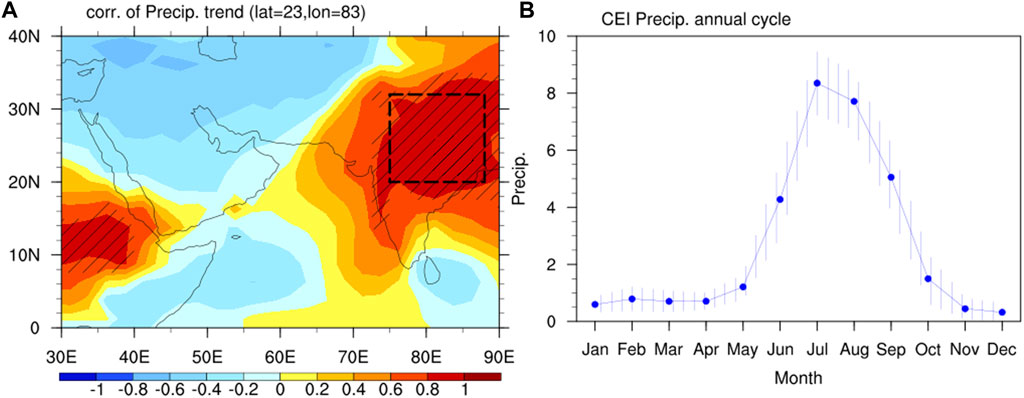
FIGURE 3. (A) The one-point correlation pattern of precipitation at the central grid of the ISM region (23°N, 83°E) with that at all other points and (B) the annual cycle of CEI regional averaged precipitation (mm/day). The hatched black lines in Figure 3A represent the value with statistically significant at 0.01 level. The box with black dashed lines in Figure 3A indicates the CEI (20–32°N, 75–88°E).
To evaluate the simulated results of ISM, the spatial distributions of 850 hPa circulation and precipitation from MERRA-2 reanalysis (850 hPa circulation), GPCP (precipitation), CMD simulations, UMD simulations and their differences in the early monsoon and late monsoon seasons are compared in Figures 4, 5. It is shown that the southwesterly flows over the Arabian Sea have emerged in the early monsoon season (Figure 4A), carrying large amounts of water vapor which favors the precipitation increase (Figure 5A). In the late monsoon season, both the Somali jet (Figure 4F) and precipitation in CEI (Figure 5F) are stronger than these in the early monsoon season, which are at their most powerful time in a year. Both the coupled and uncoupled models can capture the temporal and spatial distribution characteristics of the circulation except the CMD results in early monsoon which have underestimated the 850 hPa winds and overestimated the geopotential height (Figure 4D). Regarding precipitation, both the CMD and UMD simulations could performance well in the CEI region but overestimated the values in the south of Tibetan Plateau (Figure 5), this might be due to weaknesses in cumulus convective parameterization in the module because of the complex topography (Sun et al., 2020). For a quantitative evaluation of our simulations, we calculate the regional mean differences, the spatial correlation coefficient (R) and the root mean square error (RMSE) of the observed data [MERRA-2 for 850 hPa winds and geopotential height (GPH), GPCP for precipitation] and the simulated data for 850 hPa U, V, GPH and precipitation over the region in Figures 4, 5 (0–40°N, 30–90°E) during the early and late monsoon seasons (Table 2). The quantitative results also show that, CMD and UMD can both capture the meteorological fields in these two seasons.
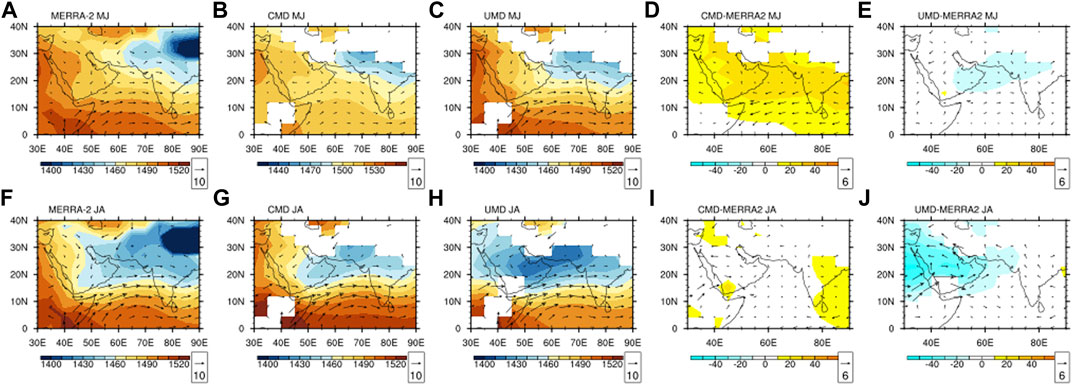
FIGURE 4. The averaged 850 hPa wind (vectors, unit: m/s), geopotential height (shaded, unit: gpm) and their differences from MERRA-2 and simulations in the early monsoon May–June; (A–E) and late monsoon July–August; (F–J) seasons in MERRA-2 reanalysis (A,D), CMD simulations (D,E), UMD simulations (C,F), CMD−MERRA-2 (D,I) and UMD−MERRA-2 (F,J).
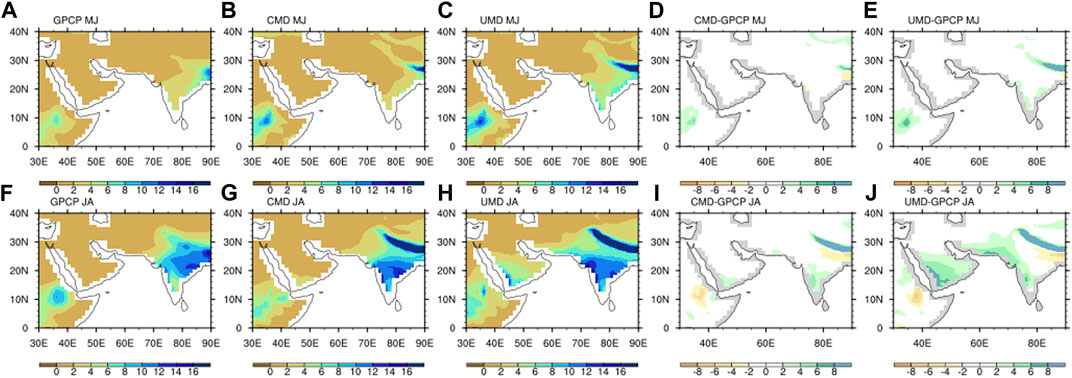
FIGURE 5. The averaged precipitation (unit: mm/day) from GPCP, simulations and their differences in the early monsoon May–June; (A–E) and late monsoon July–August; (F–J) seasons in GPCP (A,D), CMD simulations (D,E), UMD simulations (C,F), CMD−GPCP (D,I) and UMD−GPCP (F,J).
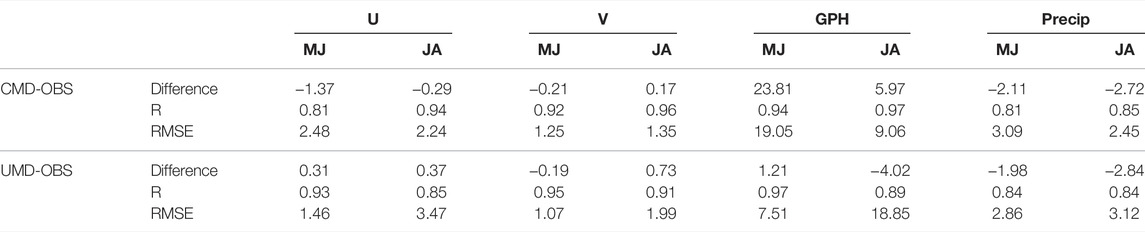
TABLE 2. The mean differences, R (spatial pattern correlation) and RMSE (root mean squared error) between observed (OBS: MERRA−2/GPCP) and simulated results (CMD and UMD) for 850 hPa U, V, GPH and precipitation of the region in Figures 4, 5 (0–40°N, 30–90°E) during the early and the late monsoon season, respectively.
Previous studies show that the DRE of the WAD dust aerosols can influence the ISM (Jin et al., 2014; Vinoj et al., 2014). From the (CMD–CMN) monthly precipitation anomalies (the total response), the averaged values in CEI induced by dust DRE show an increase during the early monsoon season (Figure 6D, mean value: 0.15 mm/day) but a decrease during the late monsoon season (Figure 7D, mean value: −0.25 mm/day). Since the opposite precipitation anomalies in these two periods, the relevant analyses are carried out respectively for the early monsoon (May–June) and late monsoon (July–August) seasons in the following.
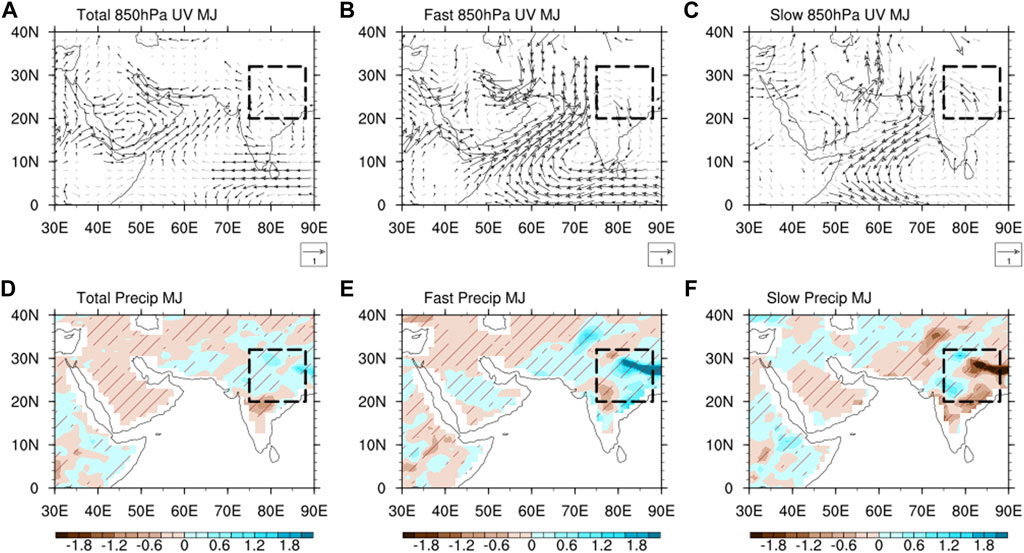
FIGURE 6. The total [(A,D), CMD−CMN], fast [(B,E), UMD−UMN] and slow [(C,F) (CMD−CMN)−(UMD−UMN)] responses of 850 hPa horizontal wind (vectors, A–C, m/s) and precipitation (shaded, D–F, mm/day) to the dust DRE in the early monsoon (May–June). Black (grey) arrows represent the wind vector differences statistically significant (insignificant) at the 0.1 significance level. Brown lines represent the precipitation differences statistically significant at the 0.1 level. Dash boxes indicate the CEI regions same as in Figure 3.
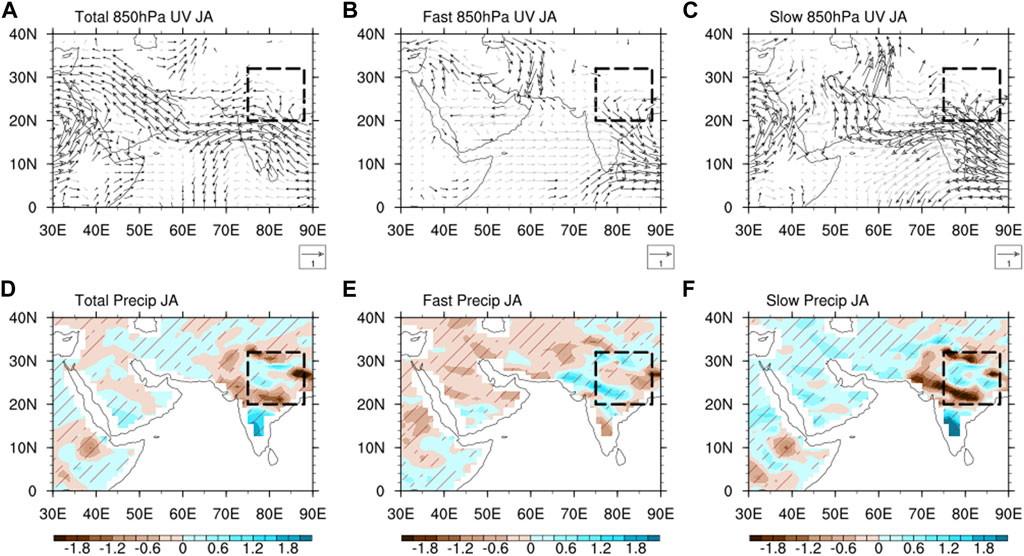
FIGURE 7. The total [(A,D), CMD−CMN], fast [(B,E), UMD−UMN] and slow [(C,F) (CMD−CMN)−(UMD−UMN)] responses of 850 hPa horizontal wind (vectors, A–C, m/s) and precipitation (shaded, D–F, mm/day) to the dust DRE in the late monsoon (July–August). Black (grey) arrows represent the wind vector differences statistically significant (insignificant) at the 0.1 significance level. Brown lines represent the precipitation differences statistically significant at the 0.1 level. Dash boxes indicate the CEI regions same as in Figure 3.
Figure 6 shows the 850 hPa wind and precipitation anomalies from the total response, the fast response and the slow response to the dust DRE during the early monsoon season. As a typical representative branch of ISM, the southwesterly flows over the Arabian Sea occur in the early monsoon season (Figure 4A) and strengthen in the lower troposphere over the Arabian Sea (Figure 6A), which bring more water vapor to the Indian subcontinent from the Arabian Sea and lead to the increase of the precipitation in CEI (Figure 6D) from the total response to the dust DRE. The fast response of 850 hPa wind to the dust DRE (Figure 6B) strengthens over the Arabian Sea, and the precipitation increases in the CEI (Figure 6E), which are similar to the total response. However, the slow response of the ISM shows opposite changes, the northeasterly flows strengthen (Figure 6C) to inhibit the water transport to the Indian Subcontinent from Arabian Sea and decrease the precipitation in CEI (Figure 6F). In summary, although the fast and slow response work in opposite direction by increasing and decreasing the rainfall, respectively, the total response results in increased precipitation over the region of interest in the early monsoon season.
Figure 7 shows results similar to those in Figure 6 but for the late monsoon season. The total response of the 850 hPa wind induced by the dust DRE shows the strong easterly flows over Arabian Sea (Figure 7A), inhibits the water transport to the land and decreases the precipitation in CEI (Figure 7D). The fast response of the precipitation slightly increases (Figure 7E) in CEI (Mean value of precipitation anomalies in the CEI: 0.08 mm/day) because of the strengthened westerly flows (Figure 7B) over the Arabian Sea. However, the slow response of 850 hPa wind (Figure 7C) to the dust DRE shows the strengthened easterly flows over the Arabian Sea and the decreases on precipitation in CEI (Figure 7F), which are similar to these of the total response. These results show that the dust DRE weakens the ISM in the late monsoon season, which is dominated by the slow response.
The fast response of ISM to the dust DRE dominates the enhancement of southwesterly flows over the Arabian Sea and precipitation in the CEI during the early monsoon season, and the involved physical mechanisms are revealed in this section.
The radiative forcing differences induced by the dust DRE can contribute to the temperature changes at the surface and in the atmosphere, thereby affecting the local atmospheric circulation (Miller and Tegen, 1998; Xie et al., 2018). Figure 8 shows the differences of short-wave, long-wave and net radiative forcing at the surface, the top of the atmosphere (TOA) and in the atmosphere induced by the dust DRE in the early monsoon season. The net radiative forcing is the sum of long-wave and short-wave radiative forcing, and the radiative forcing at the TOA is the competition results between those at the surface and in the atmosphere. The dust DRE short-wave forcing decreases at the surface (Figure 8A) but increases in the atmosphere (Figure 8C), which results in a positive anomaly at the TOA (Figure 8B). The variation of net radiative forcing induced by the dust DRE at surface (Figure 8G), at TOA (Figure 8H) and in the atmosphere (Figure 8I) are consistent with those of shortwave radiative forcing over the WAD. As for the long-wave radiative forcing, a positive change at the TOA (Figure 8E) induced by the dust DRE over the WAD contributes to the positive surface changes (Figure 8D) and the negative atmospheric changes (Figure 8F).
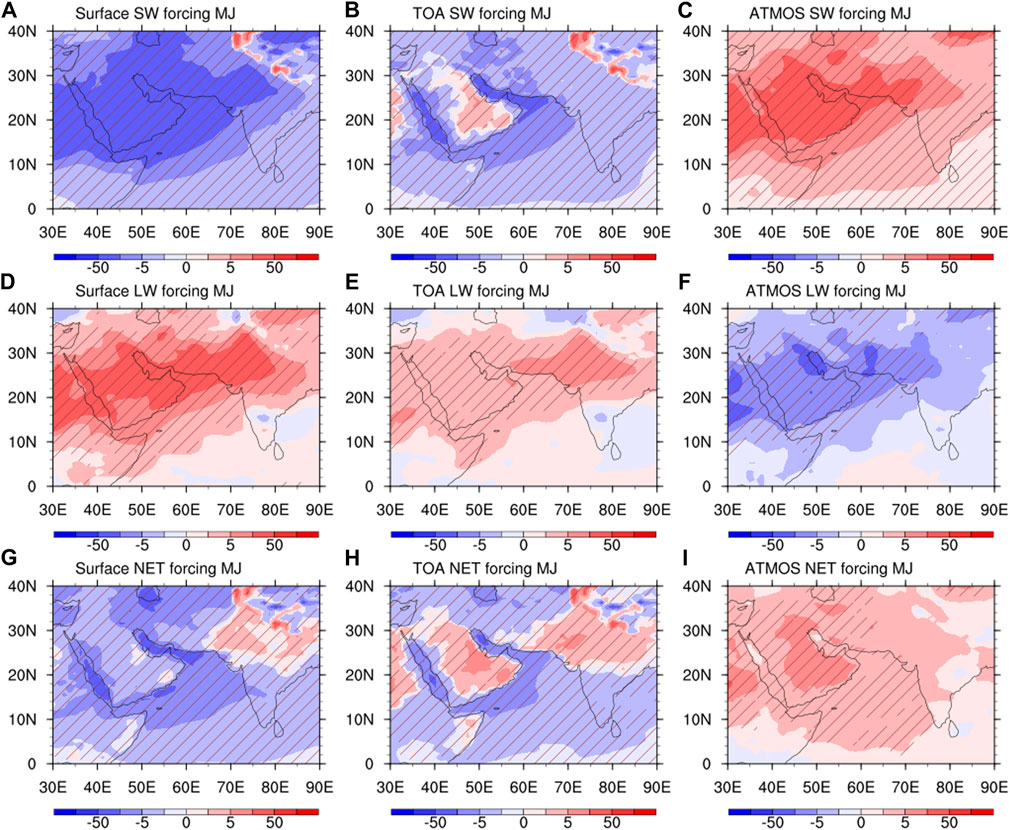
FIGURE 8. The dust DRE induced changes (UMD–UMN) in clear–sky short-wave [SW, (A–C)], long-wave [LW, (D–F)] and net [SW + LW, (G–I)] radiative forcing (W/m2) at the surface (A,D,G), at the TOA (B,E,H) and in the atmosphere (C,F,I) in the early monsoon. Brown lines represent the values statistically significant at the 0.1 level.
The surface temperature anomalies induced by the dust DRE in regions at the low-latitudes such as the WAD and the Arabian Sea correspond well with the changes in the net radiative forcing at the TOA (Figure 8H). The significant warming occurs over the WAD in the total responses of temperature at surface (Figure 9A) and at 850 hPa (Figure 9D) in response to the dust DRE, which corresponding well with the low-pressure anomalies at 850 hPa over the Arabian Peninsula (Figure 9G). As stated in the above Section 4.1, the enhancement of the ISM induced by the dust DRE is mainly caused by the fast response during the early monsoon season. Because of this, the fast response (Figures 9B,E,H) of the temperature at surface, at 850 hPa and the geopotential height anomalies are almost identical to the total response to the dust DRE over the WAD. The low-pressure anomalies over the WAD and its surroundings at 850 hPa (Figure 9H) strengthen the southwesterly flows over the Arabian Sea in Figure 7B. On the contrary, the slow response of the 850 hPa geopotential height (Figure 9I) to the dust DRE shows the high-pressure anomalies because of the widespread cooling of the Arabian Sea at 850 hPa (Figure 9F) and at the sea surface (Figure 9C). Hence, the reduced SST over the Arabian Sea weakens the ISM during the early monsoon season.
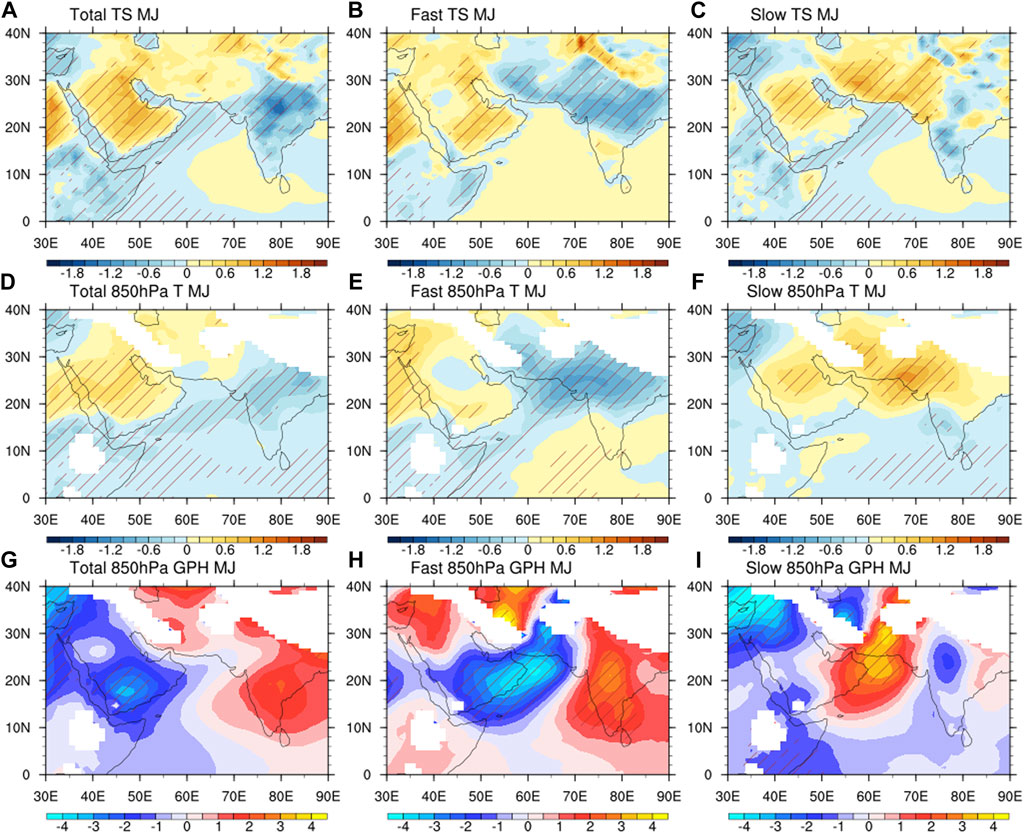
FIGURE 9. The total [(A,D,G), CMD−CMN], fast [(B,E,H), UMD−UMN] and slow [(C,F,I) (CMD−CMN)−(UMD−UMN)] responses of temperature at the surface (A–C;k) and 850 hPa (D–F,K) as well as those of geopotential height (G–I, gpm) at 850 hPa to the dust DRE during the early monsoon season (May–June). Brown lines represent the values statistically significant at the 0.1 level.
As for the water vapor transport, both the total (Figure 10A) and fast (Figure 10B) responses of 850 hPa moisture flux to the dust DRE enhances over the Arabian Sea, which contributes to the transport of water vapor from the ocean to the CEI. Meanwhile, the total and fast responses of specific humidity at 850 hPa to the dust DRE increase in the CEI (Figures 10D,E), which are in agreement with the precipitation changes induced by the dust DRE during the early monsoon season. But the slow responses of the 850 hPa moisture flux (Figure 10C) and specific humidity (Figure 10F) are both weakened.
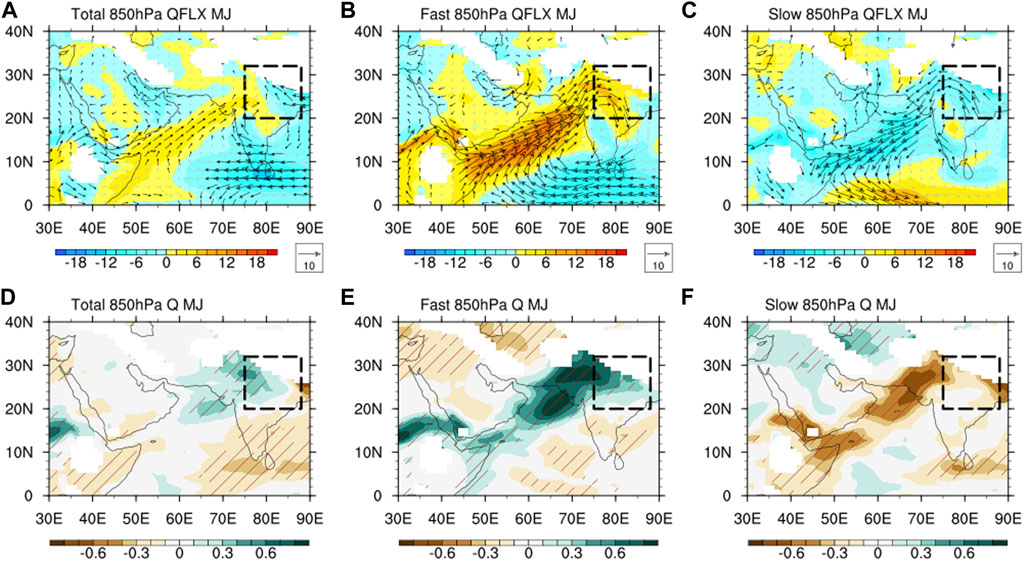
FIGURE 10. The total [(A,D), CMD−CMN], fast [(B,E), UMD−UMN] and slow [(C,F) (CMD−CMN)−(UMD−UMN)] responses of moisture flux [A–C; g/(hPa m s)] and specific humidity (D–F, g/kg) at 850 hPa to the dust DRE during the early monsoon season (May–June). Black (grey) arrows represent the moisture flux vector differences statistically significant (insignificant) at the 0.1 level. Brown lines represent the values statistically significant at the 0.1 level.
During the early monsoon season, the dust aerosols heat the atmosphere in the lower troposphere over the Arabian Peninsula through the dust DRE, resulting in the formation of the thermal low-pressure, which strengthen the southwesterly winds over the Arabian Sea, and thus strengthen the water vapor transport from the ocean to the land, leading to the increasing precipitation in the CEI. These results are mainly caused by the fast response processes, while the slow response processes weaken the ISM and inhibit the precipitation in CEI.
The dust DRE weakens the ISM through cooling the Arabian Sea (slow response processes) in the late monsoon season as shown in Section 4.1 (Figure 7). In the early monsoon season, the strengthened southwesterly winds over the Arabian Sea reinforce the ISM, and further transport more dust aerosols from the WAD to the ocean (Jin et al., 2014). According to the annual cycle of dust emissions in the WAD, it showed that the emissions in the late monsoon season are higher than those in the early monsoon season (Figure 2A). Meanwhile, the regional averaged DOD in the Arabian Sea (0.32) during the late monsoon season is also higher than that (0.24) during the early monsoon season due to the enhancement of the dust transportation.
The short-wave, long-wave and net radiative forcing anomalies at the surface, TOA and in the atmosphere caused by the dust DRE over the Arabian Sea (Figure 11) are basically consistent with the spatial distribution characteristics of those in the early monsoon season (Figure 8). The dust DRE leads to reduction in radiative forcing anomalies at the surface (Figure 11G) and TOA (Figure 11H) over the Arabian Sea, but increases in the atmosphere due to the presence of absorbing dust aerosols (Figure 11I). It is worth noting that the increases in the net radiative forcing at the TOA over the Arabian Peninsula caused by the dust DRE are not significant in the late monsoon season (Figure 11H).
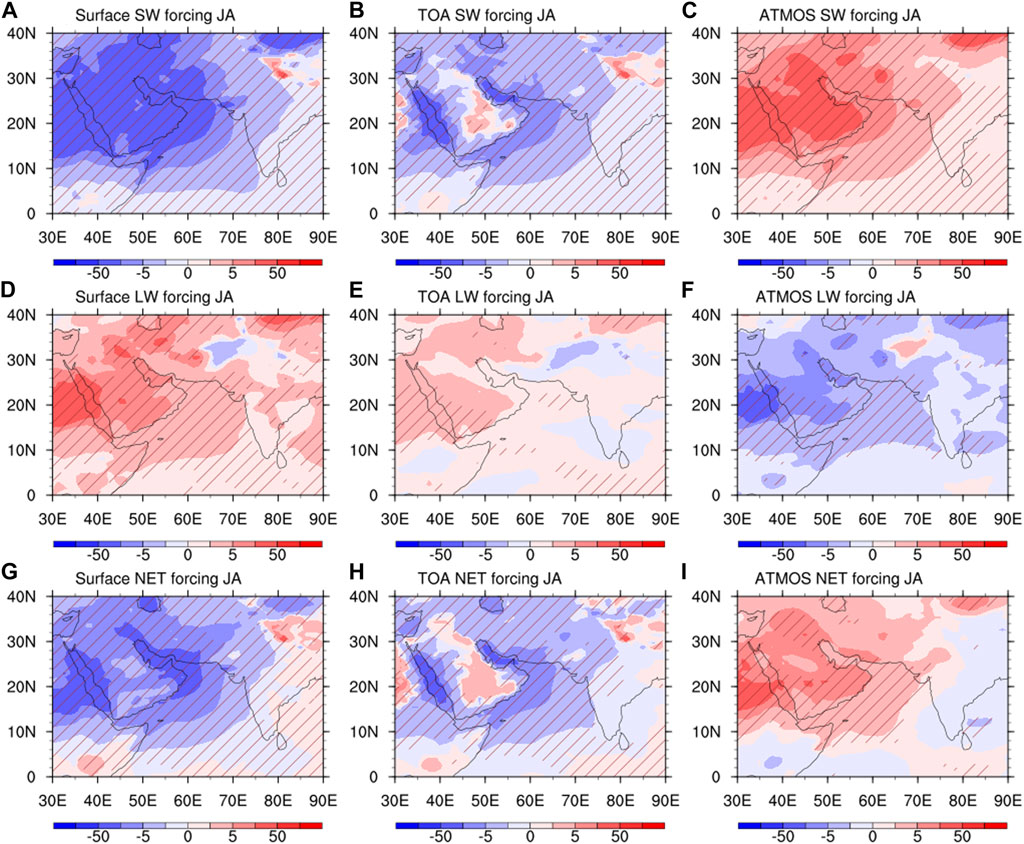
FIGURE 11. The dust DRE induced changes (UMD−UMN) in clear‐sky short-wave [SW, (A–C)], long-wave [LW, (D–F)] and net [SW + LW, (G–I)] radiative forcing (W/m2) at the surface (A,D,G), at the TOA (B,E,H) and in the atmosphere (C,F,I) in the late monsoon. Brown lines represent the values statistically significant at the 0.1 level.
The total and slow responses of temperature at the surface (Figures 12A,C) and 850 hPa (Figures 12D,F) to the dust DRE show negative anomalies over the Arabian Sea, and the geopotential height at 850 hPa show positive anomalies over this area (Figures 12G,I). The pressure anomalies produce the easterly flows over the Arabian Sea (Figures 12G,I), inhibit the water vapor transport (Figures 13A,C), thus decrease the specific humidity (Figure 13F) in CEI and weaken the ISM (Figures 7C,F). On the contrary, the fast response of the ISM to dust DRE shows the positive effects (Figure 13E) but insignificant on westerly flows over the Arabian Sea (Figure 13B).
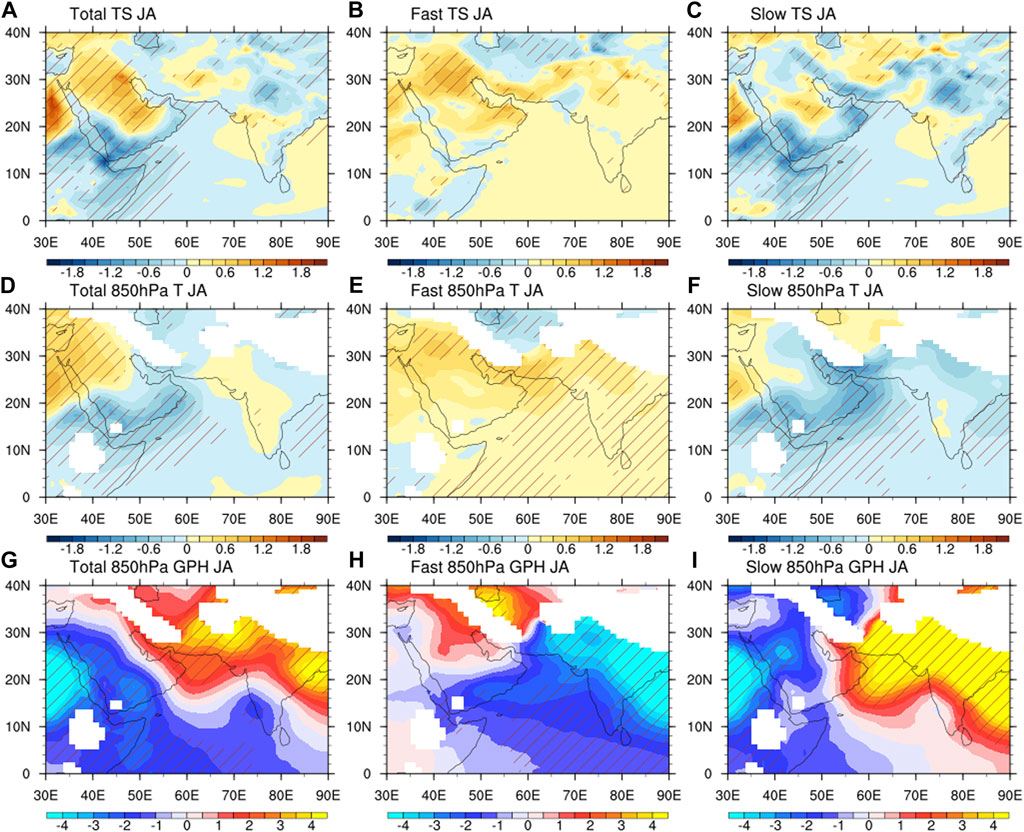
FIGURE 12. The total [(A,D,G), CMD−CMN], fast [(B,E,H), UMD−UMN] and slow [(C,F,I) (CMD−CMN)−(UMD−UMN)] responses of temperature at the surface (A–C,K) and 850 hPa (D–F,K) as well as those of geopotential height [(G–I), gpm] at 850 hPa to the dust DRE during the late monsoon season (July–August). Brown lines represent the values statistically significant at the 0.1 level.
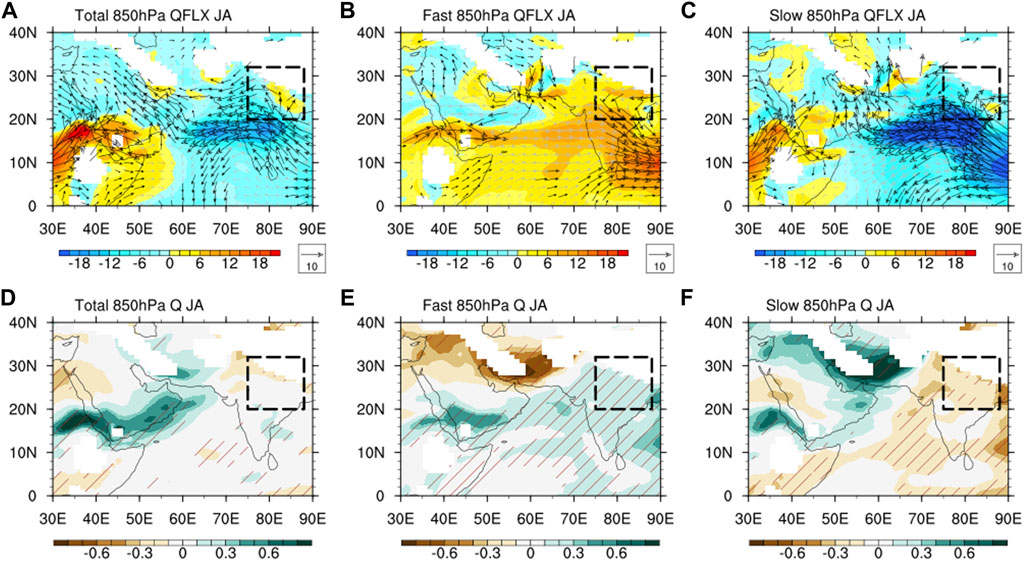
FIGURE 13. The total [(A,D), CMD−CMN], fast [(B,E), UMD−UMN] and slow [(C,F) (CMD−CMN)−(UMD−UMN)] responses of moisture flux [A–C; g/(hPam s)] and specific humidity (D–F, g/kg) at 850 hPa to the dust DRE during the late monsoon season (July–August). Black (grey) arrows represent the moisture flux vector differences statistically significant (insignificant) at the 0.1 level. Brown lines represent the values statistically significant at the 0.1 level.
To sum up, the dust DRE strengthens the ISM by heating the lower troposphere over the WAD during the early monsoon season, but weakens it by cooling the sea surface and lower troposphere over the Arabian Sea during the late monsoon season. Further, the enhancement of the ISM during the early monsoon season is dominated by the fast response while the weakening during the late monsoon season is dominated by the slow response.
A large number of studies have focused on the relationship between the WAD dust aerosols and the ISM, they are more concerned the short-term effects and claimed that the dust DRE can enhance the ISM through heating atmosphere (fast response) over the Arabian Sea (Rahul et al., 2008; Jin et al., 2014; Vinoj et al., 2014; Solmon et al., 2015; Jin et al., 2018). Jin et al. (2014), Jin et al. (2018) observed that dust aerosols from the WAD can affect the ISM within 7–13 days and reproduced that with the model simulations. However, few studies have been carried out on long time scales due to the lack of the long-term observation datasets, that result in the insufficient understanding on the slow response of climate to the dust DRE.
To explore the relationship between the WAD dust aerosols and the ISM on longer time, we show the spatial and temporal variation trends of the DOD from MERRA-2 reanalysis and precipitation from GPCP in 1980–2015. The results show that: the DOD over the WAD increased both in the early monsoon (Figure 14A) and late monsoon seasons (Figure 14D), while the precipitation increased in the early monsoon season (Figure 14B) but decreased in the late monsoon season (Figure 14E). The regional means of the DOD in the WAD increased at the rate 0.004 and 0.003 per year in the early monsoon season (Figure 14C) and late monsoon season (Figure 14F) respectively, while the precipitation in the CEI increased at the rate of 0.019 mm per year in the early monsoon season (Figure 14C) but decreased (−0.006 mm/year) in the late monsoon season (Figure 14F). Our results in Section 4 show that the precipitation increase during the early monsoon season but decrease during the monsoon season in the CEI, which are supported by the observational evidences of long-term trends in the DOD in the WAD and the precipitation in the CEI (Figure 14).
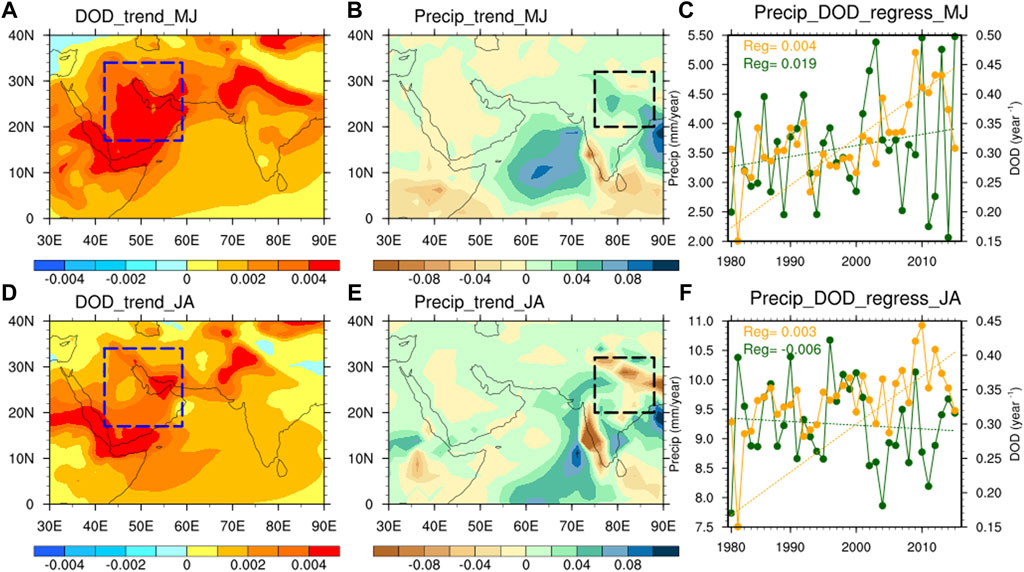
FIGURE 14. Spatial distributions of variation trends of dust aerosol optical thickness (A,D) from MERRA-2 and precipitation from GPCP (C,E) as well as the year-to-year variations of the dust aerosol optical thickness averaged for the WAD (yellow) and precipitation averaged for the CEI (green, mm/year) (C,F) in the early monsoon (A–C) and late monsoon seasons (D–F) from 1980–2015. The blue dotted box represents the WAD, as shown in Figure 1. The black dotted box represents CEI, as shown in Figure 3.
Our results show that the DRE of WAD dust aerosols significantly enhance ISM during the early monsoon season but weaken it during the late monsoon season. The seasonal differences may depend on the extent to the SST responses in the Arabian Sea caused by the dust DRE. Compared with the early monsoon season, the enhanced ISM circulation transports more dust to the Arabian Sea during the late monsoon season (Jin et al., 2014). The MERRA-2 reanalysis and CMD simulation show the same changes on DOD over Arabian Sea during the late monsoon season, which result in lower SST (Table 3). Therefore, this stronger SST response allows the slow response to dominate the weakening of ISM during the late monsoon season.

TABLE 3. The regional mean DOD from MERRA-2 reanalysis, CMD simulations and the SST anomaly (unit: °C) induced by dust DRE over the Arabian Sea (10–25°N, 55–70°E) during the early and the late monsoon seasons, respectively.
It has been proved, based on observational results, that local dust aerosols over the Indian subcontinent can strengthen ISM during the early monsoon season but weaken it during the late monsoon through the Elevated Heat Pump (EHP) effect (Lau and Kim, 2006). Maharana et al. (2019) also found that the EHP induced by local dust aerosols increased the precipitation over the foothills of the Himalaya but decreased it over the central India in May and June through regional climate simulations, whereas the EHP vanished due to the increased wet deposition of dust aerosols over the foothills of the Himalaya in the late monsoon. Our study also finds the similar effect on ISM, but this is caused by the DRE of remote dust aerosols (i.e., WAD dust aerosols) via the modulation of SST in the Arabian Sea.
The circulation and precipitation responses induced by the dust DRE have a great uncertainty as mentioned in different studies, likely due to the absorption efficiency of dust aerosols (Yoshioka et al., 2007; Solmon et al., 2012; Miller et al., 2014; Balkanski et al., 2021). Previously studies have shown that the changes of CEI precipitation during the late monsoon season depend on the dust absorption efficiency, higher dust absorption corresponding to higher precipitation and vice versa (Miller et al., 2004; Yoshioka et al., 2007; Solmon et al., 2012). The distinguished surface albedo also plays an important role, hence it can in turn affect the climate feedbacks due to the dust DRE. One limitation of CAM4-BAM is that it did not consider the interactions between dust aerosols and clouds. Many previous studies pointed out that dust aerosols (as an ice nuclei or cloud condensation nuclei) can prolong the life of clouds, and thus modulate the energy balance of earth-atmosphere system (Ramanathan et al., 2001; Xie et al., 2017). Moreover, dust aerosols can affect the precipitation by altering the microphysical processes of clouds (Rosenfeld et al., 2001; Huang et al., 2014). Therefore, future studies could consider the dust-cloud interactions to evaluate the dust effects on climate more accurately.
The direct radiative effects (DRE) of west Asian dust aerosols can modulate the Indian summer monsoon (ISM) circulation and precipitation by directly heating the atmosphere (fast response) and cooling the sea surface (slow response). To identify the fast and slow responses of ISM to the DRE of dust in the west Asian deserts (WAD) separately, the Community Atmospheric Model version 4 (CAM4) with an updated Bulk Aerosol Model (BAM) has been used in this study. Two sets of experiments were carried out: Coupled model with dust radiative feedback (CMD) and coupled model without dust radiative feedback (CMN). Similarly, two additional sets of simulations, uncoupled model with dust radiative feedback (UMD) and uncoupled model without dust radiative feedback (UMN), were also conducted. Therefore, the difference CMD-CMN can represent the total climate response, the difference UMD-UMN represents the fast response, and finally the difference (CMD-CMN)-(UMD-UMN) reflects the slow response induced by the dust DRE. Our modeling results can capture the major characteristics of the temporal and spatial distributions of the dust aerosols in the WAD as well as the circulation and precipitation patterns related to the ISM in comparison with the MERRA-2 reanalysis and GPCP datasets.
The comparative analyses of simulation experiments show that the dust DRE significantly enhances the ISM during the early monsoon season (May–June) but weakens it during the late monsoon season (July–August). Further analyses show that the fast response of the ISM due to the dust DRE heats the lower troposphere over the WAD, strengthens the southwesterly flows over the Arabian Sea and provides abundant water vapor supply for the land thus increases the precipitation in the central and eastern India (CEI), which dominates the ISM enhancement during the early monsoon season. However, for the late monsoon season, the slow response of the ISM to the dust DRE cools the sea surface temperature (SST) and the lower troposphere, then creates an anomaly high with the easterly winds over the Arabian Sea, weakens the moisture transport from ocean to land and inhibits the precipitation in the CEI. Additionally, observational evidences of long-term trends in DOD in the WAD and the ISM precipitation in the CEI during the period 1980–2015 support our simulated results that: the precipitation increases during the early monsoon season but decreases during the late monsoon season.
The original contributions presented in the study are included in the article/Supplementary Material, further inquiries can be directed to the corresponding authors.
AW and XX designed and performed all the numerical experiments. XL and ZS assisted in evaluation and interpretation of simulation results. AW prepared the manuscript with substantial contributions from all co-authors.
This work was jointly supported by the Strategic Priority Research Program of Chinese Academy of Sciences (XDB40030100, XDA20070103) and the National Natural Science Foundation of China (41991254). XX is supported by the National Natural Science Foundation of China (42175059) and the CAS “Light of West China” program (XAB2019A02).
The authors declare that the research was conducted in the absence of any commercial or financial relationships that could be construed as a potential conflict of interest.
All claims expressed in this article are solely those of the authors and do not necessarily represent those of their affiliated organizations, or those of the publisher, the editors and the reviewers. Any product that may be evaluated in this article, or claim that may be made by its manufacturer, is not guaranteed or endorsed by the publisher.
We thank the Editor of this paper, Dr. Sagar Parajuli, and the two reviewers for their constructive comments and suggestions which improve the quality of the paper.
Adler, R. F., Huffman, G. J., Chang, A., Ferraro, R., Xie, P.-P., Janowiak, J., et al. (2003). The Version 2.1 Global Precipitation Climatology Project (GPCP) Monthly Precipitation Analysis (1979-Present). J. Hydrol. 4, 1147–1167. doi:10.1175/1525-7541(2003)004<1147:tvgpcp>2.0.co;2
Albani, S., Mahowald, N. M., Perry, A. T., Scanza, R. A., Zender, C. S., Heavens, N. G., et al. (2014). Improved Dust Representation in the Community Atmosphere Model. J. Adv. Model. Earth Syst. 6, 541–570. doi:10.1002/2013ms000279
Balkanski, Y., Bonnet, R., Boucher, O., Checa-Garcia, R., and Servonnat, J. (2021). Better Representation of Dust Can Improve Climate Models with Too Weak an African Monsoon. Atmos. Chem. Phys. 21 (14), 11423–11435. doi:10.5194/acp-21-11423-2021
Bangalath, H. K., and Stenchikov, G. (2015). Role of Dust Direct Radiative Effect on the Tropical Rain Belt over Middle East and North Africa: A High-Resolution AGCM Study. J. Geophys. Res. Atmos. 120 (10), 4564–4584. doi:10.1002/2015jd023122
Bonan, G. B., Levis, S., Kergoat, L., and Oleson, K. W. (2002). Landscapes as Patches of Plant Functional Types: An Integrating Concept for Climate and Ecosystem Models. Glob. Biogeochem. Cycles 16 (2), 1021. doi:10.1029/2000GB001360
Chen, S., Huang, J., Kang, L., Wang, H., Ma, X., He, Y., et al. (2017). Emission, Transport and Radiative Effects of Mineral Dust from Taklimakan and Gobi Deserts: Comparison of Measurements and Model Results. Atmos. Chem. Phys. 17 (3), 1–43. doi:10.5194/acp-17-2401-2017
Chen, S., Zhao, C., Qian, Y., Leung, L. R., Huang, J., Huang, Z., et al. (2014). Regional Modeling of Dust Mass Balance and Radiative Forcing over East Asia Using WRF-Chem. Aeolian Res. 15, 15–30. doi:10.1016/j.aeolia.2014.02.001
Collins, W. D., Rasch, P. J., Boville, B. A., Hack, J. J., McCaa, J. R., Williamson, D. L., et al. (2006). The Formulation and Atmospheric Simulation of the Community Atmosphere Model Version 3 (CAM3). J. Clim. 19, 2144–2161. doi:10.1175/jcli3760.1
Gelaro, R., McCarty, W., Suárez, M. J., Todling, R., Molod, A., Takacs, L., et al. (2017). The Modern-Era Retrospective Analysis for Research and Applications, Version 2 (MERRA-2). J. Clim. 30, 5419–5454. doi:10.1175/jcli-d-16-0758.1
Ginoux, P., Chin, M., Tegen, I., Prospero, J. M., Holben, B., Dubovik, O., et al. (2001). Sources and Distributions of Dust Aerosols Simulated with the GOCART Model. J. Geophys. Res. 106, 20255–20273. doi:10.1029/2000JD000053
Gu, Y., Xue, Y., De Sales, F., and Liou, K. N. (2016). A GCM Investigation of Dust Aerosol Impact on the Regional Climate of North Africa and South/East Asia. Clim. Dyn. 46, 2353–2370. doi:10.1007/s00382-015-2706-y
Hansen, J., Sato, M., Ruedy, R., Nazarenko, L., Lacis, A., Schmidt, G. A., et al. (2005). Efficacy of Climate Forcings. J. Geophys. Res. 110, D18104. doi:10.1029/2005jd005776
Hess, M., Koepke, P., and Schult, I. (1998). Optical Properties of Aerosols and Clouds: The Software Package OPAC. Bull. Am. Meteorol. Soc. 79, 831–844. doi:10.1175/1520-0477(1998)079<0831:opoaac>2.0.co;2
Huang, J., Wang, T., Wang, W., Li, Z., and Yan, H. (2014). Climate Effects of Dust Aerosols over East Asian Arid and Semiarid Regions. J. Geophys. Res. Atmos. 119, 11398–11416. doi:10.1002/2014JD021796
Huffman, G. J. (1997). Estimates of Root-Mean-Square Random Error for Finite Samples of Estimated Precipitation. J. Appl. Meteor. 36, 1191–1201. doi:10.1175/1520-0450(1997)036<1191:eormsr>2.0.co;2
Islam, M. N., and Almazroui, M. (2012). Direct Effects and Feedback of Desert Dust on the Climate of the Arabian Peninsula during the Wet Season: A Regional Climate Model Study. Clim. Dyn. 39 (9-10), 2239–2250. doi:10.1007/s00382-012-1293-4
Jin, Q., Wei, J., Lau, W. K. M., Pu, B., and Wang, C. (2021). Interactions of Asian Mineral Dust with Indian Summer Monsoon: Recent Advances and Challenges. Earth Sci. Rev. 215, 103562. doi:10.1016/j.earscirev.2021.103562
Jin, Q., Wei, J., Pu, B., Yang, Z. L., and Parajuli, S. P. (2018). High Summertime Aerosol Loadings Over the Arabian Sea and Their Transport Pathways. J. Geophys. Res. 123, 10568–10590. doi:10.1029/2018jd028588
Jin, Q., Wei, J., and Yang, Z.-L. (2014). Positive Response of Indian Summer Rainfall to Middle East Dust. Geophys. Res. Lett. 41, 4068–4074. doi:10.1002/2014gl059980
Jordan, A. K., Zaitchik, B., Gnanadesikan, A., Kim, D., and Badr, H. S. (2020). Strength of Linkages between Dust and Circulation over North Africa: Results from a Coupled Modeling System with Active Dust. J. Geophys. Res. 125, e2019JD030961. doi:10.1029/2019jd030961
Kok, J. F. (2011). A Scaling Theory for the Size Distribution of Emitted Dust Aerosols Suggests Climate Models Underestimate the Size of the Global Dust Cycle. Proc. Natl. Acad. Sci. U.S.A. 108, 1016–1021. doi:10.1073/pnas.1014798108
Lau, K.-M., and Kim, K.-M. (2006). Observational Relationships between Aerosol and Asian Monsoon Rainfall, and Circulation. Geophys. Res. Lett. 33 (21), L21810. doi:10.1029/2006gl027546
Lau, K. M., Kim, K. M., Sud, Y. C., and Walker, G. K. (2009). A GCM Study of the Response of the Atmospheric Water Cycle of West Africa and the Atlantic to Saharan Dust Radiative Forcing. Ann. Geophys. 27 (10), 4023–4037. doi:10.5194/angeo-27-4023-2009
Lau, W. K. M., and Kim, K.-M. (2007). 3 Does Aerosol Weaken or Strengthen the Asian Monsoon? Dev. Earth Surf. Process. 10, 13–22. doi:10.1016/S0928-2025(06)10003-6
Liu, J. H., Zhao, T. L., Han, Y. X., Gong, S. L., and Xiong, J. (2013). Modeling Study on Distribution and Variations of Global Dust Aerosol Sources and Sinks. China Environ. Sci. 33 (10), 1741–1750.
Maharana, P., Dimri, A. P., and Choudhary, A. (2019). Redistribution of Indian Summer Monsoon by Dust Aerosol Forcing. Meteorol. Appl. 26 (4), 584–596. doi:10.1002/met.1786
Miller, R. L., Knippertz, P., Pérez, G. C., Perlwitz, J. P., and Tegen, I. (2014). “Impact of Dust Radiative Forcing upon Climate,” in Mineral Dust. Editors P. Knippertz, and JB. Stuut (Dordrecht: Springer), 327–357. doi:10.1007/978-94-017-8978-3_13
Miller, R. L., Perlwitz, J., and Tegen, I. (2004). Modeling Arabian Dust Mobilization during the Asian Summer Monsoon: The Effect of Prescribed versus Calculated SST. Geophys. Res. Lett. 31, L22214. doi:10.1029/2004GL020669
Miller, R. L., and Tegen, I. (1998). Climate Response to Soil Dust Aerosols. J. Clim. 11, 3247–3267. doi:10.1175/1520-0442(1998)011<3247:crtsda>2.0.co;2
Neale, R. B., Richter, J. H., Conley, A. J., Park, S., Lauritzen, P. H., Gettelman, A., et al. (2010). Description of the NCAR Community Atmosphere Model (CAM 4.0). NCAR Tech. Note NCAR/TN-485+ STR 1 (1), 1–12.
Neale, R. B., Richter, J., Park, S., Lauritzen, P. H., Vavrus, S. J., Rasch, P. J., et al. (2013). The Mean Climate of the Community Atmosphere Model (CAM4) in Forced SST and Fully Coupled Experiments. J. Clim. 26 (14), 5150–5168. doi:10.1175/jcli-d-12-00236.1
Parajuli, S. P., Stenchikov, G. L., Ukhov, A., Shevchenko, I., Dubovik, O., and Lopatin, A. (2020). Aerosol Vertical Distribution and Interactions with Land/sea Breezes over the Eastern Coast of the Red Sea from Lidar Data and High-Resolution WRF-Chem Simulations. Atmos. Chem. Phys. 20, 16089–16116. doi:10.5194/acp-20-16089-2020
Parajuli, S. P., Yang, Z.-L., and Lawrence, D. M. (2016). Diagnostic Evaluation of the Community Earth System Model in Simulating Mineral Dust Emission with Insight into Large-Scale Dust Storm Mobilization in the Middle East and North Africa (MENA). Aeolian Res. 21, 21–35. doi:10.1016/j.aeolia.2016.02.002
Prospero, J. M., Ginoux, P., Torres, O., Nicholson, S. E., and Gill, T. E. (2002). Environmental Characterization of Global Sources of Atmospheric Soil Dust Identified with the Nimbus 7 Total Ozone Mapping Spectrometer (TOMS) Absorbing Aerosol Product. Rev. Geophys. 40, 2-1–2-31. doi:10.1029/2000rg000095
Rahul, P. R. C., Salvekar, P. S., and Devara, P. C. S. (2008). Aerosol Optical Depth Variability Over Arabian Sea during Drought and Normal Years of Indian Monsoon. Geophys. Res. Lett. 35, L22812. doi:10.1029/2008gl035573
Ramanathan, V., Crutzen, P. J., Kiehl, J. T., and Rosenfeld, D. (2001). Aerosols, Climate, and the Hydrological Cycle. Science 294 (5549), 2119–2124. doi:10.1126/science.1064034
Ramaswamy, V., Muraleedharan, P. M., and Babu, C. P. (2017). Mid-Troposphere Transport of Middle-East Dust Over the Arabian Sea and its Effect on Rainwater Composition and Sensitive Ecosystems over India. Sci. Rep. 7, 13676. doi:10.1038/s41598-017-13652-1
Randles, C. A., da Silva, A. M., Buchard, V., Colarco, P. R., Darmenov, A., Govindaraju, R., et al. (2017). The MERRA-2 Aerosol Reanalysis, 1980 Onward. Part I: System Description and Data Assimilation Evaluation. J. Clim. 30, 6823–6850. doi:10.1175/jcli-d-16-0609.1
Rao, K. G., and Goswami, B. N. (1988). Interannual Variations of Sea Surface Temperature Over the Arabian Sea and the Indian Monsoon: A New Perspective. Mon. Wea. Rev. 116 (3), 558–568. doi:10.1175/1520-0493(1988)116<0558:ivosst>2.0.co;2
Rosenfeld, D., Rudich, Y., and Lahav, R. (20012010). Desert Dust Suppressing Precipitation: A Possible Desertification Feedback Loop. Proc. Natl. Acad. Sci. U.S.A. 98, 5975–5980. doi:10.1073/pnas.101122798
Schulz, M., Balkanski, Y. J., Guelle, W., and Dulac, F. (1998). Role of Aerosol Size Distribution and Source Location in a Three–Dimensional Simulation of a Saharan Dust Episode Tested against Satellite-Derived Optical Thickness. J. Geophys. Res. 103 (D9579–10), 10592. doi:10.1029/97jd02779
Shao, Y., Wyrwoll, K.-H., Chappell, A., Huang, J., Lin, Z., McTainsh, G. H., et al. (2011). Dust Cycle: an Emerging Core Theme in Earth System Science. Aeolian Res. 2, 181–204. doi:10.1016/j.aeolia.2011.02.001
Shi, Z., Xie, X., Li, X., Yang, L., Xie, X., Lei, J., et al. (2019). Snow-Darkening Versus Direct Radiative Effects of Mineral Dust Aerosol on the Indian Summer Monsoon Onset: Role of Temperature Change Over Dust Sources. Atmos. Chem. Phys. 19 (3), 1605–1622. doi:10.5194/acp-19-1605-2019
Solmon, F., Elguindi, N., and Mallet, M. (2012). Radiative and Climatic Effects of Dust over West Africa, as Simulated by a Regional Climate Model. Clim. Res. 52, 97–113. doi:10.3354/cr01039
Solmon, F., Nair, V. S., and Mallet, M. (2015). Increasing Arabian Dust Activity and the Indian Summer Monsoon. Atmos. Chem. Phys. 15, 8051–8064. doi:10.5194/acp-15-8051-2015
Sun, H., Liu, X., and Wang, A. (2020). Seasonal and Interannual Variations of Atmospheric Dust Aerosols in Mid and Low Latitudes of Asia - A Comparative Study. Atmos. Res. 244, 105036. doi:10.1016/j.atmosres.2020.105036
Tegen, I., and Lacis, A. A. (1996). Modeling of Particle Size Distribution and its Influence on the Radiative Properties of Mineral Dust Aerosol. J. Geophys. Res. 101, 19237–19244. doi:10.1029/95JD03610
Vinoj, V., Rasch, P. J., Wang, H., Yoon, J.-H., Ma, P.-L., Landu, K., et al. (2014). Short-Term Modulation of Indian Summer Monsoon Rainfall by West Asian Dust. Nat. Geosci. 7, 308–313. doi:10.1038/ngeo2107
Xian, P., Klotzbach, P. J., Dunion, J. P., Janiga, M. A., Reid, J. S., Colarco, P. R., et al. (2020). Revisiting the Relationship between Atlantic Dust and Tropical Cyclone Activity Using Aerosol Optical Depth Reanalyses: 2003-2018. Atmos. Chem. Phys. 20, 15357–15378. doi:10.5194/acp-20-15357-2020
Xie, X., Liu, X., Che, H., Xie, X., Wang, H., Li, J., et al. (2018). Modeling East Asian Dust and its Radiative Feedbacks in CAM4-BAM. J. Geophys. Res. Atmos. 123, 1079–1096. doi:10.1002/2017jd027343
Xie, X., Zhang, H., Liu, X., Peng, Y., and Liu, Y. (2017). Sensitivity Study of Cloud Parameterizations with Relative Dispersion in CAM5.1: Impacts on Aerosol Indirect Effects. Atmos. Chem. Phys. 17, 5877–5892. doi:10.5194/acp-17-5877-2017
Yoshioka, M., Mahowald, N. M., Conley, A. J., Collins, W. D., Fillmore, D. W., Zender, C. S., et al. (2007). Impact of Desert Dust Radiative Forcing on Sahel Precipitation: Relative Importance of Dust Compared to Sea Surface Temperature Variations, Vegetation Changes, and Greenhouse Gas Warming. J. Clim. 20, 1445–1467. doi:10.1175/jcli4056.1
Yue, X., Liao, H., Wang, H. J., Li, S. L., and Tang, J. P. (2011). Role of Sea Surface Temperature Responses in Simulation of the Climatic Effect of Mineral Dust Aerosol. Atmos. Chem. Phys. 11 (12), 6049–6062. doi:10.5194/acp-11-6049-2011
Zender, C. S., Bian, H., and Newman, D. (2003). Mineral Dust Entrainment and Deposition (DEAD) Model: Description and 1990s Dust Climatology. J. Geophys. Res. 108 (D14), 4416. doi:10.1029/2002jd002775
Keywords: direct radiative effect, Indian summer monsoon, fast and slow responses, climate model, west Asian dust aerosols
Citation: Wang A, Xie X, Liu X and Shi Z (2022) Fast and Slow Responses of the Indian Summer Monsoon to the Direct Radiative Effect of West Asian Dust Aerosols. Front. Environ. Sci. 10:877874. doi: 10.3389/fenvs.2022.877874
Received: 17 February 2022; Accepted: 14 April 2022;
Published: 03 May 2022.
Edited by:
Sagar Parajuli, King Abdullah University of Science and Technology, Saudi ArabiaReviewed by:
Abdoul Aziz Saidou Chaibou, Nanjing University of Information Science and Technology, ChinaCopyright © 2022 Wang, Xie, Liu and Shi. This is an open-access article distributed under the terms of the Creative Commons Attribution License (CC BY). The use, distribution or reproduction in other forums is permitted, provided the original author(s) and the copyright owner(s) are credited and that the original publication in this journal is cited, in accordance with accepted academic practice. No use, distribution or reproduction is permitted which does not comply with these terms.
*Correspondence: Xiaoning Xie, eG54aWVAaWVlY2FzLmNu; Xiaodong Liu, bGl1eGRAbG9lc3MubGxxZy5hYy5jbg==
Disclaimer: All claims expressed in this article are solely those of the authors and do not necessarily represent those of their affiliated organizations, or those of the publisher, the editors and the reviewers. Any product that may be evaluated in this article or claim that may be made by its manufacturer is not guaranteed or endorsed by the publisher.
Research integrity at Frontiers
Learn more about the work of our research integrity team to safeguard the quality of each article we publish.