 Yi He
Yi He Xingmin Mu
 Xiaohui Jiang
 Jinxi Song
- 1The Research Center of Soil and Water Conservation and Ecological Environment, Chinese Academy of Sciences and Ministry of Education, Yangling, China
- 2Shaanxi Key Laboratory of Earth Surface System and Environmental Carrying Capacity, College of Urban and Environmental Sciences, Northwest University, Xi’an, China
- 3Institute of Soil and Water Conservation, Northwest A&F University, Yangling, China
In recent decades, due to climate change and human activities, the hydrological processes of many rivers in the world have undergone significant changes. As an important part of the water cycle, it is of great practical significance to identify the causes of runoff change for water resource management and planning. Taking the Kuye River and its tributaries, the Wulanmulun River and Beiniuchuan River as examples, the trend change in runoff was investigated by the Mann-Kendall trend test and mutation analysis, and the contribution of influencing factors of runoff change was quantitatively evaluated by the Budyko framework. The results showed that the annual runoff depth of the Kuye River basin and its tributaries, the Wulanmulun River basin and Beiniuchuan River basin, showed a significant decreasing trend from 1960 to 2014 (p < 0.01), and the decreasing rates were 1.03 mm/a, 1.24 mm/a and 1.50 mm/a, respectively. The abrupt change point of runoff depth in the Kuye River basin and its upstream Beiniuchuan River basin occurred in 1996, while that in the Wulanmulun River basin, another tributary, occurred in 1992. In the Kuye River basin, Beiniuchuan River basin and Wulanmulun River basin, the contributions of underlying surface change to runoff change were 89.03, 89.54, and 95.42%, respectively, followed by the contribution of rainfall, and the contribution of potential evapotranspiration to runoff change was the lowest. The change in the underlying surface (the Grain for Green Project and coal mining) is the main factor causing the decrease in runoff in the Kuye River basin.
1 Introduction
IPCC AR6 indicates that the global average surface temperature in the last decade (2011-2020) was 1.09°C higher than that in 1850-1900, and 0.19°C warmer than that in 2003-2012 (the period assessed by AR5). Due to climate change the complex interplay between human activities and the hydrological cycle has shown significant changes in runoff in many parts of the globe (Masson-Delmotte et al., 2021). As an important part of the water cycle, river runoff is the most important basis for the comprehensive development and utilization of water resources, scientific management and optimal dispatching (Blöschl et al., 2019).
With the increasing impact of global warming and human activities, significant temporal and spatial changes in runoff have taken place, which directly affect the allocation, development and utilization of water resources in the basin (Haddeland et al., 2014; He et al., 2015; He et al., 2019). Under the background of global climate change, the runoff and sediment transport of many rivers around the world have undergone great changes due to the joint action of natural processes and human activities (Walling and Fang, 2003; Li et al., 2021; Masson-Delmotte et al., 2021). Li et al. (2020) showed that 24% of global river runoff has undergone significant changes, and most Asian river sediment transport has shown a significant downward trend. Human activities directly or indirectly affect the process of runoff production and confluence through land use, vegetation cover and water and soil conservation (He et al., 2017). Water is an important element of atmospheric circulation and the hydrological cycle and is the most direct and important area of global climate change. Climate change has changed the process of the terrestrial hydrological cycle, affected the structure and function of hydrological and water resource systems, and posed a great challenge to the development and utilization of human water resources (Grafton et al., 2013). Human activities cause changes in water cycle elements, processes and hydrological regimes (Grill et al., 2019). Research on the impact of climate change and human activities on hydrology and water resources is one of the research topics of global change and one of the scientific challenges that human society and the economy must face in sustainable development (Haddeland et al., 2014).
In recent years, many scholars have been committed to quantifying the impact of climate change and human activities on runoff, and the methods used are mainly divided into four categories: the elastic coefficient method (He et al., 2019), the paired watershed method (Brown et al., 2005), empirical statistical method (Guo et al., 2016; He et al., 2016; Song et al., 2021), and hydrological model method (Sood and Smakhtin, 2015; Sun et al., 2020; Hu et al., 2021). The paired watershed method analyzes the impact of human activities on runoff change by comparing the hydrological process differences between basins and reference basins. This method has clear physical significance, but it is only suitable for small basins. The hydrological model method can be used to simulate various meteorological scenarios under different land use conditions, but the modeling process is very complex and requires a variety of data, and the parameter calibration process is complex, which is prone to overparameterization and affects the simulation accuracy. The statistical fitting method involves too few types of factors and too simple a form. Generally, it only considers the double cumulative curve relationship between precipitation and runoff and the linear relationship between precipitation and runoff and lacks analysis of the changes in the underlying surface of the basin and other factors that can affect runoff.
The Budyko method is a single-parameter water balance model (Choudhury, 1999; Yang et al., 2008). The parameter n represents the comprehensive characteristics of the underlying surface of a basin, and its changes usually reflect the impact of human activities on the underlying surface. Due to the Budyko method being simple and having fewer input parameters, it has been widely used in quantitative analysis of the causes of runoff attenuation. The elastic coefficient method based on the Budyko hypothesis takes into account the interaction of various factors in a basin, and is widely used in runoff attribution research because of its simple calculation. He et al. (2019) quantified the contribution of human activities and climate change to runoff reduction in the Beiluo River basin in the Loess Plateau by using the Budyko framework, and concluded that human activities were the main factor causing runoff reduction. Hu and He (2021) analyzed runoff in the Yue River basin of the Qinling Mountains using the Budyko hypothesis and showed that the contribution of underlying surface change to runoff reduction was close to 90%. In addition, the Mann-Kendall nonparametric statistical method is recommended by the World Meteorological Organization. This method is suitable for non-normal distribution data such as hydrometeorological data and has been widely used to analyze the trend change of hydrometeorological data (He et al., 2015). He et al. (2021) performed a comparative analysis of the runoff changes between the southern and northern Qinling Mountains by using the Mann-Kendall method, and found that the contribution of underlying surface changes to runoff in the South and North Qinling Mountains was 62 and 76%, respectively. Sun et al. (2020) analyzed the Zhouhe watershed on the Loess Plateau by using SWAT model, quantitatively attributing the decrease in runoff and sediment to climate change, land use change characterized by vegetation, and landscape engineering measures (such as check dams). Hu et al. (2021) used the SWAT model to simulate that land use change in the Weihe River basin resulted in a 5.3% decrease in water yield and a 6.2% increase in soil water content, while evapotranspiration (ET) almost remained unchanged.
The Kuye River is located in an arid and semiarid region on the Loess Plateau of China, and its runoff has decreased significantly in recent years. Some scholars have analyzed the change in runoff in the Kuye River basin. Guo et al. (2016) analyzed the runoff changes of three hydrological stations in the Kuye River basin with a statistical model and concluded that human activities were the main reason for the decrease in runoff in the basin. Based on regression model analysis, Song et al. (2021) found that the contribution of human activities to runoff changes in the Kuye River basin was 91%. To date, most studies of runoff change in the Kuye River basin and its subbasins have mainly focused on statistical models, which lack certain physical mechanisms.
In this study, is there any difference in the attribution of runoff change in different watershed of the Kuye River basin? In view of the above problems, this study selected three typical sub-basins in the main and tributaries of the Kuye River basin, and comprehensively analyzed the annual runoff changes and main controlling factors of the three sub-basins based on the Budyko hypothesis, in order to further reveal the runoff changes and leading factors of the Kuye River basin from 1960 to 2014 (Yang et al., 2007).
2 Study Area and Data
2.1 Study Region
The Kuye River basin is located between 109°28′-110°52′ E and 38°23′-39°52′, which is located in the transition zone between the Maowusu Sandy Land and the Loess Plateau. There are three landform types: gravel hilly areas, sandy hilly areas and loess hilly areas. The gravelly hilly area is mainly distributed in the upper reaches of the Wulanmulun River and the middle and upper reaches of the Boniuchuan River, accounting for 61.8% of the basin area. The sandy hilly area is located in the northwest and west of the basin, accounting for approximately 6.4% of the total area. The loess hilly and gully region is mainly distributed in the middle and lower reaches of the watershed, accounting for 31.2% of the watershed area. There are eleven meteorological stations (two within the basin) and three hydrological stations in and around the basin. The Xinmiao (XM) hydrological station is the control station of the Boniuchuan River, a tributary of the Kuye River, and the Wangdaohengta (WDHT) hydrological station is the control station of the Wulanmulun River, another tributary of the Kuye River, while the Wenjiachuan (WJC) hydrological station is the control station of the Kuye River basin (Figure 1). The underlying surface condition of the Kuye River basin is complicated. The upper reaches of the Kuye River basin are the aeolian steppe region, and the middle and lower reaches are the loess gully region. The terrain is broken. The distribution of the stations and the digital elevation model (DEM) are shown in Figure 1.
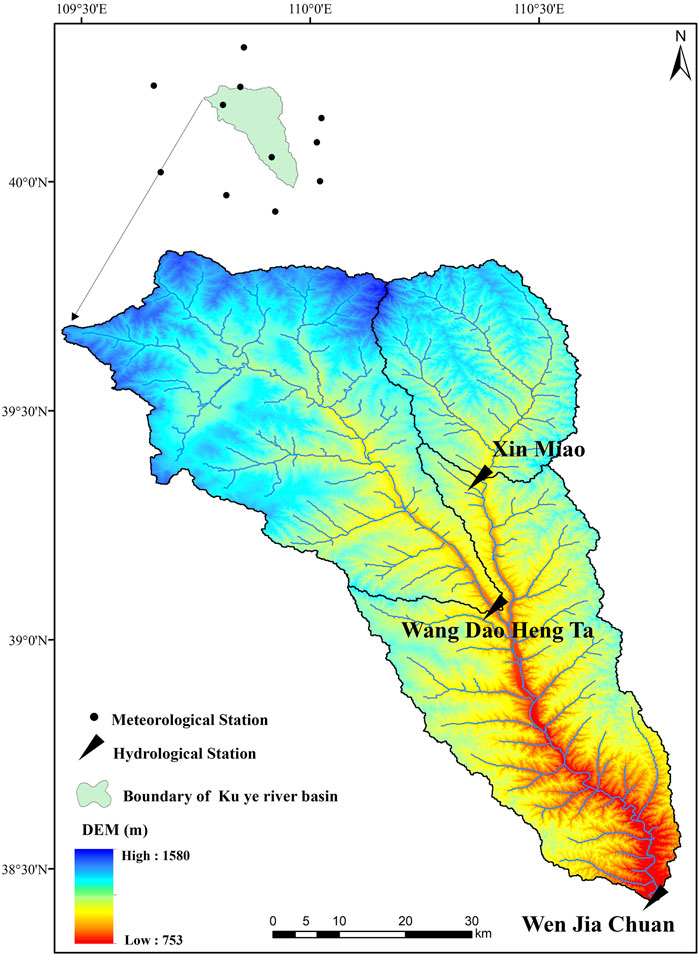
FIGURE 1. The location of the Kuye River basin.
2.2 Data Source and Processing
The WJC, WDHT and XM hydrological stations are the main hydrological stations in the Kuye River basin, with relatively complete long series of measured data. The yearly runoff of these three stations from 1960 to 2014 (XM hydrological station from 1966 to 2014) was systematically collected. There are 11 meteorological stations in Hangjin Banner, Fugu, Jiaxian, Shenmu, Dalate Banner, Wushen Banner, Xingxian, Yulin, Dongsheng, Ejin Horo Banner and Hequ in the study area and its surrounding areas. These 11 meteorological stations are evenly distributed in space and can well reflect the spatial distribution characteristics of climate in the study area and its surrounding areas. Daily meteorological data from 1960 to 2014 were collected in the China Meteorological Data Network (https://www.cma.gov.cn/), including precipitation, humidity, wind speed, sunshine duration, daily average, maximum and minimum temperature, etc., The Penman-Monteith method was used to calculate the potential evapotranspiration of each meteorological station in the study area. According to the precipitation and potential evapotranspiration of each meteorological station, the inverse distance weighted (IDW) spatial interpolation method was used to calculate the regional mean precipitation and potential evapotranspiration of the study basin. The normalized differential vegetation index (NDVI) was obtained from the GIMMS NDVI dataset from 1982 to 2015 provided by NASA (https://ecocast.arc.nasa.gov/data/pub/gimms/), and the spatial resolution was 8 km. The coal mining data from 1980 to 2014 were obtained from the statistical yearbook of Shaanxi Province and Inner Mongolia Province. The workflow in this study was shown in Figure 2.
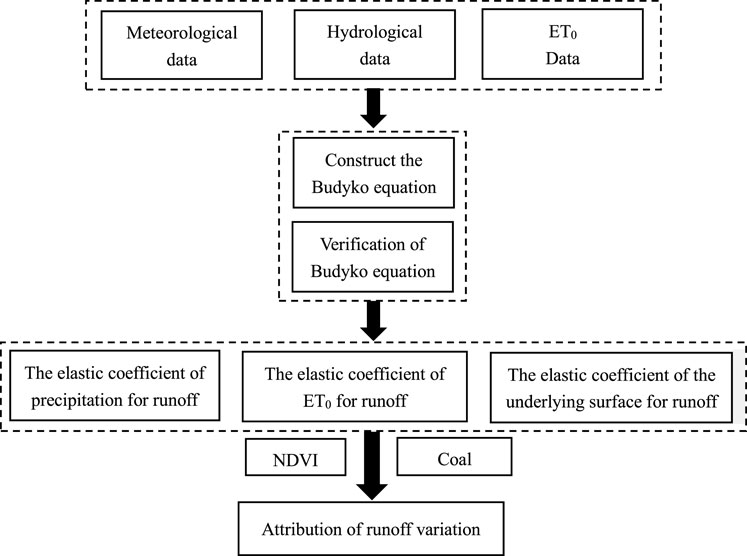
FIGURE 2. The workflow in this study.
3 Methodology
3.1 Trend and Mutation Analysis
The Mann-Kendall (MK) trend test is a nonparametric test method (Mann, 1945; Kendall, 1975). This method has wide applicability and is not disturbed by outliers, so it is widely used in hydrology, meteorology and other fields (Liang et al., 2013; Yue et al., 2014). In this study, the MK method was adopted to conduct trend analysis on the control parameter n, climate elements and underlying surface factors of hydrothermal coupling. The MK method uses the Z statistic to determine the trend. When the significance level is 0.05, if |Z| > 1.96. The observed series has a significant trend of change, and the Z value indicates that the observed series shows an upward or downward trend. See the reference for the specific calculation formula. The Pettit method is a nonparametric test method to identify the mutation point of a hydrological sequence (Pettitt, 1979). In this study, the Pettit mutation test was used to test the mutation point of runoff depth at three hydrological stations in the Kuye River basin.
3.2 Attribution Analysis of Runoff Change
3.2.1 Budyko Frame
Budyko’s theory assumes a demarcation method to distinguish the impacts of climate change and human activities based on the water volume and energy balance in a basin, whose expression is as follows:
where R is the average annual runoff depth (mm); P is the average annual precipitation in the basin (mm); E is the annual average actual evapotranspiration (mm) of the basin;
Based on the Budyko hypothesis, many scholars have proposed a series of Budyko modified models that can effectively evaluate the interaction of climate, vegetation and the hydrological cycle. In this study, the Budyko analytical expression derived by Choudhury-Yang (Choudhury, 1999; Yang et al., 2008) was used:
where ET0 is the annual average potential evapotranspiration (mm) of the basin, and n is the underlying surface parameter. By combining Eqs 1, 2, the average P, ET0, and R of the watershed are known and
The potential evapotranspiration (ET0) was calculated by the Penman-Monteith method recommended by the FAO (Allen et al., 1998), and the expression is:
where ET0 is the potential evapotranspiration (mm);
According to Eqs 1–3, the following expression can be obtained:
where R is the average annual runoff depth (mm); P is the average annual precipitation in the basin (mm); ET0 is the annual average potential evapotranspiration (mm) of the basin; and n is the underlying surface parameter.
3.2.2 Elastic Coefficient of Runoff to Climate and Underlying Surface
In Eq. 4, P, ET0 and n are independent variables. Combined with the water balance equation, the annual runoff can be expressed in the form of a full differential, which is expressed as:
The sensitivity of runoff R to all influencing factors can be expressed by the elastic coefficient
where
Eq. 5 can be obtained by dividing the average runoff depth R
Let
The positive (negative) value of the elastic coefficient indicates that the runoff in the basin will increase (decrease) with the increase (decrease) of the variable (P, ET0 and n).
3.2.3 Contribution of Influencing Factors to Runoff Change
Based on mutation analysis by using the Pettitt mutation test, the whole study period can be divided into two periods (base period T1: 1960--point of mutation year; Measure period T2: point of mutation year--2014). The change in runoff from T1 to T2 is:
where
where:
Multiply Eq. 7 by R, and obtain the following formula:
Then, the contribution dRx and contribution Cx of each influencing factor to runoff change are as follows:
where dRx is the runoff change caused by the impact factor x and dx is the change amount of the impact factor x in two periods. where Cx is the contribution of runoff change caused by the impact factor x and x is P, ET0, or n.
4 Results
4.1 Characteristics of Hydrometeorological Elements
During the study period, in the Kuye River basin, the average runoff depths of the WJC hydrological station, WDHT hydrological station and XM hydrological station were 53.7, 45.9, and 51.7 mm, respectively. The MK trend test showed that the runoff depth of these three stations showed a significant downward trend (p < 0.01), while the variation trend of precipitation and ET0 was not significant (Table 1). The ratio of extreme values of the annual runoff depth at the XM hydrological station in the upper reaches of the Kuye River is 50.7, which is 3 times that at the WDHT hydrological station and 6 times that at the WJC hydrological station, indicating that the annual runoff depth at the XM hydrological station is significantly different. The coefficients of variation (CVs) also show that the variation range of runoff depth at the two hydrological stations (WDHT hydrological station and XM hydrological station) in the upper reaches of the Kuye River is greater than that at the WJC hydrological station in the lower reaches. The runoff depth of the three hydrological stations in the Kuye River basin showed a significant decreasing trend, with decreasing trends of −1.0259 mm/a (at WJC hydrological station), −1.2395 mm/a (at WDHT hydrological station) and −1.4999 mm/a (at XM hydrological station). The precipitation and ET0 at the three hydrological stations in the basin also showed a decreasing trend, but the decreasing trend was not significant (Figures 3–5).
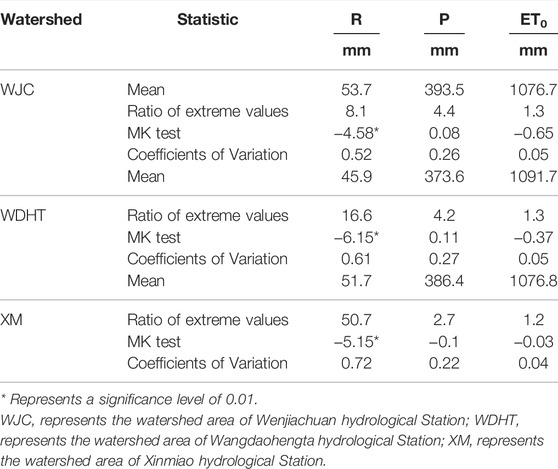
TABLE 1. Variation of runoff depth (R), precipitation (P), and potential evapotranspiration (ET0) for the Kuye River basin during 1960–2014.
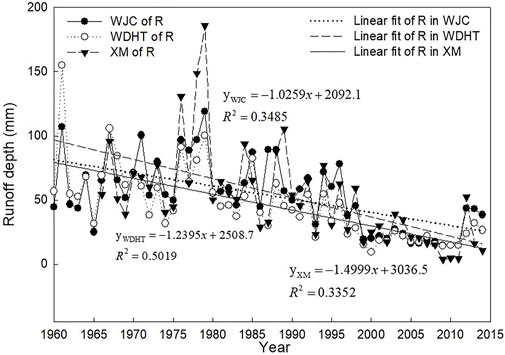
FIGURE 3. The variation in R in the Kuye River basin during 1960-2014.
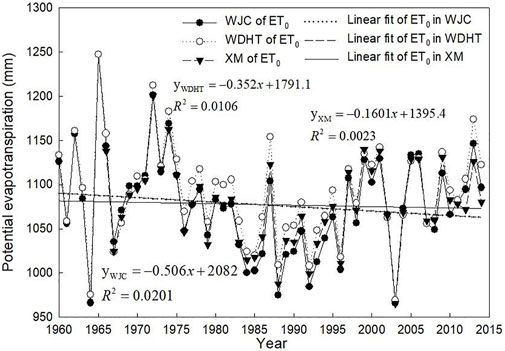
FIGURE 4. The variation in ET0 in the Kuye River basin during 1960-2014.
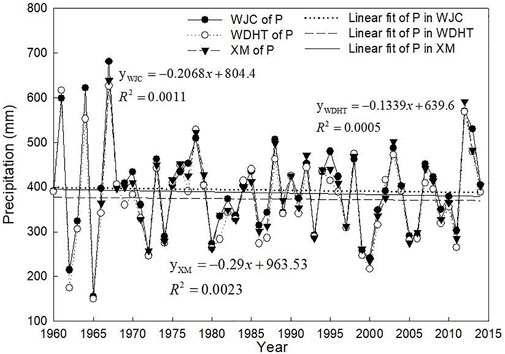
FIGURE 5. The variation in P in the Kuye River basin during 1960-2014.
4.2 Runoff Abrupt Test
The Pettitt mutation test showed that the abrupt change point of runoff at the WJC, WDHT and XM hydrological stations occurred in 1996, 1992, and 1996, respectively. The abrupt change point of runoff was divided into the base period and change period. The base period of runoff at WJC station was 1960-1996, and the change period was 1997-2014. The base period of runoff at WDHT station is 1960-1992, and the change period is 1993-2014; the base period of runoff at XM Station is 1966-1996, and the change period is 1997-2014 (Figure 6).
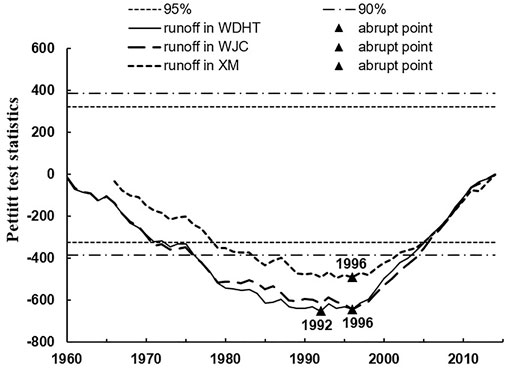
FIGURE 6. Abrupt change in annual runoff at the WJC, WDHT and XM hydrological station during 1960-2014.
4.3 Sensitivity of Runoff to Climate and Underlying Surface Changes
The precipitation and runoff depth in the Kuye River basin decreased in the change period, and the runoff depth decreased more than that in the baseline period. ET0 increased slightly with the addition of the WJC and XM hydrological stations but decreased slightly with the addition of the WDHT hydrological stations. The runoff change in the Kuye River basin is negatively correlated with ET0 and n but positively correlated with P. By comparing the two periods before and after the mutation point, the precipitation elasticity coefficient of the WJC hydrological station in the Kuye River basin increased from 2.06 in 1960-1996 to 2.72 in 1997-2014, indicating that when the same precipitation increased by 10%, runoff increased by 20.6% before 1996 and 27.2% after 1996. This shows that the influence degree of precipitation on runoff is further strengthened. Similarly, when potential evapotranspiration or underlying surface parameter n increases by 10%, WJC runoff will decrease by 10.6% or 19.5% before 1996, and 17.2% or 27.6% after 1996, respectively. At the WDHT and XM hydrological stations, when precipitation increases by 10% in the base period (Period I), runoff increases by 20.5 and 20.3%, potential evapotranspiration increases by 10%, runoff decreases by 10.5 and 10.3%, the underlying surface parameter n increases by 10%, and runoff decreases by 20.3 and 19.4%, while in the change period (Period II), when precipitation increases by 10%, runoff increases by 27.1 and 27.6%; when potential evapotranspiration increases by 10%, runoff decreases by 17.1 and 17.6%; when the underlying surface parameter n increases by 10%, runoff decreases by 28.2 and 28.4%, respectively (Table 2). In the changing period (Period II), the absolute values of the elasticity coefficient of precipitation, potential evapotranspiration and the underlying surface of the XM hydrological station are the largest among the three hydrological stations.
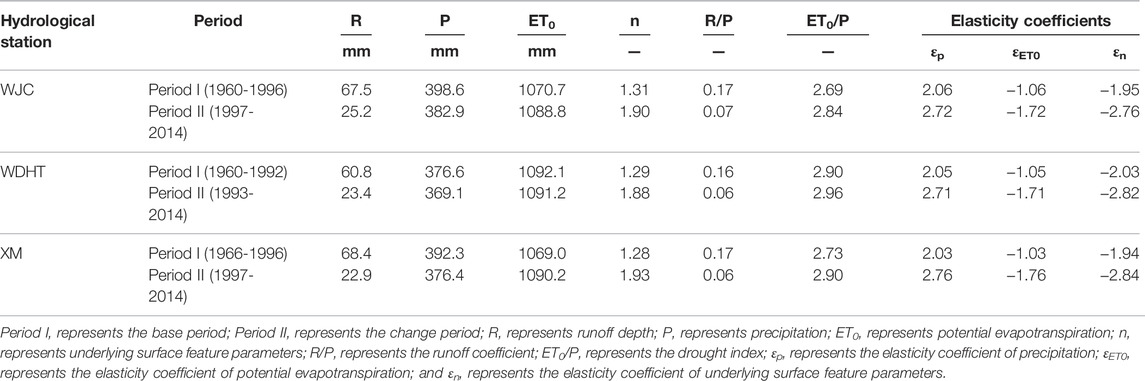
TABLE 2. Hydrometeorological characteristic values in the Kuye River basin.
4.4 Attribution of Runoff Variation
The error (δ) range between the calculated runoff change value (△R′) and the measured runoff change value (△R) in this study is 6.76–11.01%, indicating that the method used in this study to evaluate the impact of climate and human activities on runoff is reliable. In the Kuye River basin, the contributions of precipitation, potential evapotranspiration and the underlying surface are basically the same in different regions; the underlying surface has the most significant impact on runoff, followed by precipitation, and potential evapotranspiration has the least impact (Table 3). The underlying surface change not only has a great influence on the runoff change in the two subbasins (WDHT and XM hydrological station), with contributions of 95.42 and 89.54%, respectively but also has a great influence on the runoff change in the whole Kuye River basin (WJC), with a contribution of 89.03% (Table 3).
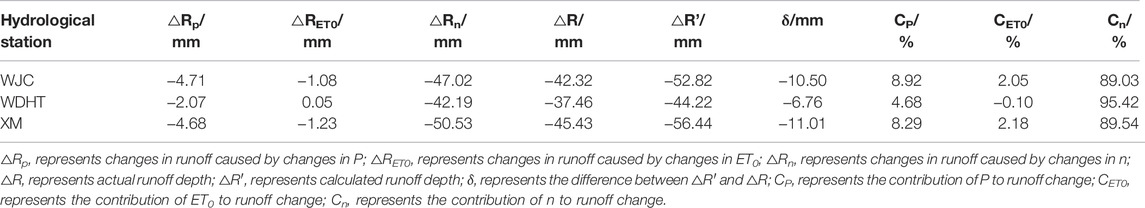
TABLE 3. Attribution of runoff change in the Kuye River basin.
5 Discussion
In this study, the abrupt change point of runoff at the WJC hydrological station and XM hydrological station in the Kuye River basin occurred in 1996, and the abrupt change point of runoff at the WDHT hydrological station occurred in 1992, which is consistent with the research of Guo et al. (2016). The contribution of underlying surface changes to runoff changes in the Kuye River basin (WJC hydrological station) and the Beiniuchuan River basin (XM hydrological station) analyzed by the Budyko framework is basically consistent with the results obtained by Guo et al. (2016) and Song et al. (2021) using statistical models, while the results in the Wulanmulun River basin (WDHT hydrological station) are slightly smaller than those of Guo et al. (2016). This is mainly due to the different research methods and different research periods. In this study, the impacts of human activities and climate change on runoff in the Kuye River basin and its sub-basins are comprehensively and quantitatively analyzed. Compared with the study by Guo et al. (2016), the runoff attribution of the Kuye River basin and its sub-basins is more comprehensively obtained.
The only parameter n in the Budyko frame is a comprehensive reflection of the underlying surface characteristics of a region, which is generally believed to be mainly affected by terrain (Yang et al., 2007), soil (Milly, 1994) and vegetation factors (Ning et al., 2016). Some scholars have established a function of regional relative infiltration capacity, relative soil water storage and average slope to solve the relationship of n in areas with weak human activities and found that the variability in topography and soil properties is relatively weak in a short period of time, and parameter n mainly reflects the change in underlying vegetation (Yang et al., 2007). Since 1999, a series of large-scale ecological restoration projects, such as the Grain for Green Project, have been carried out in the Kuye River basin on the Loess Plateau, and the vegetation situation has been significantly improved. The vegetation change analysis based on GIMMS NDVI from 1982 to 2015 in this basin showed that the vegetation in different areas of the basin had a significant increasing trend. In addition, the vegetation increase of the XM hydrological station in the upper reaches of the basin was greater than that of the WDHT hydrological station control area (Figure 7). The increase in vegetation cover has profoundly changed the conditions of the underlying surface of the basin. The underlying surface parameter n of the WJC, WDHT and XM hydrological stations during the change period increased by 31.05, 31.38 and 33.68%, respectively, compared with the baseline period (Table 1), which is closely related to the change in vegetation coverage in the basin. The increase in vegetation coverage leads to an increase in canopy interception. At the same time, hydrological processes such as land surface roughness, land surface water storage and river catchment paths in the process of runoff generation are changed, the time of runoff generation and catchment is prolonged, and evapotranspiration is increased. The runoff depths of the WJC, WDHT and XM hydrological stations decreased by 167.86, 159.83 and 198.69%, respectively, from the change period to the base period (Table 1). Vegetation change is the dominant factor controlling the underlying surface condition of the basin, but there are relatively few studies on the mechanism of hydrological process change driven by vegetation change in the basin, which should be further strengthened in the future.
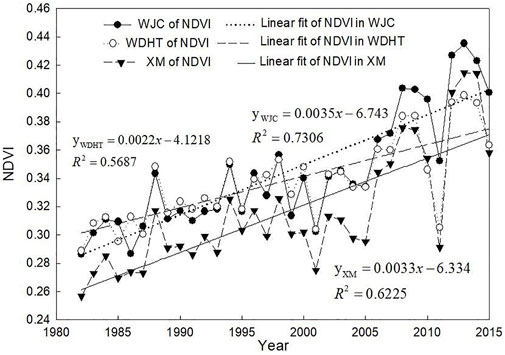
FIGURE 7. Variation in NDVI in the Kuye River basin during 1982-2015.
At XM station, WDHT station and WJC station, the correlation between NDVI and precipitation are 0.447, 0.390 and 0.413, respectively, while the correlation between NDVI and actual evapotranspiration are 0.613, 0.500 and 0.564, respectively, indicating that correlation between NDVI and actual evapotranspiration is higher, the change of NDVI will affect the water cycle. In addition to vegetation restoration, soil and water conservation engineering measures such as check dams construction will also cause the change of n values of underlying surface characteristic parameters. According to the water survey data of the Yellow River Water Conservancy Committee (Zhang et al., 2021), only 32 check dams were built in the Kuye River basin in 1987, with a total control area of 108.2 km2 and a total storage of 35.20 Mm3. Most of these check dams are located in the middle and lower reaches of the basin. By 2003, 143 check dams with a total storage capacity of 138.24 Mm3 had been built in the basin. After 2003, the speed of dams construction was further accelerated. In 2011, there were 306 key check dams in the Kuye River basin, with a total storage capacity of 316.64 Mm3. These soil and water conservation engineering measures on the basin of runoff, resulting in continuous reduction of runoff.
In addition, coal mining in the Kuye River basin also contributed to the decrease in runoff. The Beiniuchuan River basin located in the upper reaches of the Kuye River basin and the Wulanmulun River basin located in the middle reaches of the Kuye River basin are the main coal mining areas in this basin. Before 1985, the amount of coal mining in the Wulanmulun River basin and Beiniuchuan River basin was very small, with an annual output of less than 1 million tons (Guo et al., 2016). After 1996, the amount of coal mining increased significantly; by the end of 2014, the annual coal mining volume in the Kuye River basin reached nearly 300 million tons (Figure 8). The rapid increase in coal mining leads to the formation of a large number of underground goafs and a large number of water-conducting fissures, causing serious damage to the groundwater system and resulting in changes in the underlying surface conditions of the basin, thus affecting the process of runoff generation and river runoff.
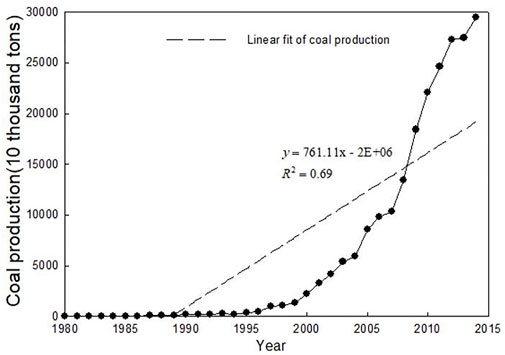
FIGURE 8. Coal production in the Kuye River basin during 1980-2014.
6 Conclusion
In this study, different subbasins of the Kuye River basin in the middle reaches of the Yellow River were selected. The Mann-Kendall trend test and mutation test were used to analyze the changes in runoff from 1960 to 2014, and the contributions of climate change and human activities to runoff changes were quantified based on the Budyko framework. The main conclusions are as follows:
1) During 1960-2014, the runoff depths of the WJC, WDHT and XM stations in the Kuye River basin decreased significantly (p < 0.01) at rates of 1.03 mm/a, 1.24 mm/a and 1.50 mm/a, respectively. The annual precipitation and potential evapotranspiration did not change significantly. The abrupt change in runoff at the WJC and XM stations occurred in 1996 and that at the WDHT station in 1992.
2) The elastic coefficient method based on Budyko frame is suitable for runoff attribution analysis in Kuye River Basin. The decrease in runoff was mainly controlled by underlying surface changes, followed by rainfall, and the potential evapotranspiration was the lowest. In the WJC-controlled area, the contributions of the underlying surface, precipitation and potential evapotranspiration to the decrease in runoff depth are 89.03, 8.92, and 2.05%, respectively. In the WDHT-controlled area, the contributions of the underlying surface, precipitation and potential evapotranspiration to the decrease in runoff depth are 95.42%, 4.68%, and −0.10%, respectively. In the XM-controlled area, the contributions of the underlying surface, precipitation and potential evapotranspiration to the decrease in runoff depth are 89.54, 8.29 and 2.18%, respectively.
3) From 1982 to 2014, coal mining and vegetation restoration were the main causes of runoff reduction in the Kuye River basin.
Data Availability Statement
The original contributions presented in the study are included in the article/supplementary material, further inquiries can be directed to the corresponding authors.
Author Contributions
Conceptualization XM and XJ; methodology YH, XM, XJ, and JS; Writing original draft preparation, YH; Writing review and editing, XM and XJ All authors have read and agreed to the published version of the manuscript.
Funding
This research was jointly supported by the National Natural Science Foundation of China (Grant No. 51779209), the China Postdoctoral Science Foundation (Grant No. 2018M633602), Postdoctoral Research Fund of Shaanxi Province (Grant No. 2017BSHEDZZ144), and the Natural Science Basic Research Plan in Shaanxi Province of China (Grant No. 2021JQ-449).
Conflict of Interest
The authors declare that the research was conducted in the absence of any commercial or financial relationships that could be construed as a potential conflict of interest.
Publisher’s Note
All claims expressed in this article are solely those of the authors and do not necessarily represent those of their affiliated organizations, or those of the publisher, the editors and the reviewers. Any product that may be evaluated in this article, or claim that may be made by its manufacturer, is not guaranteed or endorsed by the publisher.
Acknowledgments
We would also like to thank the reviewers and editors for their valuable comments and suggestions.
References
Allen, R. G., Pereira, L. S., Raes, D., and Smith, M. (1998). Crop Evapotranspiration Guidelines for Computing Crop Water Requirements. Rome, Italy: FAO. FAO Irrigation and Drainage Paper no. 56.
Blöschl, G., Bierkens, M. F. P., Chambel, A., Cudennec, C., Destouni, G., James, A. F., et al. (2019). Twenty-Three Unsolved Problems in Hydrology (UPH)-a Community Perspective. Hydrol. Sci. J. 64, 1141–1158. doi:10.1080/02626667.2019.1620507
Brown, A. E., Zhang, L., McMahon, T. A., Western, A. W., and Vertessy, R. A. (2005). A Review of Paired Catchment Studies for Determining Changes in Water Yield Resulting from Alterations in Vegetation. J. Hydrol. 310, 28–61. doi:10.1016/j.jhydrol.2004.12.010
Choudhury, B. (1999). Evaluation of an Empirical Equation for Annual Evaporation Using Field Observations and Results from a Biophysical Model. J. Hydrol. 216, 99–110. doi:10.1016/S0022-1694(98)00293-5
Grafton, R. Q., Pittock, J., Davis, R., Williams, J., Fu, G., Warburton, M., et al. (2013). Global Insights into Water Resources, Climate Change and Governance. Nat. Clim. Change 3, 315–321. doi:10.1038/nclimate1746
Grill, G., Lehner, B., Thieme, M., Geenen, B., Tickner, D., Antonelli, F., et al. (2019). Mapping the World's Free-Flowing Rivers. Nature 569, 215–221. doi:10.1038/s41586-019-1111-9
Guo, Q. L., Chen, X. H., Dou, C. F., Liu, P. W., and Zhang, C. S. (2016). Study on the Variation of Annual Runoff and Influencing Factors in Kuye River during the Past 60 Years. J. Soil Water Conserv. 30, 90–95. (in Chinese).
Haddeland, I., Heinke, J., Biemans, H., Eisner, S., Flörke, M., Hanasaki, N., et al. (2014). Global Water Resources Affected by Human Interventions and Climate Change. Proc. Natl. Acad. Sci. U. S. A. 111, 3251–3256. doi:10.1073/pnas.1222475110
He, Y., Hu, Y., Song, J., and Jiang, X. (2021). Variation of Runoff between Southern and Northern China and Their Attribution in the Qinling Mountains, China. Ecol. Eng. 171, 106374. doi:10.1016/j.ecoleng.2021.106374
He, Y., Song, J., Hu, Y., Tu, X., and Zhao, Y. (2019). Impacts of Different Weather Conditions and Landuse Change on Runoff Variations in the Beiluo River Watershed, China. Sustain. Cities Soc. 50, 101674. doi:10.1016/j.scs.2019.101674
He, Y., Wang, F., Mu, X., Guo, L., Gao, P., and Zhao, G. (2017). Human Activity and Climate Variability Impacts on Sediment Discharge and Runoff in the Yellow River of China. Theor. Appl. Climatol. 129, 645–654. doi:10.1007/s00704-016-1796-8
He, Y., Wang, F., Mu, X., Yan, H., and Zhao, G. (2015). An Assessment of Human versus Climatic Impacts on Jing River Basin, Loess Plateau, China. Adv. Meteorol. 2015, 478739. doi:10.1155/2015/478739
He, Y., Wang, F., Tian, P., Mu, X.-M., Gao, P., Zhao, G.-J., et al. (2016). Impact Assessment of Human Activities on Runoff and Sediment of Beiluo River in the Yellow River Based on Paired Years of Similar Climate. Pol. J. Environ. Stud. 25, 121–135. doi:10.15244/pjoes/60492
Hu, J., Wu, Y., Wang, L., Sun, P., Zhao, F., Jin, Z., et al. (2021). Impacts of Land-Use Conversions on the Water Cycle in a Typical Watershed in the Southern Chinese Loess Plateau. J. Hydrol. 593, 125741. doi:10.1016/j.jhydrol.2020.125741
Hu, Y., and He, Y. (2021). Attribution Analysis of Runoff Variation in the Yue River Watershed of the Qinling Mountains. Adv. Meteorol. 2021, 1238546. doi:10.1155/2021/1238546
Li, D., Lu, X., Overeem, I., Walling, D. E., Syvitski, J., Kettner, A. J., et al. (2021). Exceptional Increases in Fluvial Sediment Fluxes in a Warmer and Wetter High Mountain Asia. Science 374, 599–603. doi:10.1126/science.abi9649
Li, L., Ni, J., Chang, F., Yue, Y., Frolova, N., Magritsky, D., et al. (2020). Global Trends in Water and Sediment Fluxes of the World's Large Rivers. Sci. Bull. 65, 62–69. doi:10.1016/j.scib.2019.09.012
Liang, K., Liu, C., Liu, X., and Song, X. (2013). Impacts of Climate Variability and Human Activity on Streamflow Decrease in a Sediment Concentrated Region in the Middle Yellow River. Stoch. Env. Res. Risk. A 27, 1741–1749. doi:10.1007/s00477-013-0713-2
Mann, H. B. (1945). Nonparametric Tests against Trend. Econometrica 13, 245–259. doi:10.2307/1907187
Masson-Delmotte, V., Zhai, P., Pirani, A., Connors, S. L., Péan, C., Berger, S., et al. (2021). “IPCC, 2021: Summary for Policymakers,” in Climate Change 2021: The Physical Science Basis. Contribution of Working Group I to the Sixth Assessment Report of the Intergovernmental Panel on Climate Change (Cambridge: Cambridge University Press). In Press.
Milly, P. C. D. (1994). Climate, Soil Water Storage, and the Average Annual Water Balance. Water Resour. Res. 30, 2143–2156. doi:10.1029/94WR00586
Ning, T., Li, Z., and Liu, W. (2016). Separating the Impacts of Climate Change and Land Surface Alteration on Runoff Reduction in the Jing River Catchment of China. Catena 147, 80–86. doi:10.1016/j.catena.2016.06.041
Pettitt, A. N. (1979). A Non-parametric Approach to the Change-Point Problem. Appl. Stat. 28, 126–135. doi:10.2307/2346729
Song, J., Yang, Z., Xia, J., and Cheng, D. (2021). The Impact of Mining-Related Human Activities on Runoff in Northern Shaanxi, China. J. Hydrology 598, 126235. doi:10.1016/j.jhydrol.2021.126235
Sood, A., and Smakhtin, V. (2015). Global Hydrological Models: A Review. Hydrol. Sci. J. 60, 549–565. doi:10.1080/02626667.2014.950580
Sun, P., Wu, Y., Wei, X., Sivakumar, B., Qiu, L., Mu, X., et al. (2020). Quantifying the Contributions of Climate Variation, Land Use Change, and Engineering Measures for Dramatic Reduction in Streamflow and Sediment in a Typical Loess Watershed, China. Ecol. Eng. 142, 105611. doi:10.1016/j.ecoleng.2019.105611
Walling, D. E., and Fang, D. (2003). Recent Trends in the Suspended Sediment Loads of the World's Rivers. Glob. Planet. Change 39, 111–126. doi:10.1016/S0921-8181(03)00020-1
Yang, D., Sun, F., Liu, Z., Cong, Z., Ni, G., and Lei, Z. (2007). Analyzing Spatial and Temporal Variability of Annual Water-Energy Balance in Nonhumid Regions of China Using the Budyko Hypothesis. Water Resour. Res. 43, W04426. doi:10.1029/2006WR005224
Yang, H., Yang, D., Lei, Z., and Sun, F. (2008). New Analytical Derivation of the Mean Annual Water-Energy Balance Equation. Water Resour. Res. 44, W03410. doi:10.1029/2007WR006135
Yue, X., Mu, X., Zhao, G., Shao, H., and Gao, P. (2014). Dynamic Changes of Sediment Load in the Middle Reaches of the Yellow River Basin, China and Implications for Eco-Restoration. Ecol. Eng. 73, 64–72. doi:10.1016/j.ecoleng.2014.09.014
Zhang, X., She, D., Hou, M., Wang, G., and Liu, Y. (2021). Understanding the Influencing Factors (Precipitation Variation, Land Use Changes and Check Dams) and Mechanisms Controlling Changes in the Sediment Load of a Typical Loess Watershed, China. Ecol. Eng. 163, 106198. doi:10.1016/j.ecoleng.2021.106198
Keywords: runoff variation, budyko hypothesis, the loess plateau, kuye river basin, underlying surface changes
Citation: He Y, Mu X, Jiang X and Song J (2022) Runoff Variation and Influencing Factors in the Kuye River Basin of the Middle Yellow River. Front. Environ. Sci. 10:877535. doi: 10.3389/fenvs.2022.877535
Received: 16 February 2022; Accepted: 09 June 2022;
Published: 08 July 2022.
Edited by:
Ana Maria Tarquis, Polytechnic University of Madrid, SpainReviewed by:
David Rivas Tabares, Centro de Estudios e Investigación para la Gestión de Riesgos Agrarios y Medioambientales (CEIGRAM), SpainYiping Wu, Xi’an Jiaotong University, China
Copyright © 2022 He, Mu, Jiang and Song. This is an open-access article distributed under the terms of the Creative Commons Attribution License (CC BY). The use, distribution or reproduction in other forums is permitted, provided the original author(s) and the copyright owner(s) are credited and that the original publication in this journal is cited, in accordance with accepted academic practice. No use, distribution or reproduction is permitted which does not comply with these terms.
*Correspondence: Xingmin Mu, OTYzOTE2MzM3QHFxLmNvbQ==; Xiaohui Jiang, eGhqaWFuZ0Bud3UuZWR1LmNu