 Osman Habeşoğlu
 Ahmed Samour
 Turgut Tursoy
 Mohsen Ahmadi
 Lazim Abdullah3*
 Mahmod Othman
95% of researchers rate our articles as excellent or good
Learn more about the work of our research integrity team to safeguard the quality of each article we publish.
Find out more
ORIGINAL RESEARCH article
Front. Environ. Sci. , 12 April 2022
Sec. Environmental Economics and Management
Volume 10 - 2022 | https://doi.org/10.3389/fenvs.2022.876809
This article is part of the Research Topic Financial and Trade Globalization, Greener Technologies and Energy Transition View all 46 articles
The current empirical literature ignores the possible influence of oil prices on environmental degradation through fiscal policy instruments. Contributing to the literature, this study explores the influence of oil price on the environmental degradation in Turkey through fiscal policy instruments, using a novel methodology of the bootstrap ARDL approach. The FMOLS, CCR, DOLS, and ARDL models are used to examine the long-run linkage among the tested variables. The findings from estimating models demonstrated that government expenditures positively affected environmental degradation in Turkey. In contrast, the taxation revenues negatively affected the environmental degradation. Furthermore, the empirical outcomes affirm that oil prices have a powerful effect on the levels of Turkey’s environmental pollution through taxation revenues, energy, and GDP factors. Therefore, the study suggests that the Turkish policymakers should design policies to avoid any undesirable impacts of the spillover effects of the oil price on the environment using fiscal policy channels. In this sense, the government in Turkey should design a framework that includes financial incentives such as low taxation rates on green energy investment. In addition, the policy markets in Turkey should start to use the carbon tax policy, which is one of the most efficient tools to reduce environmental pollution.
In recent years, there have been a growing number of empirical studies on the environmental Kuznets curve hypothesis (EKC-H). According to the EKC-H, environmental quality deteriorates by increasing
According to recent empirical studies, oil price volatility significantly impacts several economic factors (see, e.g., Mahmood and Murshed, 2021; Su et al., 2021; Xia et al., 2022). The significant impact of the oil price on economic factors can be explained by some factors such as petroleum-exporting economics vs. petroleum-importing economics. In petroleum-importing economics, an oil price negatively affects the real-actual income. In this context, if oil prices increase, inflation rates will increase, leading to an increase in the rate of interest and taxation rates. Hence, any increase in interest rates and tax rates will lead to an increase in the cost of finance sources. Subsequently, it will lead to a decline in the total of new investments and energy consumption levels. However, the main objective of this research is to test the influence of the oil price on the level of carbon emission through the fiscal policy channels.
The fiscal policy is one of the main significant instruments for any government to regulate and improve the economy. In this context, the government’s expenditures on goods and services and tax revenues can be defined as the main significant fiscal policy instruments. However, fiscal instruments play a significant role in achieving main macroeconomic goals such as economic development, a stable external balance, and price stability (Katircioglou and Katircioglou 2018). There are two types of fiscal policies: the tight fiscal policy and expansionary fiscal policy. The tight fiscal policy can be used in economic prosperity times. For instance, during economic prosperity, the inflation rates can often jump to high rates. To reduce the inflation rates, the government’s policymakers may use the tight fiscal policy to reduce the money supply and aggregate demand, which in turn leads to a decline in the output and price levels (Rafique et al., 2021). However, the tight fiscal policy works by increasing the tax rates and/or decreasing government expenditures, while the expansionary fiscal policy involves tax rate cuts and increases government expenditures on projects, which leads to an increase in the money supply to the markets. Hence, any change in the fiscal policy has a powerful influence on the economic performance. Subsequently, it will affect energy consumption, which in turn may affect environmental degradation.
In the current literature, limited studies tested the impact of the fiscal policy on the level of carbon emissions. (See. Frederik and Lundström, 2001; He et al., 2019; Katircioglou and Katircioglou 2018; Shahzad et al., 2022). However, the study suggests that fiscal policies may affect the level of environmental degradation from two angles. First, the policymakers can use fiscal policy instruments to mitigate carbon emissions by using carbon taxes. However, the carbon tax is one of the sufficient instruments to reduce carbon emissions, which provides an incentive tool for markets to use more environmental friendly production processes. Subsequently, this process will lead to reducing the carbon emission levels. Second, the policymakers can use fiscal policy instruments to mitigate carbon emissions by supporting green energy projects. For instance, reducing the tax rates on green energy investment, which in turn leads to a decrease in the
Turkey is a developing economy; it represents an important investigation topic for exploring the interaction among the prices of oil, consumption of energy, GDP, fiscal policy, and
Although Turkey has faced some crises, such as the 2001 crisis, the Turkish banking sector experienced a positive development from 2002 to 2015; for example, the credits provided by the banking sector to the private sector reached around 50% of GDP. On the other hand, Turkey, as an emerging economy, is still not a forerunner in international policies and makes efforts to tackle the challenges of climate change (Altarhouni et al., 2021). The changes in the amount of energy consumption followed an interesting path over the last few years in Turkey. Figure 1 shows that Turkey’s renewable energy consumption was 14% of the total energy consumption in 2014. In contrast, Turkey’s nonrenewable energy consumption represented more than 86% of the total energy consumption in 2014. However, Turkey is an energy-importing country; more than 50% of the energy needed is imported from other countries. Turkey mainly imports oil from Russia, Iraq, Kazakhstan, and India. Hence, as a strong petroleum-importing economy, Turkey is directly affected by any significant change in oil prices. However, the prime objective of the present research study is to explore the influence of oil prices on the level of carbon emissions through fiscal policy, energy, and economic growth.
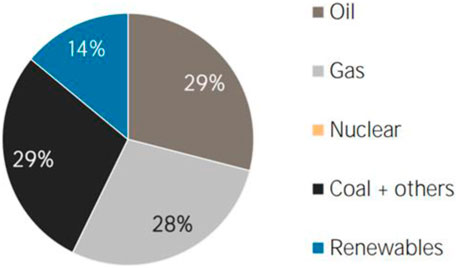
FIGURE 1. Share of renewable energy supply from the total energy consumption in Turkey in 2014: Source: International renewable energy agency
The research structure is organized as follows: the second section introduces the review of empirical literature; the third section introduces data, models, and methodology; the fourth and fifth sections show the empirical findings and the conclusion, respectively.
Numerous empirical studies have tested the validity of the EKC using a variety of environmental metrics. For instance, (Anwar et al., 2022; Ali et al., 2022; Minlah and Zhang,2021; Altarhouni et al., 2021; Abumunshar et al., 2020; Leal and Marques, 2020; Shahbaz and Sinha, 2019; Nathaniel et al., 2019). Leal and Marques (2020) affirmed that the EKC is valid in 2020 OECD countries. Altıntaş and Kassouri (2020) tested the EKC in 14 European countries. The empirical outcomes affirmed that the EKC was accepted in 14 EU countries for the 1990–2014 period. Minlah and Zhang (2021) investigated the EKC in Ghana over the examined period from 1960 to 2014. The empirical outcomes revealed that the EKC is valid for the tested period. Similarly, Altarhouni et al. (2021) confirmed that the EKC was valid in Turkey from 1981 to 2016. However, these studies affirmed that an increase in economic growth levels would increase the level of
In the current empirical literature, various studies investigated the link between renewable energy and nonrenewable energy consumption and the level of
On the other hand, several empirical studies tested the impact of REC on environmental pollution (Fatima et al., 2020; Wang et al., 2021; Paramati et al., 2022). In this sense, Shafiei and Salim (2014) tested the association between REC and environmental pollution in different selected OECD countries from 1980 to 2011. The findings found an inverse linkage between REC and environmental pollution using the AMG panel data testing model. Bilgili et al. (2016) analyzed the influence of REC on
Enormous empirical studies have explored the interaction between macroeconomic variables and carbon emissions, whereas the studies that tested the impact of the fiscal policy on carbon emissions are limited. Frederik and Lundström (2001) used the fixed-effect testing model and tested the influence of the government size on
The empirical studies that explored the impact of oil prices on environmental degradation levels are varied. In this context, Wong et al. ( 2013) tested the impact of oil prices on environmental degradation from 1980 to 2010. The outcomes showed that the oil price harms carbon emission levels for selective OECD economies. Mensah et al. (2019) used the panel ARDL method and indicated that the oil price harms environmental pollution levels. Malik et al. (2020) tested Pakistan’s oil price and the environmental pollution link. Using the ARDL testing model, the outcomes indicated that the oil price negatively influences environmental degradation. Zhao et al. (2021) explores the impact of oil price fluctuations on the levels of environmental degradation. Applying the ARDL method, the outcomes illustrated that the oil price increases environmental pollution in Pakistan in the short run. At the same time, they were decreasing environmental pollution in the long run. Li et al. (2020) investigated the impact of energy prices on China’s environmental degradation. Using the STIRPAT model, the outcomes illustrated that the oil price adversely influences China’s environmental degradation. Haque (2020) tested crude oil on carbon dioxide emissions. The results indicated that the oil price negatively affected carbon emission in Gulf Cooperation Council countries over the 1985–2014 period. Abumunshar et al. (2020) approved that oil prices negatively affected the levels of carbon emissions. In the causal connection between oil price and
The conventional EKC model is employed to examine the linkage between economic growth (GDP) and the level of
where
where
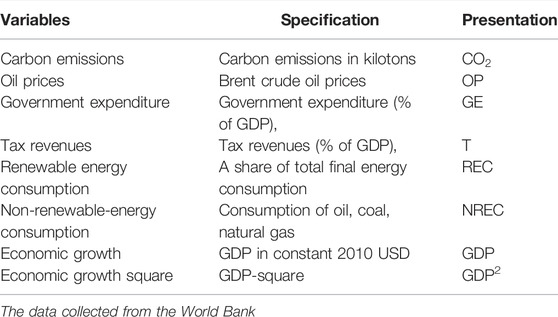
TABLE 1. Variable specification and source of the data.
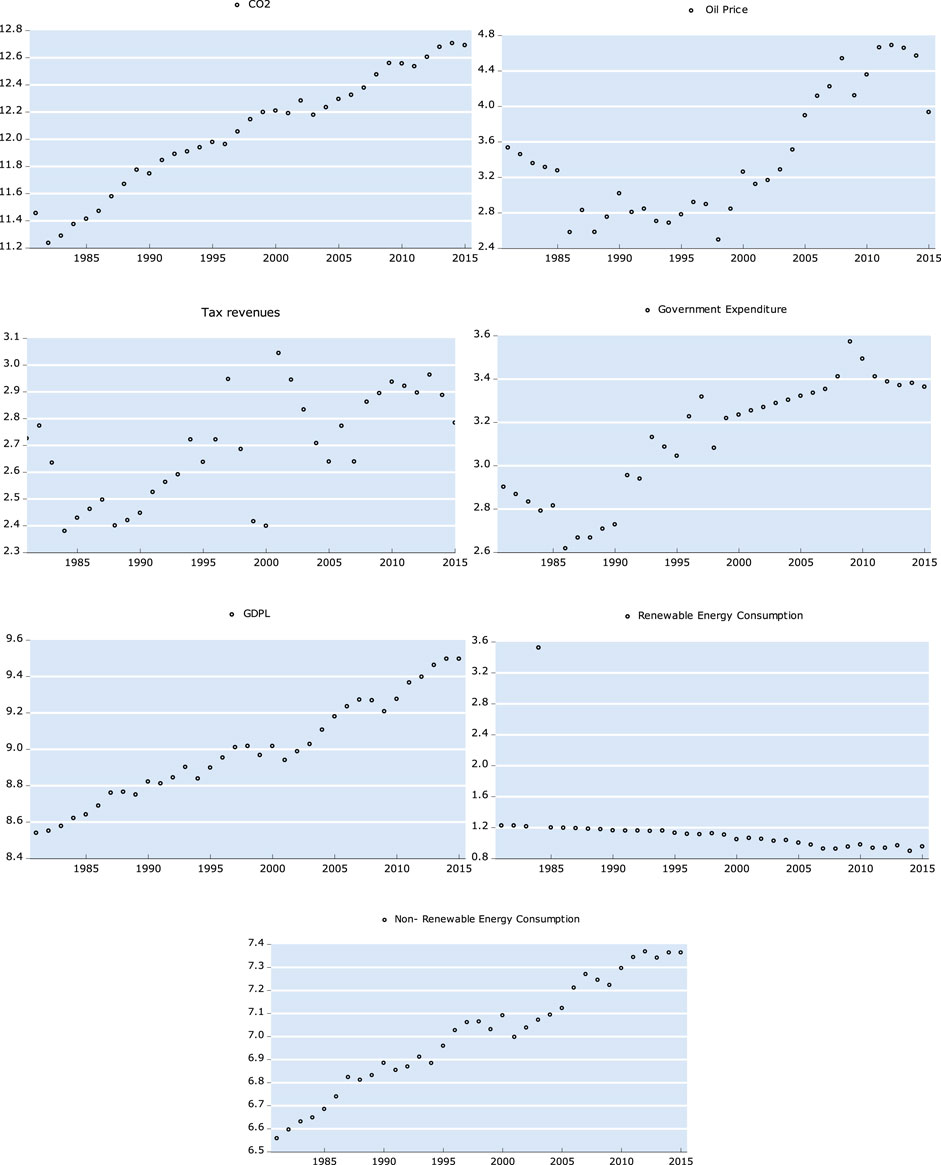
FIGURE 2. Tested time series at the natural logarithm over the period from 1981 to 2015.
The current study uses two unit-root tests with structural-break dates to explore the stationary level among the tested variables. The study uses the test by Zivot-Andrews, (2002) with one break date and the Perron and Vogelsang (1993) test with two break dates. To check the co-integration among the investigated variables, the study applies the B-ARDL testing technique. The new technique of the ARDL approach is preferred over other co-integration techniques due to its advantage in estimating while addressing the statistical issues of size weakness, which other co-integration tests failed to address. Moreover, the B-ARDL (McNown et al., 2018) technique is preferred over other co-integration tests due to the new approach, concerning the integration features of the tested order. Hence, the prime objective of this study is to present a new perspective by exploring the link among tested variables using the B-ARDL (McNown et al., 2018) technique. This test includes a t-test
The critical values of the new technique of the ARDL test are generated on the specific features of integration for each studied series. Subsequently, this procedure will eliminate unstable outcomes of the ARDL-bound testing model. The CV generation in the novel method of B-ARDL is based on bootstrap simulation; however, the updated method of ARDL aims to present better outcomes than other co-integrations techniques. For instance, the CV in the traditional ARDL test allows for (1) investigated variables to be endogenous (Samour et al., 2022), whereas the CV in the B-ARDL test allows for the endogeneity of all tested explanatory variables. Furthermore, the B-ARDL testing technique is more recommended for time-series models that include more than one explanatory tested variable (McNown et al., 2018).
The examined ARDL model (
where ∆ is the first difference operator, and
where represents a change in
To affirm the reliability of ARDL results and avoid functional form misspecification caused by the volatility of the series, diagnostic tests for the parameters are required. The study uses some diagnostic tests to check the stability of the models. In this regard, the study employed the normality test
Furthermore, the stability of the ARDL testing model can be checked by using the (CUSUM and CUSUM square) tests. To affirm the ARDL findings in the long run, the study uses the following estimating tests: the fully modified least squares (FM-OLS) regression, as introduced by Phillips and Hansen, (1990), canonical co-integrating regression (CCR.) as developed by Park (1992), co-integrating regression, and dynamic-OLS (DOLS), as developed by Stock and Watson (1993). These estimating tests use different corrective techniques except for the bias and non-centrality of the second-order. It is, therefore, imperative to apply these tests to affirm the long-run linkage among OP, GE, T, GDP, GD
The causal linkage among
The outcomes of Perron–Vogelsang and Zivot–Andrews unit root tests are displayed in Table 2. The outcomes are revealed that all the explored variables are not integrated at the level while the findings showed that the variables of the tested model are stationary at the first-difference process. The outcomes show

TABLE 2. The outcomes of the Perron–Vogelsang unit roots test
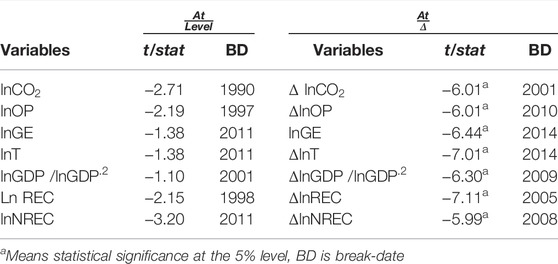
TABLE 3. The outcomes of Zivot/Andrews unit roots test.
The B-ARDL (McNown et al., 2018) co-integration test outcomes are displayed in Table 4. The outcomes of B-ARDL indicate that the values of F/Pesaran, T
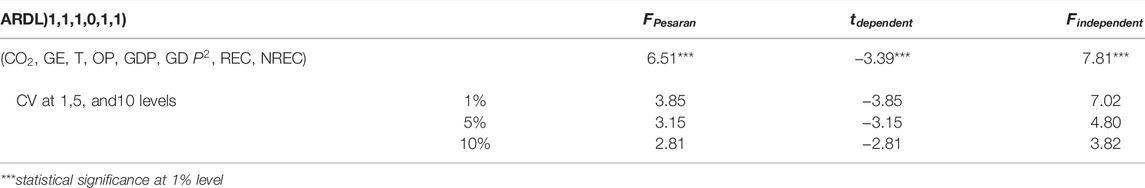
TABLE 4. The results of the B-ARDL approach
The coefficients of tested variables are estimated using the following models: the ARDL, FM-OLS, D-OLS, and CCR models. The long-term coefficients from the ARDL testing model displayed in Table 5 and the long-run outcomes from the ARDL testing model illustrate that the coefficient of government expenditures is positively and significantly linked with carbon emissions. If the government expenditures increased 1%,
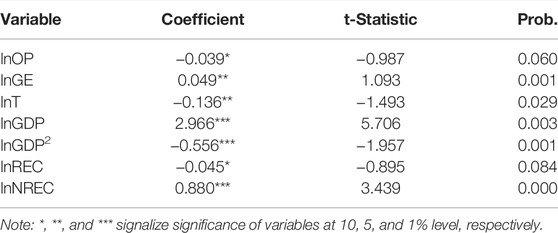
TABLE 5. Long-run coefficients in ARDL testing model
The long-run results from FMOLS, CCR, and DOLS testing models are displayed in Table 6. The findings from FMOLS and CCR show that the coefficients of government expenditures are positively and significantly linked with carbon emissions. However, the coefficients from FMOLS and CCR models confirmed the ARDL findings in the long run and provided strong evidence that there is a positive linkage between government expenditures and Turkey’s
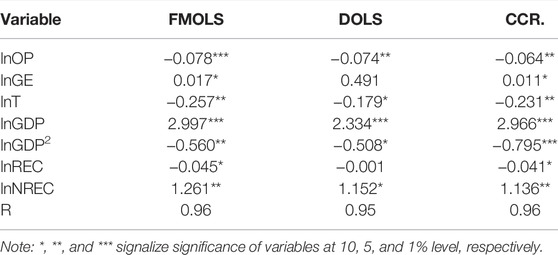
TABLE 6. FMOLS, DOLS, and CCR testing models
On the other hand, the findings of FMOLS, CCR, and DOLS testing models show that the coefficients of GDP are positively and significantly linked to emission levels, while the coefficients of GDP2 negatively and significantly linked with
Furthermore, the coefficients of NREC from FMOLS, DOLS, and CCR are positively and significantly linked with the levels of emissions. These outcomes are in line with those of Alola and Donve, (2021), who affirmed that NREC positively influences carbon emission in Turkey over the period from 1965 to 2014, while the coefficients of REC in FMOLS and CCR are negatively and significantly linked with
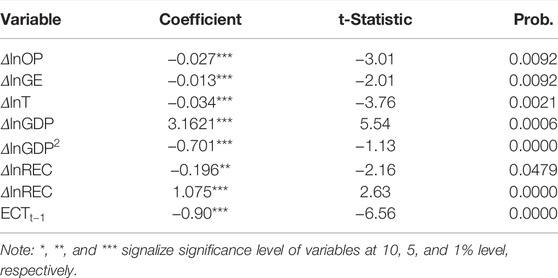
TABLE 7. The results of the ARDL testing model in short-run.
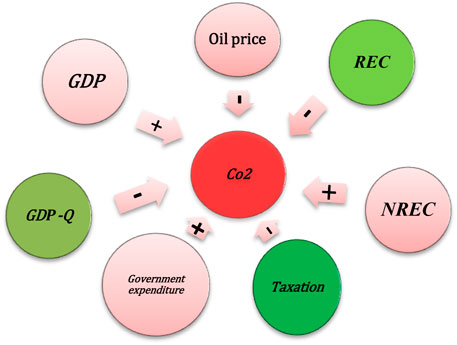
FIGURE 3. Shows the linkage among the variables.
Table 8 shows the outcomes of the diagnostic tests; the findings of the
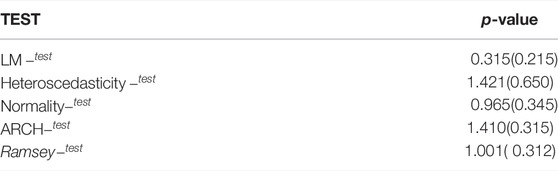
TABLE 8. The outcomes of Diagnostic tests

FIGURE 4. Stability test using (CUSUM) and (CUSUMQ).
The values of
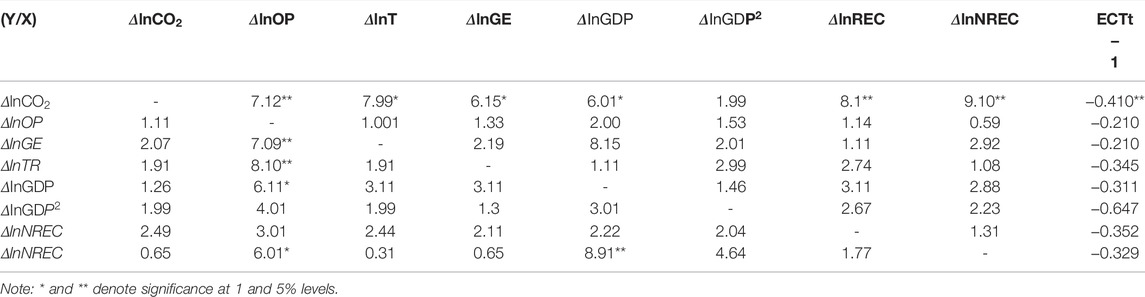
TABLE 9. Outcomes of Granger-causality approach
Moreover, a significant change in oil prices may affect consumer options by shifting their consumption from oil sources to renewable energy sources such as solar sources. Hence, the level of REC will increase, and consumption of oil, gas, and coal will decrease, which in turn will lead to a decrease in the levels of
The current study explores the influence of oil price, fiscal policy, REC, NREC, and GDP on the levels of Turkey’s carbon emissions over the investigated period 1981–2015. Several empirical studies have evaluated the impact of oil prices on the environmental quality. However, the possible influence of oil prices on carbon emissions through fiscal policy channels has been ignored. For this purpose, the study aims to present a new perspective to the literature by exploring the effect of oil price on the level of carbon through the fiscal policy channel. Furthermore, the current research uses a novel co-integration technique of ARDL, as presented by (McNown et al., 2018), to examine the tested variables. The new technique of the ARDL approach is preferred over other co-integration techniques due to its advantage in estimating while addressing the statistical issues of size weakness. The FMOLS, DOLS, CCR, and ARDL testing models are utilized to examine the long-run linkage among the selected variables.
The findings from estimating models demonstrated that government expenditures positively affected environmental degradation in Turkey. In contrast, the taxation revenues affected the environmental degradation negatively from 1981 to 2015. Moreover, the outcomes of this research from four estimating models show that the GDP coefficients are positive, and the coefficients of GDP square are negative. These outcomes approved that the EKC is accepted in Turkey. Moreover, the findings show that the coefficients of nonrenewable energy are positively and statistically significant in the estimating models, while the results confirm that increased renewable energy would result in the decreased levels of
These policies may improve the environmental quality in Turkey, but they will lead to limiting its dependency on foreign suppliers of fossil fuel energy. In addition, Turkey should design new green economics policies to limit the negative impact of income on the environmental quality. Third, the study shows that taxation revenues have a significant impact on improving the environmental quality. It is noteworthy that Turkey is mindful that the rise in the number of global emissions of GHGs presents a danger to humanity’s future and that this situation significantly affects developing countries. For different reasons, fiscal and other financial incentives may be appropriate and efficient tools, in particular, to promote the production and implementation of new technology and to encourage investments in green energy conservation. Such incentives, however, must be structured to mitigate carbon emissions. The carbon tax policy is one of the most efficient tools to reduce the level of
The datasets presented in this study can be found in online repositories. The names of the repository/repositories and accession number(s) can be found below: https://data.worldbank.org/.
OH: engaged at all stages to participate in the writing of the manuscript. AS: project administration, supervision, methodology, and writing-original draft; MA: formal analysis and writing-original draft preparation, and investigation; LA: supervision and project administration. MO: writing-original draft. TT: finally, as a head read and adjusted the manuscript to be suitable for publication.
This work was supported by UTP-UIR International Collaborative Research Fund (015ME0-222), Universiti Teknologi PETRONAS and Research Management Office, Universiti Malaysia Terengganu.
The authors declare that the research was conducted in the absence of any commercial or financial relationships that could be construed as a potential conflict of interest.
All claims expressed in this article are solely those of the authors and do not necessarily represent those of their affiliated organizations, or those of the publisher, the editors, and the reviewers. Any product that may be evaluated in this article, or claim that may be made by its manufacturer, is not guaranteed or endorsed by the publisher.
Abumunshar, M., Aga, M., and Samour, A. (2020). Oil Price, Energy Consumption, and CO2 Emissions in Turkey. New Evidence from a Bootstrap ARDL Test. Energies 13 (21), 5588. doi:10.3390/en13215588
Adewuyi, A. O. (2016). Effects of Public and Private Expenditures on Environmental Pollution: A Dynamic Heterogeneous Panel Data Analysis. Renew. Sust. Energ. Rev. 65, 489–506. doi:10.1016/j.rser.2016.06.090
Ali, S., Can, M., Shah, M. I., Jiang, J., Ahmed, Z., and Murshed, M. (2022). Exploring the Linkage between export Diversification and Ecological Footprint: Evidence from Advanced Time Series Estimation Techniques. Environ. Sci. Pollut. Res., 1–15. doi:10.1007/s11356-022-18622-3
Alola, A. A., and Donve, U. T. (2021). Environmental Implication of Coal and Oil Energy Utilisation in Turkey: Is the EKC Hypothesis Related to Energy? Manag. Environ. Qual. Int. J. 32 (3), 543–559. doi:10.1108/meq-10-2020-0220
Altarhouni, A., Danju, D., and Samour, A. (2021). Insurance Market Development, Energy Consumption, and Turkey's CO2 Emissions. New Perspectives from a Bootstrap ARDL Test. Energies 14 (23), 7830. doi:10.3390/en14237830
Altıntaş, H., and Kassouri, Y. (2020). Is the Environmental Kuznets Curve in Europe Related to the Per-Capita Ecological Footprint or CO2 Emissions? Ecol. Indicators 113, 106187. doi:10.1016/j.ecolind.2020.106187
Anwar, M. A., Zhang, Q., Asmi, F., Hussain, N., Plantinga, A., Zafar, M. W., et al. (2022). Global Perspectives on Environmental Kuznets Curve: A Bibliometric Review. Gondwana Res. 103, 135–145. doi:10.1016/j.gr.2021.11.010
Apergis, N., and Payne, J. E. (2015). Renewable Energy, Output, Carbon Dioxide Emissions, and Oil Prices: Evidence from South America. Energ. Sourc. B: Econ. Plann. Pol. 10 (3), 281–287. doi:10.1080/15567249.2013.853713
Bernauer, T., and Koubi, V. (2006). States as Providers of Public Goods: How Does Government Size Affect Environmental Quality? SSRN Electron. J., 900487. doi:10.2139/ssrn.900487
Bilgili, F., Koçak, E., and Bulut, Ü. (2016). The Dynamic Impact of Renewable Energy Consumption on CO 2 Emissions: A Revisited Environmental Kuznets Curve Approach. Renew. Sust. Energ. Rev. 54, 838–845. doi:10.1016/j.rser.2015.10.080
Chen, W., and Geng, W. (2017). Fossil Energy Saving and CO2 Emissions Reduction Performance, and Dynamic Change in Performance Considering Renewable Energy Input. Energy 120, 283–292. doi:10.1016/j.energy.2016.11.080
Dogan, E., and Ozturk, I. (2017). The Influence of Renewable and Non-renewable Energy Consumption and Real Income on CO2 Emissions in the USA: Evidence from Structural Break Tests. Environ. Sci. Pollut. Res. 24 (11), 10846–10854. doi:10.1007/s11356-017-8786-y
Fatima, T., Shahzad, U., and Cui, L. (2020). Renewable and Nonrenewable Energy Consumption, Trade and CO2 Emissions in High Emitter Countries: Does the Income Level Matter? J. Environ. Plann. Manag. 64 (0), 1227–1251. doi:10.1080/09640568.2020.1816532
Frederik, C., and Lundström, S. (2001). Political and Economic freedom and the Environment: The Case of CO2 Emissions. Gothenburg City: Department of Economics, Göteborg University.
Ghazouani, A., Xia, W., Ben Jebli, M., and Shahzad, U. (2020). Exploring the Role of Carbon Taxation Policies on CO2 Emissions: Contextual Evidence from Tax Implementation and Non-implementation European Countries. Sustainability 12 (20), 8680. doi:10.3390/su12208680
Ghazouani, T. (2021). Impact of FDI Inflow, Crude Oil Prices, and Economic Growth on CO2 Emission in Tunisia: Symmetric and Asymmetric Analysis through ARDL and NARDL Approach.
Grossman Gene, M., and Krueger, A. B. (1993). Environment Impacts of a North American Free Trade Agreement. Mexico City: The U SMexico Free Trade Agreement.
Halkos, G. E., and Paizanos, E. Α. (2013). The Effect of Government Expenditure on the environment:An Empirical Investigation. Ecol. Econ. 91, 48–56. doi:10.1016/j.ecolecon.2013.04.002
Haque, M. I. (2020). Oil price Shocks and Energy Consumption in GCC Countries: a System-GMM Approach. Environment, Development, and Sustainability. 116, Available at: https://www.irena.org/IRENADocuments/Statistical_Profiles/Eurasia/Turkey_Eurasia_RE_SP.pdf (last access date June 10, 2021).
Jobert, T., and Karanfil, F. (2007). Sectoral Energy Consumption by Source and Economic Growth in Turkey. Energy Policy 35 (11), 5447–5456.
Katircioglu, S., and Katircioglu, S. (2018). Testing the Role of Fiscal Policy in the Environmental Degradation: the Case of Turkey. Environ. Sci. Pollut. Res. 25 (6), 5616–5630. doi:10.1007/s11356-017-0906-1
Koengkan, M., Fuinhas, J. A., and Santiago, R. (2020). The Relationship between CO2 Emissions, Renewable and Non-renewable Energy Consumption, Economic Growth, and Urbanisation in the Southern Common Market. J. Environ. Econ. Pol. 9 (4), 383–401. doi:10.1080/21606544.2019.1702902
Leal, P. H., and Marques, A. C. (2020). Rediscovering the EKC Hypothesis for the 20 Highest CO2 Emitters Among OECD Countries by Level of Globalization. Int. Econ. 164, 36–47. doi:10.1016/j.inteco.2020.07.001
Li, K., Fang, L., and He, L. (2019). How Population and Energy price Affect China's Environmental Pollution? Energy Policy 129, 386–396. doi:10.1016/j.enpol.2019.02.020
Li, K., Fang, L., and He, L. (2020). The Impact of Energy price on CO2 Emissions in China: a Spatial Econometric Analysis. Sci. Total Environ. 706, 135942. doi:10.1016/j.scitotenv.2019.135942
Magazzino, C. (2016). The Relationship Among Real GDP, CO2 Emissions, and Energy Use in South Caucasus and Turkey. Int. J. Energ. Econ. Pol. 6 (4), 672–683.
Mahmood, H., and Murshed, M. (2021). Oil price and Economic Growth Nexus in Saudi Arabia: Asymmetry Analysis. Int. J. Energ. Econ. Pol. 11 (1), 29. doi:10.32479/ijeep.11181
Malik, M. Y., Latif, K., Khan, Z., Butt, H. D., Hussain, M., and Nadeem, M. A. (2020). Symmetric and Asymmetric Impact of Oil price, FDI and Economic Growth on Carbon Emission in Pakistan: Evidence from ARDL and Non-linear ARDL Approach. Sci. Total Environ. 726, 138421. doi:10.1016/j.scitotenv.2020.138421
McNown, R., Sam, C. Y., and Goh, S. K. (2018). Bootstrapping the Autoregressive Distributed Lag Test for Cointegration. Appl. Econ. 50 (13), 1509–1521. doi:10.1080/00036846.2017.1366643
Mensah, I. A., Sun, M., Gao, C., Omari-Sasu, A. Y., Zhu, D., Ampimah, B. C., et al. (2019). Analysis on the Nexus of Economic Growth, Fossil Fuel Energy Consumption, CO2 Emissions and Oil price in Africa Based on a PMG Panel ARDL Approach. J. Clean. Prod. 228, 161–174. doi:10.1016/j.jclepro.2019.04.281
Minlah, M. K., and Zhang, X. (2021). Testing for the Existence of the Environmental Kuznets Curve (EKC) for CO2 Emissions in Ghana: Evidence from the Bootstrap Rolling Window Granger Causality Test. Environ. Sci. Pollut. Res. 28 (2), 2119–2131. doi:10.1007/s11356-020-10600-x
Namahoro, J. P., Wu, Q., Zhou, N., and Xue, S. (2021). Impact of Energy Intensity, Renewable Energy, and Economic Growth on CO2 Emissions: Evidence from Africa Across Regions and Income Levels. Renew. Sustain. Energy Rev. 147, 111233.
Nathaniel, S., Nwodo, O., Adediran, A., Sharma, G., Shah, M., and Adeleye, N. (2019). Ecological Footprint, Urbanization, and Energy Consumption in South Africa: Including the Excluded. Environ. Sci. Pollut. Res. 26 (26), 27168–27179. doi:10.1007/s11356-019-05924-2
Nwani, C. (2017). Causal Relationship between Crude Oil price, Energy Consumption and Carbon Dioxide (CO2) Emissions in Ecuador. OPEC Energ. Rev 41 (3), 201–225. doi:10.1111/opec.12102
Ocal, O., and Aslan, A. (2013). Renewable Energy Consumption-Economic Growth Nexus in Turkey. Renew. Sustain. Energ. Rev. 28, 494–499. doi:10.1016/j.rser.2013.08.036
Olamide, E., and Maredza, A. (2021). The Short and Long Run Dynamics of Monetary Policy, Oil Price Volatility and Economic Growth in the CEMAC Region. Asian Econ. Financial Rev. 11 (1), 78–89. doi:10.18488/journal.aefr.2021.111.78.89
Pao, H.-T., Yu, H.-C., and Yang, Y.-H. (2011). Modeling the CO2 Emissions, Energy Use, and Economic Growth in Russia. Energy 36 (8), 5094–5100. doi:10.1016/j.energy.2011.06.004
Paramati, S. R., Shahzad, U., and Doğan, B. (2022). The Role of Environmental Technology for Energy Demand and Energy Efficiency: Evidence from OECD Countries. Renew. Sust. Energ. Rev. 153 (January 2021), 111735. doi:10.1016/j.rser.2021.111735
Park, J. Y. (1992). Canonical Cointegrating Regressions. Econometrica 60, 119–143. doi:10.2307/2951679
Perron, P., and Vogelsang, T. J. (1993). A Note on the Asymptotic Distributions of Unit Root Tests in the Additive Outlier Model with Breaks. Braz. Rev. Econom. 13 (2), l8l–20l. doi:10.12660/bre.v13n21993.2981
Pesaran, M. H., Shin, Y., and Smith, R. J. (2001). Bounds Testing Approaches to the Analysis of Level Relationships. J. Appl. Econ. 16 (3), 289–326. doi:10.1002/jae.616
Phillips, P. C. B., and Hansen, B. E. (1990). Statistical Inference in Instrumental Variables Regression with I(1) Processes. Rev. Econ. Stud. 57 (1), 99–125. doi:10.2307/2297545
Qashou, Y., Samour, A., and Abumunshar, M. (2022). Does the Real Estate Market and Renewable Energy Induce Carbon Dioxide Emissions? Novel Evidence from Turkey. Energies 15 (3), 763.
Rafique, M. Z., Nadeem, A. M., Xia, W., Ikram, M., Shoaib, H. M., and Shahzad, U. (2021). Does Economic Complexity Matter for Environmental Sustainability? Using Ecological Footprint as an Indicator. Environ. Dev. Sustain., 0123456789. doi:10.1007/s10668-021-01625-4
Rahman, S., and Serletis, A. (2019). Oil Prices and the Stock Markets: Evidence from High Frequency Data. Energ. J. 40 (Special Issue). doi:10.5547/01956574.40.si2.srah
Samour, A., Baskaya, M. M., and Tursoy, T. (2022). The Impact of Financial Development and FDI on Renewable Energy in the UAE: A Path towards Sustainable Development. Sustainability 14 (3), 1208. doi:10.3390/su14031208
Shafiei, S., and Salim, R. A. (2014). Non-renewable and Renewable Energy Consumption and CO2 Emissions in OECD Countries: A Comparative Analysis. Energy Policy 66, 547–556. doi:10.1016/j.enpol.2013.10.064
Shahbaz, M., and Sinha, A. (2019). Environmental Kuznets Curve for CO2 Emissions: a Literature Survey. J. Econ. Stud. doi:10.1108/jes-09-2017-0249
Shahzad, U., Ferraz, D., Nguyen, H.-H., and Cui, L. (2022). Investigating the Spill Overs and Connectedness between Financial Globalization, High-Tech Industries and Environmental Footprints: Fresh Evidence in Context of China. Technol. Forecast. Soc. Change 174 (2), 121205. doi:10.1016/j.techfore.2021.121205
Stock, J. H., and Watson, M. W. (1993). A Simple Estimator of Cointegrating Vectors in Higher Order Integrated Systems. Econometrica 61, 783–820. doi:10.2307/2951763
Su, C.-W., Huang, S.-W., Qin, M., and Umar, M. (2021). Does Crude Oil price Stimulate Economic Policy Uncertainty in BRICS? Pacific-Basin Finance J. 66, 101519. doi:10.1016/j.pacfin.2021.101519
Suleiman, A., Bsisu, I., Guzu, H., Santarisi, A., Alsatari, M., Abbad, A., ., , Jaber, A., Harb, T. a., Abuhejleh, A., Nadi, N., Aloweidi, A., and Almustafa, M. (2020). Preparedness of Frontline Doctors in Jordan Healthcare Facilities to COVID-19 Outbreak. Ijerph 17 (9), 3181. doi:10.3390/ijerph17093181
Wang, Z., Ben Jebli, M., Madaleno, M., Doğan, B., and Shahzad, U. (2021). Does export Product Quality and Renewable Energy Induce Carbon Dioxide Emissions: Evidence from Leading Complex and Renewable Energy Economies. Renew. Energ. 171, 360–370. doi:10.1016/j.renene.2021.02.066
Wolde-Rufael, Y., and Mulat-Weldemeskel, E. (2021). Do environmental Taxes and Environmental Stringency Policies Reduce CO 2 Emissions? Evidence from 7 Emerging Economies. Environ. Sci. Pollut. Res. 28 (18), 22392–22408. doi:10.1007/s11356-020-11475-8
Xia, W., Apergis, N., Bashir, M. F., Ghosh, S., Doğan, B., and Shahzad, U. (2022). Investigating the Role of Globalization, and Energy Consumption for Environmental Externalities: Empirical Evidence from Developed and Developing Economies. Renew. Energ. 183, 219–228. doi:10.1016/j.renene.2021.10.084
Yuelan, P., Akbar, M. W., Hafeez, M., Ahmad, M., Zia, Z., and Ullah, S. (2019). The Nexus of Fiscal Policy Instruments and Environmental Degradation in China. Environ. Sci. Pollut. Res. 26 (28), 28919–28932. doi:10.1007/s11356-019-06071-4
Zhao, Y., Zhang, Y., and Wei, W. (2021). Quantifying International Oil price Shocks on Renewable Energy Development in China. Appl. Econ. 53 (3), 329–344. doi:10.1080/00036846.2020.1808173
Keywords: Turkey, CO2 emission, fiscal policy, bootstrap ARDL, energy
Citation: Habeşoğlu O, Samour A, Tursoy T, Ahmadi M, Abdullah L and Othman M (2022) A Study of Environmental Degradation in Turkey and its Relationship to Oil Prices and Financial Strategies: Novel Findings in Context of Energy Transition. Front. Environ. Sci. 10:876809. doi: 10.3389/fenvs.2022.876809
Received: 15 February 2022; Accepted: 22 February 2022;
Published: 12 April 2022.
Edited by:
Umer Shahzad, Anhui University of Finance and Economics, ChinaReviewed by:
Xin Zhao, Anhui University of Finance and Economics, ChinaCopyright © 2022 Habeşoğlu, Samour, Tursoy, Ahmadi, Abdullah and Othman. This is an open-access article distributed under the terms of the Creative Commons Attribution License (CC BY). The use, distribution or reproduction in other forums is permitted, provided the original author(s) and the copyright owner(s) are credited and that the original publication in this journal is cited, in accordance with accepted academic practice. No use, distribution or reproduction is permitted which does not comply with these terms.
*Correspondence: Ahmed Samour, YWhtYWQuc2Ftb3VyQG5ldS5lZHUudHI=; Lazim Abdullah, bGF6aW1fbUB1bXQuZWR1Lm15
Disclaimer: All claims expressed in this article are solely those of the authors and do not necessarily represent those of their affiliated organizations, or those of the publisher, the editors and the reviewers. Any product that may be evaluated in this article or claim that may be made by its manufacturer is not guaranteed or endorsed by the publisher.
Research integrity at Frontiers
Learn more about the work of our research integrity team to safeguard the quality of each article we publish.