
94% of researchers rate our articles as excellent or good
Learn more about the work of our research integrity team to safeguard the quality of each article we publish.
Find out more
ORIGINAL RESEARCH article
Front. Environ. Sci., 25 April 2022
Sec. Conservation and Restoration Ecology
Volume 10 - 2022 | https://doi.org/10.3389/fenvs.2022.876225
 Adnan Ahmad1,2,3†
 Shahid Ahmad4†
 Ghulam Nabi4*
 Alam Zeb2
 Muhammad Nawaz Rajpar2
 Sami Ullah2Faisal Khalid1,2
 Mujibur Rahman5Qijing Liu3Kuiling Zu6Xinle Guo7,8
 Kunyuan Wanghe9*
Regional carbon emissions related to forest cover change (FCC) and wood harvest (WH) are critical for the accurate estimates of global carbon balance over an extended time period. Using remote sensing and inventory data, this study provides a comprehensive record of FCC, WH, and their integrated carbon emissions between 1908 and 2015 in the dry temperate regions of Pakistan. Results demonstrate a significant decline in forest area (21,034 ha) at an annual rate of 0.56% from 1973 to 2015. The total WH was 24.84 million m3 (0.23 million m3 yr−1) between 1908 and 2015. Deforestation was responsible for a net loss of 1.39 million Mg C (0.018 million Mg C yr−1), while WH-related carbon emissions accounted for 11.29 million Mg C (0.52 million Mg C yr−1). The present results indicate that under the existing FCC and WH harvest scenario, the forests are acting as a net source of 0.29 million Mg C yr−1. Agriculture expansion and the heavy dependency of local communities on the forest’s resources, exclusion of conservation and local communities from forest management, insufficient monitoring, and weak law-enforcement were the striking drivers of FCC, WH, and their related emissions. These findings suggest that to maintain forest carbon and meet the communities’ requirements, counter approaches such as agriculture incentives, agroforestry, trophy hunting, alternative energy sources, and inclusion of conservation and secure community-based management are needed.
Terrestrial ecosystems act as a major carbon sink and play an important role in mitigating anthropogenic carbon emissions (Pacala et al., 2001; Pan et al., 2011; Kumar et al., 2021). Different terrestrial ecosystems have different levels of carbon storage capacity, and the conversion of land-use type from high-vegetation biomass (forest land) to a low vegetation biomass (agriculture land) results in carbon emissions into the atmosphere (Lai et al., 2016). Forests are one of the largest carbon sinks among terrestrial ecosystems and are extremely important in the global carbon cycle (Houghton, 2003; Houghton and Hackler, 2006). In addition, forest plays a crucial role in offsetting carbon emissions; however, the decrease in forest cover has compromised this potential to a large extent (Ahmad et al., 2018).
Globally, land use/land-cover changes (LULCC) in general and forest cover changes (FCC) in particular are closely linked to the extent and distribution of carbon emissions (Houghton, 2010; Schimel et al., 2001). Forests around the globe have been largely influenced by human uses, which is principally due to agriculture, and settlement expansion, and timber and fuel wood harvest (Arneth et al., 2017; Erb et al., 2017). It is estimated that annually LULCC added a total of 1.2 Pg of carbon (Pg C) to the atmosphere, which is 33% of the total global carbon emissions, which, though smaller than those from fossil fuels, but represents a persistent and cumulative source of emissions (Joshua et al., 2017; Le Quere et al., 2009; Lai et al., 2016). Similarly, between 1700 and 2000, wood harvest-related carbon emissions have been estimated to be about 86 Pg C (Hurtt et al., 2006; Arneth et al., 2017).
The historic annual flux of carbon from FCC and wood harvest (WH) is critical in the global carbon budget because it provides insights into the potential for land management to store and sink carbon (Houghton 2005; Houghton and Nassikas, 2017). Currently, net flux is about 10% of the total anthropogenic carbon (Van der Werf et al., 2009; Le Quere et al., 2009). This flux was relatively larger in the past. The history of emissions at global and regional levels provides baselines information about the response of the global carbon cycle to climatic changes (Houghton and Nassikas, 2017). Regarding carbon emissions estimates for the Inter-Governmental Panel on Climate Change (IPCC) and Global Carbon Project, the analysis by Houghton and many other long term reports are also available (Hurtt et al., 2006; Hurtt et al., 2011; Houghton et al., 2012; Ciais et al., 2014; Fuchs et al., 2015; Houghton and Nassikas, 2017). However, studies suggest that carbon emissions have been underestimated because most processes related to FCC and WH are not appropriately addressed (Arneth et al., 2017). Similarly, the global and regional estimates over an extended period of time consider individual country data submitted to IPCC and United Nations Framework Convention on Climate Change (UNFCCC). However, large uncertainties exist in estimating carbon emissions related to FCC and WH, particularly in developing countries like Pakistan, where historical carbon emissions associated with FCC and WH are relatively unknown. Therefore, regional-wise estimates are required for an accurate estimates of global carbon fluxes over an extended time period. This study is an attempts to construct carbon emissions history related to FCC and WH in Pakistan. Furthermore, this study also underlines the major drivers of FCC, WH, and related carbon emissions. The findings of the study would be useful in estimating the accurate carbon balance at the regional and global levels and will be a baseline for future research.
The study was conducted in the dry temperate forests of Chitral, Pakistan. The area lies in the heart of the Hindukush Himalaya Mountains between 35°15' to 36°55' 35°15' N and 71°12' to 73°55' E (Zeb, 2019). The total geographical area of Chitral is 14,850 km2. Topographically, the area is a hilly landscape with an altitude ranging from 1,000 m to 7,780 m. a.s.l The area is home to 77 peaks, with over 6,100 m including Tirich Mir, the highest peak in the Hindu Kush and the fifth highest peak in the world (Mannan, 2009). The area’s climate is a continental type with a hot summer and extremely cold winter. The area received an annual rainfall of 442.32 mm (Mannan, 2009; Zeb, 2019). The mean minimum temperature of the area is about 8.8°C, while the mean maximum temperature is 22.9°C. The major types of rocks are granite, limestone, phyllite, schist, slate, and marble. The soil is generally fertile and varies from clay-loam to sandy loam. The forests in the area are distributed at an elevation range between 1,500 m and 3,800 m (Mannan, 2009; Ahmad et al., 2022; Zeb, 2019). The major forest types in the area are the Sub-alpine forests, dry temperate coniferous forests, oak, and ash scrub florets. The dominant coniferous tree species include Juniperus excelsa, Abies pindrow, Picea smithiana, Pinus wallichiana, and Pinus gerardiana, the major broad-leaved trees include Betula utilis, Quercus incana, Quercus baloot, Fraxinus xanthoxylodies, Aesculus indica, Juglans regia, Acer caesium, Punica granatum, Poplus nigra, Morus alba, and Robinia pseudo-acacia (Ahmad et al., 2018; Ahmad et al., 2022).
The satellite images were obtained from the United States Geological Survey (USGS, 2017) for the years 1973, 1993, and 2015. The image of 1973 corresponds to the earliest satellite image available for this area and the images of 1993 and 2015 represents the period of the imposition of logging ban policy The supervised maximum likelihood algorithm was used for the spectral classification of the images. After classification, multi-date post-classification change detection techniques were performed to determine forest cover change following (Mannan et al., 2018; Mannan et al., 2019; Ahmad et al., 2018; Zeb, 2019). Image validation and accuracy details are given in Supplementary Table S1. To demonstrate spatiotemporal forest cover change over the entire study period, forest cover changes between 1973 and 1993, and 1993 and 2015 were measured. The net percent change in each period was calculated using Equation 1 following Ahmad et al. (2018).
Where, Δ Area represents the area of forest cover change in different periods from 1973–2015.
The average annual rate of deforestation over the respective periods was calculated using Eqn. 2 following (Puyravaud, 2003). In the equation, A1 and A2 represent the area of forest at time 1 (t1 = 1908, 1930, 1948, 1973, 1993) and time 2 (t2 = 1929, 1947, 1972, 1992, 2015).
The major human-induced causes of deforestation such as agriculture expansion, settlement expansion, logging, livestock grazing, and management regimes were also analyzed (data was obtained from the area’s management plan).
The forest carbon stock of the area was assessed from the available growing stock information in the working plan (Mannan, 2009). The carbon value of above and below-ground biomass was measured. For the above-ground biomass (ABG) carbon measurement, first stem biomass was measured from the growing stock volume and wood densities of the respective species (Haripriya, 2000; IPCC, 2006; Kumar et al., 2021; Sahoo et al., 2021). The stem biomass was then converted into total above-ground biomass using the biomass expansion factor (BEF) method proposed by IPPC, (2006). The below-ground biomass (BGB) was assessed using root to shoot ratio (R) following Adhikari et al. (1995); Amir et al. (2018), Rana et al. (1989) and Kumar et al., 2021. The carbon stock was assessed from the total biomass following Nizami, (2012); Ahmad and Nizami, (2015), and Mannan et al. (2019).
In the study area, wood is harvested for fuel wood and timber, both for sale and home use. Fuel wood and timber use for domestic purposes during the respective time periods were calculated based on the data provided in the working plan and population growth rate based on population census data. Human population census data were obtained from the Pakistan bureau of statistics (PBS, 2017). Details of commercial wood harvest over different periods from 1908 to 2015 were collected from the working plan of the area. To calculate the fuel wood and domestic timber harvest each year, we first calculated the annual fuel wood and timber requirements per household using the available information provided in the working plan of the area (Mannan, 2009). Secondly, we measured each year’s human population growth and then calculated year-wise fuel wood and domestic timber consumption over the respective periods (Details can be found in Supplementary Method 1). To calculate the year-wise fuel wood and domestic timber consumption, first, we calculated each year’s increase in population from 1908 to 2015 through Eqn. 3 and then calculated year-wise total wood consumption through Eqs. 4, 5
Where, NHC = New houses constructed each year, TRH = Timber requirements per house, HH = Household (8), AFWR = Annual fuel wood requirements.
The net reduction in the carbon stock associated with deforestation was calculated using Eqn 6. The carbon loss associated with wood harvest was measured from the total volume of wood removed using Eqn 7. Similarly, the annual accumulation of carbon in the forest was calculated from the Mean annual increment (MAI) using Eqn 8. The value of MAI was obtained from the working plan. The net carbon (gain/loss) was assessed from the total carbon gain and total carbon loss. The IPCC. (2006) guidelines were used for all measurements.
Where ΔC DF = carbon loss from deforestation yr−1 and ΔCWH = carbon loss from commercial, domestic and fuelwood harvest MAI = Mean annual increment (m3 yr−1 ha−1), BEF = Biomass expansion factor, D = wood densities of respective trees species (Kg m−3).
A continuous decrease in forest cover since 1973 is apparent and exists throughout the entire period analyzed in this study. The total forest area in 1973 was 89,938 ha, and it was 82,540 and 68,904 ha in 1992 and 2015, respectively. Over the period, a 0.56% annual change in forest land was observed. Interestingly, drastic changes in forest land were observed during 1993 and 2015 (Supplementary Table S2). The remote sensing-based land cover composition data highlights that, since 1973, (Figure 1), the area of agricultural land and other bodies increased by 6,641 and 14,392 ha, respectively, (Supplementary Figure S1).
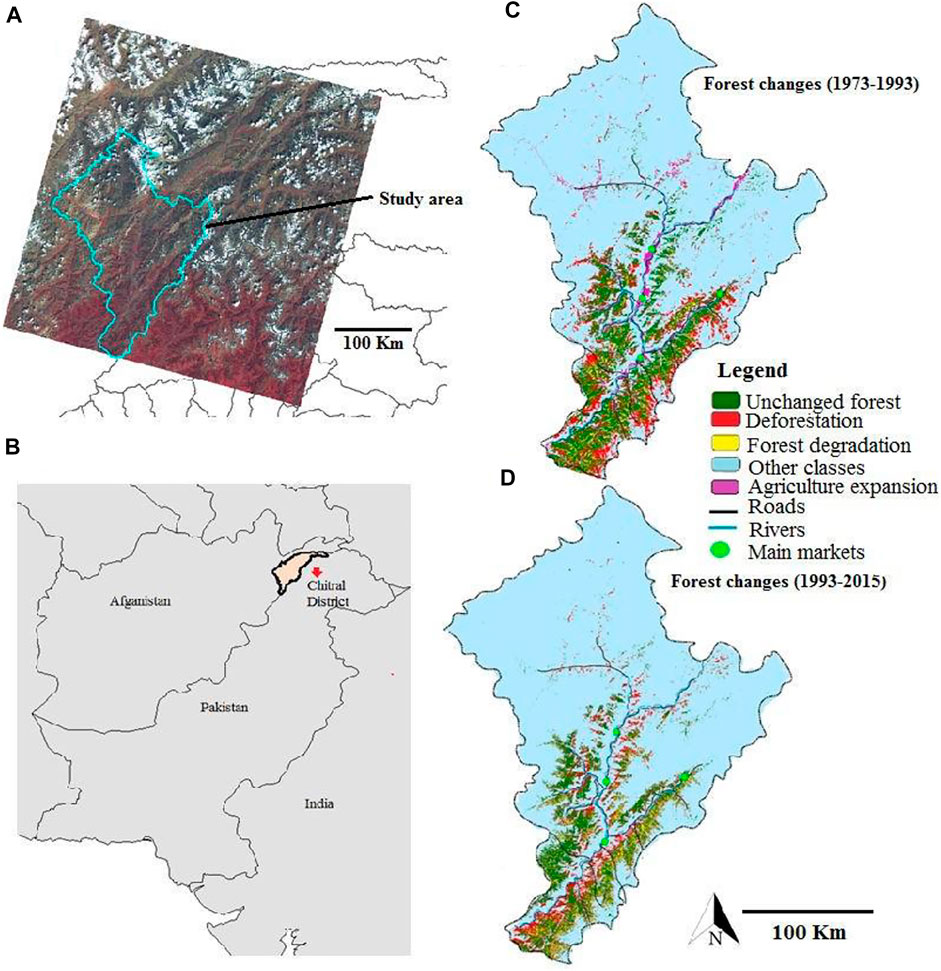
FIGURE 1. (A) study area, (B) Pakistan, (C) forest cover changes during 1973–1993 and (D) 1993–2015.
The results provide evidence that conversion of forest to agricultural land (Figure 1, Supplementary Figure S1); settlement expansion, dependency of local people on the forest for fuel wood; domestic timber (with urban expansion) and livelihood, and livestock grazing and rearing are the main drivers of deforestation (Supplementary Figures S2–S5). Our analysis (Supplementary Figures S2–S5), highlighted that about 60% of people depend on forests for fuel wood, while about 16% depend on forests as the first major livelihood source. Additionally, 36% of people are using forests as a fodder source. Similarly, between 1908 and 2015, the number of households increased by 45,222 (Supplementary materials 2), resulting in settlement expansion at the cost of forest loss. Furthermore, the higher rate of deforestation between 1993 and 2015 revealed that the logging ban policy associated with the existing forest management regime (government based with the exclusion of community and conservation), is not an effective tool for forest conservation and management (Supplementary materials 1).
Wood is harvested for fuel, domestic timber, and commercial timber. The rate of wood harvest increased over time (Table 1). A higher amount total wood was harvested from 1993 to 2015, and a lower amount was harvested during 1930–1947. Taken together, since 1908, 24.84 million m3 of wood has been removed from the forest at an annual rate of 0.234 million m3. Taking our estimates of each year’s growth as mean annual increment over the entire period (1908–2015), the forests are getting a mean annual increment of 0.238 million m3 yr−1, which is slightly more than the mean annual wood harvest for that entire time period (Table 2). However, since 1973 the amount of wood removed exceeded the mean annual increment of the forest, which is clear evidence that since 1973, annual wood harvest has been more than the annual growth. Based on the population and wood harvest trend analysis (Figures 2, 3), the rates of the annual wood harvest increased over time with an increasing population. If this increasing trend in population growth and consequential increase in wood harvest continues in the future, it will put greater pressure on forests and further increase the net wood harvest.
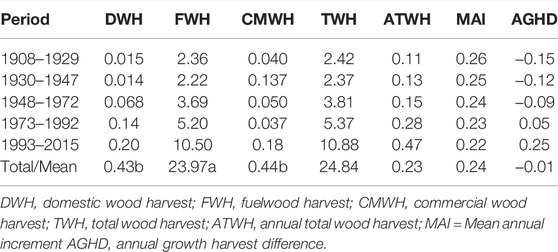
TABLE 1. Total wood harvest (million m3), annual wood harvest (million m3), annual growth (million m3), and annual growth/harvest net difference (million m3).
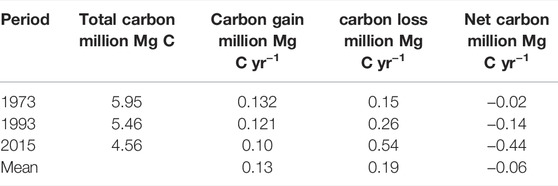
TABLE 2. Statistics of total carbon stock, mean annual increment, carbon gain, carbon loss, and net carbon over different period.S.
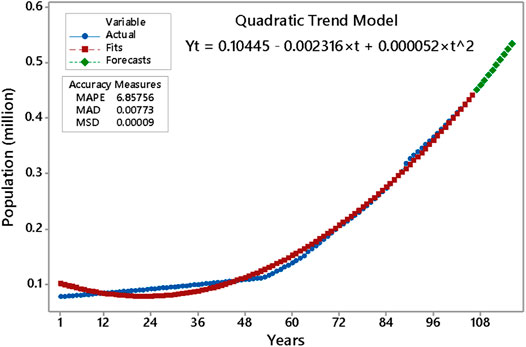
FIGURE 2. Year-wise trend in population growth (million).

FIGURE 3. Year wise trend in wood harvest (million m3).
The average carbon stock value of the forest varied between 34 ± 70 in the open forest to 98 ± 26 Mg ha−1 in dense forests, with a mean carbon value of 66.11 ± 15 Mg ha−1 (Supplementary Table S5). The total estimated carbon stock of the entire forest area for the base year (1973) was 5.95 million tons, while it was 5.46 and 4.54 million tons in 1993 and 2015, respectively, (Table 2). Over this time period, the total biomass carbon stock of the forest decreased by 1.39 million tons, which indicates a 23% decrease relative to 1908. In addition, the forests of the area have been sequestering carbon at the annual rate of 0.13 million tons (Table 2). The highest carbon sequestration and lowest carbon loss occurred in 1973, while the minimum carbon accumulation and maximum carbon loss occurred in 2015.
The calculated carbon emissions related to deforestation and wood harvest are given in Table 4. The overall net reduction in carbon is a result of deforestation and wood harvest across the entire duration (1908–2015), accounting for 12.68 million tons at the annual rate of 0.54 million tons. It is worth noting that higher emissions resulted from fuel wood. Taking our estimates of annual carbon gain and loss (Tables 2, 3), the forests act as a net carbon source.
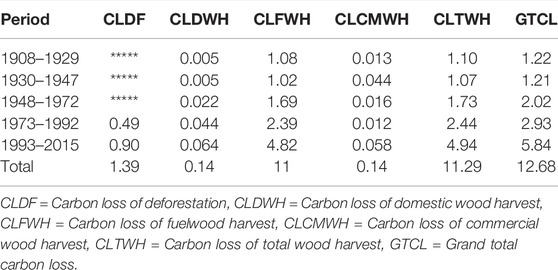
TABLE 3. Carbon emissions (million tons) related to deforestation and wood harvest.
CLDF = Carbon loss of deforestation, CLDWH = Carbon loss of domestic wood harvest, CLFWH = Carbon loss of fuelwood harvest, CLCMWH = Carbon loss of commercial wood harvest, CLTWH = Carbon loss of total wood harvest, GTCL = Grand total carbon loss.
This study underlines the historic trends of FCC in the dry temperate regions of the Hindu Kush Himalaya, Pakistan. Our results highlighted that the forests in dry temperate regions in Pakistan have been decreasing since 1973. Importantly, of all of the net forest cover loss, about 50% of forest loss occurred during 1993–2015, reflecting the non-effectiveness of the current logging ban policy under the existing management regimes. Concerning the base year (1973), the overall net forest loss (33%) between 1973 and 2015 is lower than the historical forest loss of south and southeast Asia and Oceania, but higher than Tropical Africa, North America, East Asia, and Latin America from 1850 to 2015, reported by Houghton and Nassikas (2017) (Supplementary Table S6). The overall average annual rate of deforestation since 1973 was 0.56%. This current deforestation rate is also higher than the historic deforestation rate (1850–1915) of Oceania, Tropical Africa, North America, East Asia, Latin America, and south and Southeast Asia (Houghton and Nassikas, 2015) (Supplementary Table S6). However, the present rate of deforestation is estimated to be lower than the average rate of deforestation (1.1%) in the Himalayan temperate biome (Brandt et al., 2017). With respect to the overall national deforestation rate, the current rate of deforestation is much higher from the Himalaya and Karakoram ranges (0.15 and 31%) of Pakistan (Qamer et al., 2016; Mannan et al., 2019), which is clear evidence that the existing forest management regime in the area is ineffective.
Agriculture is one of the prominent drivers across the tropics and other developing countries, accounting for about 33–40% of deforestation (Hosonuma et al., 2012; Song et al., 2018). In this study, agriculture expansion was also noted to be a major cause of deforestation (30%) in the region (Supplementary Figure S1). In the study area, agriculture is one of the major sources of meeting local demands and the source of local livelihoods and energy, thus putting huge pressures on forest land (Supplementary Figures S2, S4 ,and S5). Settlement expansion is another driver of deforestation in the area. During 1908 to 2015, an estimated 45,000 new houses were constructed in the area. Forests are a source of land and constructional timber for new settlements. A total of 7% has been acquired for new settlements over this period (Supplementary Materials S2).
The dependence of local communities on forests resources as a major livelihood source, timber harvesting (both commercial and construction), fuel wood collection, livestock grazing, and rearing are the other major drivers of deforestation. About 16.5% of people (Supplementary Figure S4) in the area are dependent on the forest for their livelihoods. The local people have the right to cut dry trees and branches for fuel wood, getting 60% of the share as a “Royalty” from commercial exploitation and construction timber for infrastructure. Wood consumption is the major energy source in the area, where more than 95% of people use wood as an energy source (Zeb, 2019). Our analysis shows (Supplementary Figure S2) that about 60% of the total population gets their fuel wood from the forests. The local communities also have the right to graze their animals in forests and collect fodder. The statistics regarding fodder sources (Supplementary Figures S3, S5) revealed that 36% of the population gets fodder from the forests. Most of the people feed their livestock through grazing. Commercial livestock rearing is one of the major income sources in the area, amounting to about 21% of local livelihoods. Moreover, our results showed that the number of livestock increased from 0.7 million to 0.71 million between 1998 and 2014, (Supplementary Table S4), indicating a possible expansion of rangelands at the cost of forest area.
Besides direct drivers, forest-management regimes and their associated policies impact the rate of deforestation as underlying driving forces (Lambin & Geist, 2006; Lambin and Meyfroidt, 2010). The high rate of deforestation in the area relative to other regions of Pakistan can be linked to the existing forest management regime and their logging ban policy. The government manages the area’s forests, where local communities have unstable and insecure rights. Inconsistent policies, exclusion of local communities from forest conservation and management, and lack of governance resulted in a high rate of deforestation. Furthermore, the imposition of the logging ban policy in 1993 shifted the pattern of forest land conversion. Before the ban, deforestation was mainly higher in subalpine and temperate coniferous forests. After the ban, deforestation shifted to Oak scrub forests as well, most likely due to fuel wood extraction, livestock grazing and shifting cultivation attributed to the population increase (Zeb, 2019). Without active community participation in forest management and the continuation of unstable local rights, decentralization might lead to unexpected outcomes (Ribot et al., 2006). The present results revealed that despite the logging ban policy, the rate of deforestation is high; therefore, changes in management regimes are needed for effective forest protection and conservation. In other parts of Pakistan, evidence shows that management regimes characterized by effective monitoring, stable community rights, and inclusion of conservation and community resulted in a lower deforestation rate and forest degradation (Qamer et al., 2016; Mannan et al., 2019). Consequently, the inclusion of community participation in forest management and decision making, with stable rights supported by a high-level of effective monitoring and law enforcement, is required for forest conservation.
Wood is harvested from the forests in the form of fuel wood and fodder collection, domestic, and commercial timber harvest. Out of the total amount of wood harvested over time, most of the wood has been removed for fuel wood (96%, Supplementary Figure S6). With an increasing population, year-wise wood harvest significantly increased over time (Figure 3, Supplementary materials 2). Furthermore, the results of the trend analysis in Figure 3, revealed that wood harvest is increasing each year and will continue in the future.
Globally, forest carbon has been largely affected due to wood harvesting for fuel and timber. Wood harvest reduces the biomass carbon stock of a forest and lowers soil carbon by reducing litter input (Arneth et al., 2017). The present finding underlines that wood harvest led to a significant carbon loss over time and accounts for 11.29 million tons at an annual rate of 0.52 million tons. Globally, from 1850 to 2015 of the total wood harvest-related carbon emissions, 54% came from fuel wood (Houghton and Nassikas 2017). However, it is worth noting that in the present study, about 97% of emissions come from fuel wood harvest (Supplementary Figure S6). This represents a substantial anthropogenic pressure on forest resources for fuel wood.
The release of total carbon related to FCC varied over time, and a higher carbon has been removed during the post-logging ban (1993–2015), which is attributed to more forest loss during this period. The integrated carbon emissions related to wood harvest and deforestation accounted for 12.68 million tons. Most of the emissions were from wood harvest, which accounted for 86%, while deforestation accounted for 14%. According to Houghton and Nassikas, (2017) at a global scale, of the total emissions related to deforestation and wood harvest, 38% emissions come from deforestation, while 62% comes from wood harvest (54% from fuel and 46% from timber). However, it is important to note that in this study, most of the emissions occurred from wood harvest, particularly from fuel wood (83%, Figure 6) which is attributed to the heavy dependency of local communities on forests for energy. With an increasing population, year-wise carbon emissions increased over time and will be continuing in future (Figures 3, 4, 5, 6, Supplementary materials 2). In the absence of alternatives and sustainable management policies, this present trend can ultimately result in more degradation. Therefore, counter mechanisms are needed to cope with the future degradation of forest resources. Such mechanisms includes the introduction of agroforestry and agriculture incentives to local communities, providing alternative sources of income, i.e., ecotourism, development of clean energy technologies, inclusion of community and conservation in forest resources management and effective law enforcement to the existing forest management regime.
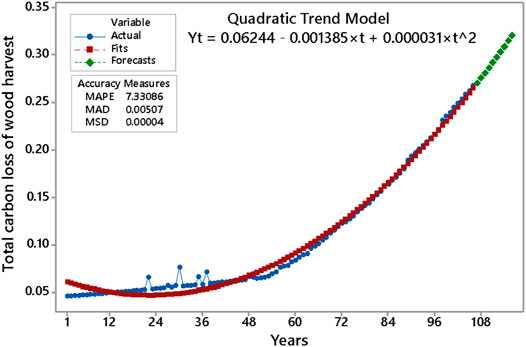
FIGURE 4. Year-wise trend in carbon loss due to wood harvest (million Mg C).
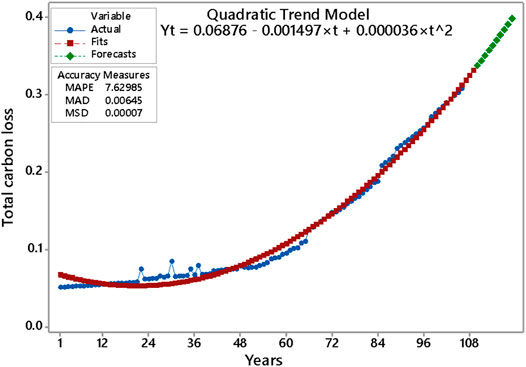
FIGURE 5. Year wise trend in carbon loss of wood harvest and deforestation.
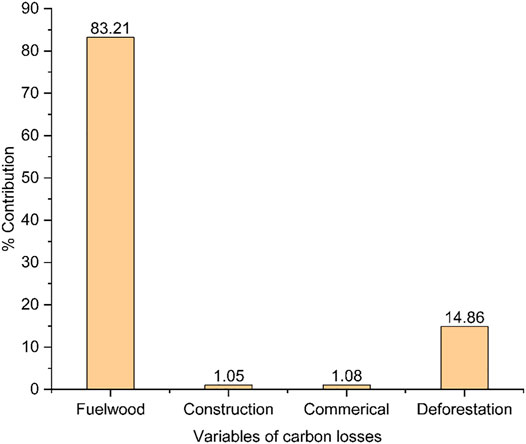
FIGURE 6. Contribution of deforestation and wood harvest to carbon loss.
This study has investigated the trend and pattern of historical carbon emissions with FCC and wood harvest in dry temperate forests of Pakistan, intending to provide baseline information for accurate estimates of regional and global carbon balance. This study also aims to develop effective forest carbon management and conservation policies. The findings indicate that agriculture and settlement expansion, people’s dependency on forests for fuel wood, timber and other livelihoods, livestock grazing and rearing, and illegal harvesting were the major drivers of FCC, wood harvest, and their related carbon emissions. The results suggest that the existing management regime and their ban policy are also a cause of deforestation. Despite a logging ban policy (in 1993), deforestation was much higher than in the past. Insufficient monitoring and law enforcement and excluding conservation and community management were the major failures of the logging ban policy. The increasing trend in population will ultimately accelerate future demand for agriculture, timber, fuel wood, settlements, and livestock. Therefore, counter approaches are needed to meet the dual goals of forest carbon conservation and fulfilling local requirements. Such approaches include increasing agriculture production on existing-cleared lands, introducing agroforestry and biodiversity conservation tools such as trophy hunting (for forest mammals and birds), and the development of alternate energy sources. Furthermore, establishing protected areas, including conservation and community-based management, and implementing sufficient monitoring and law enforcement into the existing management regimes are needed (Houghton and Hackler, 2006; Le Quere et al., 2009; Joshua et al., 2017; Mannan et al., 2018; Sahoo et al., 2021).
The original contributions presented in the study are included in the article/Supplementary Material, further inquiries can be directed to the corresponding authors.
Conceptualization: AA, SA, XG, KW. Data curation: AA, SU, FK, MR, AZ. Formal analysis: AA, SA, MR, XG. Investigation: AA, AZ, MR, QL. Writing—original draft: AA, KZ. Writing—review & editing: GN, KZ, AZ.
This work was supported by Natural Science Foundation of Qinghai Province (2022-ZJ-936Q).
The authors declare that the research was conducted in the absence of any commercial or financial relationships that could be construed as a potential conflict of interest.
All claims expressed in this article are solely those of the authors and do not necessarily represent those of their affiliated organizations, or those of the publisher, the editors and the reviewers. Any product that may be evaluated in this article, or claim that may be made by its manufacturer, is not guaranteed or endorsed by the publisher.
We are thankful to the Collage of Forestry, Beijing Forestry University for supporting this research. Sincere thanks are extending to Khyber Pakhtunkhwa Forest Department, Chitral Forest Division for providing inventory data.
The Supplementary Material for this article can be found online at: https://www.frontiersin.org/articles/10.3389/fenvs.2022.876225/full#supplementary-material
Adhikari, B., Rawat, Y., and Singh, S. (1995). Structure and Function of High Altitude Forests of central Himalaya I. Dry Matter Dynamics. Ann. Bot. 75, 237–248. doi:10.1006/anbo.1995.1017
Ahmad, A., Liu, Q.-J., Nizami, S. M., Mannan, A., and Saeed, S. (2018). Carbon Emission from Deforestation, forest Degradation and wood Harvest in the Temperate Region of Hindukush Himalaya, Pakistan between 1994 and 2016. Land Use Policy 78, 781–790. doi:10.1016/j.landusepol.2018.07.009
Ahmad, A., Ahmad, S., Nabi, G., Liu, Q.-J., Islam, N., and Luan, X. (2022). Trends in Deforestation as a Response to Management Regimes and Policy Intervention in the Hindu Kush Himalaya of Pakistan. Front. Environ. Sci. 10, 810806. doi:10.3389/fenvs.2022.810806
Ahmad, A., and Nizami, S. M. (2015). Carbon Stocks of Different Land Uses in the Kumrat valley, Hindu Kush Region of Pakistan. J. For. Res. 26, 57–64. doi:10.1007/s11676-014-0008-6
Amir, M., Liu, X., Ahmad, A., Saeed, S., Mannan, A., and Muneer, M. A. (2018). Patterns of Biomass and Carbon Allocation across Chronosequence of Chir pine (Pinus Roxburghii) forest in Pakistan: Inventory-Based Estimate. Adv. Meteorology 2018, 1–8. doi:10.1155/2018/3095891
Arneth, A., Sitch, S., Pongratz, J., Stocker, B. D., Ciais, P., Poulter, B., et al. (2017). Historical Carbon Dioxide Emissions Caused by Land-Use Changes Are Possibly Larger Than Assumed. Nat. Geosci. 10, 79–84. doi:10.1038/ngeo2882
Brandt, J. S., Allendorf, T., Radeloff, V., and Brooks, J. (2017). Effects of National forest‐management Regimes on Unprotected Forests of the Himalaya. Conservation Biol. 31, 1271–1282. doi:10.1111/cobi.12927
Ciais, P., Sabine, C., Bala, G., Bopp, L., Brovkin, V., Canadell, J., et al. (2014). “Carbon and Other Biogeochemical Cycles,” in Climate Change 2013: The Physical Science Basis. Contribution of Working Group I to the Fifth Assessment Report of the Intergovernmental Panel on Climate Change (Cambridge University Press), 465–570.
Erb, K.-H., Luyssaert, S., Meyfroidt, P., Pongratz, J., Don, A., Kloster, S., et al. (2017). Land Management: Data Availability and Process Understanding for Global Change Studies. Glob. Change Biol. 23, 512–533. doi:10.1111/gcb.13443
Fuchs, R., Herold, M., Verburg, P. H., Clevers, J. G. P. W., and Eberle, J. (2015). Gross Changes in Reconstructions of Historic Land Cover/use for Europe between 1900 and 2010. Glob. Change Biol. 21, 299–313. doi:10.1111/gcb.12714
Haripriya, G. S. (2000). Estimates of Biomass in Indian Forests. Biomass and Bioenergy 19, 245–258. doi:10.1016/s0961-9534(00)00040-4
Hosonuma, N., Herold, M., de Sy, V., de Fries, R. S., Brockhaus, M., Verchot, L., et al. (2012). An Assessment of Deforestation and forest Degradation Drivers in Developing Countries. Environ. Res. Lett. 7, 044009. doi:10.1088/1748-9326/7/4/044009
Houghton, R. A. (2003). Revised Estimates of the Annual Net Flux of Carbon to the Atmosphere from Changes in Land Use and Land Management 1850-2000. Tellus B 55, 378–390. doi:10.1034/j.1600-0889.2003.01450.x
Houghton, R. A. (2005). Aboveground forest Biomass and the Global Carbon Balance. Glob. Change Biol 11, 945–958. doi:10.1111/j.1365-2486.2005.00955.x
Houghton, R. A. (2010). How Well Do We Know the Flux of CO2 from Land-Use Change? Tellus B: Chem. Phys. Meteorology 62, 337–351. doi:10.1111/j.1600-0889.2010.00473.x
Houghton, R. A., and Hackler, J. L. (2006). Emissions of Carbon from Land Use Change in Sub-saharan Africa. J. Geophys. Res. 111, G02003. doi:10.1029/2005jg000076
Houghton, R. A., and Nassikas, A. A. (2017). Global and Regional Fluxes of Carbon from Land Use and Land Cover Change 1850-2015. Glob. Biogeochem. Cycles 31, 456–472. doi:10.1002/2016gb005546
Houghton, R. A., House, J. I., Pongratz, J., van der Werf, G. R., DeFries, R. S., Hansen, M. C., et al. (2012). Carbon Emissions from Land Use and Land-Cover Change. Biogeosciences 9, 5125–5142. doi:10.5194/bg-9-5125-2012
Hurtt, G. C., Frolking, S., Fearon, M. G., Moore, B., Shevliakova, E., Malyshev, S., et al. (2006). The Underpinnings of Land-Use History: Three Centuries of Global Gridded Land-Use Transitions, wood-harvest Activity, and Resulting Secondary Lands. Glob. Change Biol. 12, 1208–1229. doi:10.1111/j.1365-2486.2006.01150.x
Hurtt, G. C., Chini, L. P., Frolking, S., Betts, R. A., Feddema, J., Fischer, G., et al. (2011). Harmonization of Land-Use Scenarios for the Period 1500–2100: 600 Years of Global Gridded Annual Land-Carbon Emissions from Land Use and Land-Cover Change. Climatic Change 9, 117–161. doi:10.1007/s10584-011-0153-2
IPCC (2006). Intergovernmental Panel on Climate Change (IPCC)Guidelines for National Greenhouse Gas.
Joshua, P., Christopher, W., and Aaron, W. (2017). Implications of Land-Use Change on forest Carbon Stocks in the Eastern United States. Environ. Res. Lett. 12, 024011. doi:10.1088/1748-9326/aa597f
Kumar, A., Kumar, M., Pandey, R., ZhiGuo, Y., and Cabral-Pinto, M. (2021). Forest Soil Nutrient Stocks along Altitudinal Range of Uttarakhand Himalayas: An Aid to Nature Based Climate Solutions. Catena 207, 105667. doi:10.1016/j.catena.2021.105667
Lai, L., Huang, X., Yang, H., Chuai, X., Zhang, M., Zhong, T., et al. (2016). Carbon Emissions from Land-Use Change and Management in China between 1990 and 2010. Sci. Adv. 2, e1601063. doi:10.1126/sciadv.1601063
Lambin, E. F., and Geist, H. J. (2006). Land-Use and Land-Cover Change: Local Processes and Global Impacts. Springer Science & Business Media.
Lambin, E. F., and Meyfroidt, P. (2010). Land Use Transitions: Socio-Ecological Feedback versus Socio-Economic Change. Land Use Policy 27, 108–118. doi:10.1016/j.landusepol.2009.09.003
Le Quéré, C., Raupach, M. R., Canadell, J. G., Marland, G., Bopp, L., Ciais, P., et al. (2009). Trends in the Sources and Sinks of Carbon Dioxide. Nat. Geosci 2, 831–836. doi:10.1038/ngeo689
Mannan, A. (2009). “Operational Plan for the Protected Forests of Chitral forest Division,” in Forestry Planning and Monitoring circle Peshwar. Editor K. p. F. department (Pakistan.
Mannan, A., Zhongke, F., Ahmad, A., Liu, J., Saeed, S., and Mukete, B. (2018). Carbon Dynamic Shifts with Land Use Change in Margallah Hills National Park, Islamabad (Pakistan) from 1990 to 2017. Appl. Ecol. Env. Res. 16, 3197–3214. doi:10.15666/aeer/1603_31973214
Mannan, A., Liu, J., Zhongke, F., Khan, T. U., Saeed, S., Mukete, B., et al. (2019). Application of Land-Use/land Cover Changes in Monitoring and Projecting forest Biomass Carbon Loss in Pakistan. Glob. Ecol. Conservation 17, e00535. doi:10.1016/j.gecco.2019.e00535
Nizami, S. M. (2012). The Inventory of the Carbon Stocks in Sub Tropical Forests of Pakistan for Reporting under Kyoto Protocol. J. For. Res. 23, 377–384. doi:10.1007/s11676-012-0273-1
Pacala, S. W., Hurtt, G. C., Baker, D., Peylin, P., Houghton, R. A., Birdsey, R. A., et al. (2001). Consistent Land- and Atmosphere-Based U.S. Carbon Sink Estimates. Science 292, 2316–2320. doi:10.1126/science.1057320
Pan, Y., Birdsey, R. A., Fang, J., Houghton, R., Kauppi, P. E., Kurz, W. A., et al. (2011). A Large and Persistent Carbon Sink in the World's Forests. Science 333, 988–993. doi:10.1126/science.1201609
Puyravaud, J.-P. (2003). Standardizing the Calculation of the Annual Rate of Deforestation. For. Ecol. Manag. 177, 593–596. doi:10.1016/s0378-1127(02)00335-3
Qamer, F., Shehzad, K., Abbas, S., Murthy, M., Xi, C., Gilani, H., et al. (2016). Mapping Deforestation and Forest Degradation Patterns in Western Himalaya, Pakistan. Remote Sensing 8, 385. doi:10.3390/rs8050385
Rana, B. S., Singh, S. P., and Singh, R. P. (1989). Biomass and Net Primary Productivity in Central Himalayan Forests along an Altitudinal Gradient. For. Ecol. Manag. 27, 199–218. doi:10.1016/0378-1127(89)90107-2
Ribot, J. C., Agarwal, A., and Larson, A. M. (2006). Recentralizing While Decentralizing: How National Governments Reappropriate Forest Resources. World Dev. 34 (11), 1864–1886. doi:10.1016/j.worlddev.2005.11.020
Sahoo, U. K., Tripathi, O. P., Nath, A. J., Deb, S., Das, D. J., Gupta, A., et al. (2021). Quantifying Tree Diversity, Carbon Stocks, and Sequestration Potential for Diverse Land Uses in Northeast India. Front. Environ. Sci. 436, 724950. doi:10.3389/fenvs.2021.724950
Schimel, D. S., House, J. I., Hibbard, K. A., Bousquet, P., Ciais, P., Peylin, P., et al. (2001). Recent Patterns and Mechanisms of Carbon Exchange by Terrestrial Ecosystems. Nature 414, 169. doi:10.1038/35102500
Song, X.-P., Hansen, M. C., Stehman, S. V., Potapov, P. V., Tyukavina, A., Vermote, E. F., et al. (2018). Global Land Change from 1982 to 2016. Nature 560, 639–643. doi:10.1038/s41586-018-0411-9
Van der Werf, G. R., Morton, D. C., DeFries, R. S., Olivier, J. G. J., Kasibhatla, P. S., Jackson, R. B., et al. (2009). CO2 Emissions from forest Loss. Nat. Geosci 2, 737–738. doi:10.1038/ngeo671
Keywords: deforestation, management regimes, historic emissions, counter appraoches, Pakistan
Citation: Ahmad A, Ahmad S, Nabi G, Zeb A, Rajpar MN, Ullah S, Khalid F, Rahman M, Liu Q, Zu K, Guo X and Wanghe K (2022) Carbon Emissions With Forest Cover Change and Wood Harvest in the Dry Temperate Region of Pakistan Between 1908 and 2015. Front. Environ. Sci. 10:876225. doi: 10.3389/fenvs.2022.876225
Received: 15 February 2022; Accepted: 18 March 2022;
Published: 25 April 2022.
Edited by:
Guangyu Wang, University of British Columbia, CanadaReviewed by:
Amit Kumar, Nanjing University of Information Science and Technology, ChinaCopyright © 2022 Ahmad, Ahmad, Nabi, Zeb, Rajpar, Ullah, Khalid, Rahman, Liu, Zu, Guo and Wanghe. This is an open-access article distributed under the terms of the Creative Commons Attribution License (CC BY). The use, distribution or reproduction in other forums is permitted, provided the original author(s) and the copyright owner(s) are credited and that the original publication in this journal is cited, in accordance with accepted academic practice. No use, distribution or reproduction is permitted which does not comply with these terms.
*Correspondence: Ghulam Nabi, Z2h1bGFtbmFiaXFhdUBnbWFpbC5jb20=; Kunyuan Wanghe, d2FuZ2hla3VueXVhbkAxODkuY24=
†These authors have contributed equally to this work and share first authorship
Disclaimer: All claims expressed in this article are solely those of the authors and do not necessarily represent those of their affiliated organizations, or those of the publisher, the editors and the reviewers. Any product that may be evaluated in this article or claim that may be made by its manufacturer is not guaranteed or endorsed by the publisher.
Research integrity at Frontiers
Learn more about the work of our research integrity team to safeguard the quality of each article we publish.