
94% of researchers rate our articles as excellent or good
Learn more about the work of our research integrity team to safeguard the quality of each article we publish.
Find out more
ORIGINAL RESEARCH article
Front. Environ. Sci., 27 April 2022
Sec. Freshwater Science
Volume 10 - 2022 | https://doi.org/10.3389/fenvs.2022.875458
This article is part of the Research TopicArtificial Intelligence Methods for Water-Environment-Food-Energy NexusView all 6 articles
 Peng Xu1,2,3
 Shiqiang Wu2
 Jianmin Zhang1Xiufeng Wu2*
 Benyou Jia2*
 Jiangyu Dai2
 Lei Yu2
 Yu Zhang2Yongfei Qi1
Water, energy, and food are the basic resources on which human beings depend for survival and development. However, these resources, ecosystem, society, and economy interact with each other in highly complex and interlinked ways, that is, the water-energy-food (WEF) nexus, which is difficult to evaluate quantitatively, particularly whether there is a harmonious, matching, and benign interaction in the WEF system for a given spatial and temporal scale, that is, the WEF system suitability. Thus, we developed a comprehensive model for the WEF system suitability evaluation, including stability, coordination, and sustainability. The model mainly contains the index system construction, weight calculation, and TOPSIS evaluation method. Specifically, we proposed an improved weight calculation method (i.e., network assignment method) based on the network analysis method and Amal’s method. A case study in Sichuan Province, China, has shown that 1) the overall level of the WEF system suitability in Sichuan Province is above medium and shows a fluctuating trend; 2) in terms of the proportion of each indicator to the total, the contribution of coordination indicators to the comprehensive evaluation decreases slightly, and the contribution of sustainability indicators is greater, but the three remain in a balanced state, as evinced by good underlying conditions and potential for future development; 3) the network assignment method can obtain more suitable statistical characteristics (standard deviation, mean, maximum, and minimum) compared with the Entropy method, Amal’s method, and analytic network process method, which are consistent with the actual conditions in the study area. In general, the evaluation results obtained by the network assignment method can better characterize the nexus at the core of complex multi-resource systems and have significant advantages in the application of comprehensive evaluation of the suitability of WEF systems.
Water, energy, and food are the basic strategic resources for human survival and development, and the global supply of those three resources is in a critical situation due to global population growth, climate change, and environmental degradation (Hoff, 2011). In 2013, the UN Economic and Social Council for Asia and the Pacific published the water-energy-food (WEF) nexus report for Asia and the Pacific Region, which aims to consider various factors, proposing an optimization of the WEF system by considering multiple factors and proposing a framework for environmental governance framework (Taniguchi et al., 2017). New ways to support food security and sustainable agriculture organization of the United Nations published the “The WEF Nexus: A New Approach in Support of Food Security and Sustainable Agriculture,” which interpreted the nexus from the perspective of achieving sustainable agricultural development and food security and proposed a method to make decisions using the nexus. With the development of research into various aspects of this topic, there is an inseparable coupling between water, energy, and food. The three as a unified, organic whole may become the way to solve the contradiction between supply and demand of the three resources and can promote the synergistic and efficient use of multiple resources and risk control. This inseparable coupling is called a nexus; therefore, the WEF nexus has become a key research topic (D'Odorico et al., 2018; Hogeboom et al., 2021; Petrariu et al., 2021; Wen et al., 2022).
The results of research into WEF systems can be broadly divided into two categories (Zhang et al., 2018). 1) The first is a qualitative interpretation of the nexus between water, energy, and food and relevant suggestions for effective cross-sectoral management (Cai et al., 2018). In previous studies (Allan et al., 2015; Biggs et al., 2015; Howarth and Monasterolo, 2016; Baghizadeh et al., 2022), a series of effective measures are proposed to maintain the balance of the WEF system in the study area by constructing a WEF system framework, cross-sectoral workshops, and questionnaires from the perspectives of environmentally sustainable livelihoods, sustainable resource use, food scarcity, and water resources management. 2) The second is constructing modeling tools to characterize the complex linkages among different resources such as water, energy, and food (Bazilian et al., 2011; Weitz et al., 2017; Dai et al., 2018; Vakilifard et al., 2018). Daher and Mohtar (2015) constructed a WEF system framework model, WEF Nexus Tool 2.0, as a platform to identify resource allocation options.
The WEF system is complex, and the complex relationship between the internal elements of the system is its fundamental characteristic and the object of much research. For example, Shannak et al. (2018) provided a comprehensive discussion of the WEF system framework study; Stein et al. (2018) described the regional WEF internal relationship in the Nile region in the form of network structure analysis; and Chang et al. (2016) conducted a preliminary exploration of the quantitative relationship between the three resources. Moreover, many scholars have assessed the WEF system by constructing an indicator system. Giupponi and Gain (2017) discussed decision management around water-energy-food issues in the Mekong River Basin through indicator analysis and proposed an integrated indicator-based approach to assess water, energy, and food security in their article. Deng et al. (2017) discussed WEF coordination at the national scale in China, respectively, and researched the spatial distribution characteristics and temporal evolution characteristics through an integrated indicator evaluation method. Zhi et al. (2020) constructed a suitability evaluation model for security, coordination, and sustainability and discussed the security of the Chinese regional WEF system. Huang et al. (2021) analyzed the resource allocation and utilization efficiency of the water-energy-food system by combining production-based intensity, consumption-based intensity, and the quantity index system. Schmidt et al. (2022) proposed a FEW security assessment framework that focuses on the availability, accessibility, quality, and preference of security. However, the complex connection between indicators limits the application of some evaluation methods, which increases the difficulty of the comprehensive evaluation of WEF systems. Because the physical connotation of the relationship between indicators is unclear, the mechanism of action is unclear. When directly using the analytic network process (ANP) method (Hu et al., 2013), it is difficult to quantify the impact of a large number of indicators, and the basis for quantification is vague, which will directly affect the accuracy of the calculation, while Amal’s method of correlation approximation, instead of causality of the idea of the application in the complex system of WEF cannot truly reflect the actual characteristics.
Thus, this study establishes a system suitability evaluation using the Technique for Order Preference by Similarity to the Ideal Solution (TOPSIS) model based on the discussion of the WEF system suitability. It adopts an improved coupled network analysis method for index weight determination to assess the WEF system suitability of Sichuan Province, a typical province in China for water, energy, and food resource development. In addition, the evolution of system suitability and the main driving factors in the region are investigated, which provides references for further proposing strategies to improve system suitability.
“Suitability” is a description of the system relationship. In the WEF system, its suitability involves multiple heterogeneous systems such as water resources, energy, food, and related socio-economic and natural systems. The current cognitive consensus is that there is a coordinated and matched benign interaction between water resources, energy, and food in the production and utilization process in the complex system. It is formed by society and nature to achieve water, energy, and food supply security goals while ensuring the long-term sustainable development of the aforementioned resource production, ultimately supporting the stable progress of society in harmony with nature. Based on the research results of Zhi et al. (2020) and other scholars, this study establishes an evaluation index system of the WEF system’s suitability to describe the system as a whole in terms of security, coordination, and sustainability. We finally select 32 indicators to constitute the suitability evaluation of the WEF system in this region by combining the regional characteristics of Sichuan, as shown in Table 1.
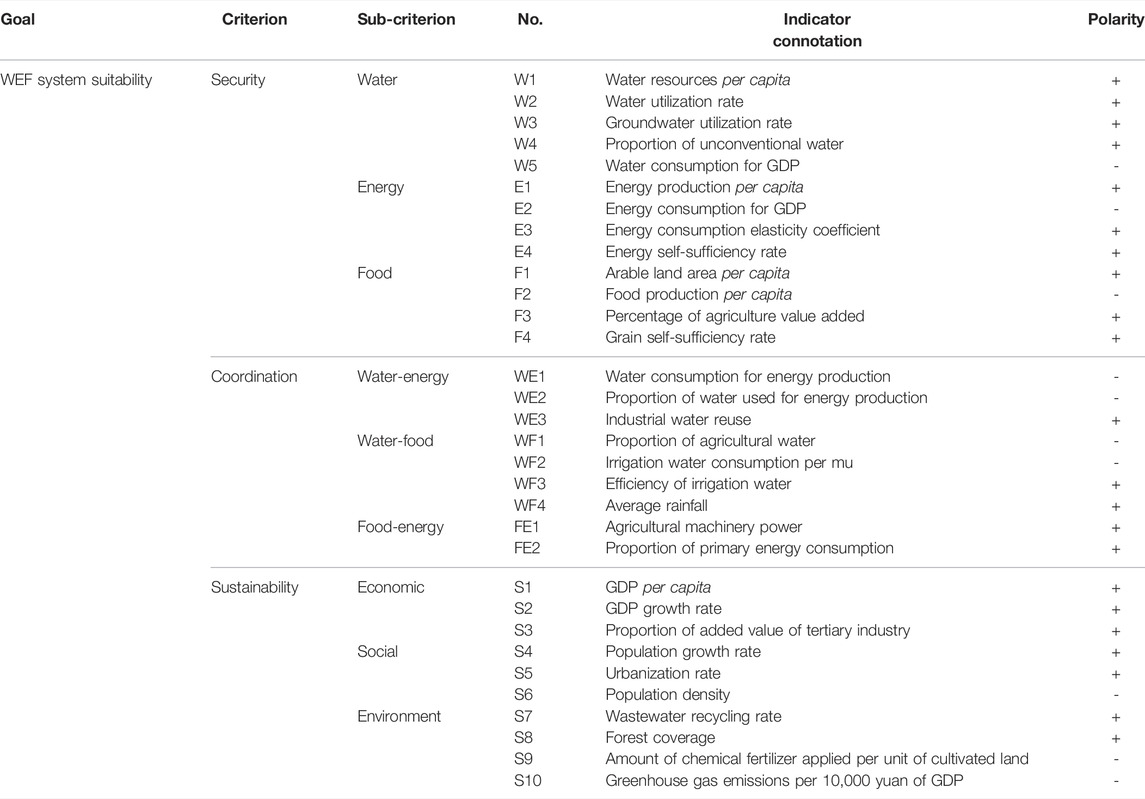
TABLE 1. The indicators of water-energy-food system suitability evaluation.
The WEF system has three levels: system function, system state, and system external conditions. The basic state elements of water, energy, and food are the safety indicators in the WEF system. The interaction relationship between water, energy, and food is the coordination indicator, which aims to improve the efficiency of resource allocation and utilization. The factors that affect the natural, social, and economic systems and the WEF system in both directions are sustainability indicators. Sustainability indicators affect the coordination indicators, leading to changes in safety indicators, and safety indicators further affect the level of sustainability indicators, which is the logical relationship between the three types of indicators.
The units of each indicator are different, so the original indicator data should be rendered dimensionless: the larger the indicator value, the more favorable (positive) and vice versa. The calculation method is described in Eqs 1, 2:
Positive:
Negative:
where
The weight calculation methods are mainly divided into two categories: subjective methods and objective methods. Subjective methods are mainly based on the Delphi method, hierarchical analysis, and network analysis (ANP) (Saaty, 2007), while objective methods include the entropy weighting method, coefficient of variation method, complex correlation coefficient method, and Amal’s weighting method (Ray, 2008). Scholars have also proposed a series of combined weight calculation methods that integrate both objective and subjective methods to find a more reasonable weighting, and the common combined subjective and objective methods mainly include the combined assignment method, the interactive assignment method, and the combined TOPSIS method. The WEF system is a typical complex system, and we argue that, in the evaluation of the suitability of this system, the description of the interactions between indicators is its key, and the current common ones with the characteristics of describing the interrelationship of indicators are the ANP method and Amal’s method. The ANP method relies on the construction of a network structure between indicators through expert a priori knowledge and makes a two-by-two comparison of the indicators with interactions under the evaluation criteria. Amal’s method makes full use of the information provided by the original data, adopting a statistical correlation analysis method, uses the correlation between the indicators to represent the mutual influence of the indicators in practice, and finally calculates the weights thereon.
In this study, the advantages of Amal’s method and the network analysis method are integrated, and an improved weight method is proposed, named the network assignment method. The method draws on the ANP method to determine the qualitative linkage between the mutual influence of indicators based on subjective experience. At the same time, it adopts the variance matrix and inter-correlation matrix in Amal’s method to quantify the degree of mutual influence between indicators, combining the qualitative linkage and quantitative influence degree to construct a supermatrix reflecting the complex relationship between indicators, finally obtaining indicator weights by calculating the maximum eigenvectors of the supermatrix.
The steps in the calculation of the coupled network assignment method are as follows:
(1) With the help of a priori knowledge, we draw the network structure diagram between indicators and determine the causal relationship between indicators through network analysis.
Based on existing research results, the WEF indicator system is constructed with n indicators
where
2) Correlation analysis is used to quantify the degree of influence between two indicators objectively, and the indicator sample standard deviation is employed to approximate the degree of change in the indicator itself.
Correlation analysis is the analysis of sample series that are indeed linked in the aggregate. However, it does not reflect the existence of a link: it is simply the process of describing the closeness of the relationship between two series from the trend of the paired data series and expressing it in terms of appropriate statistical indicators. On the premise that a causal relationship does exist between the indicators, the correlation indicator between the series is used to approximate the degree of influence between the series. The correlation indicators between indicators are calculated according to Eq. 5, and the correlation matrix R is constructed, the form of which is shown in Eq. 6:
where
If the actual value of an indicator can clearly distinguish between the samples, it means that the indicator is rich in discriminatory information in this evaluation. Then, the indicator should be given a larger weight to improve the discriminatory validity of the comprehensive evaluation. On the contrary, if the actual value of each participant in an indicator is less different, it means that the ability of the indicator to distinguish between the samples is weak, then the indicator should be given a smaller weight. The weight of this indicator should be smaller. To obtain the aforementioned information pertaining to the index, we constructed a diagonal matrix of standard deviations S. The standard deviation reflects the degree of discrete deviation of the data and is calculated using Eq. 7. Its corresponding S-matrix form is given in Eq. 8:
where
(3) Integrating the network causality, the degree of its own contribution to the change, and the degree of mutual influence, we determined the weight of each indicator.
According to Eq. 9, the matrices C, R, and S are coupled to obtain a comprehensive supermatrix
Among them, the supermatrix Rc is given by
where × is defined as the product of the corresponding elements of two matrices.
The maximum eigenvector W of the matrix Rc represents the contribution of each indicator to the whole, and we normalize it through Eq. 10, finally getting indicator weights set Ω:
where W is the eigenvector of the supermatrix
The standardized index data series and weight calculation results for different years are used to calculate water-energy-grain according to Eq. 11. The TOPSIS model calculation is adopted for comprehensive evaluation. The TOPSIS method is a ranking method based on the proximity of a finite number of evaluation objects to an idealized target. It is a method for assessing the relative merits of existing objects (Dymova et al., 2013). TOPSIS is a ranking method that approximates the ideal solution, and the method requires only monotonically increasing (or decreasing) utility functions. TOPSIS is a common and effective method in multi-objective decision analysis and is also known as the distance method of superior and inferior solutions. The basic principle is to check the distance between the evaluation object and the optimal solution and the inferior solution and then rank them: if the evaluation object is closest to the optimal solution and furthest from the inferior solution, it is the best; otherwise, it is not optimal. The value of each index of the optimal solution reaches the optimal value of each evaluation index. The value of each index of the worst solution is the worst value of each evaluation index.
In the evaluation of WEF system suitability, there is no widely accepted unified quantitative standard due to the prevailing large regional differences. In this study, the relative ideal solution is used for the calculation of the indicator distance, and the indicator values of each evaluation scheme are substituted into Eqs 11 to 13 in the multi-year series data to calculate the distance values of each scheme and for the relative ranking of the schemes:
where
The suitability evaluation value obtained according to the TOPSIS method reflects the closeness to the ideal state. Nevertheless, in the exploration of the WEF system suitability, the ideal state cannot be reached due to limitations on productivity and competition among various resources, so in actual decision-making, it is more important to combine the historical development level, compare all such schemes to be evaluated, and assess the ranking among the historically achievable states of the evaluated schemes.
Here, in the relative rank division, the evaluation results are taken to be divided into N ranks according to the maximum value and distribution characteristics of the TOPSIS evaluation value of each scheme. The grade interval is calculated by equal length as follows:
where ∆ is the interval length, MAX is the largest TOPSIS evaluation value in all the schemes, MIN represents the smallest TOPSIS evaluation value among the schemes, and N is the number of classifications.
The grade interval is divided according to the plan evaluation value and the grade interval length. According to the calculated evaluation value of each item, the grade is divided. Specifically, Li is the evaluation grade, ∆ is the interval length, MAX and MIN have the same meaning as Equation 14, and N = 5. The classification criteria are shown in Table 2, with five grades, namely, very bad, bad, moderate, good, and excellent.
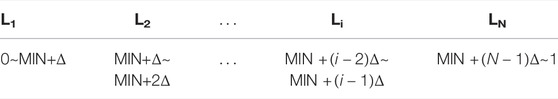
TABLE 2. The calculation method of the evaluation value range corresponding to the suitability evaluation grade standard.
Sichuan Province is in the southwest of China. The region has a large population, a well-developed water system, abundant water, energy, and mineral resources, and the largest natural gas reserves in China, as well as being an important grain production area in China and the only major grain-producing area in the southwest hydroelectric energy base, and one of the main supply areas for live pigs and liquor. The study area is illustrated in Figure 1.
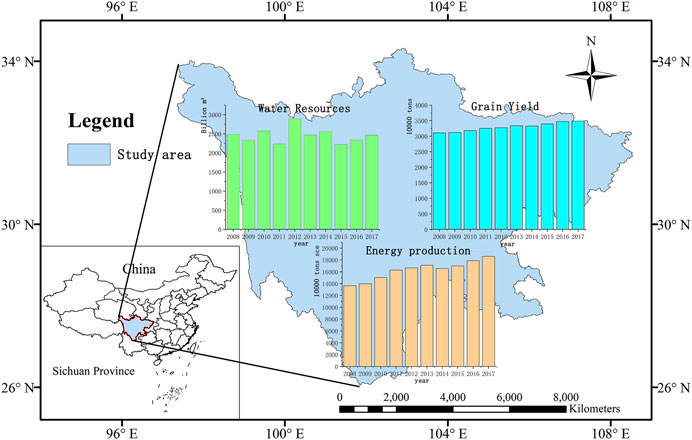
FIGURE 1. Study area.
Water resources are relatively abundant in Sichuan province, with 295.379 billion m3 of water resources in the province in 2018. In the same year, the province’s water supply was 25.911 billion m3, giving a total water consumption of 14.113 billion m3, with agricultural water accounting for 60.40%, industrial water accounting for 16.40%, domestic water accounting for 21.00%, and ecological water accounting for 2.20% thereof. The total amount of water resources in Sichuan province remained unchanged from 2008 to 2017, with an average value of 245.820 billion m3 for 10 years, of which the lowest was 222.050 billion m3 in 2015 and the largest was 257.530 billion m3 in 2011 (Figure 1).
In terms of energy, Sichuan province has shown increasing energy production over the years, with hydropower and natural gas production increasing year on year, while raw coal production has decreased year on year and oil production is minimal, being almost wholly reliant on imports to meet local oil fuel consumption needs. However, simultaneously, the hydropower capacity in Sichuan is lower than the design capacity of power stations, and there is a large amount of water abandonment every year. The weak capacity of hydropower consumption and transmission is in contradiction with the high rate of hydropower development. From 2008 to 2017, the total energy production of Sichuan province increased year by year, from 136.431 million tons sec in 2008 to 186.134 million tons sec in 2017. Energy production increased particularly rapidly from 2009 to 2013 because of the hydropower development of Sichuan province. From 2015 to 2017 is the second stage of the rapid increase in energy production, with shale gas development and new clean energy (Figure 1).
In terms of food, the per capita grain allocation in Sichuan province is relatively stable at between 320 and 400 kg; the grain self-sufficiency rate shows a steady increase, from 177.39% in 2005 to 244.64% in 2016, and as an important grain-producing area in southwest China, Sichuan province has great potential to ensure regional food security. From 2008 to 2017, the grain output of Sichuan Province increased steadily, with an average grain output of 32.95 million tons in 10 years and 34.890 million tons in 2017, with an average annual growth rate of 1.15% (Figure 1).
The data for the study are obtained from the official public reports such as the Sichuan Statistical Yearbook (2008–2017) in the https://www.sc.gov.cn/10462/c106305/zttjnj_list.shtml, the Sichuan Water Resources Bulletin (2008–2017) in the http://slt.sc.gov.cn/scsslt/tzgg/szy_list.shtml, the Sichuan National Economic and Social Development Statistical Bulletin (2008–2017) in the http://tjj.sc.gov.cn/scstjj/tjgb/common_list.shtml, and the Sichuan Third National Agricultural Census Main Data Bulletin (2017) in the https://www.sc.gov.cn/10462/10464/10797/2017/12/29/10441804.shtml. In order to ensure consistency and reliability of the data, the statistical yearbook prevails for data from different sources. For data differences in different years, the latest calculation method is used for conversion. For missing data, the statistical indicators related thereto are fitted and supplemented for the same period.
Experts were invited to reveal the mutual influence relationship among the above indicators by integrating the theoretical mechanism and engineering experience in the process of water, energy, and food production, as well as plotting the network structure of indicators according to the principle of taking the majority in the case of different opinions of multiple experts (Figure 2). In the indicator system, there are three criteria of security, coordination, and sustainability, and nine sub-criterions of water resources, energy, food, water-energy, water-food, energy-food, economy, society, and nature.
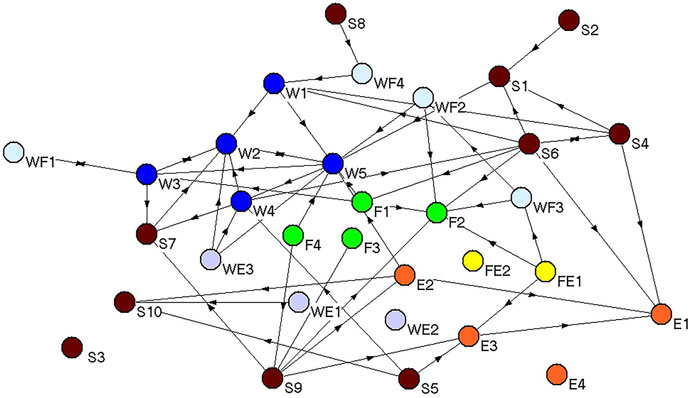
FIGURE 2. The structure of indicators for the water-energy-food nexus.
The water sub-criterion contains five indicators: water resources per capita (W1), water utilization rate (W2), groundwater utilization rate (W3), proportion of unconventional water (W4), and the water consumption for GDP (W5). Among its internal indicators, W2 receives the relevant influence of W3 and W4, with the higher level of the two, the higher the level of W2. There is no mutual influence between the indicators of the water sub-criterion and the energy sub-criterion, the food sub-criterion, and the energy-food sub-criterion, so their correlation matrices are all null matrices. The relationship between the water sub-criterion and the water-energy sub-criterion is that the demand for W1 increase with the industrial water reuse (WE3) decrease, the water consumption for energy production (WE1), and the proportion of water used for energy (WE2) are related to the production process and industrial structure and not related to the water resource. In the water sub-criterion and the economic sub-criterion, the water consumption for GDP (W5) and GDP per capita (S1) are closely related. In the water sub-criterion and the social sub-criterion, the population growth rate indicator (S4) and W1 are related. Similarly, the wastewater recycling rate (S7) contributes to reducing the demand for W2.
According to the same method, the relationship between the indicators of other subsystems such as the energy subsystem, food subsystem, water-energy, water-food, energy-food, social subsystem, economic subsystem, and natural subsystem is clarified, and the network structure diagram of the whole indicator system can be obtained. According to Figure 2, we describe the relationship between other factor level indicators according to Eq. 3 to obtain the causal relationship cij between the indicators and then obtain the causal relationship matrix C according to the form of Eq. 4.
The data series of each indicator in the composite WEF system of Sichuan province for the years 2008–2017 are processed, and the correlation matrix R and standard deviation matrix S are obtained according to the method delineated in Section 3.2. The comprehensive matrix Rc is established according to Eq. 11 to obtain the indicator weights. Here, the weighting results obtained using the entropy weight method, Amal’s method, and the ANP method are compared as shown in Table 3.

TABLE 3. Comparison of indicator weight results calculated by different methods.
According to the actual status of the WEF system, the weights obtained by different methods are similar (Table 3): both can better distinguish the contribution of different indicators, but there are also some differences therein. Entropy and Amar’s methods are objective methods, and their distribution results are closer because they both determine the weight according to the difference information in the index data series. Due to different starting points of subjective and objective interpretations, the difference between the subjective-based ANP and the other three methods is larger, while the network assignment method, which integrates the subjective and objective perspectives, is intermediate thereto. The quantitative results based on data effectively limit the tendency to excessively subjective judgments when analyzed with the physical connotation of indicators. For example, “water resources per capita,” as an indicator with greater influence in the WEF system, interacts with some indicators, but its indicator value varies less over the years, and the weighting results determined by the entropy weighting method and Amal’s method are 0.016 and 0.018, respectively. The result of ANP is 0.034. It is much larger than the other three methods, which are also unrealistic. In a comprehensive comparison, the weighting results of the network assignment method are more reasonable.
In order to assess the differentiation ability of the weighting results of different methods further, the statistical characteristics of the results are studied. The greater the dispersion of the indicators, the greater the difference between the maximum and minimum values of the indicators, and the stronger the differentiation between them (Table 4). The weighting results determined by the network assignment method are slightly better than the two objective weighting methods. However, both are inferior to the ANP method, but the maximum and minimum values of the weights are close to the ANP method and produce stronger differentiation. The maximum and minimum values of the weights are close to the ANP method, which has a strong ability to distinguish important indicators. Considering that the conclusion of the subjective method contains a part of individual subjective tendencies and there is a possibility of inconsistency with the objective facts, the application of the network assignment method for comprehensive evaluation can more accurately describe the actual degree of influence of the important indicators (in general). In summary, it is believed that the proposed network assignment method can meet the weight requirements of WEF system evaluation, and its weight distribution differences are more advantageous.
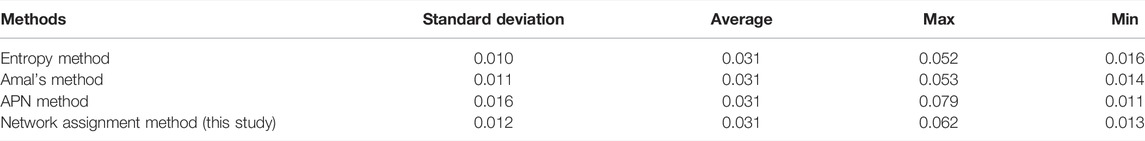
TABLE 4. Statistical characteristics of weight results by different methods.
The TOPSIS model is applied to calculate the security, coordination, sustainability, and WEF system suitability evaluation, and the suitability is divided into five grades according to the evaluation results, from small to large (very poor, poor, moderate, good, and excellent): the result of level regions (Table 5) is determined according to Eq. 16.
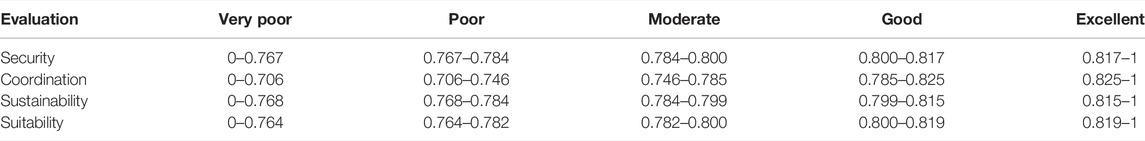
TABLE 5. The indicator value range corresponding to the evaluation standard.
In the WEF system suitability evaluation, the TOPSIS evaluation result describes the size of the gap between the program and the ideal state. The ranking portrays the relative level of the program results under those pertinent historical conditions in the current, based on the evaluation results (Table 6), to analyze the suitability status of the WEF nexus in Sichuan province.
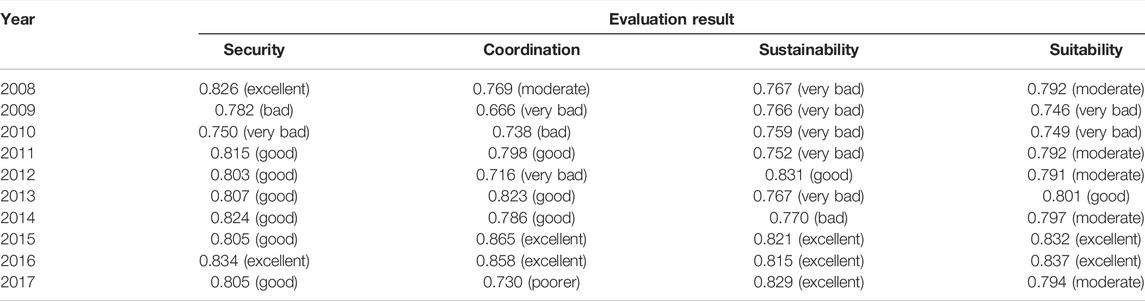
TABLE 6. Evaluation results of security, coordination, sustainability, and suitability.
During the period from 2008 to 2017, the WEF system suitability in Sichuan province was basically flat, with fluctuations between years. Among them, the rating was moderate in 2008 and 2017, poor in 2009 and 2010, stable at moderate in 2011–2014, and good in 2015 and 2016, reflecting that, in recent years, the WEF system is affected by a variety of external uncertainties and is sensitive to external change. The synergistic adaptation of various resources needs to be improved. From the point of view of evaluation scores, the highest evaluation score in the last 10 years is 0.837 and the lowest is 0.746 under the current level of productivity development.
Although the evaluation score for the WEF system suitability in Sichuan province is high, there are significant differences among years from different criteria of security, coordination, and sustainability, and the evaluation of each criterion contributes differently to the suitability evaluation and shows different trends in the time series (Figure 3). The temporal change tends to a score of 0.800, indicating that the production and supply of water, energy, and food reflect the function of the WEF system. Its score and the overall operation of the system are approximately equivalent, while the coordination evaluation shows greater volatility. The criterion level reflects the characteristics of the synergistic competition of resources within the WEF nexus. In different socio-economic and natural conditions, these are subject to dynamic adjustment. Their state affects the trend of the overall state of the system, especially in 2009, 2012, and 2017 when the level of coordination is relatively low, which directly affects the overall level of suitability, and its volatility is mainly brought about by internal competition between resources (coordination factor) and the external influence of the system (sustainability factor). Sustainability evaluation over the years reflects the fact that, in practice, there is a time lag in the interaction between WEF production and socio-economic and ecological development. This process is extremely complex, thus warranting further exploration. In the specific analysis, it is found that since 2015, under the guidance of the national sustainable development policy, the relevant measures in Sichuan province have gradually generated positive impacts, and sustainable development scores have continued to rise. Combined with the actual situation of the Sichuan region, the analysis based on the dynamics of each subsystem found that the strong rise of the socio-economic and natural environments provides the precondition and guarantee for the overall security of the whole system. It is the main reason for the stability of the suitability evaluation, while there is a passive regulation process affecting the production and supply of resources in the sustainable green development decisions in the region. Thus, it leads to the fluctuation of the coordination index over many years. The coordination and sustainable development appear significantly different, indicating that, as the requirements for sustainable development increase, there are also higher requirements for coordination regulation ability. However, due to beneficent regional resource endowment, the security evaluation is quasi-stable and the system does not yet bear the risk to supply of material.
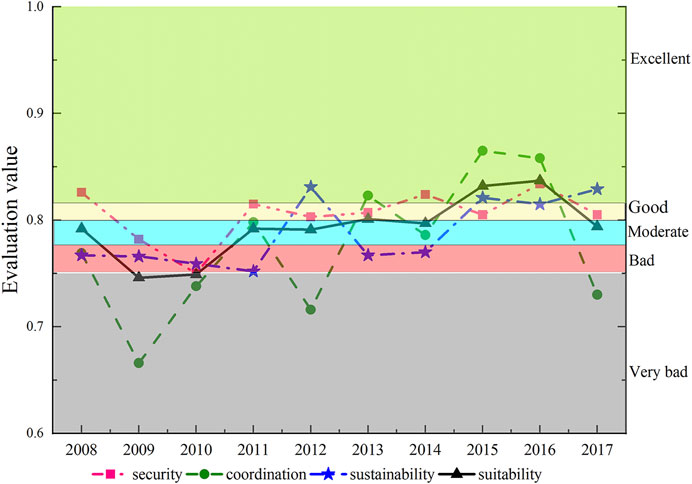
FIGURE 3. Water-energy-food suitability trend for Sichuan province from 2008 to 2017. The range is divided into five grades (bad, bad, moderate, good, and excellent, respectively) based on the calculated evaluation value of each item.
To reveal the effects of the transformation between security, coordination, and sustainability, the scores of the three subsystem indicators are compared. The proportion of the scores of each subsystem in the total score is calculated to obtain the proportion of the scores of each subsystem over the years (Figure 4). Energy and food enjoy good basic conditions and development potential for future development. Combined with the 13th Five-Year Development Plan of Sichuan province and the contents of the government work reports after 2013, it can find that the demand for water, energy, and food has increased in recent years. The competition among the three has increased, and the coordination evaluation has decreased year on year, which imposes more onerous requirements on management and decision-making of the coordinated development among the three.
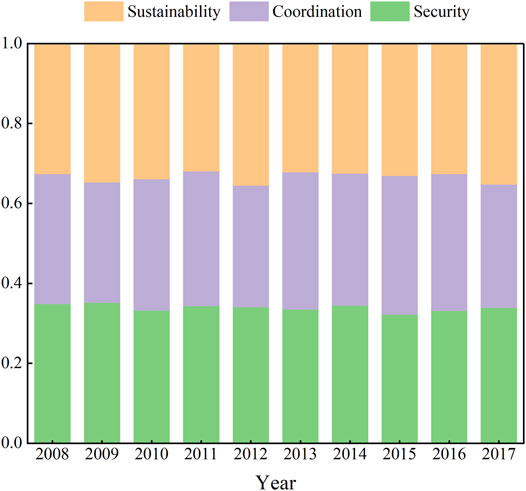
FIGURE 4. Proportional sub-criteria rated in Sichuan province from 2008 to 2017.
In order to determine the factors affecting the suitability of the WEF system in Sichuan province, the index evaluation values of typical years (2010, 2016, and 2017) are analyzed. Those years with the lowest rating, the highest rating, and moderate rating are selected for indicator analysis (Figures 5–7). In the 2010 years, GDP per capita and other key indicators are at a very low level, although supporting factors such as arable land area and irrigation water use perform better, resulting in a low overall score, with the sustainable evaluation level growing year-on-year, correspondingly due to reduced production pressure. Combined with the year being part of a post-disaster reconstruction period, socio-economic production has a temporary nature. Because it is in a well-coordinated state, system suitability soon rebounded after 2010. In 2016, a suitability evaluation showed that most indicators are at a high level, especially those indicators under the coordination guidelines, which have obvious advantages. Combined with 2015 and 2016, these are always at a high level. The evaluation value of each indicator in 2017 continues the trend in per capita water resource, per capita energy production, and per capita food production towards higher levels. However, the unit energy water consumption, agricultural water consumption ratio, and average irrigation water consumption decrease. Although security can still be maintained, the difficulty of coordination has increased, posing a challenge for the further development of the WEF system. Through the analysis of indicators, we can find that insisting on sustainable development and optimizing the WEF structure to improve the level of system coordination is the way to guarantee water, energy, and food production. Improving the indicator grade of water consumption for energy production, the proportion of water used for energy production, the rate of reuse of industrial water, the proportion of water used for agriculture, the average amount of water used for irrigation, and the proportion of energy consumption for primary production can be used to indicate the best direction for development beyond 2017.
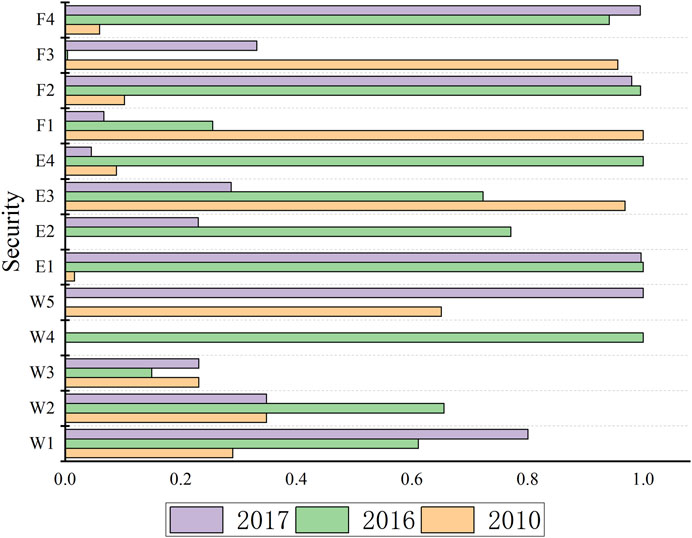
FIGURE 5. Comparison of security indicator evaluation values in typical years.
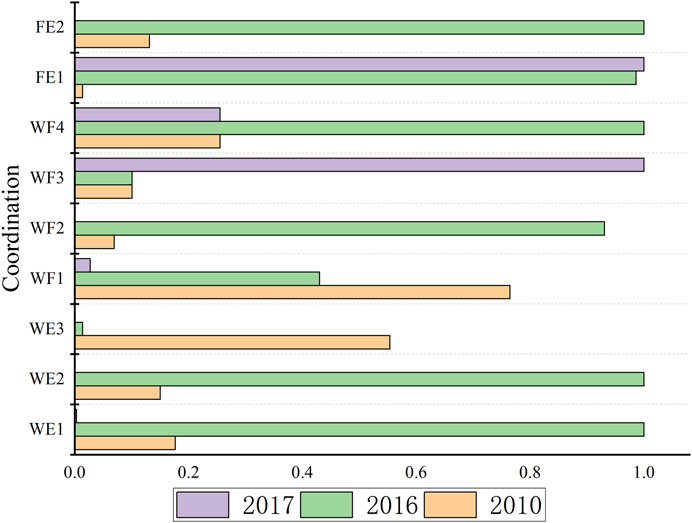
FIGURE 6. Comparison of coordination indicator evaluation values in typical years.
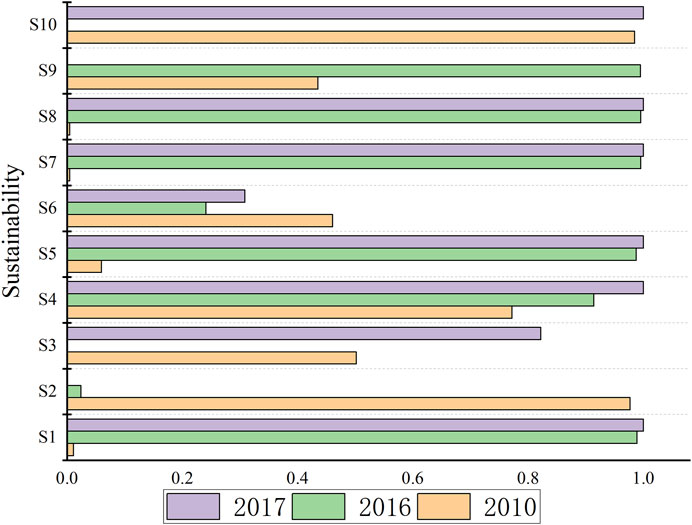
FIGURE 7. Comparison of sustainability indicator evaluation values in typical years.
In view of the complex relationship in the WEF system, this study establishes the WEF system suitability evaluation model, determines the indicator weights through the improved coupled network analysis method, and finally proposes the water-energy-food suitability evaluation method based on a TOPSIS model. According to this method, the main conclusions of this work are as follows:
1) The overall level of WEF system suitability in Sichuan province is good, among which the score for security evaluation is stable, that for sustainability is increasing, the overall coordination fluctuates to a significant extent, and the suitability status of the region has significant potential for improvement.
2) The sustainability of the WEF system in the region has increased and the coordination has decreased, indicating that the competition among water, energy, and food resources has increased, implying that the coordination of the three resources will become a bottleneck limiting the further improvement of the region’s suitability.
3) Analysis of the historical data of indicators and their weights shows that the improvement of four indicators, namely, the irrigation water consumption per mu, the efficiency of irrigation water, the proportion of agricultural water, and the arable land per capita, can help improve the level of adaptability of the water-energy-grain system in the region.
4) Combining the characteristics of the complex WEF system, we proposed a combined subjective and objective weight calculation method integrating the network analysis method and Amal’s method. Using the case of Sichuan province, we verified the applicability of this weight calculation method in the study of the internal linkage of the WEF system.
The original contributions presented in the study are included in the article/Supplementary Material, further inquiries can be directed to the corresponding authors.
All authors listed have made a substantial, direct, and intellectual contribution to the work and approved it for publication.
This study was supported by the National Social Science Fund of China (19ZDA084) and the National Key R&D Programme of China (2017YFC0404605).
The authors declare that the research was conducted in the absence of any commercial or financial relationships that could be construed as a potential conflict of interest.
All claims expressed in this article are solely those of the authors and do not necessarily represent those of their affiliated organizations or those of the publisher, the editors, and the reviewers. Any product that may be evaluated in this article, or claim that may be made by its manufacturer, is not guaranteed or endorsed by the publisher.
Allan, T., Keulertz, M., and Woertz, E. (2015). The Water-Food-Energy Nexus: an Introduction to Nexus Concepts and Some Conceptual and Operational Problems. Int. J. Water Resour. Dev. 31 (3), 301–311. doi:10.1080/07900627.2015.1029118
Baghizadeh, K., Cheikhrouhou, N., Govindan, K., and Ziyarati, M. (2022). Sustainable Agriculture Supply Chain Network Design Considering Water‐energy‐food Nexus Using Queuing System: A Hybrid Robust Possibilistic Programming. Nat. Resource Model. 35 (1). doi:10.1111/nrm.12337
Bazilian, M., Rogner, H., Howells, M., Hermann, S., Arent, D., Gielen, D., et al. (2011). Considering the Energy, Water and Food Nexus: Towards an Integrated Modelling Approach. Energy Policy 39 (12), 7896–7906. doi:10.1016/j.enpol.2011.09.039
Biggs, E. M., Bruce, E., Boruff, B., Duncan, J. M. A., Horsley, J., Pauli, N., et al. (2015). Sustainable Development and the Water-Energy-Food Nexus: A Perspective on Livelihoods. Environ. Sci. Pol. 54, 389–397. doi:10.1016/j.envsci.2015.08.002
Cai, X., Wallington, K., Shafiee-Jood, M., and Marston, L. (2018). Understanding and Managing the Food-Energy-Water Nexus - Opportunities for Water Resources Research. Adv. Water Resour. 111, 259–273. doi:10.1016/j.advwatres.2017.11.014
Chang, Y., Li, G., Yao, Y., Zhang, L., and Yu, C. (2016). Quantifying the Water-Energy-Food Nexus: Current Status and Trends. Energies 9 (2), 65. doi:10.3390/en9020065
D'Odorico, P., Davis, K. F., Rosa, L., Carr, J. A., Chiarelli, D., Dell'Angelo, J., et al. (2018). The Global Food-Energy-Water Nexus. Rev. Geophys. 56 (3), 456–531. doi:10.1029/2017rg000591
Daher, B. T., and Mohtar, R. H. (2015). Water-energy-food (WEF) Nexus Tool 2.0: Guiding Integrative Resource Planning and Decision-Making. Water Int. 40 (5-6), 748–771. doi:10.1080/02508060.2015.1074148
Dai, J., Wu, S., Han, G., Weinberg, J., Xie, X., Wu, X., et al. (2018). Water-energy Nexus: A Review of Methods and Tools for Macro-Assessment. Appl. Energ. 210, 393–408. doi:10.1016/j.apenergy.2017.08.243
Deng, P., Chen, J., Chen, D., Shi, H., Bi, B., Liu, Z., et al. (2017). The Evolutionary Characteristics Analysis of the Coupling and Coordination Among Water,energy and Food: Take Jiangsu Province as an Example. J. Water Resour. Water Eng. 28 (6), 232–238.
Dymova, L., Sevastjanov, P., and Tikhonenko, A. (2013). A Direct Interval Extension of TOPSIS Method. Expert Syst. Appl. 40 (12), 4841–4847. doi:10.1016/j.eswa.2013.02.022
Giupponi, C., and Gain, A. K. (2017). Integrated Spatial Assessment of the Water, Energy and Food Dimensions of the Sustainable Development Goals. Reg. Environ. Change 17 (7), 1881–1893. doi:10.1007/s10113-016-0998-z
Hoff, H. (2011). Understanding the Nexus. Background Paper for the Bonn 2011 Conference: The Water, Energy and Food Security Nexus.
Hogeboom, R. J., Borsje, B. W., Deribe, M. M., van der Meer, F. D., Mehvar, S., Meyer, M. A., et al. (2021). Resilience Meets the Water-Energy-Food Nexus: Mapping the Research Landscape. Front. Environ. Sci. 9. doi:10.3389/fenvs.2021.630395
Howarth, C., and Monasterolo, I. (2016). Understanding Barriers to Decision Making in the UK Energy-Food-Water Nexus: The Added Value of Interdisciplinary Approaches. Environ. Sci. Pol. 61, 53–60. doi:10.1016/j.envsci.2016.03.014
Hu, M.-L., Horng, J.-S., Teng, C.-C., and Chou, S.-F. (2013). A Criteria Model of Restaurant Energy Conservation and Carbon Reduction in Taiwan. J. Sust. Tourism 21 (5), 765–779. doi:10.1080/09669582.2012.721787
Huang, D., Shen, Z., Sun, C., and Li, G. (2021). Shifting from Production-Based to Consumption-Based Nexus Governance: Evidence from an Input-Output Analysis of the Local Water-Energy-Food Nexus. Water Resour. Manage. 35 (6), 1673–1688. doi:10.1007/s11269-021-02797-4
Petrariu, R., Constantin, M., Dinu, M., Pătărlăgeanu, S. R., and Deaconu, M. E. (2021). Water, Energy, Food, Waste Nexus: Between Synergy and Trade-Offs in Romania Based on Entrepreneurship and Economic Performance. Energies 14 (16), 5172. doi:10.3390/en14165172
Ray, A. K. (2007). Measurement of Social Development: an International Comparison. Soc. Indic Res. 86 (1), 1–46. doi:10.1007/s11205-007-9097-3
Saaty, T. L. (2007). Time Dependent Decision-Making; Dynamic Priorities in the AHP/ANP: Generalizing from Points to Functions and from Real to Complex Variables. Math. Comp. Model. 46 (7-8), 860–891. doi:10.1016/j.mcm.2007.03.028
Schmidt, J. I., Johnson, B., Huntington, H. P., and Whitney, E. (2022). A Framework for Assessing Food-Energy-Water Security: A FEW Case Studies from Rural Alaska. Sci. Total Environ. 821, 153355. doi:10.1016/j.scitotenv.2022.153355
Shannak, S. d., Mabrey, D., and Vittorio, M. (2018). Moving from Theory to Practice in the Water-Energy-Food Nexus: An Evaluation of Existing Models and Frameworks. Water-Energy Nexus 1 (1), 17–25. doi:10.1016/j.wen.2018.04.001
Stein, C., Pahl-Wostl, C., and Barron, J. (2018). Towards a Relational Understanding of the Water-Energy-Food Nexus: an Analysis of Embeddedness and Governance in the Upper Blue Nile Region of Ethiopia. Environ. Sci. Pol. 90, 173–182. doi:10.1016/j.envsci.2018.01.018
Taniguchi, M., Endo, A., Gurdak, J. J., and Swarzenski, P. (2017). Water-Energy-Food Nexus in the Asia-Pacific Region. J. Hydrol. Reg. Stud. 11, 1–8. doi:10.1016/j.ejrh.2017.06.004
Vakilifard, N., Anda, M., A. Bahri, P., and Ho, G. (2018). The Role of Water-Energy Nexus in Optimising Water Supply Systems - Review of Techniques and Approaches. Renew. Sust. Energ. Rev. 82, 1424–1432. doi:10.1016/j.rser.2017.05.125
Weitz, N., Strambo, C., Kemp-Benedict, E., and Nilsson, M. (2017). Closing the Governance Gaps in the Water-Energy-Food Nexus: Insights from Integrative Governance. Glob. Environ. Change 45, 165–173. doi:10.1016/j.gloenvcha.2017.06.006
Wen, C., Dong, W., Zhang, Q., He, N., and Li, T. (2022). A System Dynamics Model to Simulate the Water-Energy-Food Nexus of Resource-Based Regions: A Case Study in Daqing City, China. Sci. Total Environ. 806, 150497. doi:10.1016/j.scitotenv.2021.150497
Zhang, C., Chen, X., Li, Y., Ding, W., and Fu, G. (2018). Water-energy-food Nexus: Concepts, Questions and Methodologies. J. Clean. Prod. 195, 625–639. doi:10.1016/j.jclepro.2018.05.194
Keywords: water-energy-food system, suitability evaluation, combined weighting, TOPSIS, Sichuan province
Citation: Xu P, Wu S, Zhang J, Wu X, Jia B, Dai J, Yu L, Zhang Y and Qi Y (2022) Suitability Evaluation of the Water-Energy-Food System: A Case Study in Sichuan Province, China. Front. Environ. Sci. 10:875458. doi: 10.3389/fenvs.2022.875458
Received: 14 February 2022; Accepted: 25 March 2022;
Published: 27 April 2022.
Edited by:
Zhong-kai Feng, Hohai University, ChinaReviewed by:
Feilin Zhu, Hohai University, ChinaCopyright © 2022 Xu, Wu, Zhang, Wu, Jia, Dai, Yu, Zhang and Qi. This is an open-access article distributed under the terms of the Creative Commons Attribution License (CC BY). The use, distribution or reproduction in other forums is permitted, provided the original author(s) and the copyright owner(s) are credited and that the original publication in this journal is cited, in accordance with accepted academic practice. No use, distribution or reproduction is permitted which does not comply with these terms.
*Correspondence: Xiufeng Wu, eGZ3dUBuaHJpLmNu; Benyou Jia, YnlqaWFAbmhyaS5jbg==
Disclaimer: All claims expressed in this article are solely those of the authors and do not necessarily represent those of their affiliated organizations, or those of the publisher, the editors and the reviewers. Any product that may be evaluated in this article or claim that may be made by its manufacturer is not guaranteed or endorsed by the publisher.
Research integrity at Frontiers
Learn more about the work of our research integrity team to safeguard the quality of each article we publish.