 Wencai Wang
 Zhizheng He
 Shangfei Hai
 Lifang Sheng
 Yongqing Han3,4*
94% of researchers rate our articles as excellent or good
Learn more about the work of our research integrity team to safeguard the quality of each article we publish.
Find out more
ORIGINAL RESEARCH article
Front. Environ. Sci., 20 May 2022
Sec. Atmosphere and Climate
Volume 10 - 2022 | https://doi.org/10.3389/fenvs.2022.875365
This article is part of the Research TopicDust and Polluted Aerosols: Sources, Transport and Radiative EffectsView all 13 articles
Asian dust deposition is an important source of nutrients to the Pacific Ocean, when aerosol dust is deposited into the ocean, it will affect the biological productivity and hence climate. In this paper, we analyzed a dust process that occurred in the Taklimakan Desert during 21–25 May 2019 by employing multi-sensor satellite observations and the WRF-Chem model. It is found that dust aerosols rise in the Taklimakan Desert, moving eastward at high altitudes under the role of the westerly winds, passing over the downwind regions, and deposition in the Pacific Ocean. Dust aerosol deposition results in an increase of chlorophyll-a (Chl-a) concentrations and particulate organic carbon (POC) after 2 days, Chl-a concentrations and POC increase by 175 and 873%, respectively. Moreover, the values of Chl-a concentrations and POC are 256 and 644% higher than the 5-years average during the same period.
Dust aerosol is an important aerosol type in the atmosphere, it plays an important role in the climate system, the marine and terrestrial ecosystem, and the environment in general (Zhao et al., 2020; Hu et al., 2021). On the one hand, dust aerosol can affect the radiation budget of climate by direct effect on thermal radiation and solar radiation (Sokolik and Toon, 1996; Wang et al., 2013). On the other hand, dust aerosol can affect cloud properties and precipitation by participating in cloud and precipitation processes (Wang et al., 2010; Huang et al., 2014; Wang et al., 2015; Tao et al., 2020). Moreover, when dust aerosol settles into the ocean, it can affect the growth of marine phytoplankton by providing nutrients, then affect the marine primary productivity, even the ocean surface carbon cycle.
Since the ‘iron hypothesis’ was proposed in 1991 (Martin et al., 1991), researchers have conducted numerous experiments on iron in various High Nutrient-Low Chlorophyll (HNLC) regions (Frost and Morel, 1991), which have successfully induced algal blooms and reduced the partial pressure of carbon dioxide at the sea surface (Emerson, 2019). In the natural environment, soluble iron in HNLC areas of mid-latitude North Pacific mainly depends on aerosols’ deposition (Moore and Braucher, 2008).
Yue et al. (2009) simulated the global distribution of dust sources by a global transport model and showed that the Middle East and Central Asia are the major sources of aerosol dust in the Northern Hemisphere. Many studies have shown that Asian dust aerosols can be transported over thousands of kilometers to the Pacific Ocean (Uno et al., 2009; Hu et al., 2019; Hu et al., 2020). Moreover, previous studies note that Asian dust plays a very important role in global oceanic biogeochemical cycles and hence climate since it can provide nutrients to the marine ecosystems (Bishop et al., 2002; Hsu et al., 2009; Mahowald et al., 2010).
Multi-sensor satellite observations provide valuable products to investigate dust aerosol’s transport and its effect on phytoplankton blooms. For example, the 8-year analysis of the SeaWIFS and BSC-DREAM8b model (the Barcelona Supercomputing Center, Spain- The Dust Regional Atmospheric Model) shows that the deposition of mineral dust from dust sources in the deserts of North Africa and the Middle East correlates well with the chlorophyll-a concentration in large areas of the Mediterranean Sea (Varenik and Kalinskaya, 2021). Tan et al. (2011); Tan and Shi (2012) find that Asian dust aerosol is positively correlated with Chl-a concentrations in the open sea of China by using long-term satellite observation. Luo et al. (2020) find that both Chl-a concentrations and particulate organic carbon (POC) increase after the dust deposition by using multi-sensor satellite data.
These results above prove the substantial importance of Asian dust deposition in the potential stimulation of phytoplankton production over Earth’s remote and spatially extensive ocean, especially over the Pacific Ocean. However, there are still some uncertainties in understanding the impact of dust aerosol on plankton growth due to the limited observations over the Pacific Ocean (Luo et al., 2020). Moreover, the amount of nutrients contained in aerosols is affected by aerosol type, aerosol source, aerosol transport path, and other factors (Luo et al., 2020; Wang et al., 2021), so multi-source data are needed to study the effect of aerosol on Chl-a concentration, especially the valuable observations from satellites in geostationary orbit which have a higher temporal and spatial resolution.
The purpose of this research is to analyze a dust case during 21–25 May 2019 and dust aerosol’s effect on Chl-a concentrations by using multi-sensor satellite data combined with other data and the WRF-Chem model.
The CALIPSO satellite is launched on 28 April 2006 (Li et al., 2015). CALIPSO L2 vertical feature mask (VFM) products can provide the spatial and temporal distributions of cloud and aerosol. Moreover, VFM can provide the type of aerosols, such as dusty marine, elevated smoke, polluted smoke, dust, polluted dust, clean continental, and clean marine.
In this paper, we obtain the CALIPSO L2 VFM data during May 21–25, 2019 (Version 4.20) over East Asia from the CALIPSO website (https://www-calipso.larc.nasa.gov/products/) to research aerosol type and its transport characters.
The Himawari-8 satellite was launched on 7 October 2014, which has higher temporal, spatial, and spectral resolution than previous satellites in geostationary orbit (Bessho et al., 2016). The Advanced Himawari Imager (AHI) onboard the Himawari-8 satellite has 16 observation bands from visible channel to infrared channel, and it can provide multi-spectral images over East Asia, Southeast Asia, and Oceania. Moreover, the AHI sensor offers distinct advantages for tracking dust aerosol movement since it can provide a full-disk picture every 10-min (She et al., 2018).
In this paper, AHI Level-2 calibrated data (AOT_L2_Mean, AHI equal latitude-longitude map Data-Daily Combined Aerosol, grid interval = 0.05) with the spatial resolution of 2 km are employed to study the temporal and spatial distribution of dust aerosol. Murakami (2016) proves that the Chl-a concentrations with a time resolution of 10 min derived by Himawari-8 have uncertainties due to noise interference, but the hourly and daily Chl-a concentration effectively reduce the error, so we use L3 daily data with the horizontal resolution of 5 km in our study to research the effect of dust deposition on plankton growth (http://www.eorc.jaxa.jp/ptree/index.html).
The wind components, geopotential height, temperature, and sea surface temperature (SST) data sets from the European Centre for Medium-Range Weather Forecasts (ECMWF) Reanalysis 5 data (ERA5) are used to analyze the meteorological conditions for dust aerosol transport and evaluate SST’s effect on phytoplankton growth for this case (https://cds.climate.copernicus.eu).
The merged L3 global ocean color products are used to provide POC information and the observations of photosynthetic active radiation (PAR), the POC and PAR with the spatial resolution of 5 km × 5 km are used in our study. Merged observations from multi-sensors can improve both the spatial and temporal coverage of the data (Wang et al., 2021).
The Global Ocean Forecasting System (GOFS) product (version 3.1) is used to analyze seawater velocity in the surface layer of the ocean in this study, the temporal resolution and spatial resolution for seawater velocity are 3-h and 0.08 × 0.04°.
The Simple Ocean Data Assimilation ocean reanalysis (SODA) product (version 3.4) is employed to study the upwelling velocity of the ocean in this study. The spatial resolution and temporal resolution for upwelling velocity are 0.5 × 0.5° and 5-days.
The Modern-Era Retrospective analysis for Research and Applications version 2 (MERRA-2) tavg1_2d_adg_Nx: 2d,1-Hourly, Time-averaged, Single-Level, Assimilation, Aerosol Diagnostics (extended) product (V5.12.4) are provided by Goddard Earth Sciences Data and Information Services Center (GES DISC). This data, with a temporal resolution of 1 h and a spatial resolution of 0.5 × 0.625°, was used to evaluate the dust deposition simulated by the WRF-Chem model.
The HYSPLIT model provided by the Australian Meteorological Agency and the National Oceanic and Atmospheric Administration Air Resources Laboratory is performed to study dust aerosol’s transport path. In this paper, the meteorological data input for the HYSPLIT model is derived from the Climate Data Center 1 (CDC1) meteorological data, and other information such as the transport altitudes of dust aerosol is obtained from the products of CALIPSO VFM.
The WRF-Chem model (Weather Research and Forecasting model coupled to Chemistry, version 3.9.1) is widely used in simulating the transport and the deposition amount of dust aerosols (Chen et al., 2017). In this paper, to cover the major source of dust aerosol (Taklimakan desert) and the deposition area for dust aerosol (the Northwestern Pacific Ocean), we set the model domain with 300 × 180 grids, the center of the domain is geographically located at 125°E and 40°N (black box in Figure 1), the vertical grid has 30 levels from 50 hPa to the ground. The meteorological fields input for the WRF-Chem model are provided by NCEP Climate Forecast System Version 2, the spatial and temporal resolution for meteorological data are 0.5 ° × 0.5 ° and 6-hourly. The chemical species’ initial and boundary conditions are derived from Community Atmosphere Model with Chemistry, and the anthropogenic emissions were set based on Emissions Database for Global Atmospheric Research inventory data. The simulation period in our study is 9–30 May 2019, and we set the first 7 days of simulation as a model spin-up for the dust case in our research.
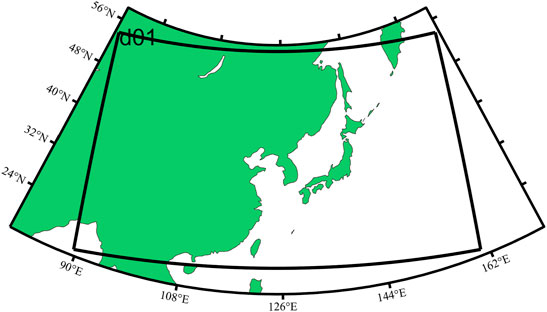
FIGURE 1. The WRF-Chem model domain (area surrounded by solid black lines).
In this study, we calculated the vertical sub-grid-scale turbulent flux caused by vortex transport using the boundary layer scheme of Yonsei University, and combined the Monin-Obukhov surface scheme with the Noah land surface scheme (Liu et al., 2016). Morrison’s two-moment microphysics scheme and Grell-Freitas integration scheme are used to simulate cloud microphysics and convection processes. We used GOCART scheme (Ginoux et al., 2001) to simulate and calculate dust emissions, and adopted four-dimensional assimilation method in the process of model simulation to reduce meteorological simulation errors. The mean bias is 1.30 m s−1, which is within the acceptable range (Kumar et al., 2014). The model simulation results were adopted to determine the consistency between the increase of Chl-a concentration and dust deposition in the study area.
Aerosol optical depth (AOD) can present the spatial distribution of atmospheric aerosol, especially dust (Liu et al., 2013; Zhang et al., 2019). Figure 2 shows the distribution of daily AOD observed by Himawari-8 satellite, we can see that there is a severe aerosol event in the Taklimakan Desert beginning on 21 May 2019 according to the AOD data (shading areas in Figure 2), aerosol layers with AOD greater than 0.8 move eastward with the wind according to the distribution of wind fields at 500 hPa (black arrow in Figure 2), passing over the Sea of Japan, and reach the northwest Pacific Ocean on 24 and 25 May as shown in Figure 2. During the whole period, the maximum value of AOD can reach 1.2 observed by the Himawari-8 satellite.
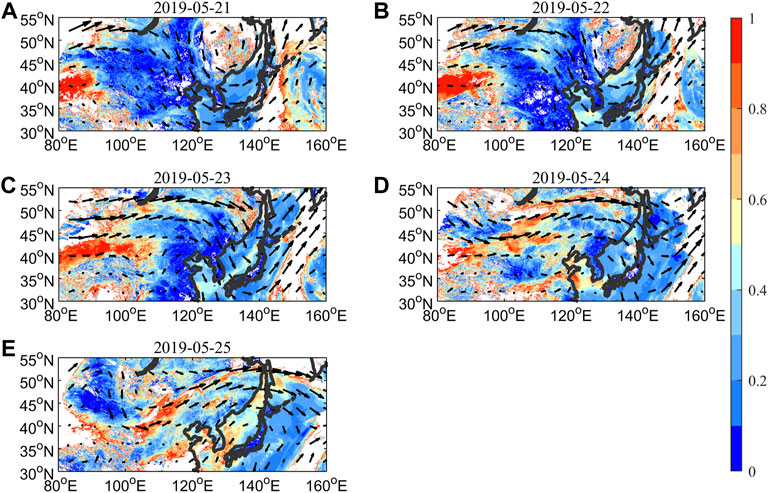
FIGURE 2. The average daily AOD observed by the Himawari-8 is superimposed with a wind field of 500 hPa (Black arrow) on 21 (A), 22 (B), 23 (C), 24 (D), and 25 (E) May 2019.
Figure 3 is the vertical distributions of aerosol types obtained by CALIPSO VFM products during 21–25 May 2019, its scan trajectory during this process is shown in Figure 4. As shown in Figure 3, dust aerosols distribute from 1 km to about 7 km over the dust source region (Taklimakan Desert). In the downwind region, dust aerosols distribute from 1 km to about 6 km. When dust aerosols transport to the Pacific Ocean, they distribute from 0 km to about 10 km. Based on the CALIPSO VFM results, dust aerosols account for more than 85% of all aerosols during 21–25 May 2019. Thus, dust particles are the dominant aerosol type in the whole process, the values of AOD in Figure 2 can be related to dust concentration in the atmosphere.
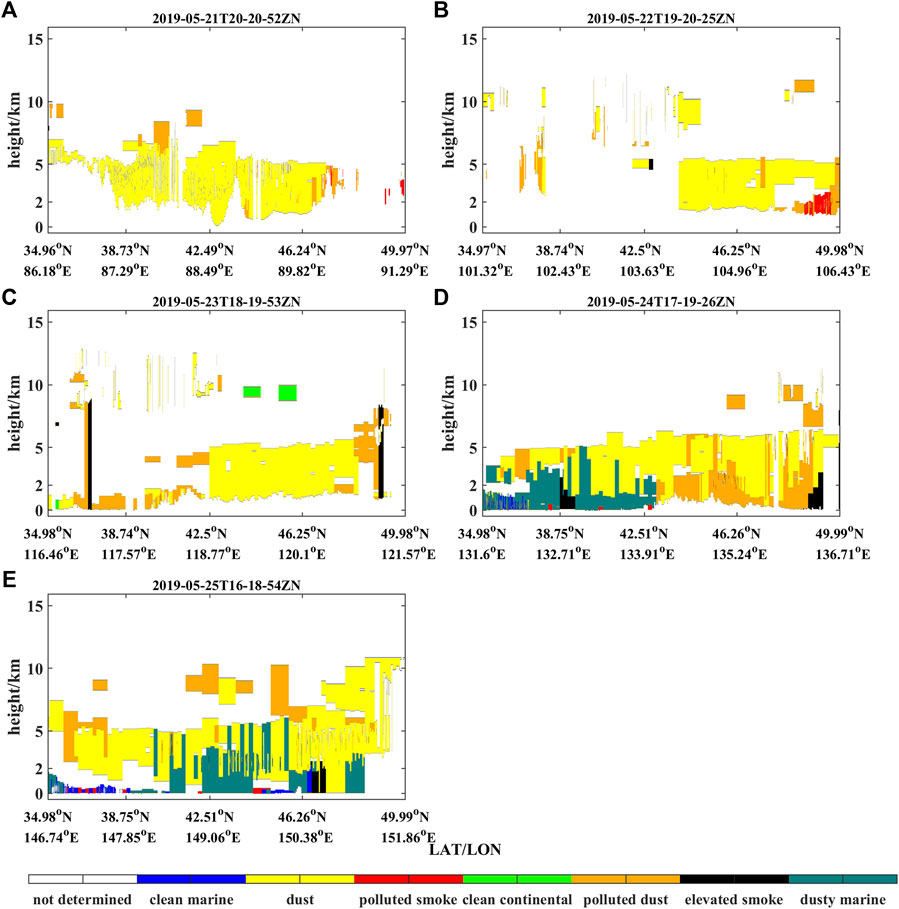
FIGURE 3. Vertical profiles of aerosol on 21 (A), 22 (B), 23(C), 24 (D), and 25 (E) May 2019 provided by CALIPSO VFM products.
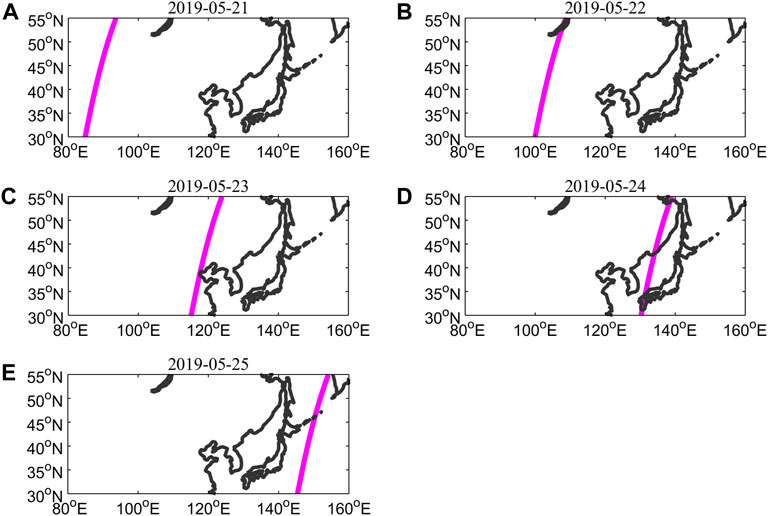
FIGURE 4. Trajectories of CALIPSO satellite (magenta line) on 21 (A), 22 (B), 23 (C), 24 (D), and 25 (E) May 2019 provided by CALIPSO VFM products.
A forward trajectory analysis simulated by the HYSPLIT model is conducted to find the transport paths of dust aerosols during 21–25 May 2019. The duration for the model is 93-h, and the initial height for the case is 1.5, 2.5, and 3.5 km where dust aerosols are observed on 21 May according to the results in Figure 3A. The CDC1 is used as the meteorological input at 20:00 UTC on 21 May. The model simulation shows that dust aerosols originate from the Taklimakan Desert on 21 May 2019, then spread eastward, passed over the east of China, and reach the western part of the Pacific Ocean on 24 and 25 May 2019, consistent with the results in Figure 2.
Meteorological condition plays an important role in dust aerosol horizontal transport (Uno et al., 2009). Figures 6A–E presents the potential height field and temperature field at 500 hPa during 21–25 May 2019. We can see that there is a strong cold advection at the height of 500 hPa, which is conducive for sweeping dust aerosol from the northwestern region across Northeast China, and reaching the Pacific Ocean.
To sum up, based on the results in Figures 2,3, Figures 5,6, dust aerosols rise in the Taklimakan Desert, moving eastward at high altitudes under the effect of the westerly winds, passing over the downwind regions, and deposition in the Pacific Ocean.
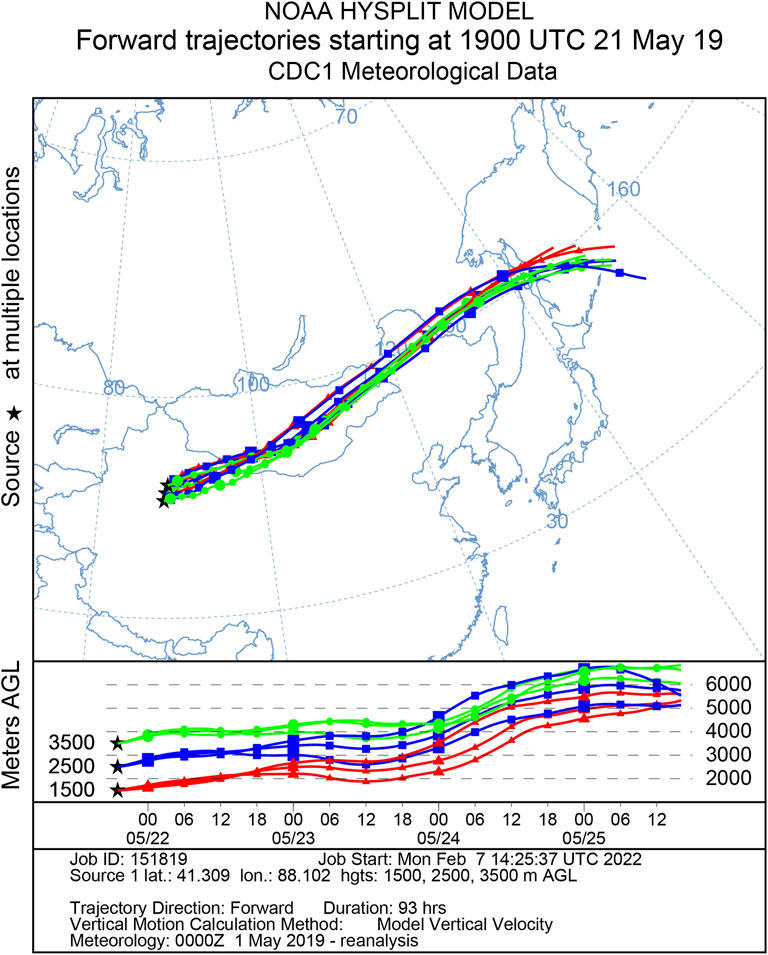
FIGURE 5. The particle forward trajectories (93 h) beginning at 20:00 UTC 21 May 2019 by CDC1 meteorological data using the online HYSPLIT model. The begin point is set in Taklimakan Desert at 40.596°N/87.8723°E, 41.309°N/88.102°E and 42.023°N/88.336°E position. The beginning point height is set to 1.5 km (red), 2.5 km (blue), and 3.5 km (green).
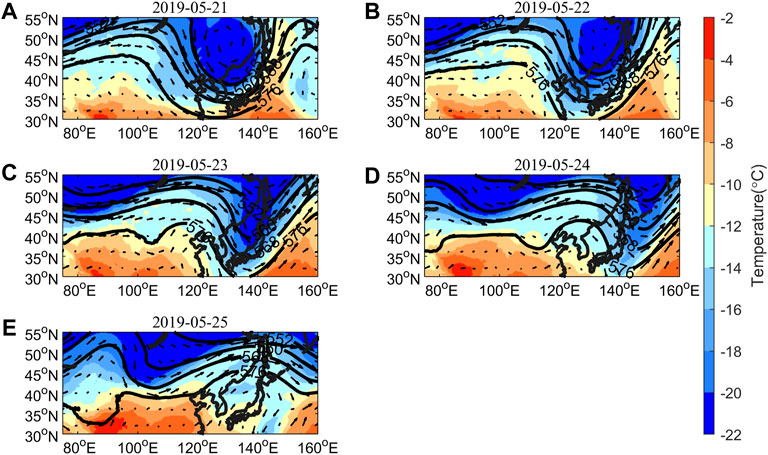
FIGURE 6. The potential height field (black line), temperature field, and wind field at 500 hPa on 21 (A), 22 (B), 23 (C), 24 (D), and 25 (E) May 2019 as observed by ERA5.
The spatial distribution of Chl-a concentrations from 24–30 May 2019 is studied with the observations from the Himawari-8 satellite which is in geostationary earth orbit (GEO). The satellite in GEO can provide high temporal resolution of Chl-a concentrations compared to polar orbit satellites. Figure 7 shows the spatial distribution of Chl-a concentrations from 24–30 May 2019. It is obvious that Chl-a concentrations massively increase on 26 May due to the deposition of dust, and lasted until 28 May. However, there are some missing values of Chl-a concentrations because of the existence of clouds, because Himawari-8 observes the Chl-a concentrations in the visible band. To better investigate the dust aerosol’s effect on Chl-a concentrations, we define a relatively small region (45–50°N, 145–155°E) as shown in Figure 7 (Black box) with data relatively integrity as the research region.
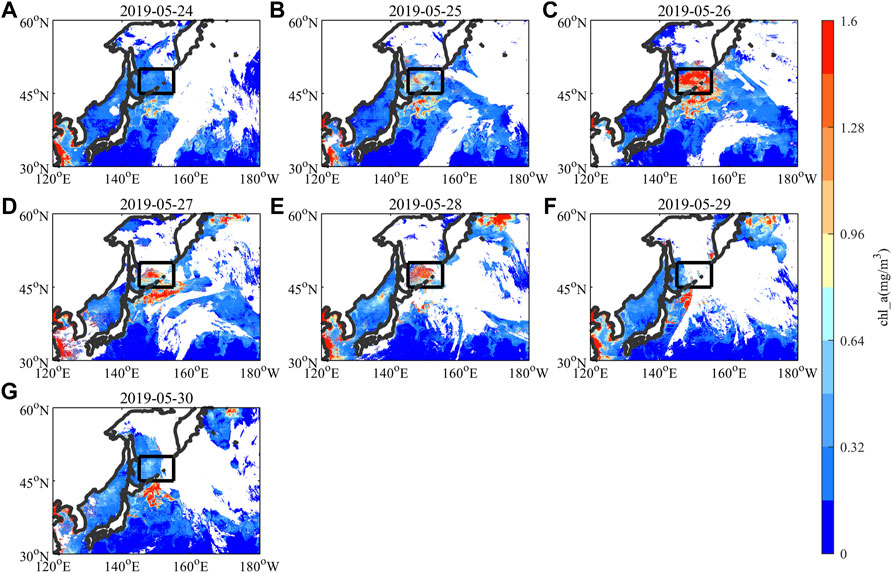
FIGURE 7. Spatial pattern of daily mean Chlorophyll-a concentration on 24 (A), 25 (B), 26 (C), 27 (D), 28 (E), 29 (F), and 30 (G) May 2019.
The seawater velocity represents the horizontal movement of the ocean. To investigate the oceanic transport effect on the position of deposition dust aerosols, we use seawater velocity derived from the GOFS3.1 product to calculate the longitudinal and latitudinal displacement for the research region. Figure 8 shows the eastward and northward seawater velocity in the surface ocean (depth <100 m) from 12 May to 4 June 2019. The positive value means seawater flows eastward or northward. The total longitudinal and latitudinal displacement from 24 May to 4 June is about 80 km based on the results in Figure 8, respectively. Thus, the change in longitude and latitude caused by seawater movement is less than 6.7 km/day. However, the area for the research region is roughly 550 km (longitude length) and 750 km (latitudinal length). Therefore, we conclude that the movement range of dust deposition carried by seawater movement is far smaller than that of the research region, so we assume that dust deposition remains in the research region and provide nutrients for phytoplankton.
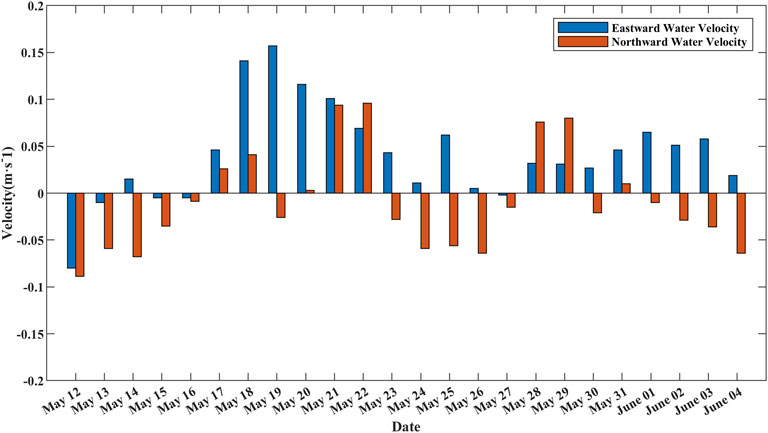
FIGURE 8. The eastward and northward seawater velocity during 12 May to 4 June 2019.
Besides nutrient input present in the aerosols, PAR and SST also can impact the Chl-a concentrations (Luo et al., 2020; Wang et al., 2021). To evaluate those factors’ effect on Chl-a concentrations, the variation of the daily mean values of those factors (such as PAR, dust deposition amount, SST) are drawn over the research region using the Himawari-8 data, ERA-5 datasets, and the merged L3 global ocean color products during 24 May to 4 June 2019 (Figure 9).
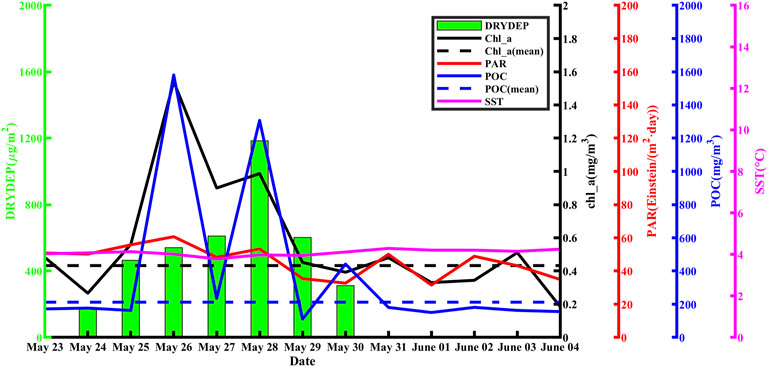
FIGURE 9. Temporal variation of Chl-a concentrations (black), SST (magenta), PAR (red) and POC (blue) from 24 May to 4 June 2019. Dotted lines illustrate the averaged value in this period over a 5-year period in the research region with colors representing different variables. The green bar is the dust deposition simulated by the WRF-Chem model.
In Figure 9, the dotted lines are the 5-year averaged values for Chl-a concentrations (black) and POC (blue) over the same period in the research region. The WRF-Chem model simulate that the average dust deposition is 179.79 μg m−2 (Table 1) on 24 May, and the simulation results began to decrease on 25 May (463.84 μg m−2), which was consistent with the change of Himawari-8 AOD from 24 May (0.22) to 25 May (0.36). We also can see that the Chl-a concentrations increased on 26 May after the dust deposition on 24 May as shown in Figure 9. The response time is 2 days, which is similar to the iron enrichment experiment (Tsuda et al., 2003). However, dust aerosols continuously deposit into the ocean from 24 to 30 May, and the Chl-a concentrations only increase from 26 to 28 May as shown in Figure 9 and Table. 1. One reason for this phenomenon is the missing observation of Chl-a concentrations due to clouds and other factors on 29 May, another reason is that the nutrient needed by the phytoplankton is oversaturated, so Chl-a concentrations do not increase after 30 May. We also can see that Chl-a concentrations have two peaks during this period, this is due to the missing values of Chl-a concentrations. Furthermore, during the response process, Chl-a concentrations increase from 0.56 mg m−3 (25 May) to 1.54 mg m−3 (26 May), which is an increase of nearly 175%. Moreover, the Chl-a concentrations (1.54 mg m−3) are 256% larger than their mean values during the same periods from 2016 to 2019 (0.433 mg m−3). After 29 May, the values of Chl-a concentrations decrease to less than 0.45 mg m−3.
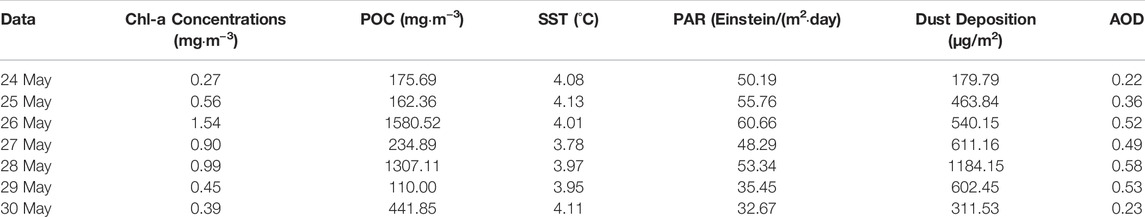
TABLE 1. The values of Chl-a concentrations, POC, SST, PAR, and dust deposition as simulated by WRF-Chem model during 24–30 May.
Suitable SST is also helpful in increasing Chl-a concentrations. In our case, the mean values of SST are 4.13, 4.01, 3.78, and 3.97 during 25–28 May. It is noted that SST shows a downward trend during Chl-a concentrations increase, the decrease in SST could easily be associated with oceanic upwelling, which can bring nutrients to the surface ocean. To investigate the possible contribution of upwelling in this case, we analyzed the upwelling velocity from SODA 3.4. Our results indicate that the mean value of upwelling velocity is about 0.053 m/d from 24 May to 28 May, which is lower than the mean value of upwelling velocity (0.085 m/d) in May 2019. Thus, the nutrient provided by the rising movement of seawater is lower than the mean values of nutrients in May 2019. Therefore, both the nutrients transported by oceanic upwelling and SST are not the main factors that lead to the increase in Chl-a concentrations.
Iwasaki (2020) indicate that typhoon also can directly or indirectly affect the Chl-a concentration in the Pacific Ocean through precipitation and strong sea surface winds. However, there was no typhoon process during May 21 to 25 May 2019 as shown in Figure 6, thus typhoon is not a factor that lead to the change in Chl-a concentrations for this case.
On the other hand, PAR presents a slight increase trend on 26 May compared with the value on 25 May, then shows a decreasing trend during 26 May to 30 May. During this period, the maximum value of Chl-a concentrations occur on 26 May, which means that dust deposition and PAR both promote the growth of phytoplankton on 26 May. However, the value of PAR on 25 May (55.76 Einstein/(m2·day)) is larger than that on 27 May (48.29 Einstein/(m2·day)), while the value of Chl-a concentrations on 25 May (0.56 mg m−3) is smaller than that on 27 May (0.90 mg m−3) as shown in Table. 1, suggesting PAR is not the main factor that leads to the increase in Chl-a concentrations for this case. To sum up, based on the results discussed above, dust aerosol deposition could be the major reason for the increase in Chl-a concentrations in this case.
When dust deposition stimulates the growth of phytoplankton, it can trigger ocean biological pumps, leading to more absorption of CO2 from the atmosphere to the ocean (Pan et al., 2011). In this paper, we use the variations in POC to assess marine biological pumps caused by dust aerosol deposition. As shown in Figure 9, POC shows a similar trend to those of Chl-a concentrations. the POC increased on 26 May after the dust deposition on 24 May. The response time is 2 days, which is similar to the iron enrichment experiment (Tsuda et al., 2003). In addition, the POC has two peaks during this period, which is consistent with Chl-a concentrations. During the response process, POC increased from 162.36 mg m−3 (25 May) to 1,580.52 mg m−3 (26 May), increasing nearly 873%. Moreover, the value of POC (1,580.52 mg m−3) was 644% higher than its mean value in this period from 2016 to 2019 (212.25 mg m−3).
Dust aerosols settling into the ocean can promote marine phytoplankton by supplying nutrients, leading to more absorption of CO2 from the atmosphere to the ocean, and even have an influence on planetary climate.
This paper research a dust episode during 21–25 May 2019, analyzes the transport and deposition of dust aerosols, quantify dust aerosol deposition on marine primary productivity by using multi-sensor satellite data and the WRF-Chem model. Model simulation and observation show that dust aerosol originated from Taklimakan Desert passing over the eastern of China and reach the research region during 24–30 May 2019, dust deposition led to an increase in Chl-a concentrations and POC after 2 days, Chl-a concentrations increase 256% compared with the 5-year average values, POC shows the similar trend as the Chl-a concentrations which increase 644% compared with the 5-year average values.
The previous studies mainly use polar orbit satellite products to study the change of Chl-a concentration due to dust aerosol deposition (Tan et al., 2016; Luo et al., 2020), so the missing observations are relatively more compared with geostationary orbit satellite products. In our study, we use the Himawari-8 satellite which has higher temporal, spatial, and spectral resolution than previous satellites in geostationary orbit, so the products can better reflect the change in Chl-a concentration due to dust deposition. However, the case in our study is a comprehensive demonstration that dust aerosol’s deposition leads to the growth of phytoplankton which in turn triggers marine biological pump action. In the future work, we will use long-term data including observation over the ocean to investigate dust aerosol’s effect on marine primary productivity.
The raw data supporting the conclusions of this article will be made available by the authors, without undue reservation.
WW and YH designed and write the paper. ZH and SH contributed to data processing and model simulation. LS and YZ contributed to the review and edit.
This work is jointly supported by the National Natural Science Foundation of China (Nos. 41875174, 41505013). We acknowledge NASA for providing the CALIPSO data, Japan Meteorological Agency for providing Himawari-8 data, and NASA and the ESA for providing Merged Ocean Color.
The authors declare that the research was conducted in the absence of any commercial or financial relationships that could be construed as a potential conflict of interest.
All claims expressed in this article are solely those of the authors and do not necessarily represent those of their affiliated organizations, or those of the publisher, the editors and the reviewers. Any product that may be evaluated in this article, or claim that may be made by its manufacturer, is not guaranteed or endorsed by the publisher.
Bessho, K., Date, K., Hayashi, M., Ikeda, A., Imai, T., Inoue, H., et al. (2016). An Introduction to Himawari-8/9— Japan’s New-Generation Geostationary Meteorological Satellites. J. Meteorological Soc. Jpn. 94, 151–183. doi:10.2151/jmsj.2016-009
Bishop, J. K. B., Davis, R. E., and Sherman, J. T. (2002). Robotic Observations of Dust Storm Enhancement of Carbon Biomass in the North Pacific. Science 298, 817–821. doi:10.1126/science.1074961
Chen, S., Huang, J., Kang, L., Wang, H., Ma, X., He, Y., et al. (2017). Emission, Transport, and Radiative Effects of Mineral Dust from the Taklimakan and Gobi Deserts: Comparison of Measurements and Model Results. Atmos. Chem. Phys. 17, 2401–2421. doi:10.5194/acp-17-2401-2017
Emerson, D. (2019). Biogenic Iron Dust: A Novel Approach to Ocean Iron Fertilization as A Means of Large Scale Removal of Carbon Dioxide from the Atmosphere. Front. Mar. Sci. 6, 22. doi:10.3389/fmars.2019.00022
Frost, B. W., and Morel, F. M. (1991). The Role of Grazing in Nutrient-Rich Areas of the Open Sea. Limnol. Oceanogr. 36, 1616–1630. doi:10.4319/lo.1991.36.8.1616
Ginoux, P., Chin, M., Tegen, I., Prospero, J. M., Holben, B., Dubovik, O., et al. (2001). Sources and Distributions of Dust Aerosols Simulated with the GOCART Model. J. Geophys. Res. 106, 20255–20273. doi:10.1029/2000JD000053
Hsu, S.-C., Liu, S. C., Arimoto, R., Liu, T.-H., Huang, Y.-T., Tsai, F., et al. (2009). Dust Deposition to the East China Sea and its Biogeochemical Implications. J. Geophys. Res. 114, D15304. doi:10.1029/2008JD011223
Hu, Z., Huang, J., Zhao, C., Ma, Y., Jin, Q., Qian, Y., et al. (2019). Trans-Pacific Transport and Evolution of Aerosols: Spatiotemporal Characteristics and Source Contributions. Atmos. Chem. Phys. 19, 12709–12730. doi:10.5194/acp-19-12709-2019
Hu, Z., Huang, J., Zhao, C., Jin, Q., Ma, Y., and Yang, B. (2020). Modeling Dust Sources, Transport, and Radiative Effects at Different Altitudes over the Tibetan Plateau. Atmos. Chem. Phys. 20, 1507–1529. doi:10.5194/acp-20-1507-2020
Hu, Z., Jin, Q., Ma, Y., Pu, B., Ji, Z., Wang, Y., et al. (2021). Temporal Evolution of Aerosols and Their Extreme Events in Polluted Asian Regions during Terra's 20-year Observations. Remote Sens. Environ. 263, 112541. doi:10.1016/j.rse.2021.112541
Huang, J., Wang, T., Wang, W., Li, Z., and Yan, H. (2014). Climate Effects of Dust Aerosols over East Asian Arid and Semiarid Regions. J. Geophys. Res. Atmos. 119, 11398–11416. doi:10.1002/2014JD021796
Iwasaki, S. (2020). Daily Variation of Chlorophyll-A Concentration Increased by Typhoon Activity. Remote Sens. 12, 1259. doi:10.3390/rs12081259
Kumar, R., Barth, M. C., Pfister, G. G., Naja, M., and Brasseur, G. P. (2014). WRF-chem Simulations of a Typical Pre-monsoon Dust Storm in Northern India: Influences on Aerosol Optical Properties and Radiation Budget. Atmos. Chem. Phys. 14, 2431–2446. doi:10.5194/acp-14-2431-2014
Li, J., Huang, J., Stamnes, K., Wang, T., Lv, Q., and Jin, H. (2015). A Global Survey of Cloud Overlap Based on CALIPSO and CloudSat Measurements. Atmos. Chem. Phys. 15, 519–536. doi:10.5194/acp-15-519-2015
Liu, L., Huang, X., Ding, A., and Fu, C. (2016). Dust-Induced Radiative Feedbacks in North China: A Dust Storm Episode Modeling Study Using WRF-Chem. Atmos. Environ. 129, 43–54. doi:10.1016/j.atmosenv.2016.01.019
Liu, X. G., Li, J., Qu, Y., Han, T., Hou, L., Gu, J., et al. (2013). Formation and Evolution Mechanism of Regional Haze: A Case Study in the Megacity Beijing, China. Atmos. Chem. Phys. 13, 4501–4514. doi:10.5194/acp-13-4501-2013
Luo, C., Wang, W., Sheng, L., Zhou, Y., Hu, Z., Qu, W., et al. (2020). Influence of Polluted Dust on Chlorophyll-A Concentration and Particulate Organic Carbon in the Subarctic North Pacific Ocean Based on Satellite Observation and the WRF-Chem Simulation. Atmos. Res. 236, 104812. doi:10.1016/j.atmosres.2019.104812
Mahowald, N. M., Kloster, S., Engelstaedter, S., Moore, J. K., Mukhopadhyay, S., McConnell, J. R., et al. (2010). Observed 20th Century Desert Dust Variability: Impact on Climate and Biogeochemistry. Atmos. Chem. Phys. 10, 10875–10893. doi:10.5194/acp-10-10875-2010
Martin, J. H., Gordon, M., and Fitzwater, S. E. (1991). The Case for Iron. Limnol. Oceanogr. 36, 1793–1802. doi:10.4319/lo.1991.36.8.1793
Moore, J. K., and Braucher, O. (2008). Sedimentary and Mineral Dust Sources of Dissolved Iron to the World Ocean. Biogeosciences 5, 631–656. doi:10.5194/bg-5-631-2008
Murakami, H. (2016). Ocean Color Estimation by Himawari-8/AHI. Proc. SPIE 9878, 987810. doi:10.1117/12.2225422
Pan, A., Pourziaei, B., and Huang, H. (2011). Effect of Ocean Iron Fertilization on the Phytoplankton Biological Carbon Pump. Adv. Appl. Math. Mech. 3, 52–64. doi:10.4208/aamm.10-m1023
She, L., Xue, Y., Yang, X., Guang, J., Li, Y., Che, Y., et al. (2018). Dust Detection and Intensity Estimation Using Himawari-8/AHI Observation. Remote Sens. 10, 490. doi:10.3390/rs10040490
Sokolik, I. N., and Toon, O. B. (1996). Direct Radiative Forcing by Anthropogenic Airborne Mineral Aerosols. Nature 381, 681–683. doi:10.1038/381681a0
Tan, S.-C., and Shi, G.-Y. (2012). Transport of a Severe Dust Storm in March 2007 and Impacts on Chlorophyll a Concentration in the Yellow Sea. SOLA 8, 85–89. doi:10.2151/sola.2012-022
Tan, S.-C., Shi, G.-Y., Shi, J.-H., Gao, H.-W., and Yao, X. (2011). Correlation of Asian Dust with Chlorophyll and Primary Productivity in the Coastal Seas of China during the Period from 1998 to 2008. J. Geophys. Res. 116, G02029. doi:10.1029/2010JG00145610.1029/2010jg001456
Tan, S., Li, J., Gao, H., Wang, H., Che, H., and Chen, B. (2016). Satellite-Observed Transport of Dust to the East China Sea and the North Pacific Subtropical Gyre: Contribution of Dust to the Increase in Chlorophyll during Spring 2010. Atmosphere 7, 152. doi:10.3390/atmos7110152
Tao, M., Wang, J., Li, R., Chen, L., Xu, X., Wang, L., et al. (2020). Characterization of Aerosol Type over East Asia by 4.4 Km MISR Product: First Insight and General Performance. J. Geophys. Res. Atmos. 125, e2019JD031909. doi:10.1029/2019JD031909
Tsuda, A., Takeda, S., Saito, H., Nishioka, J., Nojiri, Y., Kudo, I., et al. (2003). A Mesoscale Iron Enrichment in the Western Subarctic Pacific Induces a Large Centric Diatom Bloom. Science 300, 958–961. doi:10.1126/science.1082000
Uno, I., Eguchi, K., Yumimoto, K., Takemura, T., Shimizu, A., Uematsu, M., et al. (2009). Asian Dust Transported One Full Circuit Around the Globe. Nat. Geosci. 2, 557–560. doi:10.1038/ngeo583
Varenik, A. V., and Kalinskaya, D. V. (2021). The Effect of Dust Transport on the Concentration of Chlorophyll-A in the Surface Layer of the Black Sea. Appl. Sci. 11, 4692. doi:10.3390/app11104692
Wang, W., Huang, J., Minnis, P., Hu, Y., Li, J., Huang, Z., et al. (2010). Dusty Cloud Properties and Radiative Forcing over Dust Source and Downwind Regions Derived from A-Train Data during the Pacific Dust Experiment. J. Geophys. Res. 115, D00H35. doi:10.1029/2010JD014109
Wang, W., Huang, J., Zhou, T., Bi, J., Lin, L., Chen, Y., et al. (2013). Estimation of Radiative Effect of a Heavy Dust Storm over Northwest China Using Fu-Liou Model and Ground Measurements. J. Quantitative Spectrosc. Radiat. Transf. 122, 114–126. doi:10.1016/j.jqsrt.2012.10.018
Wang, W., Sheng, L., Jin, H., and Han, Y. (2015). Dust Aerosol Effects on Cirrus and Altocumulus Clouds in Northwest China. J. Meteorol. Res. 29, 793–805. doi:10.1007/s13351-015-4116-9
Wang, W., Luo, C., Sheng, L., Zhao, C., Zhou, Y., and Chen, Y. (2021). Effects of Biomass Burning on Chlorophyll-A Concentration and Particulate Organic Carbon in the Subarctic North Pacific Ocean Based on Satellite Observations and WRF-Chem Model Simulations: A Case Study. Atmos. Res. 254, 105526. doi:10.1016/j.atmosres.2021.105526
Yue, X., Wang, H., Wang, Z., and Fan, K. (2009). Simulation of Dust Aerosol Radiative Feedback Using the Global Transport Model of Dust: 1. Dust Cycle and Validation. J. Geophys. Res. 114, D10202. doi:10.1029/2008JD010995
Zhang, Z., Fan, M., Wu, W., Wang, Z., Tao, M., Wei, J., et al. (2019). A Simplified Aerosol Retrieval Algorithm for Himawari-8 Advanced Himawari Imager over Beijing. Atmos. Environ. 199, 127–135. doi:10.1016/j.atmosenv.2018.11.023
Keywords: dust aerosol, CALIPSO, HAMAWARI-8, chlorophyll-a concentration, WRF-chem model
Citation: Wang W, He Z, Hai S, Sheng L, Han Y and Zhou Y (2022) Dust Aerosol’s Deposition and its Effects on Chlorophyll-A Concentrations Based on Multi-Sensor Satellite Observations and Model Simulations: A Case Study. Front. Environ. Sci. 10:875365. doi: 10.3389/fenvs.2022.875365
Received: 14 February 2022; Accepted: 11 April 2022;
Published: 20 May 2022.
Edited by:
Zhiyuan Hu, Sun Yat-sen University, ChinaReviewed by:
Yong Han, Sun Yat-sen University, ChinaCopyright © 2022 Wang, He, Hai, Sheng, Han and Zhou. This is an open-access article distributed under the terms of the Creative Commons Attribution License (CC BY). The use, distribution or reproduction in other forums is permitted, provided the original author(s) and the copyright owner(s) are credited and that the original publication in this journal is cited, in accordance with accepted academic practice. No use, distribution or reproduction is permitted which does not comply with these terms.
*Correspondence: Wencai Wang, d2FuZ3djQG91Yy5lZHUuY24=; Yongqing Han, cWluZ3lvbmdoYW5AMTYzLmNvbQ==
Disclaimer: All claims expressed in this article are solely those of the authors and do not necessarily represent those of their affiliated organizations, or those of the publisher, the editors and the reviewers. Any product that may be evaluated in this article or claim that may be made by its manufacturer is not guaranteed or endorsed by the publisher.
Research integrity at Frontiers
Learn more about the work of our research integrity team to safeguard the quality of each article we publish.