 Long Yang
 Min Zhang
 Jia Wei
 Jun Qi
- 1China Urban Construction Design & Research Institute Co., Ltd., Beijing, China
- 2Key Laboratory of Building Collapse Mechanism and Disaster Prevention, Institute of Disaster Prevention, China Earthquake Administration, Sanhe, China
- 3Shanghai Municipal Engineering Design Institute (Group) Co., Ltd., Shanghai, China
Raising the water pollution control countermeasures on the basis of rational pollution load estimation is significant for improving water quality. Zhangze Reservoir, the largest water body in Changzhi city, China, was selected for this study. Considering the information constraints of the reservoir basin, the pollution load estimation method system covering point sources, non-point sources, and internal sources is systematically constructed using an export coefficient model, an sediment pore water diffusion model, and other methods, with the aim of estimating the discharge of pollutants into the Zhangze Reservoir from domestic sources, industrial sources, agricultural sources, sediment release, and urban runoff. The findings indicate the following: 1) the pollution loads of COD, NH3-N, TN, and TP are 3,157.82t, 177.62t, 760.72t, and 42.29t, respectively; 2) in terms of the distribution of pollution sources, urban domestic sources top the rest, accounting for 65.47% of COD, 82.83% of NH3-N, 79.00% of TN, and 60.65% of TP, followed by the agricultural source; 3) the total discharge of the main water pollutants exceeds the water environmental capacity, characterized as the dominating existence of domestic point source, the coexistence of point sources and non-point sources, and the coexistence of exogenous sources and endogenous sources. Finally, control countermeasures are raised to minimize the total discharge of pollutants for improving the water quality.
1 Introduction
Water is an irreplaceable natural resource for the sustainable development of society, economy, and environment. As one of the most important links in water environment protection and water pollution control, pollution source analysis is directly related to the improvement of water environment quality and ecosystem health. Researchers have completed plenty of studies on pollution load estimation, pollution source identification, and control countermeasure development. Water pollution loads are mainly estimated via the mechanism model (MM) and export coefficient model (ECM). Hydrological and water quality mechanism models, such as SWAT, SWMM, STORM, HSPF, ANSWERS, CREAMS, EPDC, AGNPS, and GLEAMS, may be used to 1) simulate and estimate pollution loads, 2) analyze the temporal and spatial characteristics of pollution generation, 3) identify the key pollution source areas and migration paths, and 4) evaluate the impact of pollution load on water bodies (Yang et al., 2020). In practice, MM is adaptive to long-time series simulated calculations thanks to its high flexibility, strong transportability, and high computation efficiency.
Zeynep et al. (Pongpetch et al., 2015; Liu et al., 2016; Özcan et al., 2017; Nasab et al., 2018) simulated and studied agricultural non-point source pollution in the Lake Mogan Watershed, Xiangxi River, Red River, and Lam Takong River by using the SWAT model. Soudabeh et al. (Nazari-Sharabian et al., 2019; Baek et al., 2020; Marlène et al., 2021; Soudabeh et al., 2021; Yazdi et al., 2021) studied the effects of green infrastructure (LID-BMPs), retention ponds, stormwater control countermeasures, and vegetative swales on the control of rainwater runoff pollution by using the SWMM model. Yuan et al. (Jie and Xinlin, 2020) conducted research on the surface and core sediments of the lower reaches of the Han River (a tributary of the Yangtze River) and evaluated nitrogen pollution in sediments and nitrogen flux at the sediment–water interface and their influencing factors. Roderick et al. (Lammers and Bledsoe, 2019) constructed a river erosion model to simulate the potential of phosphorus and sediment load in basins, and their findings showed that channel erosion did not result in a large amount of phosphorus to basins but would lead to a large amount of sediment. Fan and Ding (2016) employed the EFDC model to quantitatively evaluate the impact of tail water of a wastewater treatment plant on the water environment in the harbor.
However, MM is complex in structure and requires detailed data to calibrate and verify model parameters. Moreover, incomplete data and low data sharing extent may restrict the application of the model. Therefore, for watersheds under data and information constraints, it is unpractical to use MM as a means to manage practice. As the complex process of pollution is not considered in ECM, such a model is simple, requiring fewer parameters and being easy in operation. Additionally, it can also achieve sufficient accuracy to reflect the comprehensive export intensity of watershed pollution to a great extent. Therefore, ECM, regarded as a reliable method, can simulate the water pollution load of medium and large-scale watersheds without long-term series monitoring data, thus making it widely used in pollution load estimation (Xue and Yang, 2009). The export coefficient is its most important parameter, but it is difficult to determine; hence, the application of the method depends on how to fix a reasonable export coefficient (Ying et al., 2010). Through the literature consultation method, Tong et al. (2022) calculated the export coefficients of different land-use types combined with improved observation experiments and estimated the load of TN and TP of evaluated non-point sources from different pollution sources, including farmland, decentralized economic animal breeding, and domestic pollution sources. Taking the Hujiashan small watershed as the study area, combined with long-term field observation data, Han et al. (2017) used the ECM and explored the effect of a small watershed management project on the temporal and spatial variations of TN load of non-point source pollution under the support of GIS technology. Wu et al. (2015) proposed a modified export coefficient method considering the rainfall erosivity factors to simulate and the NPS nitrogen and phosphorus loss load caused by soil and water loss in the Yanhe River basin of the hilly and gully area, Loess Plateau.
Being complex in type and obscure in formation mechanism, the occurrence of water pollutants is uncertain and varies differently in time and space, resulting in great difficulties in monitoring, simulation, and control. In this sense, it may be extremely difficult for people to fully understand the discharge of point sources, non-point sources, and endogenous sources into a water body by using a single model method. Therefore, the research studies may be directed at how to integrate multiple methods, weaken the limitations of a single model, and construct a pollution load estimation method system for multiple pollution sources so as to improve the reliability and universality of models, further analyze the characteristics of pollution sources, and finally put forward more accurate control countermeasures. In this study, in view of the information constraints of the Zhangze Reservoir watershed, the largest water body in Changzhi city, China, using the export coefficient model, the sediment pore water diffusion model, and other methods, a pollution load estimation method system is constructed, including point source and non-point source, exogenous source and endogenous source, including domestic source, industrial source, agricultural source, endogenous release of water sediment and urban runoff pollution. The study considers the pollution types in a more comprehensive and systematic way when analyzing the same water pollution source; besides, in the estimation process of urban/rural life scattered discharge pollution, economic animal breeding pollution, farmland nutrient loss, and urban runoff pollution, the correlation coefficients are selected and determined according to the field situation in the study area; and finally, after calculating the discharge of pollutants like COD, NH3-N, TN, and TP, according to the water environmental capacity of the Zhangze Reservoir, the control countermeasures are put forward and a technical loop of “pollution load estimation/total amount control/pollution control countermeasures” is built against various pollution sources, thereby providing decision support for improving water quality and promoting sustainable development for the Zhangze Reservoir.
2 Data and Methodology
2.1 Study Area
As part of the Haihe River watershed, Zhangze Reservoir is located in Luzhou district, Changzhi city, Shanxi Province, China. With a total capacity of 427 million m3 and a coverage of 24 km2, it is a large-scale water conservancy project that serves multiple purposes, including industrial and urban water supply, irrigation, flood control, aquaculture, and tourism (Li, 2014). From the 1960s to 1990s, the Zhangze Reservoir maintained a Class III water quality standard, although it had been slightly polluted. Since then, as urbanization accelerated and agriculture developed rapidly, a large amount of domestic sewage, industrial wastewater, and non-point source pollutants have been discharged into the reservoir, worsening its water quality. According to monitoring data, its water quality gradually deteriorated after 2003; by 2016, it could even nearly reach the Class V standard due to the out-of-limit indicators of TN and TP, calling for urgent treatment (Wang, 2019). This study involved both the catchment area and the administrative area of the Zhangze Reservoir. Those areas most significantly affected by human activities were selected for the study, including Luzhou district, Lucheng district, Shangdang district, Tunliu district, and Changzi County, as shown in Figure 1.
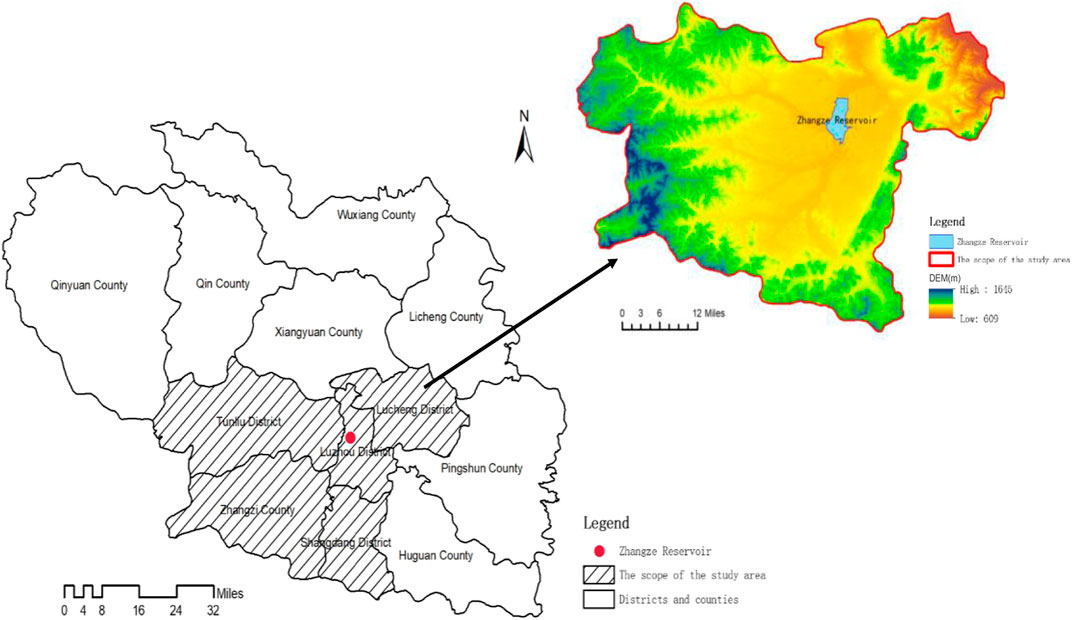
FIGURE 1. Location map of the study area.
2.2 Data Source
This study contains data on pollutants mainly from urban domestic, rural domestic, industry, economic animal breeding, farmland runoff, sediment, urban runoff, and other pollution sources, as well as data on reservoir water quality (COD, NH3-N, TN, and TP were selected as water quality indicators). Taking 2018 as the base year, the data sources are presented as follows: 1) the monitoring data of effluent quantity, flow rate, and water quality of wastewater treatment plants required for urban domestic pollution source estimation were provided by sewage treatment plants, and population data by local statistical departments; 2) the data of rural population, distribution area, sewage treatment mode, and sewage discharge required for rural domestic pollution source estimation were provided by ecological environment management departments; 3) the data (environmental statistics of 2018) of industrial enterprises, pollutant types, wastewater discharge, discharge concentration, and treatment methods required for industrial pollution source estimation were provided by local ecological environment departments, the statistical objects being industrial enterprises producing wastewater in the study areas; 4) the data (survey statistics of 2018) of economic animal breeding pollution sources, farmland runoff pollution sources, economic animal breeding quantity, livestock and poultry types, manure treatment methods, wastewater discharge, crop types, planting areas, fertilizer types, and fertilizer application intensity were provided by local agricultural management departments; 5) the data (monitoring data of 2017–2018) of reservoir water quality monitoring points, water quality data, sediment monitoring points, monitoring frequency, and pollutant concentrations were provided by Zhangze Reservoir management departments; and 6) precipitation, rainfall time, and other data required for the calculation of urban runoff pollution load were provided by local hydrological departments, while data about land-use types and land area were obtained by remote sensing interpretation.
2.3 Methodology
2.3.1 Calculation Method of Urban Domestic Source
Urban domestic pollutants have two sources: those entering the pipe network system of centralized treatment facilities and those not. The discharge of domestic sewage entering the system is calculated by the following steps: counting the daily discharge of pollutants (COD, NH3-N, TN, and TP) in the wastewater treatment plants and further obtaining the annual discharge of urban centralized sewage treatment facilities. The discharge of domestic pollutants not included in the pipe network system of centralized treatment facilities was calculated by the pollutant production and discharge coefficient method. The production and discharge coefficients of urban domestic source water pollutants in the study areas are determined according to the Handbook of Production and Discharge Coefficients of Domestic Pollution Sources in the Second National Pollution Source Census (Trial Edition) (South China Institute of Environmental Sciences, Ministry of Ecology and Environment, 2019), as shown in Table 1.
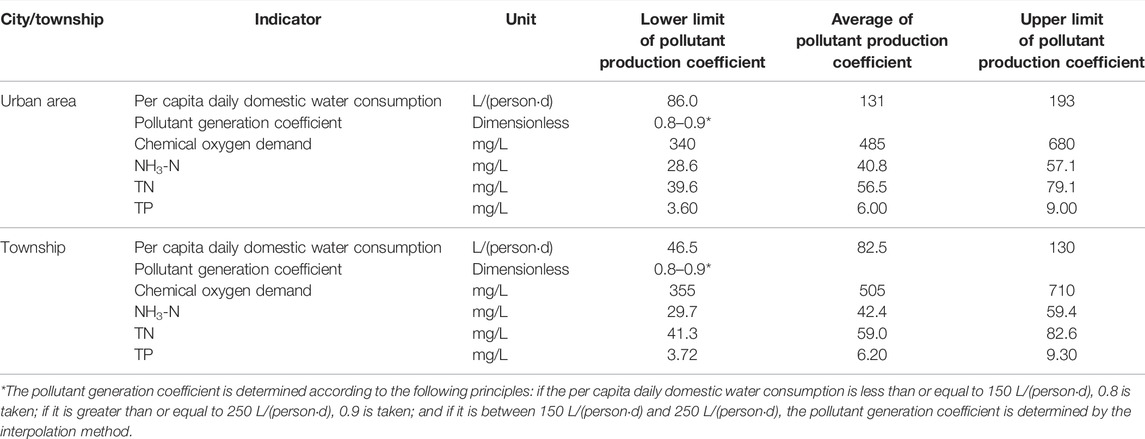
TABLE 1. Pollutant production check coefficients of water pollutants from urban domestic sources in the study area.
2.3.2 Calculation Method for Rural Domestic Source
The discharge of COD, NH3-N, TN, and TP from rural domestic sources is calculated according to the pollutant production and discharge coefficient method recommended in the Handbook of Production and Discharge Coefficients of Domestic Pollution Sources in the Second National Pollution Source Census (Trial Edition) (South China Institute of Environmental Sciences, Ministry of Ecology and Environment, 2019). The production and discharge coefficients of domestic water pollutants of rural residents in the study area are shown in Table 2.
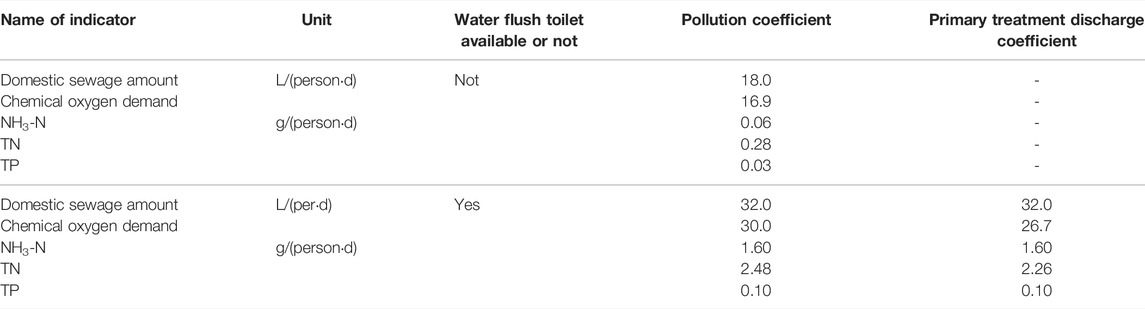
TABLE 2. Production and discharge coefficients of domestic water pollutants of rural residents in the study areas.
2.3.3 Calculation Method for the Discharge of Industrial Pollutants
Pooled analysis on the discharge of industrial pollutants was conducted according to the number of actual discharge enterprises, wastewater discharge, COD discharge, NH3-N discharge, TN discharge, TP discharge, and other information.
2.3.4 Calculation Method for the Discharge of Pollutants From Economic Animal Breeding
By using the pollutant discharge intensity method, we conducted the estimation of the discharge of pollutants (COD, TN, and TP) from economic animal breeding. In addition, we calculated the pollutant discharge according to the number of livestock and poultry (livestock living/slaughtered), mean discharge intensity, and feces removing process with the discharge coefficients provided by the Handbook of Production and Discharge Coefficients of Economic Animal Breeding in the First National Pollution Source Census (Institute of Environment and Sustainable Development in Agriculture, Chinese Academy of Agricultural Sciences, 2009). The discharge of NH3-N was calculated by referencing the Accounting Rules for Total Discharge Reduction of Major Pollutants in the 12th Five-Year Plan (Ministry of Ecology and Environment of the People’s Republic of China, 2011). For the discharge of NH3-N from livestock and poultry in large-scale farms, the pollutant production and discharge coefficient methods were adopted to calculate the reduction proportion of pollutants according to the breeding amount, pollutant production coefficient, as well as modes of feces removal, feces disposal, and urine/wastewater treatment; and for the discharge of NH3-N from farmers specialized in animal husbandry, the pollutant discharge intensity method was applied. Calculation equations for the pollutant discharge of economic animal breeding in the study areas by the two aforementioned methods are shown as follows:
where Gswp is the pollutant discharge of different livestock and poultry, in kg; S is the breeding number of equivalent livestock and poultry, in unit; esww is the pollution production coefficient of pollutants, in kg/unit; Rsl is the average removal efficiency of regional pollutants; and Esww is the discharge intensity for farmers specialized in animal husbandry, in kg/unit·a.
2.3.5 Calculation Method for the Discharge of Pollutants from Farmland Runoff
The loss of pollutants under various land utilization and planting modes in the study areas was determined according to the First National Pollution Source Census—Handbook of Fertilizer Loss Coefficient of Agricultural Pollution Source (Office of Leading Group for the First National Pollution Source Census of the State Council, China, 2009). The loss of pollutants varies in the plots of the same type due to different kinds of crops planted (e.g., the loss of NH3-N in the “flatland/dry land/irrigable land with one harvest” is 0.555 kg/hm2, the loss of NH3-N in “flatland/dry land/irrigable land with two harvests” is 0 kg/hm2, and the loss of NH3-N in “flatland/dry land/open land planted with vegetable” is 0.060 kg/hm2). The study areas are located in the Changzhi basin, with flat terrain and the slope of planting land lot generally less than 5°. Therefore, the types of cultivated lands and planting crops should be mainly considered for the selection of coefficients. The discharge of pollutants was calculated according to the pollutant loss coefficients of different land types. See the following equation:
Here,
2.3.6 Calculation Method for Sediment Pollutant Release
Nitrogen and phosphorus play a key role in water eutrophication, and their release rate and amount in sediment can facilitate this process. The Zhangze Reservoir is a deep reservoir with relatively low disturbance, so the pore water diffusion model may be adopted to estimate the nitrogen and phosphorus release fluxes at the sediment–water interface. The molecular diffusion process of pore water complies with Fick’s first law (Tohru et al., 1989) if only the nutrient exchange fluxes at the sediment–water interface are considered, and its modified equation is (Fan et al., 2002)
where
2.3.7 Calculation Method for Urban Runoff Pollution Load
The urban rainfall runoff pollution load refers to the total amount of pollutants discharged from runoff caused by one or multiple rainfall events. Since pollutant concentrations in rainfall events are affected by uncertain factors such as rainfall characteristics and regional differences, they vary greatly in the same rainfall event but in different regions or in the same region but in different rainfall events. In this study, we used the method of U.S. Nationwide Urban Runoff Program (NURP) Event Mean Concentration (EMC) to evaluate the pollutant concentration and pollution degree. Since the surface runoff pollution load was random, which resulted in poor representativeness of a single rainfall runoff pollution load, the annual runoff pollution load was usually used, and its calculation equation is presented as follows (US EPA, 1983; Akan, 1993):
where
It is necessary yet difficult to know the runoff volume and EMC of each rainfall-runoff in 1 year when calculating the annual rainfall-runoff pollution load by using Eq. 5. Therefore, the EMCs of runoff pollution in multiple rainfall events are often used for calculation. The more rainfall times are monitored, the stronger the representativeness of
where
The urban underlying surfaces in the study area are divided into road, urban green space, roof, and other lands to estimate pollution load. The runoff coefficient R of a drainage area depends on different underlying surfaces. In this study, we took the values from the literature reference (Li et al., 2010; Yang et al., 2014), as shown in Table 3.

TABLE 3. Reference table for runoff coefficients.
For the annual
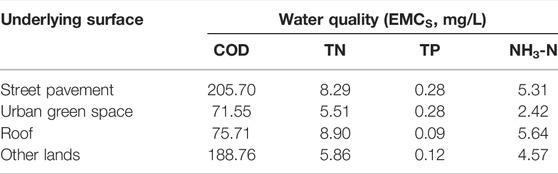
TABLE 4. Annual event mean concentrations (
3 Result
3.1 Pollutant Discharge
The discharge from pollution sources around the Zhangze Reservoir was calculated and analyzed by using the aforementioned method system, and after calculating, we obtained the total discharge of COD, NH3-N, TN, and TP of 12,722.03t, 441.01t, 1,616.69t, and 186.90t, respectively. In terms of pollutants, the COD discharge from domestic sources accounted for the largest proportion, 43.26%, while the discharges of NH3-N, TN, and TP from agricultural sources accounted for the largest proportion, 43.55, 46.81, and 81.35%, respectively (detailed in Table 5). Generally, domestic and agricultural sources contribute to main pollution, but the pollution caused by urban runoff, sediment release, and industrial sources should not be ignored. On the whole, the pollution sources of the Zhangze Reservoir are in a complex situation where point sources, non-point sources, exogenous sources, and endogenous sources coexist with various types of pollutants. Moreover, urban runoff, agricultural sources, and sediment have been important pollution sources for water bodies, especially after urban point source pollution has been controlled.
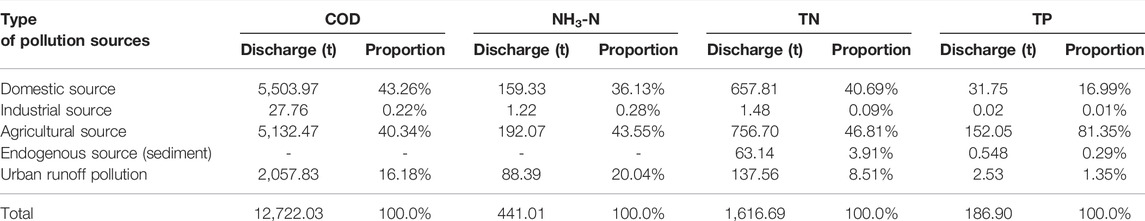
TABLE 5. Discharge from pollution sources around the Zhangze Reservoir.
3.2 Pollutants into Reservoir (Pollution Load)
According to the technical parameters provided by the National Technical Guidelines for Verification of Water Environmental Capacity (Chinese Academy of Environmental Planning, 2003), the coefficients of pollutants into the reservoir are determined combined with the topography, rainfall, and other conditions in the study areas: 0.1 for agricultural pollutants, 0.1 for urban runoff pollutants, 0.1 for urban and rural domestic pollutants without centralized wastewater treatment, and 1 for urban domestic and industrial pollutants with centralized wastewater treatment. The amount and proportions of pollutants from various pollution sources into Zhangze Reservoir are shown in Table 6.
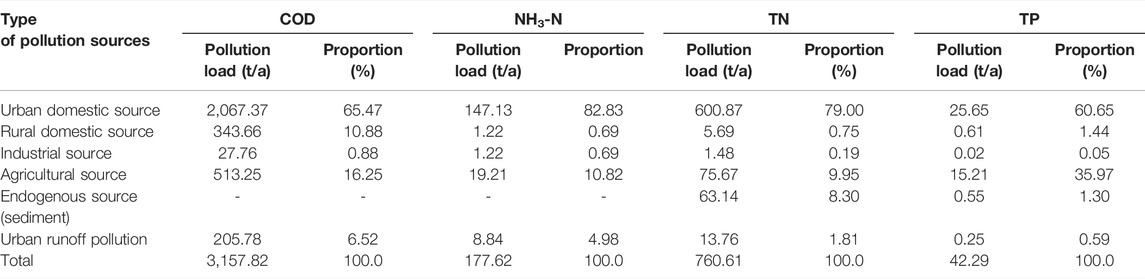
TABLE 6. Amount of pollutants entering the reservoir and its contribution proportion around the Zhangze Reservoir.
4 Discussion
4.1 Characteristic Analysis of Pollution Sources
4.1.1 Overload of Water Environmental Capacity of Zhangze Reservoir
The amount of COD, NH3-N, TN, and TP into the reservoir in the study areas was 3,157.82t/a, 177.62t/a, 760.72t/a and 42.29t/a, respectively. According to the studies (Cui et al., 2006), the capacities for COD, BOD5, TN, and TP in Zhangze Reservoir are 5,208.42t/a, 2,456.60t/a, 73.14t/a, and 3.46t/a, respectively. Pollution load overwhelming water environmental capacity fundamentally contributes to water quality deterioration. As indicated in the literature, water quality of the Zhangze Reservoir gradually deteriorated after 2003, and by 2016, it could not even reach the Class V standard, and the main out-of-limit indicators were TN and TP, calling for urgent treatment. According to the water quality monitoring data of the Zhangze Reservoir in 2018, the average concentrations of COD, BOD5, NH3-N, TP, and TN were 25.1 mg/L, 2.725 mg/L, 0.461 mg/L, 0.079 mg/L, and 1.768 mg/L, respectively, among which COD, TP, and TN were out of limit. The pollution load of TN and TP in the Zhangze Reservoir far exceeded the water environmental capacity, leading to water quality deterioration, being consistent with the conclusions in the existing literature and water quality monitoring data.
4.1.2 Urban Domestic Sources as the Main Pollution Sources of Zhangze Reservoir
Considering pollutants into the reservoir, urban domestic sources account for the largest proportion, with COD, NH3-N, TN, and TP reaching 65.47, 82.83, 79.00, and 60.65% respectively. There is a continuous increase in the discharge of domestic source pollution with rapid urbanization and a growing urban population. Although the wastewater treatment plants in all districts and counties in the study areas have been put into operation, the centralized wastewater treatment still fails to meet requirements for all areas. Some villages and towns lack wastewater collection and treatment facilities, with their wastewater directly discharged into rivers and then into the reservoir. According to the calculation data of the amount of pollution sources into the reservoir, the amount of COD, NH3-N, TN, and TP produced by direct discharge of domestic sources accounts for 10.88, 0.69, 0.75, and 1.44%, respectively. Investigation data show that the water amount of some pipe networks in the rainy season overwhelms the treatment capacity of wastewater treatment facilities since water and sewage diversion is adopted; a few early-built wastewater pipe networks in wastewater treatment plants are aging, making it difficult for improvement; and the rural domestic wastewater treatment facilities are low in operation rate due to lagging behind in construction of urban wastewater pipe networks, insufficient operating support, scattered layout of facilities and management difficulties.
4.1.3 Agricultural Source Pollution and Urban Runoff Pollution Cannot Be Ignored
Except for domestic sources, the proportions of COD, NH3-N, TN, and TP produced by agricultural sources and urban runoff pollution sources in the total amount of pollutants into the reservoir are 16.25, 10.82, 9.95, 35.97, 4.98, 1.81, and 0.59%, respectively, totaling 22.77, 15.80, 11.76, and 36.56%. The agricultural source pollution generated by irrational use of pesticides and fertilizers and improper disposal of livestock and poultry manure has features of large randomness, wide distribution, and difficulty in prevention and control. The wastewater discharged from farms is high in contaminant concentration, with the COD concentration reaching thousands or even tens of thousands of mg/L. Compared with domestic wastewater, breeding wastewater is difficult to treat and high in cost. Limited by regional economic conditions, common farms are not provided with professionals to operate and maintain wastewater treatment facilities. Even if wastewater treatment facilities are available, it cannot be guaranteed that the discharge of breeding wastewater meets the standard.
With the completion and operation of wastewater treatment plants in the study areas, point source pollution such as domestic and industrial wastewater has been controlled to a certain extent, but the problems of non-point pollution caused by rainfall runoff gradually stand out. There are two reasons for these problems: first, heavy rainfall results in increasing urban non-point pollution; second, heavy rainfall causes the wastewater of pipelines adopting rainwater-wastewater diversion to overflow into rivers, leading to overload operation at wastewater treatment plants; consequently, the wastewater is directly discharged into rivers and then into the Zhangze Reservoir. Therefore, the difficulties in treating urban non-point pollution sources arise due to their scattered distribution, random pollution paths, and complex pollution components.
4.2 Control Countermeasures for Pollution Sources
According to the requirements of surface water environmental function zoning in Shanxi Province, China, the water quality of the Zhangze Reservoir should meet the Class III standard of water bodies specified in the environmental quality standards for surface water (GB 3838–2002): COD ≤ 20 mg/L, BOD5 ≤ 4 mg/L, NH3-N ≤ 1.0 mg/L, TP ≤ 0.05 mg/L, and TN ≤ 1.0 mg/L. According to the water quality monitoring data of the Zhangze Reservoir in 2018, the average concentrations of COD, BOD5, NH3-N, TP, and TN were 25.1 mg/L, 2.725 mg/L, 0.461 mg/L, 0.079 mg/L, and 1.768 mg/L respectively, among which COD, TP, and TN are out of limit. The Zhangze Reservoir was close to the urban area in Changzhi city, where the water pollutants came from a wide range of sources. The pollutants discharged into the reservoir mainly come from industrial enterprises in the upstream, domestic wastewater, and nutrient loss from farmland (Cui et al., 2006). On the basis of estimating the watershed pollution load, the pollution load of various pollution sources should be reduced to be less than the water environmental capacity according to the principle of total amount control of pollutants. At present, TN and TP are prone to overwhelming the water environmental capacity in the Zhangze Reservoir. In order to stably reach the standard, TN and TP loads should be reduced by 90.38 and 91.82%, respectively.
The pollution loads of TN and TP from urban domestic sources, which is the main pollution source of the Zhangze Reservoir, account for 79.00 and 60.65%, respectively. Based on the environmental fluid dynamics code (EFDC) model, Yang et al. simulated the deep purification of the tailwater from the wastewater treatment plant through the constructed wetland before discharging it into the Zhangze Reservoir, but the water quality of the reservoir still failed to meet the standard; but if the tailwater of the wastewater treatment plant did not run into the reservoir, combined with other pollution source reduction measures, TP may reach the standard while TN could approach the standard within 3 years (Yang et al., 2022). The wastewater treatment plants that discharge wastewater to the Zhangze Reservoir have been upgraded, resulting in less potential for pollution load reduction. In addition to measures such as improving the wastewater collection rate of pipe networks and resource reuse, we suggest that the tailwater of the wastewater treatment plants should not be discharged into the reservoir. There is great reduction potential for agricultural sources of TN and TP, which account for 9.95 and 35.97%, respectively. Measures such as source reduction, process interception, resource utilization, and other sources should be taken to minimize pollutant discharge so as to decrease the pollution load of TN and TP by 80%. After years of treatment, heavily polluted industrial enterprises have been eliminated, and industrial enterprises have achieved transformation and development, resulting in a relatively small proportion of industrial pollution sources. At present, a variety of measures such as clean production, water saving, and discharge reduction can be taken to continuously minimize the discharge into the reservoir. Having been in operation for nearly 60 years, the Zhangze Reservoir (covering an area of about 24 km2) has a sediment pollution depth of about 0–10 cm. Therefore, sediment cleaning or in situ repair based on zoning measures should be conducted. The TN and TP in urban runoff pollution of the Zhangze Reservoir account for 1.81 and 0.59%, respectively, which can be reduced by the construction of low impact development (LID) facilities, rainwater and wastewater diversion, and overflow port treatment. Based on the characteristics of pollution sources and main problems in the Zhangze Reservoir, we have formulated control countermeasures and total amount control goals for domestic sources, industrial sources, agricultural sources, water sources, and urban runoff pollution sources, as shown in Table 7. Through the above-mentioned various pollution source control countermeasures, TN and TP pollution loads can be reduced by 703.45t and 38.59t, respectively, to reach the allowable range of water environmental capacity.
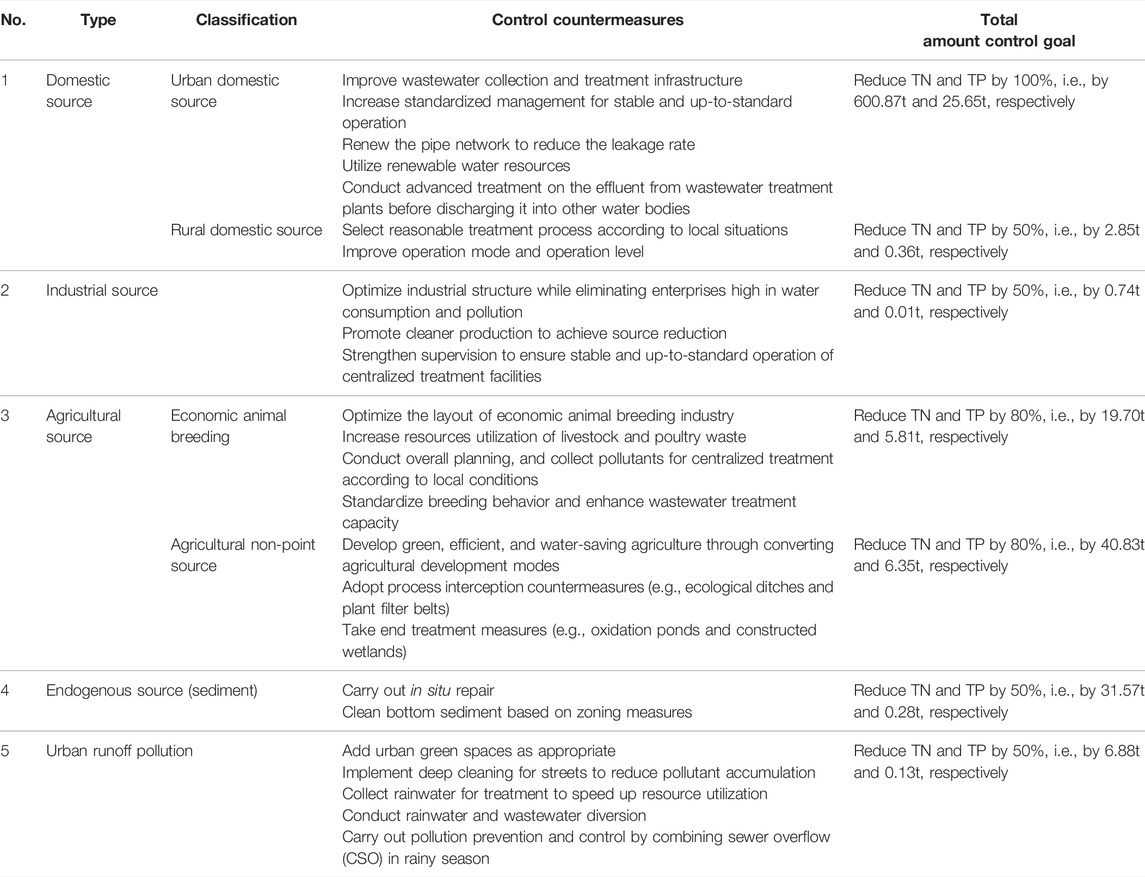
TABLE 7. Control countermeasures for pollution sources in the Zhangze Reservoir.
4.3 Limitations and Follow-Up Studies
To quantitatively estimate pollution load, identifying pollution sources and formulating targeted control countermeasures of basin pollution can provide an important basis for water environment management. Since the process of pollution sources entering into the water body is very complex, there are two major commonly used methods available for estimating pollution load: the ECM and the mechanism model (Zhou et al., 2014). Although SWAT, MIKE, HSPF, EDFDC, and other models have the functions of spatial information analysis, database construction, mathematical calculation, and visual expression and are widely used in basin pollution load and water quality prediction, they require more basic data (Wool et al., 2003; Schilling Keith and Wolter Calvin, 2009; Lee et al., 2018; Borah et al., 2019; Yonce et al., 2019; Hively et al., 2020). Restricted by the data constraints of the study areas, we adopted an export coefficient method for the estimation of the exogenous pollution load of the Zhangze Reservoir and the flux model method for endogenous sediment release. Although ECM requires less data, the export coefficients vary greatly in different regions and under various environmental conditions. In future research, a large number of on-site observations and verifications or corrections should be carried out according to the characteristics of the study areas so as to improve the accuracy of the export coefficients to a great extent. Due to the vast water surface of the Zhangze Reservoir, we did not consider the influence of atmospheric dry/wet deposition on the water quality of the Zhangze Reservoir in this study. Therefore, a reasonable estimation method of atmospheric dry/wet deposition pollution should be incorporated into the estimation system of water pollution load so as to provide a more scientific basis for water pollution source analysis and water quality improvement.
5 Conclusion
Zhangze Reservoir, the largest water body in Changzhi city, with typical pollution source characteristics and water quality changes, may be taken as a typical example to show how rapidly urbanization proceeds in some areas. In the 1960s, the Zhangze Reservoir served as a facility for flood control, a source of drinking water, and an agricultural production water supply, and its water quality was maintained well because it mainly received runoff from rainfall in the upstream basin. As the urban population rapidly increased, the effluent from centralized wastewater treatment facilities became the biggest pollution source for the Zhangze Reservoir. In addition, the pollution in the reservoir was aggravated due to factors such as intensive upstream agricultural activities, increased urban impermeable ground, damage to the wastewater pipe network, and sediment silting-up, which further contributed to a serious overload of water environmental capacity, making water quality deteriorate, especially since 2003. Since there is no room for the upgrade of centralized wastewater treatment facilities, we should consider utilizing the effluent from facilities as resources or discharge it into other water bodies to reduce the pollution load of the Zhangze Reservoir. Meanwhile, targeted countermeasures should be taken to control the agricultural non-point source pollution, industrial pollution, urban runoff pollution, and sediment pollution release and to further minimize the pollution load on the water environmental capacity, thereby helping the Zhangze Reservoir reach the standard in water quality.
Data Availability Statement
The original contributions presented in the study are included in the article/supplementary material; further inquiries can be directed to the corresponding author.
Author Contributions
Conceptualization, LY; methodology, MZ; validation, JQ and JW; formal analysis, MZ; investigation, LY; resources, MZ; data curation, MZ; writing—original draft preparation, LY; writing—review and editing, JQ; supervision, JW; project administration, LY. All authors have read and agreed to the published version of the manuscript.
Funding
This research was funded by the Ningxia Key R&D Program (2021BEG02011), scientific research projects of China Urban Construction Design & Research Institute Co., Ltd. (Y16S22016) and the Fundamental Research Funds for the Central Universities (Grant No. ZY20215135).
Conflict of Interest
Authors LY and MZ are employed by the China Urban Construction Design & Research Institute Co., Ltd.; author JQ is employed by the Shanghai Municipal Engineering Design Institute (Group) Co., Ltd.
The remaining author declares that the research was conducted in the absence of any commercial or financial relationships that could be construed as a potential conflict of interest.
Publisher’s Note
All claims expressed in this article are solely those of the authors and do not necessarily represent those of their affiliated organizations, or those of the publisher, the editors, and the reviewers. Any product that may be evaluated in this article, or claim that may be made by its manufacturer, is not guaranteed or endorsed by the publisher.
References
Baek, S., Ligaray, M., Pyo, J., Park, J., Kang, J., Pachepsky, Y. A., et al. (2020). A Novel Water Quality Module of the SWMM Model for Assessing Low Impact Development (LID) in Urban Watersheds[J]. J. Hydrology 586, 124886. doi:10.1016/j.jhydrol.2020.124886
Borah, D. K., Ahmadisharaf, E., Padmanabhan, G., Imen, S., and Mohamoud, Y. M. (2019). Watershed Models for Development and Implementation of Total Maximum Daily Loads[J]. J. Hydrologic Eng. 24 (1), 03118001. doi:10.1061/(ASCE)HE.1943-5584.0001724
Cui, J., Kang, Y., and Sun, J. (2006). Research on Water Environment Capacity and Water Pollution Controlling Project of Zhang-Ze Reservoir[J]. J. Taiyuan Univ. Technol. 37 (3), 366–368. (in Chinese). doi:10.3969/j.issn.1007-9432.2006.03.032
Fan, C., Zhang, L., Yang, L., Huang, Y., and Xu, P. (2002). Simulation of Nitrogen and Phosphorus Endogenous Loads in Lake Sediments[J]. J. Oceanol. Limnologia Sinica 33 (4), 370–378. doi:10.3321/j.issn:0029-814X.2002.04.005
Fan, Q., and Ding, Z. (2016). Effluent Standards and Sewerage Outfalls Selection of the Wastewater Treatment Plants in Harbour Based on EFDC[J]. Environ. Eng. 34 (12), 147–152. doi:10.13205/j.hjgc.201612031
Han, Q., Yu, X., Wang, W., Xu, M. M., Ren, R., and Zhang, J. P. (2017). Effect of Terracing Project on Temporal-Spatial Variation of Non-point Source Pollution Load in Hujiashan Watershed, China[J]. Chin. J. Appl. Ecol. 28 (04), 1344–1351. doi:10.13287/j.1001-9332.201704.021
Hively, W. D., Lee, S., Sadeghi, A. M., McCarty, G. W., Lamb, B. T., Soroka, A. M., et al. (2020). Estimating the Effect of Winter Cover Crops on Nitrogen Leaching Using Cost-Share Enrollment Data, Satellite Remote Sensing, and Soil and Water Assessment Tool (SWAT) Modeling[J]. J. Soil Water Conservation 75 (3), 362–375. doi:10.2489/jswc.75.3.362
Jie, Y., and Xinlin, Z. (2020). Sediment Pollution and Nitrogen Release at Sediment-Water Interface in Changjiang River and its Tributary, the Lower Han River Basin[J]. Water Environ. J. 34 (S1), 672–682. doi:10.1111/wej.12569
Lammers, R. W., and Bledsoe, B. P. (2019). Quantifying Pollutant Loading from Channel Sources: Watershed-Scale Application of the River Erosion Model[J]. J. Environ. Manag. 234, 104–114. doi:10.1016/j.jenvman.2018.12.074
Lee, E. J., Kim, T. G., and Choi, K. (2018). A Study of the Load Allocation Using Watershed Model and Load Duration Curve in TMDL[J]. KSCE J. Civ. Eng. 22 (9), 3222–3232. doi:10.1007/s12205-018-0910-0
Li, J., Li, Y., and Li, H. (2010). Study on the Calculation Method for Urban Surface Runoff Pollution Load[J]. J. Water Resour. Water Eng. 21 (2), 5–13. CNKI:SUN:XBSZ.0.2010-02-002.
Li, J. (2014). Study on Water Self-Purification Law and Capacity of Zhangze Reservoir[J]. Shanxi Hydrotech. 2014 (03), 76–77. doi:10.3969/j.issn.1006-8139.2014.03.029
Liu, R., Xu, F., Zhang, P., Yu, W., and Men, C. (2016). Identifying Non-point Source Critical Source Areas Based on Multi-Factors at a Basin Scale with SWAT[J]. J. Hydrology 533, 379–388. doi:10.1016/j.jhydrol.2015.12.024
Marlène, R., Christian, S., and George, T. M. (2021). Modelling the Effects of Stormwater Control Measures on Runoff Volume and Particulate Load in Urban Catchments[J]. Urban Water J. 18 (2), 79–90. doi:10.1080/1573062X.2020.1860236
Nasab, M. T., Grimm, K., Bazrkar, M. H., Zeng, L., Shabani, A., Zhang, X., et al. (2018). SWAT Modeling of Non-Point Source Pollution in Depression-Dominated Basins under Varying Hydroclimatic Conditions[J]. Int. J. Environ. Res. Public Health 15 (11), 2492. doi:10.3390/ijerph15112492
Nazari-Sharabian, M., Taheriyoun, M., and Karakouzian, M. (2019). Surface Runoff and Pollutant Load Response to Urbanization, Climate Variability, and Low Impact Developments – a Case Study[J]. Water Supply 19 (8), 2410–2421. doi:10.2166/ws.2019.123
Özcan, Z., Başkan, O., and Düzgün, H. Ş. (2017). A Pollution Fate and Transport Model Application in a Semi-arid Region: Is Some Number Better Than No number?[J]. Sci. Total Environ. 595, 425–440. doi:10.1016/j.scitotenv.2017.03.240
Pongpetch, N., Suwanwaree, P., Yossapol, C., Dasananda, S., and Kongjun, T. (2015). Using SWAT to Assess the Critical Areas and Nonpoint Source Pollution Reduction Best Management Practices in Lam Takong River Basin, Thailand[J]. EnvironmentAsia 8 (1), 41–52. doi:10.14456/ea.2015.6
Schilling Keith, E., and Wolter Calvin, F. (2009). Modeling Nitrate-Nitrogen Load Reduction Strategies for the Des Moines River, Iowa Using SWAT[J]. Environ. Manag. 44 (4), 671–682. doi:10.1007/s00267-009-9364-y
Soudabeh, T., Salar, K., and Taher, R. (2021). Hybrid SWMM and Particle Swarm Optimization Model for Urban Runoff Water Quality Control by Using Green Infrastructures (LID-BMPs)[J]. Urban For. Urban Green. 60, 127032. doi:10.1016/J.UFUG.2021.127032
Tohru, S., Hirofumi, I., and Etsuji, D. (1989). Benthic Nutrient Remineralization and Oxygen Consumption in the Coastal Area of Hiroshima Bay[J]. Water Res. 23 (2), 219–228. doi:10.1016/0043-1354(89)90046-8
Tong, X., Zhou, Y., Liu, J., Qiu, P., and Shao, Y. (2022). Non-point Source Pollution Loads Estimation in Three Gorges Reservoir Area Based on Improved Observation Experiment and Export Coefficient Model[J]. Water Sci. Technol. 85 (1), 27–38. doi:10.2166/WST.2021.508
US EPA (1983). Results of the Nationwide Urban Runoff Program[R]. Washington, D.C. U.S: Environmental Protection Agency.
Wang, X. (2019). Analysis of Water Quality Changes in Zhangze Reservoir from 2013 to 2017 [J]. Shanxi Hydrotech., 2019(01): 59–61. doi:10.3969/j.issn.1006-8139.2019.01.018
Wool, T. A., Davie, S. R., and Rodriguez, H. N. (2003). Development of Three-Dimensional Hydrodynamic and Water Quality Models to Support Total Maximum Daily Load Decision Process for the Neuse River Estuary, North Carolina[J]. J. Water Resour. Plan. Manag. 129 (4), 295–306. doi:10.1061/(asce)0733-9496(2003)129:4(295)
Wu, L., Gao, J. E., Ma, X. Y., and Li, D. (2015). Application of Modified Export Coefficient Method on the Load Estimation of Non-point Source Nitrogen and Phosphorus Pollution of Soil and Water Loss in Semiarid Regions. Environ. Sci. Pollut. Res. Int. 22 (14), 10647–10660. doi:10.1007/s11356-015-4242-z
Xue, L., and Yang, L. (2009). Research Advances of Export Coefficient Model for Non-point Source Pollution[J]. Chin. J. Ecol. 28 (04), 755–761. CNKI:SUN:STXZ.0.2009-04-030.
Yang, L., Sun, C., Qi, J., Liu, G., and Wang, Y. (2014). Study on the Dynamic Update of Urban Surface Runoff Pollutants Load[J]. J. Environ. Sustain. Dev. 39 (3), 135–137. doi:10.3969/j.issn.1673-288X.2014.03.042
Yang, L., Wei, J., Qi, J., and Zhang, M. (2022). Effect of Sewage Treatment Plant Effluent on Water Quality of Zhangze Reservoir Based on EFDC Model[J]. Front. Environ. Sci. 10, 874502. doi:10.3389/fenvs.2022.874502
Yang, S., Zheng, M., Liu, C., Ma, Y., and Wang, Q. (2020). Research Progress of Agricultural Non-point Source Pollution Models[J]. Adm. Tech. Environ. Monit. 32 (03), 8–13. doi:10.19501/j.cnki.1006-2009.20200513.006
Yazdi, M. N., Scott, D., Sample, D. J., and Wang, X. (2021). Efficacy of a Retention Pond in Treating Stormwater Nutrients and Sediment[J]. J. Clean. Prod. 290, 125787. doi:10.1016/J.JCLEPRO.2021.125787
Ying, L., Hou, X., Lu, X., and Zhu, M. (2010). Output Coefficient Problem in Non-point Source Pollution Research in China[J]. J. Water Resour. Water Eng. 21 (06), 90–95. CNKI:SUN:XBSZ.0.2010-06-023.
Yonce, H. N., Keeley, A., Canfield, T. J., Butcher, J. B., and Paul, M. J. (2019). Integration of SWAT and HSPF for Simulation of Sediment Sources in Legacy Sediment-Impacted Agricultural Watersheds[J]. J. Am. Water Resour. Assoc. 55 (2), 497–510. doi:10.1111/1752-1688.12731
Keywords: water pollution source, pollution load, control countermeasures, export coefficient model, Zhangze Reservoir
Citation: Yang L, Zhang M, Wei J and Qi J (2022) Pollution Load Estimation and Control Countermeasures of Zhangze Reservoir. Front. Environ. Sci. 10:874124. doi: 10.3389/fenvs.2022.874124
Received: 11 February 2022; Accepted: 30 May 2022;
Published: 06 July 2022.
Edited by:
Rajendra Prasad Singh, Southeast University, ChinaReviewed by:
Yajun Wang, Lanzhou University of Technology, ChinaAlagarasan Jagadeesh Kumar, Jiangsu University, China
Copyright © 2022 Yang, Zhang, Wei and Qi. This is an open-access article distributed under the terms of the Creative Commons Attribution License (CC BY). The use, distribution or reproduction in other forums is permitted, provided the original author(s) and the copyright owner(s) are credited and that the original publication in this journal is cited, in accordance with accepted academic practice. No use, distribution or reproduction is permitted which does not comply with these terms.
*Correspondence: Jia Wei, d2VpamlhQGNpZHAuZWR1LmNu