 Jianjiong Mao
 Lin LiJingyi Li
 Ishaq Dimeji SulaymonKaili XiongKang WangJianlan ZhuGanyu ChenFei YeNa ZhangYang QinMomei Qin
 Jianlin Hu*
- Jiangsu Key Laboratory of Atmospheric Environment Monitoring and Pollution Control, Collaborative Innovation Center of Atmospheric Environment and Equipment Technology, Nanjing University of Information Science and Technology, Nanjing, China
Air quality in China has been undergoing significant changes due to the implementation of extensive emission control measures since 2013. Many observational and modeling studies investigated the formation mechanisms of fine particulate matter (PM2.5) and ozone (O3) pollution in the major regions of China. To improve understanding of the driving forces for the changes in PM2.5 and O3 in China, a nationwide air quality modeling study was conducted from 2013 to 2019 using the Weather Research and Forecasting/Community Multiscale Air Quality (WRF/CMAQ) modeling system. In this study, the model predictions were evaluated using the observation data for the key pollutants including O3, sulfur dioxide (SO2), nitrogen dioxide (NO2), and PM2.5 and its major components. The evaluation mainly focused on five major regions, that is , the North China Plain (NCP), the Yangtze River Delta (YRD), the Pearl River Delta (PRD), the Chengyu Basin (CY), and the Fenwei Plain (FW). The CMAQ model successfully reproduced the air pollutants in all the regions with model performance indices meeting the suggested benchmarks. However, over-prediction of PM2.5 was noted in CY. NO2, O3, and PM2.5 were well simulated in the north compared to the south. Nitrate (NO3−) and ammonium (NH4+) were the most important PM2.5 components in heavily polluted regions. For the performance on different pollution levels, the model generally over-predicted the clean days but underpredicted the polluted days. O3 was found increasing each year, while other pollutants gradually reduced during 2013–2019 across the five regions. In all of the regions except PRD (all seasons) and YRD (spring and summer), the correlations between PM2.5 and O3 were negative during all four seasons. Low-to-medium correlations were noted between the simulated PM2.5 and NO2, while strong and positive correlations were established between PM2.5 and SO2 during all four seasons across the five regions. This study validates the ability of the CMAQ model in simulating air pollution in China over a long period and provides insights for designing effective emission control strategies across China.
Introduction
Due to rapid population growth, industrialization, economic advancement, and urbanization, China has been experiencing severe air pollution problems in recent decades (de Leeuw et al., 2021; Zhao et al., 2021). In 2013, the Ministry of Ecology and Environment of China initiated the setting up of nationwide air pollution monitoring networks. Subsequently, the Air Pollution Prevention and Control Action Plan (APPCAP) was issued and implemented in September 2013 with a series of clean air policies, which has led to decrease in the concentrations of fine particulate matter with aerodynamic diameters less than or equal to 2.5 µm (PM2.5) as well as improved air quality (Qiang Zhang et al., 2019). Several studies have used various air quality models (Chen et al., 2014; Chen et al., 2018) in forecasting air pollution levels in China. The three-dimensional chemical transport models (CTMs) can provide detailed gaseous and particulate matter (PM) concentrations and their sources, as well as their chemical compositions (Bell, 2006). The Community Multiscale Air Quality (CMAQ) model, being one of the CTMs, has been widely used in predicting air quality in recent years (Luo and Cao, 2012; Zhang et al., 2014; Hu et al., 2016, 2017; Liu et al., 2020; Sulaymon et al., 2021a, 2021b; Wang et al., 2021). For instance, Zhang et al. (2014) applied the Weather Research and Forecasting (WRF) and CMAQ model (WRF-CMAQ) to simulate air quality in eastern United States during a 7-year period. Hu et al. (2016) carried out a 1-year simulation of ozone (O3) and PM in China using the WRF-CMAQ model. With the WRF-CMAQ model, Shi et al. (2020) analyzed the sensitivity of O3 and PM2.5 to meteorological variables in China, and the results revealed that surface O3 and PM2.5 concentrations could change significantly due to changes in meteorological parameters. Sulaymon et al. (2021a) utilized the WRF-CMAQ model to evaluate the regional transport of PM2.5 during severe atmospheric pollution episodes in the western Yangtze River Delta (YRD), China. The results of the study revealed the dominant transport pathways and the heights at which they occurred. Also, Sulaymon et al. (2021b) employed the WRF-CMAQ model to investigate the remote causes of PM2.5 pollution in the Beijing–Tianjin–Hebei (BTH) region during the COVID-19 lockdown period. The results showed that the high PM2.5 concentrations in BTH during the lockdown were caused by unfavorable meteorological conditions and suggested that the roles of both chemistry and meteorology in the formation of air pollution must be taken into consideration while designing effective emission control strategies in the region. In addition, Yang et al. (2019) used the WRF-CMAQ model to assess PM2.5 in Xi’an during the winter periods of 2014–2017. Furthermore, Hu et al. (2017) employed the WRF-CMAQ model in predicting air quality for health effect studies in China and found that the model performed much better in more developed regions compared to underdeveloped regions such as western China.
Following the establishment of pollutant observation networks across China, it was found that the pollution events show regional differences based on the observation data in recent years. Liu et al. (2020) found emission reduction as the major driving force for the PM2.5 change in the YRD region during the COVID-19 lockdown period. Tan et al. (2015) elucidated and reported the effects of spatial resolution on air quality simulation in a highly industrialized area in the city of Shanghai, China. Li et al. (2017) found improvement in both meteorology and air quality simulations during a high O3 event in the YRD in 2013 by incorporating satellite-derived land surface parameters. Sun et al. (2016) employed the WRF-Chem model to investigate a severe haze episode that occurred over the YRD in 2013. Wang et al. (2021) investigated the impacts of meteorological inputs (by using different reanalysis data in the WRF model) and grid resolutions on air quality simulations in the YRD. Gong et al. (2021) quantified the influence of inter-city transport on air quality in the YRD region and suggested regional cooperative controls of PM2.5 and O3 in the region. Qin et al. (2021) investigated the spatial distribution and trend of double high pollution (PM2.5 and O3) in the YRD during 2015–2019. While some studies (Wang et al., 2015; Chen et al., 2017; Xueshun Chen et al., 2019; Tao et al., 2020) majorly focused on the North China Plain (NCP) region, Xiaoju Li et al. (2021) overviewed the air quality models on air pollution in the Sichuan Basin, a highly humid and foggy area.
In this study, a long-term (2013–2019) air quality simulation was conducted over China using the WRF-CMAQ model. China was divided into five regions for model evaluation, and the simulated results were compared with observation data. All of the cities’ data were averaged in each area for regional analysis. The critical gas- and particulate-phase pollutants were O3, SO2, NO2, and PM2.5. The three major components (sulfate (SO42-), nitrate (NO3−), and ammonium (NH4+)) of PM2.5 were further analyzed in cities with sufficient observation data in each region. In addition, the model performances during different pollution levels were discussed. Furthermore, the correlations between PM2.5 and other pollutants (O3, SO2, and NO2) were investigated.
Materials and Methods
Model Configurations
The meteorological fields were simulated using the WRF (version 4.2.1) model with the FNL reanalysis dataset. The FNL data were obtained from the U.S. National Centre for Atmospheric Research (NCAR), with a spatial resolution of 1.0° × 1.0° (http://rda.ucar.edu/datasets/ds083.2/, last accessed on 15 November 2021). The physical parameterizations used in this study include the Thompson microphysical process, RRTMG longwave/shortwave radiation scheme; Noah land-surface scheme; MYJ boundary layer scheme; and modified Tiedtke cumulus parameterization scheme. The detailed configuration settings could be found in the work of Hu et al. (2016) and Wang et al. (2021).
The CMAQ version 5.2 (CMAQv5.2) model (Fahey et al., 2017), configured with the gas-phase mechanism of SAPRC07tic and the aerosol module of AERO6i, was employed in this study to simulate the air quality over China during 2013–2019. Air quality simulations were performed for a period of 7 years (2013–2019) using a horizontal resolution of 36 km. The corresponding domain covered China and the surrounding countries and regions with 197 × 127 grids (Figure 1A). The vertical resolution had 18 layers. The initial and boundary conditions were provided by the default profiles of the CMAQ model. The simulated results of the first three days were not included in the model analysis, thus serving as a spin-up and reducing the effects of the initial conditions on the simulated results.
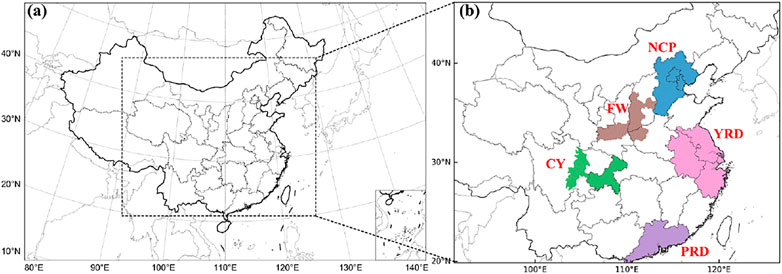
FIGURE 1. (A) WRF/CMAQ modeling domain. (B) The studied five regions (North China Plain (NCP), Yangtze River Delta (YRD), Pearl River Delta (PRD), Chengyu (CY), and Fenwei Plain (FW)).
Emission Inventory
The Multi-resolution Emission Inventory for China version 1.3 (MEICv1.3) (http://www.meicmodel.org) and Regional Emission inventory in ASia (REASv3.2) (https://www.nies.go.jp/REAS/) were used to provide the anthropogenic emissions. MEIC served as the anthropogenic emissions from China, while REAS served as the anthropogenic emissions from neighboring countries and regions. The MEICv1.3 emissions of the year 2017 were used for the simulations of the years 2018 and 2019, as no reliable sources for emission changes in China were currently available. For REAS, since no emission inventory was released for the years after 2015, we used the emission inventory in the year 2015 for 2016–2019. Although emission inventories are usually released 2–3 years behind, we acknowledge that this may cause additional uncertainties in the simulation for 2018 and 2019. Biogenic emissions were generated using the Model for Emissions of Gases and Aerosols from Nature (MEGANv2.1) (Guenther et al., 2012) for the whole simulation period. The open biomass burning emissions were processed using the Fire Inventory for NCAR (FINN) during the entire study period (Wiedinmyer et al., 2011). The spatiotemporal variations of the total emission of PM2.5, SO2, NOx, NH3, and VOC across the five regions are shown in Supplementary Table S3.
Observation Data
The daily observation data of meteorological variables (wind speed, wind direction, relative humidity, and temperature) for the selected regions were downloaded from the Chinese Meteorological Agency (http://data.cma.cn/en, last accessed on 30 November 2021). There were 18, 11, 14, 14, and 11 meteorological stations considered in the NCP, YRD, PRD, CY, and FW regions, respectively. In addition, the hourly observation data of air pollutants (PM2.5, O3, NO2, and SO2) were obtained from the Chinese Ministry of Ecology and Environment (https://www.mee.gov.cn/, last accessed on 20 December 2021). In this study, five regions in China were selected as target areas (Figure 1B), and they include the North China Plain (NCP, with 70 air quality monitoring stations), Yangtze River Delta (YRD, with 107 air quality monitoring stations), Pearl River Delta (PRD, with 54 air quality monitoring stations), Chengyu (CY, with 40 air quality monitoring stations), and Fenwei Plain (FW, with 60 air quality monitoring stations) regions. Besides the NCP and YRD, most of the cities in other regions had a month observation data in 2013. The cities with data of more than 3 months in each region were selected for citywide analysis in 2013, while all of the data in each region were selected for regional analysis. In the subsequent years (2014–2019), the observation data of the monitoring stations in each of the cities were used citywide, while the observation data of all the cities located in each region were used to estimate the average observation value of the region (Hu et al., 2016; Sulaymon et al., 2021c). The 21 cities selected in 2013 in the five regions are as follows: Beijing, Tianjin, Shijiazhuang, Qinhuangdao, Chengde, and Zhangjiakou in the NCP; Shanghai, Wuxi, Nanjing, Suzhou, Xuzhou, and Hangzhou in the YRD; Guangzhou, Dongguan, and Shenzhen in the PRD; Chengdu, Mianyang, and Chongqing in the CY; and Xi’an, Xianyang, and Baoji in the FW. The details about the selected cities in each region are shown in Supplementary Table S1. Furthermore, the predicted major chemical components of PM2.5 (SO42-, NO3−, and NH4+) were evaluated using the daily observation data in nine cities (Beijing, Shijiazhuang, Nanjing, Suzhou, Xuzhou, Hangzhou, Guangzhou, Shenzhen, and Chengdu) during the study period.
Results and Discussion
WRF Model Performance
Previous studies have investigated and documented the impacts of meteorological conditions on the formation, transportation, and dissipation of air pollutants (Hu et al., 2016; Hua et al., 2021; Sulaymon et al., 2021c, 2021d). In addition, the influences of some meteorological parameters (such as wind speed, wind direction, temperature, and relative humidity) on air quality modeling have been elucidated (Hu et al., 2016; Sulaymon et al., 2021b; Wang et al., 2021). Therefore, the evaluation of the WRF model performance was carried out prior to the usage of its meteorological fields in the air quality simulations. The evaluation of the WRF model was achieved by comparing the predicted wind speed (WS) and wind direction (WD) at 10 m above the surface, as well as the simulated relative humidity (RH) and temperature (T2) at 2 m above the ground level to their corresponding observed values in each region during the entire study period. The statistical indices used in evaluating the WRF model were the mean bias (MB), mean error (ME), and root mean square error (RMSE) (Table 1). The benchmarks of statistical indices employed in this study were suggested by Emery et al. (2017). T2 was generally over-predicted in all the regions except the NCP, whose MB value fell below the suggested benchmark (≤±0.5), while the ME values in all the regions, except the CY (the southeast basin of the Tibetan Plateau, with poor terrain and complicated weather conditions), were found below the suggested benchmark (≤2.0). With low ME indices (≤2.0) in four out of the five regions, it is shown that T2 was well simulated in the four regions. Previous studies have reported over-prediction of T2 in the YRD (Ma et al., 2021; Sulaymon et al., 2021a; Wang et al., 2021) and PRD (Wang N. et al., 2016). The results of this study are consistent with previously reported ones in the studied regions. However, no benchmarks were suggested for the MB and ME values of RH, and RH was underestimated in the NCP and FW, while it was overestimated in the other three regions. The MB values of WS in all the regions except the CY greatly exceeded the recommended criterion (≤±0.5), while the ME values in all the five regions were below the benchmark (≤2.0). In addition, the RMSE values of WS met the benchmark (≤2.0) in all the regions except the PRD. Considering the ME and RMSE values, the simulated WS reasonably captured the observations in all the regions. Over-prediction of WS has been previously found in the PRD (Wang N. et al., 2016; Qing Chen et al., 2019), NCP (Hanyu Zhang et al., 2019; Sulaymon et al., 2021b; Mengmeng Li et al., 2021), and YRD (Sulaymon et al., 2021a; Ma et al., 2021; Wang et al., 2021; Yu et al., 2021). Except in FW, the MB indices of WD in other regions were greater than the suggested benchmark (≤±10), while the ME values in all the regions greatly exceeded the recommended criterion (≤±30), especially in the PRD (68.98), YRD (48.83), CY (47.63), and FW (45.84). The model performance of WD in this study was consistent with previous studies in the YRD (Sulaymon et al., 2021a; Wang et al., 2021; Yu et al., 2021) and NCP (Sulaymon et al., 2021b) regions. Generally, the WRF model in this study performed better when compared to previous studies across China (Hu et al., 2016, 2017; Wang H. L. et al., 2016; Hanyu Zhang et al., 2019; Qing Chen et al., 2019; Sulaymon et al., 2021a, 2021b; Ma et al., 2021; Mengmeng Li et al., 2021; Yu et al., 2021), and the simulated meteorological fields were further utilized in driving the CMAQ model.
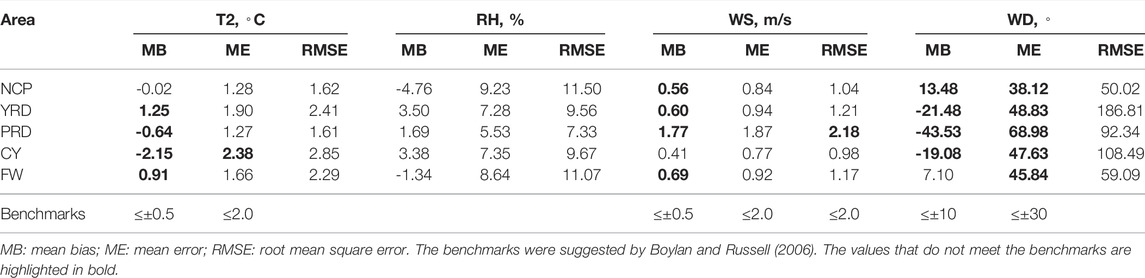
TABLE 1. Model performance of meteorological factors in the five regions during 2013–2019.
CMAQ Model Performance
Supplementary Figures S1-S5 show the comparison of the simulated daily mean concentrations of O3, NO2, SO2, and PM2.5 with the observations in 21 cities during 2013–2019. The time series of pollutants’ concentrations in six major cities in the NCP region are illustrated in Supplementary Figure S1. In the NCP, the observed O3 was about 200 μg/m3 in summer and 50 μg/m3 in winter; NO2 was 100 μg/m3 in winter and 20 μg/m3 in summer; SO2 was 100 μg/m3 in winter and 10 μg/m3 in summer before 2016 and 10 μg/m3 without seasonal change after 2016; and PM2.5 was 200 μg/m3 in winter and 10 μg/m3 in summer. The simulated O3 and PM2.5 were captured well with the observation data; SO2 was well simulated on monthly trends at Beijing, Tianjin, and Shijiazhuang sites than in other cities such as Qinhuangdao, Chengde, and Zhangjiakou, where it was high in winter and low in summer before 2016. NO2 was underestimated by over 20 μg/m3, without obvious seasonal change after 2016. Supplementary Figure S2 shows the six megacities in the YRD region. The monthly trend and simulated results of O3, NO2, and PM2.5 were the same as in the NCP; the predicted SO2 was better in Shanghai, Wuxi, and Hangzhou compared to Nanjing, Suzhou, and Xuzhou, which was near the observed data within 10 μg/m3. Supplementary Figure S3 shows the three cities in the PRD region. The monthly trends of O3 and PM2.5 were the same as those of the NCP and YRD. SO2 was well simulated in Guangzhou and Dongguan sites relative to Shenzhen, which was overestimated by more than 20 μg/m3; NO2 was well simulated in Shenzhen with a little seasonal change. Supplementary Figure S4 shows the three urban stations in the CY region. The simulated O3 was close to the observation data; NO2 was well simulated in Chengdu without seasonal changes; PM2.5 and SO2 were generally overestimated. FW (Supplementary Figure S5) was similar to CY on monthly trend, and both O3 and PM2.5 were well predicted, while NO2 and SO2 were underestimated.
Figure 2 shows the comparison of simulated pollutants with observed data in the five regions. The observed data of all stations and the simulated results in the five regions were grouped into three (2013–2014, 2015–2016, and 2017–2019) for model evaluation. The statistical metrics of normalized mean bias (NMB), normalized mean error (NME), and the correlation coefficient (R) were calculated to evaluate the pollutant predictions in each region (Table 2). The model performance criteria for O3 and PM2.5 were suggested by Emery et al. (2017). In the NCP, O3 was slightly overpredicted during 2013–2014 (NMB: 0.19), while it was well predicted during the 2015–2016 and 2017–2019 periods (NMB less than the benchmark), and the model performance improved with an increase in years as observed in R-values. The model performance in predicting PM2.5 and SO2 also improved significantly with an increase in years with higher R-values during 2015–2016 and 2017–2019 compared to the 2013–2014 period and with the statistical metrics of PM2.5 meeting the suggested benchmarks (Table 2). NO2 was underestimated, but the model performance also improved with increased R-value as the years increased. Similar to the NCP, O3 was slightly overpredicted in the YRD during 2013–2014 (NMB: 0.16), while it was well predicted during the 2015–2016 (NMB: 0.02) and 2017–2019 (NMB: 0.02) periods. The model performance improved with higher R-values with an increase in years. In terms of NMB and R-values, the model performance of SO2 in the YRD decreased with an increase in years. PM2.5 was well estimated with the NMB and R-values of 0.22–0.30 and 0.83–0.87, respectively, while NO2 was underestimated with fluctuating R-values, a similar scenario to what was found in the NCP. The trio of O3, SO2, and PM2.5 was well predicted in the PRD region with their NMB values found below the suggested benchmarks during the grouped study periods, except for O3 with NMB value slightly higher than the criterion during 2015–2016. The model performance of O3, SO2, and PM2.5 significantly improved with higher R-values as the years increased. NO2 was underestimated during the three periods, and the bias increased with an increase in years. It should be noted that the four pollutants (O3, NO2, SO2, and PM2.5) had their highest R-values during the 2015–2016 period. In the CY region, O3 was slightly overpredicted during 2013–2014 (NMB: 0.21), while it was well predicted during the 2015–2016 and 2017–2019 (NMB: 0.09) periods. The model performance of O3 improved with higher R-values with an increase in years. NO2 was underestimated while SO2 and PM2.5 were highly overestimated, with the NMB and NME values of PM2.5 greatly exceeding the suggested criteria during the three periods. The R-values of PM2.5 also increased with the increase in years, while fluctuation was noted in the R-values of SO2. PM2.5 in the FW region was well predicted with very low NMB values. The R-value decreased as the years increased, an indication that the best model performance occurred during the 2013–2014 period (Table 2). NO2 was underestimated throughout the three periods, while O3 was overestimated during the 2013–2014 and 2015–2016 periods. The overall model performance improved as the years increased. Above all, the model exhibited better performances in reproducing O3, SO2, and PM2.5 in the NCP, YRD, and PRD regions.
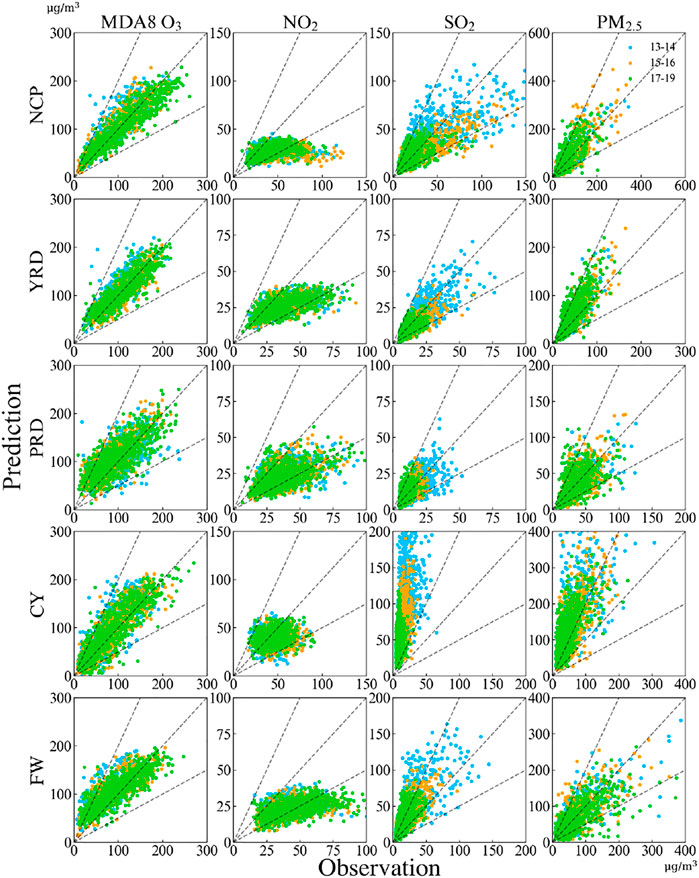
FIGURE 2. Model performance of O3, NO2, SO2, and PM2.5 in the five regions during the 2013–2014, 2015–2016, and 2017–2019 periods.
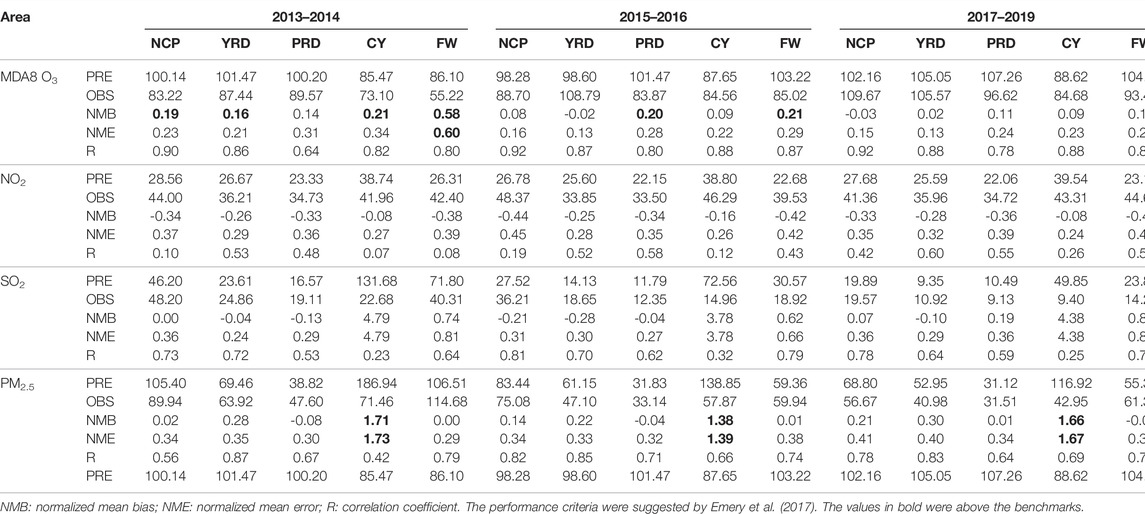
TABLE 2. Model performance of the air pollutants in the five regions during the 2013–2014, 2015–2016, and 2017–2019 periods.
Figure 3 shows the results of the model performance of SO42-, NO3−, and NH4+ in the nine selected cities across the five regions. In Beijing and Shijiazhuang, SO42- had an NMB value of ∼ -0.2, an indication of underprediction, while NO3− and NH4+ were well simulated. The NMB value of NO3− (0.15) in Shijiazhuang was relatively the same as that of PM2.5 in the NCP (Figure 2), indicating that NO3− was more dominant in the NCP. In Nanjing, Suzhou, Xuzhou, and Hangzhou (YRD), SO42- was well simulated, while NO3− and NH4+ were overestimated. The NMB of PM2.5 in the YRD (Figure 2) was similar to the NMB of SO42- in the selected four cities in the YRD (Figure 3), suggesting that SO42- significantly dominated PM2.5 in the YRD compared to NO3− and NH4+. NO3− and NH4+ in Guangzhou and Shenzhen were also well simulated, while SO42- was underestimated. All of the three major components dominated PM2.5 in the PRD. In Chengdu, NO3− and NH4+ were overestimated with NMB values of 2.55 and 0.87, respectively. This feature was also observed in PM2.5 in the CY (overprediction) (Figure 2), and this shows that NO3− and NH4+ were the important components of PM2.5 in the CY.
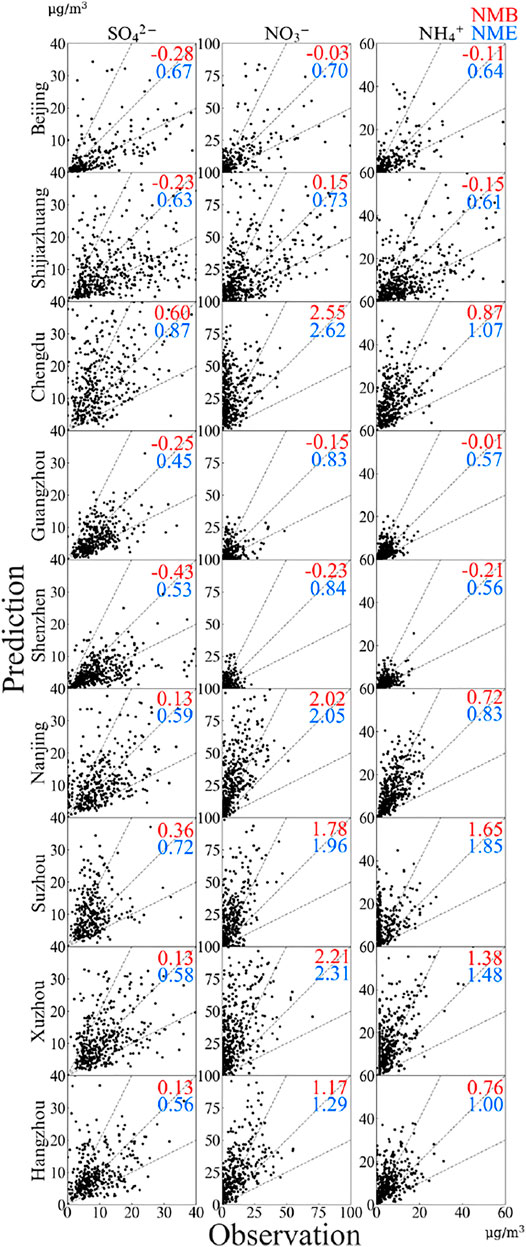
FIGURE 3. Model performance of SO42-, NO3−, and NH4+ in the selected cities during 2013–2019.
The analysis of the spatial and temporal variations shows that effective emissions control strategies are needed in eastern China. The control of PM2.5 is always complicated as it is related to its major components. For instance, it was found that NO3− was significant in the NCP and SO42- was dominant in the YRD, while all of the three components equally influenced PM2.5 in the PRD region. In addition, NO3− and NH4+ were more dominant than SO42- in the CY. From the abovementioned analysis, it can be concluded that NO3− and NH4+ were the main components of PM2.5 in heavily polluted regions, where the maximum PM2.5 concentration was above 250 μg/m3. However, in clean regions such as the PRD (with high temperature and precipitation), where the maximum PM2.5 concentration was below 150 μg/m3, each component equally influenced PM2.5.
Model Performance During Different Pollution Levels
The model performance during different pollution levels was also evaluated. The pollution levels used in this study were based on ambient air quality standards of the Chinese Ministry of Ecology and Environment. Table 3, Supplementary Table S2, and Figure 4 show the model performance during different pollution levels in different regions. O3 was overestimated during the “Good” level and underestimated during the “Lightly Polluted” and “Moderately Polluted” levels in all regions (Table 3). PM2.5 was overestimated in the NCP, YRD, and CY. NCP was overpredicted (<10 μg/m3) during low-pollution and underestimated (<10 μg/m3) during high-pollution events. In the YRD and CY, PM2.5 was overestimated (>20 μg/m3). In the CY, PM2.5 was highly overpredicted as all of the statistical metrics breached the suggested standards for all the pollution levels. This could be attributed to the poor terrain and complicated weather conditions in the CY region. In the PRD and FW, PM2.5 was generally underpredicted (>20 μg/m3), especially during the four pollution stages. As shown in Supplementary Table S2, NO2 was underestimated in all the five regions (>10 μg/m3) with different pollution levels except in the CY. SO2 in the NCP, YRD, and PRD regions was underestimated (>5 μg/m3), while it was overestimated in the CY and FW (>10 μg/m3).
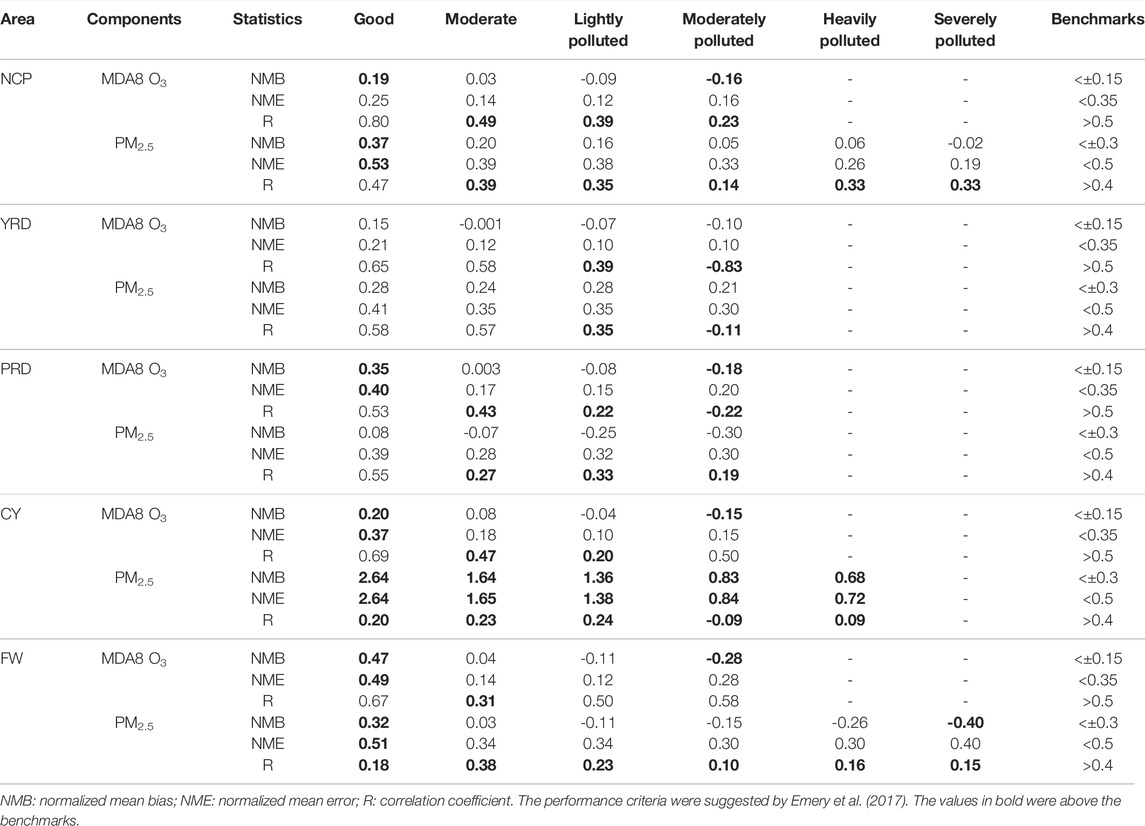
TABLE 3. Model performance of O3 and PM2.5 during different pollution levels in the five regions.
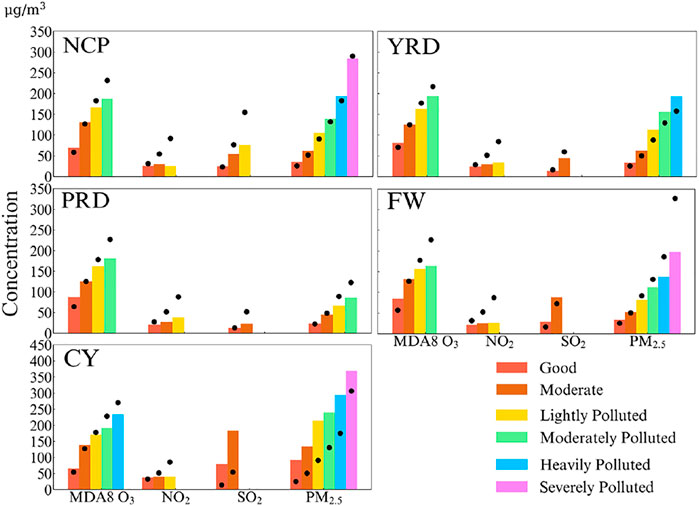
FIGURE 4. Comparison of the predicted (column) and observed (black dot) O3, NO2, SO2, and PM2.5 in the five regions for different pollution levels during the 2013–2019 period. Units are µg/m3.
Monthly and Annual Trends of Pollutants During the Study Period
Supplementary Figure S6 illustrates the monthly trends and the highest and lowest concentrations of the pollutants (O3, NO2, SO2, and PM2.5), while Figure 5 shows the annual trends of the pollutants in the five regions during 2013–2019. In addition, Figure 6 shows the total trends of the pollutants, which were obtained as the difference between 2019 and 2013 annual average concentrations in each region. Considering the model performance of the pollutants, NO2 was generally underpredicted on a monthly basis in all the regions during the whole study period except in the CY, while other pollutants exhibited better monthly predictions as illustrated in Supplementary Figure S6. It should be noted that SO2 was also overpredicted in the CY region.
FIGURE 5. Comparison of the predicted (in blue) and observed (in red) annual averaged concentrations of O3, NO2, SO2, and PM2.5 in the five regions. Units are µg/m3.
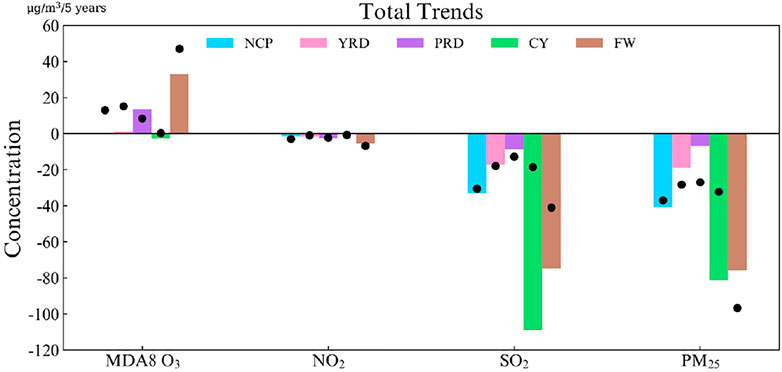
FIGURE 6. Changes in the predicted (column) and observed (black dot) O3, NO2, SO2, and PM2.5 in the five regions during the 2013–2019 period. Units are µg/m3.
In the NCP, the changes in the four pollutants during the study period followed the same pattern (Figure 5). Overall, the observed and simulated SO2 and PM2.5 decreased by about 40 μg/m3 (Figure 6), while they both decreased by ∼8 μg/m3 per year. NO2 and O3 also decreased by 3 μg/m3 per year. It can be observed from the monthly average variation (Supplementary Figure S6) that O3 had high concentrations in summer (∼200 μg/m3) and low concentrations in winter (∼20 μg/m3). Contrary to O3, other pollutants exhibited high and low concentrations in winter and summer, respectively. The difference between the simulated and observed O3, SO2, and PM2.5 was less than 10 μg/m3.
In the YRD, the trio of O3, SO2, and PM2.5 followed the same trends as observed in the NCP (Figure 6). The observed value of NO2 decreased to 31 μg/m3 in 2017 and later increased in the subsequent year (Figure 5). Similar to the NCP, O3 had high concentrations in summer (∼140 μg/m3) and low concentrations in winter (∼50 μg/m3), while the reverse was the case for other pollutants. Regarding the model performance, NO2 was underestimated (>10 μg/m3) while other pollutants were well simulated with better model performances. The annual trends of observed pollutants in the PRD were not different from those of NCP and YRD (Figure 6). It can be observed from the monthly average variation (Supplementary Figure S6) that O3 had high concentrations in summer (∼140 μg/m3) and low concentrations in winter (∼80 μg/m3). Contrarily, other pollutants displayed high and low concentrations in winter and summer, respectively. The simulated O3 was overestimated (∼10 μg/m3) (Figure 5) and increased during the study period (Figure 6). NO2 was underestimated, while PM2.5 and SO2 were well simulated with minimum bias (Figure 5).
The trends of the observed SO2 and PM2.5 in the CY were similar to the previously discussed regions (Figure 6). SO2 decreased by 55 μg/m3 between 2013 and 2014 (Figure 5). During the entire study period (Figure 5), SO2 and PM2.5 were overpredicted and NO2 was underpredicted, while O3 was well simulated with minimum bias. The simulated SO2 during the first 4 years (2013–2016) exhibited apparent seasonal variations, while the levels of observed SO2 were generally the same with no significant changes during the entire study period. In the FW region, the observed O3 increased steadily (Figures 5, 6), while SO2 and PM2.5 showed a decreasing trend during 2013–2019. Similar to other regions, high and low concentrations of O3 were observed in summer and winter, respectively, while the other three pollutants had their high and low concentrations during winter and summer, respectively. PM2.5 and SO2 were well simulated (Figure 5), NO2 was underpredicted (Supplementary Figure S5, S6), and O3 was highly overestimated during 2013–2015 (Figure 5), while the model performance for O3 greatly improved during 2016–2019.
Generally, O3 in the PRD and FW increased significantly during the study period and was about 110 μg/m3. No significant change was found in NO2 during 2013–2019. SO2 and PM2.5 decreased on yearly basis. All of the pollutants were well predicted in 2019 except SO2 and PM2.5 in the CY region.
Correlations Between PM2.5 and Other Pollutants
Figure 7 shows the correlation coefficients (R) between PM2.5 and O3, while the correlation coefficients between PM2.5, NO2, and SO2 are illustrated in Supplementary Figure S8. Considering the simulated concentrations, there was an apparent seasonal change between PM2.5 and O3 across the five regions (Supplementary Figure S7). The seasonality and correlation gradually weakened from north to south, with the difference of the NCP being more obvious than that of the YRD in different seasons. In the NCP, there was no correlation between PM2.5 and O3 in spring (Figure 7). PM2.5 was positively correlated to O3 in summer (0.2) and negatively correlated in autumn (-0.3) and winter (-0.8). The observed concentrations also exhibited similar correlations, but the correlations were closer to zero compared to the simulated concentrations (Figure 7). In the YRD, the simulated PM2.5 was positively correlated with simulated O3 during spring and summer, while negative correlations were found between them in autumn and winter. The correlation coefficients were all below 0.5. For the observed concentrations, positive correlations (<0.5) were found between the two pollutants during the four seasons. The difference between the correlation coefficients of the simulated and observed concentrations might be attributed to the overprediction of PM2.5 as O3 was well simulated (Figure 4). In the PRD, positive correlations were found between PM2.5 and O3 during the four seasons for both simulated and observed concentrations. In the CY and FW regions, the relationships between the simulated PM2.5 and O3 were all negative during the four seasons except in summer in the FW, which was positive. The poor correlations found with the simulated concentrations might be attributed to the location of the CY and FW in an inland area. Considering the observed concentrations, positive correlations were noted in spring and summer, while negative correlations were found during autumn and winter in the CY. In the FW, however, the observed PM2.5 and O3 displayed positive relationships during summer and autumn and negative correlations in both spring and winter.
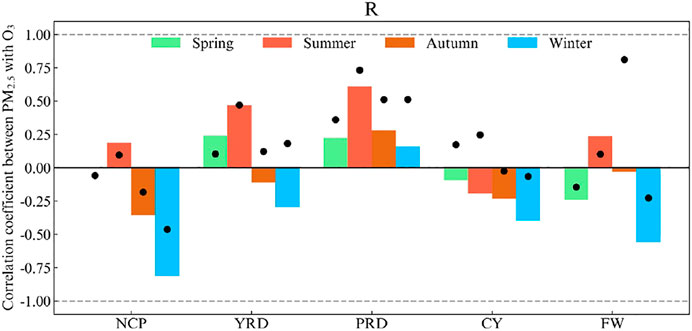
FIGURE 7. Correlation coefficients (R) between PM2.5 and O3 during the four seasons in the five regions. The columns represent the predicted, while the black dots represent the observed.
In addition to the relationship between PM2.5 and O3, the correlations between PM2.5, NO2, and SO2 were also assessed (Supplementary Figures S7, S8). Low-to-medium correlation coefficients were noted between the simulated PM2.5 and NO2, while high coefficients were found between the observed PM2.5 and NO2 during the four seasons across the five regions, an indication of the strong relationship between PM2.5 and NO2 across China during the study period. The low correlation between the simulated PM2.5 and NO2 could be associated with the underestimation of NO2 across the five regions during the four seasons. In addition, in both simulation and observation scenarios, there were strong and positive correlations between PM2.5 and SO2 during the four seasons in all five regions, and the correlation coefficients for the two scenarios were relatively similar.
Conclusion
In this study, the WRF-CMAQ model was employed to simulate the concentrations of O3, NO2, SO2, and PM2.5 in China during 2013–2019. The WRF model showed better performance in predicting reasonable and acceptable meteorological fields, which were used in driving the CMAQ model. O3 was well simulated, while NO2 was underestimated in the five selected regions. The model performance of SO2 improved with an increase in years except in the CY region, which is an inland characterized by complex terrain and complicated weather conditions. PM2.5 was well simulated in the NCP, YRD, and PRD, while it was overestimated in the CY and FW regions with NMB and NME values greatly exceeding the suggested criteria. NO3− and NH4+ were the main components that dominated PM2.5 in heavily polluted regions, while PM2.5 was influenced by SO42- in moderately polluted regions. In clean regions, such as the PRD with high temperature and precipitation, PM2.5 was equally dominated by each of NO3−, SO42-, and NH4+. During different pollution levels, all of the pollutants were overpredicted and underpredicted for clean and polluted levels, respectively. The concentrations of O3 were found increasing in each year, while those of other pollutants gradually reduced during 2013–2019 across the five regions. Substantive reductions were observed in SO2 and PM2.5 in the CY and FY regions during the 2013–2019 period. The reductions in the concentrations of the pollutants could be attributed to China’s strict emission control policies, which were implemented across the country in 2013. Considering the correlations between PM2.5 and other pollutants, PM2.5 and O3 showed seasonal variations in each region, while the variations reduced from north to south. Generally, in all of the regions except the PRD (all seasons) and YRD (spring and summer), the correlations between PM2.5 and O3 were negative during the four seasons. Low-to-medium correlations were noted between the simulated PM2.5 and NO2, while high coefficients were found between the observed PM2.5 and NO2 during the four seasons across the five regions, an indication of the strong relationship between PM2.5 and NO2 across China during the study period. In addition, in both simulation and observation scenarios, there were strong and positive correlations between PM2.5 and SO2 during the four seasons in all five regions. The results of this study improve the understanding of the ability of the CMAQ model in simulating air pollution in China over a long period and provide useful information for designing effective emission control policies toward abating the levels of pollutants in the five regions and China as a country.
Data Availability Statement
The original contributions presented in this study are included in the article/Supplementary Material; further inquiries can be directed to the corresponding author.
Author Contributions
JM, and JH designed research. JM, LL, KX, KW, JZ, and GC conducted the simulations, JL, IS, FY, NZ, MQ, YQ and JH contributed to model development and configuration. JM, LL, IS, and JH analyzed the data. JM prepared the manuscript and all coauthors helped improve the manuscript.
Funding
This work was supported by the National Natural Science Foundation of China (42007187 and 92044302).
Conflict of Interest
The authors declare that the research was conducted in the absence of any commercial or financial relationships that could be construed as a potential conflict of interest.
Publisher’s Note
All claims expressed in this article are solely those of the authors and do not necessarily represent those of their affiliated organizations, or those of the publisher, the editors, and the reviewers. Any product that may be evaluated in this article, or claim that may be made by its manufacturer, is not guaranteed or endorsed by the publisher.
Supplementary Material
The Supplementary Material for this article can be found online at: https://www.frontiersin.org/articles/10.3389/fenvs.2022.872249/full#supplementary-material
References
Bell, M. (2006). The Use of Ambient Air Quality Modeling to Estimate Individual and Population Exposure for Human Health Research: a Case Study of Ozone in the Northern Georgia Region of the United States. Environ. Int. 32, 586–593. doi:10.1016/j.envint.2006.01.005
Boylan, J. W., and Russell, A. G. (2006). PM and Light Extinction Model Performance Metrics, Goals, and Criteria for Three-Dimensional Air Quality Models. Atmos. Environ. 40 (26), 4946–4959. doi:10.1016/j.atmosenv.2005.09.087
Chen, Q., Sheng, L., Gao, Y., Miao, Y., Hai, S., Gao, S., et al. (2019). The Effects of the Trans-regional Transport of PM2.5 on a Heavy Haze Event in the Pearl River Delta in January 2015. Atmosphere 10, 237. doi:10.3390/atmos10050237
Chen, X., Wang, Z., Li, J., and Yu, F. (2014). Development of a Regional Chemical Transport Model with Size-Resolved Aerosol Microphysics and its Application on Aerosol Number Concentration Simulation over China. Sola 10, 83–87. doi:10.2151/sola.2014-017
Chen, X., Wang, Z., Li, J., Chen, H., Hu, M., Yang, W., et al. (2017). Explaining the Spatiotemporal Variation of fine Particle Number Concentrations over Beijing and Surrounding Areas in an Air Quality Model with Aerosol Microphysics. Environ. Pollut. 231, 1302–1313. doi:10.1016/j.envpol.2017.08.103
Chen, X., Wang, Z., Li, J., Yang, W., Chen, H., Wang, Z., et al. (2018). Simulation on Different Response Characteristics of Aerosol Particle Number Concentration and Mass Concentration to Emission Changes over mainland China. Sci. Total Environ. 643, 692–703. doi:10.1016/j.scitotenv.2018.06.181
Chen, X., Yang, W., Wang, Z., Li, J., Hu, M., An, J., et al. (2019). Improving New Particle Formation Simulation by Coupling a Volatility-Basis Set (VBS) Organic Aerosol Module in NAQPMS+APM. Atmos. Environ. 204, 1–11. doi:10.1016/j.atmosenv.2019.01.053
de Leeuw, G., Ronald, V. D., Bai, J., Xue, Y., Varotsos, C., Li, Z., et al. (2021). Air Quality over China. Remote Sens. 13, 3542. doi:10.3390/rs13173542
Emery, C., Liu, Z., Russell, A. G., Odman, M. T., Yarwood, G., and Kumar, N. (2017). Recommendations on Statistics and Benchmarks to Assess Photochemical Model Performance. J. Air Waste Manage. Assoc. 67, 582–598. doi:10.1080/10962247.2016.1265027
Fahey, K. M., Carlton, A. G., Pye, H. O. T., Baek, J., Hutzell, W. T., Stanier, C. O., et al. (2017). A Framework for Expanding Aqueous Chemistry in the Community Multiscale Air Quality (CMAQ) Model Version 5.1, Geosci1. Geosci. Model. Dev. 10, 1587–1605. doi:10.5194/gmd-10-1587-2017
Gong, K., Li, L., Li, J., Qin, M., Wang, X., Ying, Q., et al. (2021). Quantifying the Impacts of Inter-city Transport on Air Quality in the Yangtze River Delta Urban Agglomeration, China: Implications for Regional Cooperative Controls of PM2.5 and O3. Sci. Total Environ. 779, 146619. doi:10.1016/j.scitotenv.2021.146619
Guenther, A. B., Jiang, X., Heald, C. L., Sakulyanontvittaya, T., Duhl, T., Emmons, L. K., et al. (2012). The Model of Emissions of Gases and Aerosols from Nature Version 2.1 (MEGAN2.1): an Extended and Updated Framework for Modeling Biogenic Emissions. Geosci. Model. Dev. 5, 1471–1492. doi:10.5194/gmd-5-1471-2012
Hu, J., Chen, J., Ying, Q., and Zhang, H. (2016). One-year Simulation of Ozone and Particulate Matter in China Using WRF/CMAQ Modeling System. Atmos. Chem. Phys. 16, 10333–10350. doi:10.5194/acp-16-10333-2016
Hu, J., Li, X., Huang, L., Ying, Q., Zhang, Q., Zhao, B., et al. (2017). Ensemble Prediction of Air Quality Using the WRF/CMAQ Model System for Health Effect Studies in China. Atmos. Chem. Phys. 17, 13103–13118. doi:10.5194/acp-17-13103-2017
Hua, J., Zhang, Y., de Foy, B., Shang, J., Schauer, J. J., Mei, X., et al. (2021). Quantitative Estimation of Meteorological Impacts and the COVID-19 Lockdown Reductions on NO2 and PM2.5 over the Beijing Area Using Generalized Additive Models (GAM)). J. Environ. Manage. 291, 112676. doi:10.1016/j.jenvman.2021.112676
Li, M., Wang, T., Xie, M., Zhuang, B., Li, S., Han, Y., et al. (2017). Improved Meteorology and Ozone Air Quality Simulations Using MODIS Land Surface Parameters in the Yangtze River Delta Urban Cluster, China. J. Geophys. Res. Atmos. 122, 3116–3140. doi:10.1002/2016jd026182
Liu, T., Wang, X., Hu, J., Wang, Q., An, J., Gong, K., et al. (2020). Driving Forces of Changes in Air Quality during the COVID-19 Lockdown Period in the Yangtze River Delta Region, China. Environ. Sci. Technol. Lett. 7, 779–786. doi:10.1021/acs.estlett.0c00511
Li, M., Zhang, Z., Yao, Q., Wang, T., Xie, M., Li, S., et al. (2021). Nonlinear Responses of Particulate Nitrate to NOx Emission Controls in the Megalopolises of China. Atmos. Chem. Phys. 21 (19), 15135–15152. doi:10.5194/acp-21-15135-2021
Luo, X., and Cao, H. (2012). Evaluation of Air Quality Using the CMAQ Modeling System. Proced. Environ. Sci. 12, 159–165. doi:10.1016/j.proenv.2012.01.261
Li, X., Hussain, S. A., Sobri, S., and Md Said, M. S. (2021). Overviewing the Air Quality Models on Air Pollution in Sichuan Basin, China. Chemosphere 271, 129502. doi:10.1016/j.chemosphere.2020.129502
Ma, J., Shen, J., Wang, P., Zhu, S., Wang, Y., Wang, P., et al. (2021). Modeled Changes in Source Contributions of Particulate Matter during the COVID-19 Pandemic in the Yangtze River Delta, China. Atmos. Chem. Phys. 21 (9), 7343–7355. doi:10.5194/acp-21-7343-2021
Qin, Y., Li, J., Gong, K., Wu, Z., Chen, M., Qin, M., et al. (2021). Double High Pollution Events in the Yangtze River Delta from 2015 to 2019: Characteristics, Trends, and Meteorological Situations. Sci. Total Environ. 792, 148349. doi:10.1016/j.scitotenv.2021.148349
Shi, Z., Huang, L., Li, J., Ying, Q., Zhang, H., and Hu, J. (2020). Sensitivity Analysis of the Surface Ozone and Fine Particulate Matter to Meteorological Parameters in China. Atmos. Chem. Phys. 20, 13455–13466. doi:10.5194/acp-20-13455-2020
Sulaymon, I. D., Zhang, Y., Hu, J., Hopke, P. K., Zhang, Y., Zhao, B., et al. (2021a). Evaluation of Regional Transport of PM2.5 during Severe Atmospheric Pollution Episodes in the Western Yangtze River Delta, China. J. Environ. Manage. 293, 112827. doi:10.1016/j.jenvman.2021.112827
Sulaymon, I. D., Zhang, Y., Hopke, P. K., Hu, J., Zhang, Y., Li, L., et al. (2021b). Persistent High PM2.5 Pollution Driven by Unfavorable Meteorological Conditions during the COVID-19 Lockdown Period in the Beijing-Tianjin-Hebei Region, China. Environ. Res. 198, 111186. doi:10.1016/j.envres.2021.111186
Sulaymon, I. D., Zhang, Y., Hopke, P. K., Hu, J., Rupakheti, D., Xie, X., et al. (2021c). Influence of Transboundary Air Pollution and Meteorology on Air Quality in Three Major Cities of Anhui Province, China. J. Clean. Prod. 329, 129641. doi:10.1016/j.jclepro.2021.129641
Sulaymon, I. D., Zhang, Y., Hopke, P. K., Zhang, Y., Hua, J., and Mei, X. (2021d). COVID-19 Pandemic in Wuhan: Ambient Air Quality and the Relationships between Criteria Air Pollutants and Meteorological Variables before, during, and after Lockdown. Atmos. Res. 250, 105362. doi:10.1016/j.atmosres.2020.105362
Sun, K., Liu, H., Ding, A., and Wang, X. (2016). WRF-Chem Simulation of a Severe Haze Episode in the Yangtze River Delta, China. Aerosol Air Qual. Res. 16, 1268–1283. doi:10.4209/aaqr.2015.04.0248
Tan, J., Zhang, Y., Ma, W., Yu, Q., Wang, J., and Chen, L. (2015). Impact of Spatial Resolution on Air Quality Simulation: A Case Study in a Highly Industrialized Area in Shanghai, China. Atmos. Pollut. Res. 6, 322–333. doi:10.5094/apr.2015.036
Tao, H., Xing, J., Zhou, H., Pleim, J., Ran, L., Chang, X., et al. (2020). Impacts of Improved Modeling Resolution on the Simulation of Meteorology, Air Quality, and Human Exposure to PM2.5, O3 in Beijing, China. J. Clean. Prod. 243, 118574. doi:10.1016/j.jclepro.2019.118574
Wang, H. L., Qiao, L. P., Lou, S. R., Zhou, M., Chen, J. M., Wang, Q., et al. (2015). PM2.5 Pollution Episode and its Contributors from 2011 to 2013 in Urban Shanghai, China. Atmos. Environ. 123, 298–305. doi:10.1016/j.atmosenv.2015.08.018
Wang, H., Wang, Q., Gao, Y., Zhou, M., Jing, S., Qiao, L., et al. (2020a). Estimation of Secondary Organic Aerosol Formation during a Photochemical Smog Episode in Shanghai, China. J. Geophys. Res. Atmos. 125, 7. doi:10.1029/2019jd032033
Wang, H., Yan, R., Xu, T., Wang, Y., Wang, Q., Zhang, T., et al. (2020b). Observation Constrained Aromatic Emissions in Shanghai, China. J. Geophys. Res. Atmos. 125, 6. doi:10.1029/2019jd031815
Wang, X., Li, L., Gong, K., Mao, J., Hu, J., Li, J., et al. (2021). Modeling Air Quality during the EXPLORE-YRD Campaign–Part I. Model Performance Evaluation and Impacts of Meteorological Inputs and Grid Resolutions. Atmos. Environ. 246, 118131. doi:10.1016/j.atmosenv.2020.118131
Wang, H. L., Qiao, L. P., Lou, S. R., Zhou, M., Ding, A. J., Huang, H. Y., et al. (2016). Chemical Composition of PM2.5 and Meteorological Impact Among Three Years in Urban Shanghai, China. J. Clean. Prod. 112, 1302–1311. doi:10.1016/j.jclepro.2015.04.099
Wang, N., Lyu, X. P., Deng, X. J., Guo, H., Deng, T., Li, Y., et al. (2016). Assessment of Regional Air Quality Resulting from Emission Control in the Pearl River Delta Region, Southern China. Sci. Total Environ. 573, 1554–1565. doi:10.1016/j.scitotenv.2016.09.013
Wiedinmyer, C., Akagi, S. K., Yokelson, R. J., Emmons, L. K., Al-Saadi, J. A., Orlando, J. J., et al. (2011). The Fire Inventory from NCAR (FINN): A High-Resolution Global Model to Estimate the Emissions from Open Burning. Geosci. Model. Dev. 4, 625–641. doi:10.5194/gmd-4-625-2011
Yang, X., Wu, Q., Zhao, R., Cheng, H., He, H., Ma, Q., et al. (2019). New Method for Evaluating winter Air Quality: PM2.5 Assessment Using Community Multi-Scale Air Quality Modeling (CMAQ) in Xi'an. Atmos. Environ. 211, 18–28. doi:10.1016/j.atmosenv.2019.04.019
Yu, Y., Xu, H., Jiang, Y., Chen, F., Cui, X., He, J., et al. (2021). A Modeling Study of PM2.5 Transboundary during a winter Severe Haze Episode in Southern Yangtze River Delta, China. Atmos. Res. 248, 105159. doi:10.1016/j.atmosres.2020.105159
Zhang, H., Chen, G., Hu, J., Chen, S.-H., Wiedinmyer, C., Kleeman, M., et al. (2014). Evaluation of a Seven-Year Air Quality Simulation Using the Weather Research and Forecasting (WRF)/Community Multiscale Air Quality (CMAQ) Models in the Eastern United States. Sci. Total Environ. 473-474, 275–285. doi:10.1016/j.scitotenv.2013.11.121
Zhang, H., Cheng, S., Yao, S., Wang, X., and Zhang, J. (2019). Multiple Perspectives for Modeling Regional PM2.5 Transport across Cities in the Beijing-Tianjin-Hebei Region during Haze Episodes. Atmos. Environ. 212, 22–35. doi:10.1016/j.atmosenv.2019.05.031
Zhang, Q., Zheng, Y., Tong, D., Shao, M., Wang, S., Zhang, Y., et al. (2019). Drivers of Improved PM2.5 Air Quality in China from 2013 to 2017. Proc. Natl. Acad. Sci. U.S.A. 116, 24463–24469. doi:10.1073/pnas.1907956116
Keywords: fine particulate matter, ozone, long-term simulations, spatiotemporal variations, WRF-CMAQ, China
Citation: Mao J, Li L, Li J, Sulaymon ID, Xiong K, Wang K, Zhu J, Chen G, Ye F, Zhang N, Qin Y, Qin M and Hu J (2022) Evaluation of Long-Term Modeling Fine Particulate Matter and Ozone in China During 2013–2019. Front. Environ. Sci. 10:872249. doi: 10.3389/fenvs.2022.872249
Received: 09 February 2022; Accepted: 22 March 2022;
Published: 25 April 2022.
Edited by:
Yuqiang Zhang, the University of North Carolina at Chapel Hill, United StatesReviewed by:
Dan Chen, China Meteorological Administration, ChinaKaiyu Chen, The University of Utah, United States
Copyright © 2022 Mao, Li, Li, Sulaymon, Xiong, Wang, Zhu, Chen, Ye, Zhang, Qin, Qin and Hu. This is an open-access article distributed under the terms of the Creative Commons Attribution License (CC BY). The use, distribution or reproduction in other forums is permitted, provided the original author(s) and the copyright owner(s) are credited and that the original publication in this journal is cited, in accordance with accepted academic practice. No use, distribution or reproduction is permitted which does not comply with these terms.
*Correspondence: Jianlin Hu, amlhbmxpbmh1QG51aXN0LmVkdS5jbg==