 Wei-Ting Chen
 I-Chia Chang
 Zhigang Li
95% of researchers rate our articles as excellent or good
Learn more about the work of our research integrity team to safeguard the quality of each article we publish.
Find out more
ORIGINAL RESEARCH article
Front. Environ. Sci. , 14 October 2022
Sec. Environmental Economics and Management
Volume 10 - 2022 | https://doi.org/10.3389/fenvs.2022.871839
The priority of national development has always been economic development during the recent decades in China, so a lot of energy consumption was needed to support rapid economic development, accompanied by a number of different air pollution emissions, including SO2, NO2 CO, and PM2.5. Based on awareness of environmental protection and sustainable energy development, researchers aimed to propose strategies to reduce the amount of air pollution generation in China derived from intense industrialization. The calculation of the correlation coefficient showed high values, so the correlation of air pollutants is highly related. This study aimed to realize the outcome of the implementation of air pollution reduction acts. Therefore, the grey relational grade and grey entropy were used to analyze the air pollution trend from 2013 to 2020 due to the specific function of the grey theory. The results of this study showed that the curves of SO2, PM2.5, and CO showed a clear decreasing trend. Furthermore, the SO2 curve still decreased in the periods of 2018–2020. The most important index for air pollutants is SO2 after the calculation of grey entropy, which corresponds to the fact that the coal resource is the main energy source in the fossil fuel industries for economic growth. However, the effects of these implementations regarding air pollution reduction sufficiently control air pollution emission, especially SO2 emission.
During recent decades in China, the national development priority has always been economic development, and high energy consumption was the main contributor to supporting the rapid growth of economic development, accompanied by high emissions of various pollutants (Khoshnevis Yazdi and Khanalizadeh, 2017; Jiang et al., 2020; Dong et al., 2021; Li P et al., 2021). These pollutants were recognized as harmful to human beings’ health, and air pollution belonged to one pollutant caused by energy consumption. The coal resource was represented as an important energy source in many industries, especially in fossil fuel industries, and various air pollution, including sulfur dioxide (SO2), nitrogen dioxide (NO2), carbon oxide (CO), carbon dioxide (CO2), and particulate matter (PM), are generated during the operational processes of fossil fuel industries. Moreover, air pollution has become a critical problem based on intense economic development in the past decades, and environmental pollution has become the most serious challenge in economic progress. The consumption cost from resource depletion and environmental degradation has approached one-tenth of gross domestic product (GDP) in China during the past decade (Jin et al., 2016; Ma et al., 2020).
Air pollution emissions tended to be a serious problem due to the fast development of the economic system in China during the past decade, and one-tenth of GDP was consumed at the cost of national resource depletion and environmental degradation (Ma et al., 2020). Due to the awareness of environmental protection and sustainable energy development, the researchers aimed to offer strategies to reduce the generation of air pollution in cities of China with intense industrialization (Sofia et al., 2020; East et al., 2021; Huang et al., 2021). Therefore, the Chinese government implemented air pollution reduction due to the intense impact of air pollution on the living environment. In the past decade, two significant policies have been launched to mitigate air pollution in China: atmosphericpollution prevention (test) was first announced in 2014 (Ministry of Ecology and Environment of the People’s Republic of China, 2014), and the Environmental Protection Tax Law was introduced in 2018 (State Taxation Administration, 2018). The goal of atmosphericpollution prevention (test) was to focus on the reduction of particulate matter, and the aim of the Environmental Protection Tax Law was to target the tax charge from the user.
Based on the situations of rapid economic growth, severe air pollution, and the implementation of air pollution mitigation policy, this study aimed to observe the effects of these acts on air pollution reduction by analyzing air pollution trends. The grey theory model (Wen, 2004; You et al., 2012; You and Chen, 2014; Li Z et al., 2021) was used to analyze air pollution, including SO2, NO2, CO, and PM, from 2013 to 2020. Two useful methods from the grey theory model, grey relational grade and grey entropy, were applied to analyze the air pollution data. The results of these two methods were available to indicate the weighting range of these air pollutants. Consequently, the results of this study could also be used to evaluate the efficacy of air pollution reduction actions.
The economic system of China belonged to a developing country because its economic system progressed much later than other countries around the world. However, China is rich in natural resources due to its national territorial area, so the economic system of China has the potential for rapid development. Therefore, the massive consumption of natural resources resulted in the bombing of economic and industrial developments, causing a great deal of pollution generation during the past decades in China. The coal resource is a useful and inexpensive natural energy resource in many applications (Jiang et al., 2020; Dong et al., 2021; Li P et al., 2021), including the use of livelihoods, industrial use, power generation, and the demand for military use, and energy in Asia can reach the level of 80% while using fossil fuels with coal as the primary energy source (Carmichael et al., 2002). The content of coal contained a great amount of carbon, hydrogen, oxygen compounds, and a small amount of sulfur and nitrogen complexes, so the combustion of the coal resource generated various air pollution, such as CO, CO2, SO2, NO2, and PM.
The Chinese government proposed the act of atmospheric pollution prevention (Rauch and Chi, 2010) at the end of 2013 for mitigation of air pollution. Furthermore, the Chinese government introduced another act regarding the assessment of atmosphericpollution prevention results (test) in 2014 (Feng and Liao, 2016; Shi et al., 2016) for the evaluation of air pollution prevention. This act was recognized as the most rigorous outcome assessment of atmosphericpollution prevention due to the intensely growing problem of severe air pollution. As a result, this act aimed at the goal of 10%, 35%, and 65% reductions in PM2.5 or PM10 in 2014, 2015, and 2016, and the effect evaluation of the reduction actions was regulated in April 2017.
The Chinese government proposed the law “Environmental Protection Tax Law of the People’s Republic of China” on 1 January 2018 to promote the reduction of emissions and industrial progress. This law is broadly applied in various industries that emit pollutants directly into the environment (Hu B et al., 2020; Li Z et al., 2021). The law also regulated that no policy of return tax would be given back to provincial governments after tax revenues have been collected. However, it is difficult to charge pollution discharge fees from many enterprises on time because there is a lack of compulsory means. Companies are willing to proactively reduce emissions only when the fee is higher than the company’s marginal abatement cost of the company. Otherwise, these acts will tend to the invalid allocation of resources and environmental problems (Hu X et al., 2020).
There are many algorithms, such as machine learning (Udemba et al., 2020; Mele and Magazzino 2020; Mele et al., 2021; Magazzino et al., 2021a; Magazzino et al., 2021b; Magazzino et al., 2022), panel threshold regression (Li P et al., 2021), and grey theory model (Wen, 2004; You et al., 2012; You and Chen, 2014; Li Z et al., 2021), applied to evaluate the trend or relationship of real-time issues. Moreover, each algorithm acquires its own traits and weaknesses, so the trend or relationship of data was based on the desired outcome. This study focused on the weighting range of air pollution, so the grey relational grade and grey entropy were fitted to analyze the weighting range of the data.
This study aimed to understand the effects of acts on air pollution reduction via analyzing air pollution trends, where air pollution involved PM2.5, SO2, NO2, and CO, and the test periods were 2013–2020. Our data was obtained from the National Bureau of China and China Stock Market & Accounting Research (CSMAR). Figure 1 shows air pollution in China from 2013 to 2020, and 2014 and 2018 are two index years for assessing the efficacy of air pollution reduction acts. The Chinese government introduced air pollution control policies to mitigate air pollution at the end of 2013 (Jin et al., 2016) and then implanted the act concerning effect evaluation of atmospheric pollution prevention (test) in 2014 (Feng and Liao, 2016; Shi et al., 2016). Furthermore, the Chinese government proposed another law of the “Environmental Protection Tax Law of the People’s Republic of China” at the beginning of 2018 for decreasing emissions of air pollution and progressing industrial processes (Hu B et al., 2020; Li P et al., 2021). Therefore, this study adopted the period of air pollution from 2013 to 2020.
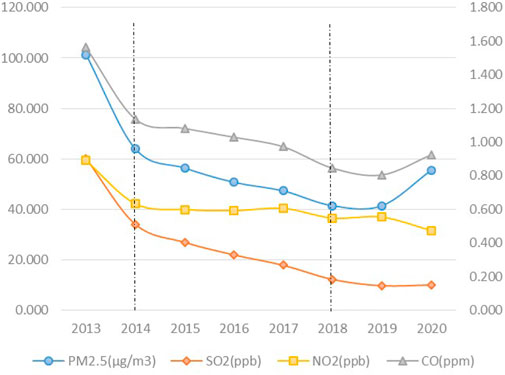
FIGURE 1. Distribution of air pollution in China during 2013–2020.
Statistical product and service solutions (SPSS) were used to analyze air pollution in China from 2013 to 2020, and the basic statistical descriptions of four air pollution using SPSS analysis are shown in Table 1.
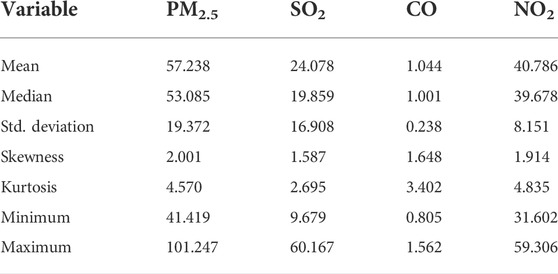
TABLE 1. Descriptive statistics of air pollutants.
The grey theory model was derived from fuzzy set theory, proposed by Zadeh in 1965 (Zadeh,1965), and fuzzy set theory was sequentially extended to various advanced models, including fuzzy sets, fuzzy logic, fuzzy systems, and fuzzy algorithms. Moreover, these algorithm models have been broadly applied in several industries, such as scientific, commercial, and consumer products, and in market applications (Zadeh 1978; Zadeh and Klir, 1996; Zadeh 1999). Furthermore, some current methods combined with fuzzy set theory were developed, involving genetic algorithms, chaos, neural networks, belief networks, grey theory, and rough set theory, to present correct and flexible calculations in real-time issues (Wen, 2004; You et al., 2012; You and Chen, 2014; You et al., 2017; Li Z et al., 2021). The grey relational grade and grey entropy were two useful algorithm methods of the grey theory model from the study of Prof. Wen, the grey system (Wen, 2004), which were applied in some published studies (You et al., 2012; You et al., 2017; Li P et al., 2021), and these two algorithm methods were introduced as follows.
The sequences
If the index
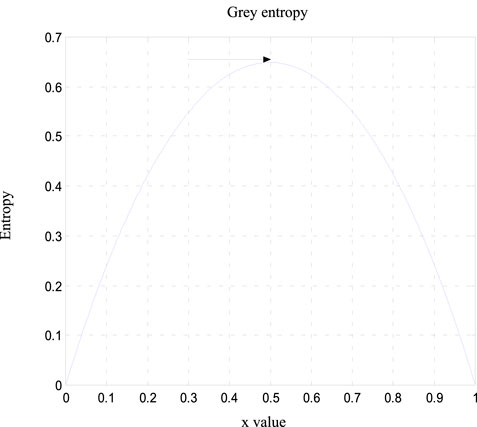
FIGURE 2. Pattern of grey entropy under the assumption of monotonicity in the range (Wen K. L. 2004; You M. L., 2017).
The basic concept of grey entropy and a random number was described as the following contents. A function was expressed as
where
i)
ii)
iii)
Based on the conditions mentioned earlier, the new entropy is derived from the original entropy, which is called the grey entropy, as depicted in Eq. (4).
where
i) The value of
ii) The condition of W(x) satisfies with the following,
There are seven steps in the grey entropy calculation process, and these steps are shown below (You et al., 2012).
Set the sequences
2) Calculating the total sum of the attribute of each factor
Calculating the normalization coefficient
4) Calculating the entropy of each factor
5) Calculating the sum of entropy
6) Calculating the relative weighting
7) Normalization of the weighting: the value
Table 1 shows the basic statistical descriptions that include mean, median, standard deviation, skewness, kurtosis, minimum value, and maximum value of four air pollutants. The standard deviation values of four air pollutants are small, where the smallest value is the CO index, and the small standard deviation value shows that the difference in most values from 2013 to 2020 is small. Furthermore, the mean of each factor is significantly different from zero, and the mean values are higher than their relative median values. The skewness of air pollution shows positive values for all factors, and the distribution of the kurtosis for air pollution also seems to be leptokurtic, except for SO2. The entire trend of air pollution seems to decrease monotonically during the overall periods, as shown in Figure 1. Especially, the effects on air pollution reduction present a significant outcome at the beginning of implementing the acts. Table 2 shows the correlation coefficient of air pollutants, and the coefficient values range from 0.889 to 0.986. The correlation coefficient between PM2.5 and other factors was 0.946, 0.973, and 0.889 for SO2, CO, and NO2, respectively. Most correlation coefficients have a high value, so the correlation of air pollutants is highly related. As a result, it is not possible to realize which factor most influenced the outcome of the implementation of air pollution reduction acts. However, the principle of the grey theory model aimed to weight the range of factors, so the grey relational grade and grey entropy were fitted to analyze the effects of each reduction of air pollutants after policy implementation.
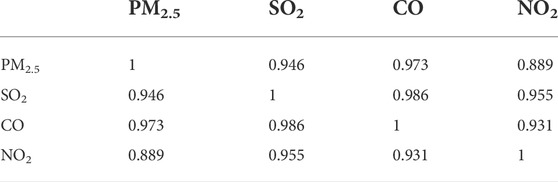
TABLE 2. Correlation coefficient of air pollutants.
The grey relational grade was based on the minimum value principle to evaluate the relational grade of air quality from 2013 to 2020, where the minimum values of each factor were used as the standard sequence, and the other values were set as inspection sequences. Then, the abovementioned sequences were applied in Eq. 1 to derive grey relational grade for each year, as displayed in Table 3. The relational grade of each year is classified as 2020, 2019, 2018, 2017, 2016, 2015, 2014, and 2013, from high to low value of the grey relational grade, which represents the best and worst degree of air quality, respectively, 2020 and 2013. As a result, air pollution will be alleviated from 2013 to 2020 after implementing these acts and tax policies regarding air pollution reduction. In addition, Figure 1 also shows obvious decreasing curves from 2013 to 2020, and the decreasing degree is much more vivid in the curves from 2014 to 2018, compared to the curves from 2018 to 2020. Furthermore, the decrease in the curves of SO2, PM2.5, and CO is much clear when compared with the curve of NO2. Additionally, the SO2 curve still decreases from 2018 to 2020, and the curves of other air pollution do not decrease well from 2018 to 2020.
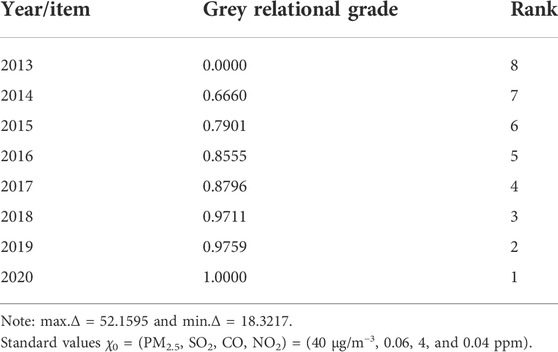
TABLE 3. Grey relational grade for each year.
Tables 4 and 5 show the middle values of the processing through the calculation steps of the formula in grey entropy by Kansei Engineering Toolbox. The relative weighting lambda for PM2.5, SO2, CO, and NO2 was 0.2353, 0.3280, 0.2198, 0.1577, and 0.2169, respectively, depicting the effects of air pollutants ranging from SO2 > PM2.5 > NO2 > CO. The most important index on air pollutants is SO2 after the calculation of grey entropy, which corresponds to the previous statements that the coal resource is the main energy source in the fossil fuel industries for economic growth. SO2 emission is one of the main sources of air pollution during operational processes of the fossil fuel industries. The necessary energy demand for economic growth in China induces the broad use of fossil fuels in industrial processes, so nearly half of the air pollutant comes from fossil fuel combustion. Furthermore, Li et al. proposed that the combustion of coal and gas is the second largest energy resource in Taiwan, resulting in the top two effects of air pollution, SO2 and PM10, by using the grey entropy calculation. The possible reason for the abovementioned statement is that the Taiwanese government launched a policy on nuclear power reduction after 2014, which resulted in the increase of energy generation sources from coal combustion, accompanied by a decline in nuclear power (Li Z et al., 2021). As a result, the concentration of SO2 emission was generally associated with the combustion of coal. However, the Chinese government implemented these acts and tax policies on air pollution reduction to alleviate air pollution emissions, and the effects of these implementations sufficiently control air pollution emissions, especially SO2 emissions.
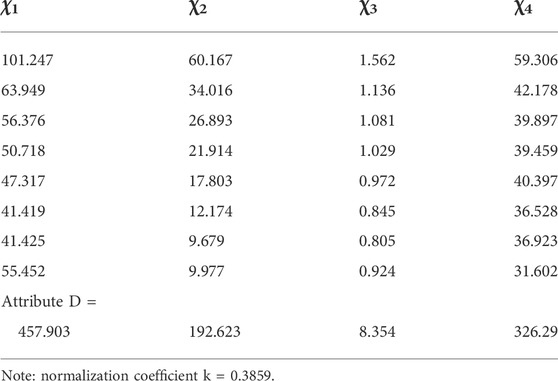
TABLE 4. Values of “attribute D” of four air pollutants.
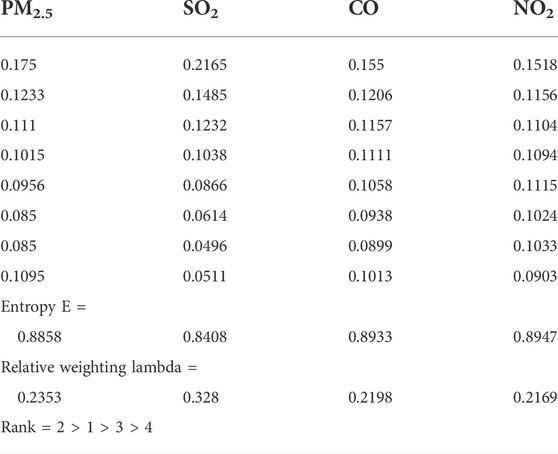
TABLE 5. Weighted values of each factor using grey entropy.
Some studies indicate that atmospheric pollution in China has improved accordingly after the implementation of air pollution reduction acts (Feng and Liao, 2016; Han and Li, 2020). There are many studies that deal with the trend or relationship among economic development, environmental pollution effect, and relative implementation of policies in countries around the world. As a result, various algorithms were employed to evaluate the trend or relationship of real-time issues. Regression was a common algorithm to depict the correlation of various factors, and a grey theory model was available to calculate the weighting range of different factors. This study focused on the discussion of the most efficient air pollution reduction acts after the introduction of acts of air pollution protection.
The correlation of air pollutants is highly related after calculating the correlation coefficient due to high coefficient values. However, the grey theory model is based on the weighting range of air pollution, so results through the analysis of the grey theory model are available to identify the influenced effect of air pollution.
We used the grey relational grade and grey entropy to analyze the air pollution trend from 2013 to 2020 to understand the efficacy of implementation of acts and laws of air pollution reduction. The results of this study showed that the curves of SO2, PM2.5, and CO showed a much clear decreasing trend when compared with the curve of NO2. Furthermore, the SO2 curve still decreased in the periods of 2018–2020, and the curves of other air pollution did not decrease well. The most important index on air pollutants is SO2 after the calculation of grey entropy, which corresponds to the previous statements that the coal resource is the main energy source in the fossil fuel industries for economic growth. SO2 emission is one of the main sources of air pollution during operational processes of the fossil fuel industries. The energy demand for economic growth in China relied on coal energy, so nearly half of the air pollutant is from fossil fuel combustion (Xie et al., 2016; Miao et al., 2019; Zhu et al., 2019). However, the effects of these implementations adequately controlled air pollution emissions, especially SO2 emissions, after the Chinese government implemented these acts and tax policies on the reduction of air pollution to alleviate air pollution emissions.
The method of this study is available to apply in the discussion of target issues and their relative factors. However, the results are highly associated with the target issues and their relative factors in the specific country. Therefore, the results and conclusions of this study might not be acceptable in other countries around the world, except China, due to the regionalism variation.
The implementation of air pollution reduction acts was available to many contributors, including air pollution mitigation, energy consumption reduction, manufacturing process progress, green and recycled energy development, environmental improvement, and economic growth, so there were many aspects for observing the effects of policies implemented on the abovementioned issues. Economic growth is an interesting and practical topic for future work because the economic system in China is large and closely related to other financial systems around the world.
The data analyzed in this study is subject to the following licenses/restrictions: China Stock Market & Accounting Research (CSMAR). Requests to access these datasets should be directed to https://cn.gtadata.com/.
All authors listed have made a substantial, direct, and intellectual contribution to the work and approved it for publication.
The authors appreciate Kun-Li Wen’s instruction on grey relational grade theory.
The authors declare that the research was conducted in the absence of any commercial or financial relationships that could be construed as a potential conflict of interest.
All claims expressed in this article are solely those of the authors and do not necessarily represent those of their affiliated organizations, or those of the publisher, the editors, and the reviewers. Any product that may be evaluated in this article, or claim that may be made by its manufacturer, is not guaranteed or endorsed by the publisher.
Carmichael, R. G., Streets, G. D., Calori, G., Amann, M., Jacobson, Z. M., Hansen, J., et al. (2002). Changing trends in sulfur emissions in Asia: implications for acid deposition, air pollution, and climate. Environ. Sci. Technol. 36 (22), 4707–4713. doi:10.1021/es011509c
Dong, D., Xu, B., Shen, N., and He, Q. (2021). The adverse impact of air pollution on China’s economic growth. Sustainability 13, 9056. doi:10.3390/su13169056
East, J., Montealegre, J. S., Pachon, J. E., and Garcia-Menendez, F. (2021). Air quality modeling to inform pollution mitigation strategies in a Latin American megacity. Sci. Total Environ. 776, 145894. doi:10.1016/j.scitotenv.2021.145894
Feng, L., and Liao, W. (2016). Legislation, plans, and policies for prevention and control of air pollution in China: achievements, challenges, and improvements. J. Clean. Prod. 112, 1549–1558. doi:10.1016/j.jclepro.2015.08.013
Han, F., and Li, J. (2020). Assessing impacts and determinants of China's environmental protection tax on improving air quality at provincial level based on Bayesian statistics. J. Environ. Manage. 271, 111017. doi:10.1016/j.jenvman.2020.111017
Hu, B., Dong, H., Jiang, P., and Zhu, J. (2020). Analysis of the applicable rate of environmental tax through different tax rate scenarios in China. Sustainability 12, 4233. doi:10.3390/su12104233
Hu, X., Liu, J., Yang, H., Meng, J., Wang, X., Ma, J., et al. (2020). Impacts of potential China's environmental protection tax reforms on provincial air pollution emissions and economy. Earth's. Future 8, e2019EF001467. doi:10.1029/2019EF001467
Huang, Y., Lei, C., Liu, C. H., Perez, P., Forehead, H., Kong, S., et al. (2021). A review of strategies for mitigating roadside air pollution in urban street canyons. Environ. Pollut. 280, 116971. doi:10.1016/j.envpol.2021.116971
Jiang, M., Kim, E., and Woo, Y. (2020). The relationship between economic growth and air pollution—a regional comparison between China and South Korea. Int. J. Environ. Res. Public Health 17, 2761. doi:10.3390/ijerph17082761
Jin, Y., Andersson, H., and Zhang, S. (2016). Air pollution control policies in China: a retrospective and prospects. Int. J. Environ. Res. Public Health 13, 1219. doi:10.3390/ijerph13121219
Khoshnevis Yazdi, S., and Khanalizadeh, B. (2017). Air pollution, economic growth and health care expenditure. Econ. Research-Ekonomska Istraz. 30, 1181–1190. doi:10.1080/1331677X.2017.1314823
Li, N., and Zhao, H. (2016). Performance evaluation of eco-industrial thermal power plants by using fuzzy GRA-VIKOR and combination weighting techniques. J. Clean. Prod. 135, 169–183. doi:10.1016/j.jclepro.2016.06.113
Li, P., Lin, Z., Du, H., Feng, T., and Zuo, J. (2021). Do environmental taxes reduce air pollution? Evidence from fossil-fuel power plants in China. J. Environ. Manage. 295, 113112. doi:10.1016/j.jenvman.2021.113112
Li, Z., Chen, W. T., Chang, I. C., and Hung, C. C. (2021). Dynamic relationship between air pollution and economic growth in taiwan deduced from mathematical models. Clean. –. Soil Air Water 49, 2100081. doi:10.1002/clen.202100081
Ma, G., Peng, F., Yang, W., Yan, G., Gao, S., Zhou, X., et al. (2020). The valuation of China’s environmental degradation from 2004 to 2017. Environ. Sci. Ecotechnology 1, 100016. doi:10.1016/j.ese.2020.100016
Magazzino, C., Mele, M., Morelli, G., and Schneider, N. (2021a). The nexus between information technology and environmental pollution: Application of a new machine learning algorithm to OECD countries. Util. Policy 72, 101256. doi:10.1016/j.jup.2021.101256
Magazzino, C., Mele, M., Schneider, N., and Shahzad, U. (2022). Does export product diversification spur energy demand in the APEC region? Application of a new neural networks experiment and a decision tree model. Energy Build. 258, 111820. doi:10.1016/j.enbuild.2021.111820
Magazzino, C., Porrini, D., Fusco, G., and Schneider, N. (2021b). Investigating the link among ICT, electricity consumption, air pollution, and economic growth in EU countries. Energy Sources, Part B Econ. Plan. Policy 16 (11-12), 976–998. doi:10.1080/15567249.2020.1868622
Mele, M., and Magazzino, C. (2020). A machine learning analysis of the relationship among iron and steel industries, air pollution, and economic growth in China. J. Clean. Prod. 277, 123293. doi:10.1016/j.jclepro.2020.123293
Mele, M., Magazzino, C., Schneider, N., and Nicolai, F. (2021). Revisiting the dynamic interactions between economic growth and environmental pollution in Italy: evidence from a gradient descent algorithm. Environ. Sci. Pollut. Res. 28 (37), 52188–52201. doi:10.1007/s11356-021-14264-z
Miao, Z., Baležentis, T., Shao, S., and Chang, D. (2019). Energy use, industrial soot and vehicle exhaust pollution—China's regional air pollution recognition, performance decomposition and governance. Energy Econ. 83, 501–514. doi:10.1016/j.eneco.2019.07.002
Ministry of Ecology and Environment of the People’s Republic of China, Law of atmospheric pollution prevention (test) 2014, Available at: https://www.mee.gov.cn/gkml/hbb/bwj/201407/t20140725_280516.htm
National Bureau of Statistics of China, Available at: http://www.stats.gov.cn/english/Statisticaldata/AnnualData/
Nelabhotla, D. M., Jayaraman, T. V., Asghar, K., and Das, D. (2016). The optimization of chemical mechanical planarization process-parameters of c-plane gallium-nitride using Taguchi method and grey relational analysis. Mat. Des. 104, 392–403. doi:10.1016/j.matdes.2016.05.031
Rauch, J. N., and Chi, Y. F. (2010). The plight of Green GDP in China. Consilience 3, 102–116. doi:10.7916/consilience.v0i3.4498
Shi, H., Wang, Y., Chen, J., and Huisingh, D. (2016). Preventing smog crises in China and globally. J. Clean. Prod. 112, 1261–1271. doi:10.1016/j.jclepro.2015.10.068
Sofia, D., Gioiella, F., Lotrecchiano, N., and Giuliano, A. (2020). Mitigation strategies for reducing air pollution. Environ. Sci. Pollut. Res. 27, 19226–19235. doi:10.1007/s11356-020-08647-x
State Taxation Administration, Environmental protection tax law 2018, Available at: http://www.chinatax.gov.cn/n810341/n810755/c3348910/content.html
Udemba, E. N., Magazzino, C., and Bekun, F. V. (2020). Modeling the nexus between pollutant emission, energy consumption, foreign direct investment, and economic growth: new insights from China. Environ. Sci. Pollut. Res. 27 (15), 17831–17842. doi:10.1007/s11356-020-08180-x
Wen, K. L. (2004). Grey systems: modeling and prediction. Tucson: Yang's Scientific Research Institute.
Xie, H., Shen, M., and Wei, C. (2016). Technical efficiency, shadow price and substitutability of Chinese industrial SO2 emissions: a parametric approach. J. Clean. Prod. 112, 1386–1394. doi:10.1016/j.jclepro.2015.04.122
You, M. L., and Chen, W. T. (2014). The imperfection of ordinal grey relational grade in grey system theory. J. Grey. Syst. 17 (2), 83–89. doi:10.30016/JGS
You, M. L., Hsieh, W. F., Chen, P. J., and Wen, K. L. (2012). The development of GSM toolbox and its application in outstanding teacher assessment & 300m man's race. J. Grey. Syst. 15, 151–157. doi:10.30016/JGS.201209.0006
You, M. L., Shu, C. M., Chen, W. T., and Shyu, M. L. (2017). Analysis of cardinal grey relational grade and grey entropy on achievement of air pollution reduction by evaluating air quality trend in Japan. J. Clean. Prod. 142 (4), 3883–3889. doi:10.1016/j.jclepro.2016.10.072
Zadeh, L. A. (1978). Fuzzy sets as a basis for a theory of possibility. Fuzzy Sets Syst. 1, 3–28. doi:10.1016/0165-0114(78)90029-5
Zadeh, L. A. (1999). Fuzzy sets as a basis for a theory of possibility. Fuzzy Sets Syst. 100, 9–34. doi:10.1016/s0165-0114(99)80004-9
Zadeh, L. A., and Klir, G. J. (1996). Fuzzy sets, fuzzy logic, fuzzy systems: selected papers by lofti A. Zadeh. Adv. Fuzzy Syst. — Appl. Theory 6, 1–840. doi:10.1142/2895
Zhu, L., Hao, Y., Lu, Z. N., Wu, H., and Ran, Q. (2019). Do economic activities cause air pollution? Evidence from China’s major cities. Sustain. Cities Soc. 49, 101593. doi:10.1016/j.scs.2019.101593
Keywords: economic development, air pollution, grey relational grade, grey entropy, fossil fuel industries
Citation: Chen W-T, Chang I-C and Li Z (2022) Weighting analysis on air pollution among recent years in China via grey theory models. Front. Environ. Sci. 10:871839. doi: 10.3389/fenvs.2022.871839
Received: 08 February 2022; Accepted: 11 August 2022;
Published: 14 October 2022.
Edited by:
Ming Zhang, University of Mining and Technology, ChinaReviewed by:
Umer Shahzad, Anhui University of Finance and Economics, ChinaCopyright © 2022 Chen, Chang and Li. This is an open-access article distributed under the terms of the Creative Commons Attribution License (CC BY). The use, distribution or reproduction in other forums is permitted, provided the original author(s) and the copyright owner(s) are credited and that the original publication in this journal is cited, in accordance with accepted academic practice. No use, distribution or reproduction is permitted which does not comply with these terms.
*Correspondence: Zhigang Li, bGl6Z0BzYnMuZWR1LmNu
Disclaimer: All claims expressed in this article are solely those of the authors and do not necessarily represent those of their affiliated organizations, or those of the publisher, the editors and the reviewers. Any product that may be evaluated in this article or claim that may be made by its manufacturer is not guaranteed or endorsed by the publisher.
Research integrity at Frontiers
Learn more about the work of our research integrity team to safeguard the quality of each article we publish.