
94% of researchers rate our articles as excellent or good
Learn more about the work of our research integrity team to safeguard the quality of each article we publish.
Find out more
ORIGINAL RESEARCH article
Front. Environ. Sci., 14 September 2022
Sec. Drylands
Volume 10 - 2022 | https://doi.org/10.3389/fenvs.2022.866309
This article is part of the Research TopicCurrent Insights in DrylandsView all 13 articles
 Abeer Albalawneh1*
 Amani Al-Assaf2
 Amer Sweity3Wafa’a Abu Hammour1Khawla Kloub1
 Amgad Hjazin1Rabab Kabariti4Lana Abu Nowar4
 Maher J. Tadros5Safaa Aljaafreh1Mai Diab1Jafar Alwidyan1Ghadeer Albashbsheh4
 Nizar Haddad6
Cultural ecosystem services (CESs) refer to the non-monetary benefits that nature provides humans. This study aimed to allocate and map the CESs in the hyper arid region at the southern part of Wadi Araba as a unique ecosystem in Jordan. 296 residents were participated in a structured questionnaire. The respondents were prompted to indicate CES by drawing dots on a geo-referenced landscape map corresponding to any areas they considered as CES. The results showed that (81.1%) of the locals practice hiking (71.3%) of locals practice walking, and (66.2%) of the locals visit sand dunes which are all among the most CESs the locals engage with. Moreover, respondents expressed that these activities are not related to their primary source of income. The results were mapped and subjected to hot-spot and statistical analyses using a geographical information system (GIS)-based spatial evaluation and statistical analysis using the kernel density estimation (KDE) and Getis-Ord Gi* statistics with inverse distance weight (IDW) interpolation. Overall, the CESs provided by their region were appreciated by most residents. The hot-spot analysis revealed that those core hot-spots (Getis-Ord-Gi* values equal to p = 0.01) covered 19.6% while core cold spots covered 21.2% of the study area. The respondents expressed eagerness to contribute to a constant flow of CESs if the restoration plans are fully supported by the local community. The CES maps generated using the data collected in the present study can serve as baseline measures of the CES provisions subject to change based on the parameters of each development scenario. Furthermore, these maps could help support current and future management efforts by integrating communities’ preferences into development and conservation initiatives, thereby ensuring more efficient and effective utilization of CESs.
The concept of ecosystem services (ES) was adopted in the 1960s (King, 1966; Helliwell, 1969) and refers to the processes and benefits that the ecosystem provides to humanity, with an emphasis on those with economic outcomes (Chaudhary et al., 2015) and it was coined by Paul and Anne Ehrlich in 1981 (4). The common definition of ES currently includes all of the material (e.g., monetary) and non-material (e.g., aesthetic, spiritual) elements directly and indirectly derived from the biodiversity of an ecosystem that support human wellbeing in a sustainable manner (Millennium ecosystem assessment, M. E. A., 2005; Wallace, 2007). Inherent in this definition is the notion that human well-being is strongly reliant on dynamic and healthy ecosystems and natural resources, which are responsible for the constant flow of ESs from the environment to humanity. These services are classified into four classes (King, 1966): provisioning ES to provide essential services (e.g., foods, building material, water) (Helliwell, 1969); regulating ES to monitor and maintain climate stability (e.g., disease control, coastal protection, flood control); (Chaudhary et al., 2015); supporting ESs (e.g., nutrient cycling, soil formation, pollination); and (Braat and de Groot, 2012) cultural ESs (CESs) that provide “the “intangible”, “subjective”, “non-use”, and “non-material” benefits people gained from ecosystems through spiritual enrichment, intellectual development, reflection, recreation, and aesthetic experience (education, tourism) and they are difficult to quantify” (Leemans and De Groot, 2003; Millennium ecosystem assessment, M. E. A., 2005; Haines-Young and Potschin, 2011).
The nature conservation targets cannot be achieved formally protected areas alone, and thus, conservation must be integrated into the daily activities taking place on public and private lands namely, on lands designated for production (e.g., agricultural) and non-production (e.g., residential), respectively. Therefore, many global resource management initiatives include ES concepts to align ecological conservation with socio-economic decisions related to the environment (Tallis et al., 2011). For scientists and practitioners alike, ES has become 1) a crucial link between global ecological health with human wellbeing, 2) a currency through which to determine environmental and economic policies, 3) a conceptual link between the natural and social sciences, and 4) a mechanism with which to communicate the importance of nature conservation to policymakers and the general public (de Groot et al., 2002; Cowling et al., 2008; Carpenter et al., 2009; Tallis et al., 2011).
Mapping and valuing ES is increasingly used to provide visual tools that enable decision-makers to maximize the sustainability of future developments. Mapping ES is a growing trend and the number of studies and reviews on ES mapping are on the rise (Crossman et al., 2012). Brown et al. developed a landscape values approach and public participation geographic information systems (PPGISs) to map and measure landscape tangible and non-tangible ES values (Brown and Raymond, 2007; Raymond et al., 2009; Brown et al., 2012; Brown and Weber, 2013). ES mapping is a user-friendly, useful tool for raising public awareness about ecosystem areas of interest and ES delivery relevant to their region; it identifies how humans could rely on functioning nature and provides information about interregional ES flows (Raymond et al., 2009). Allocating ES hotspots has become an essential means of integrating ES into the process of ecological conservation assessment. ES hot-spots have been described as ecological features with high service diversity and high biophysical or monetary value of services that benefit humans; while cold spots are ecological features with few services and low value (Schröter and Remme, 2016; Li et al., 2017).
As mentioned earlier, CES is an essential subset of ES derived from landscapes, yet not thoroughly researched and not fully integrated into operational frameworks or in nature protection and landscape management programs (Satz et al., 2013). Considerably, relatively few studies focus on CES (Chan et al., 2012a; Milcu et al., 2013; Leyshon, 2014; Andersson et al., 2015; Hirons et al., 2016). This is partly due to the challenges of measuring intangible and subjective values and the complex nature of CES makes it hard to quantify. Most studies focus on recreation and ecotourism while far fewer on other CES categories (Hernández-Morcillo et al., 2013; Plieninger et al., 2013). However, CES identification and quantification remains an important tool for optimal landscape planning and effective ecosystem management (Davidson, 2013).
CES’s are sensitive to external impacts such as landscape changes and inappropriate management. Considering how different landscape features contribute to diverse CES provision is essential for effective landscape planning and management. This is also of interest when assessing landscape changes (Bieling et al., 2014; Plieninger et al., 2015). Consequently, the techniques being implemented in ES valuation and mapping are usually congregated in the related biophysical, socio-cultural, and economic domains (Martín-López et al., 2014). The socioeconomic status of the residents also influences which interventions are made for natural resource management; this variation is largely based on locals’ natural and socio-economic conditions (Cheung and Jim, 2013). This CES socio-cultural valuation is especially important for exploring human perceptions and their preferences among existing CES valuations (Martín-López et al., 2012).
Recent efforts toward measuring CESs in Jordan have identified some relevant trends and issues (Al-assaf et al., 2014; Alassaf et al., 2014; Shishany et al., 2020). Only a few studies have been conducted on valuing ES in Jordan in general, and on CES in particular, very few map CES and all of these were conducted on a local or landscape spatial scale (Al-assaf et al., 2014; Alassaf et al., 2014; Al-Assaf et al., 2016; Shishany et al., 2020). Social and natural science methods were combined and used to provide a holistic understanding of the socio-ecological system via the currency of ecosystem services in Wadi Araba (Sagie et al., 2013; Orenstein and Groner, 2015). Ecotourism’s as CES in WA (e.g., hiking, camping, photography and filming, mountain climbing, biking, walking, sand dunes, waterfalls, bird watching, historical sites, hunting, and camelback riding) have transformed the region into an attractive and desirable tourist destination. The local population in hyper-arid areas is firmly connected to the local landscape and ecosystem (Sagie et al., 2013). Therefore, this study aimed to integrate allocating and mapping CES hot-spots specifically for recreation and ecotourism from a public participatory approach in the arid region of the Wadi Araba valley in south Jordan.
Wadi Araba is a 2,000-km2 extremely harsh desert environment that extends 170 km from the southern part of the Dead Sea shore (400 m below sea level) to the Gulf of Aqaba at the Red Sea (130 m above sea level) and occupies 2.4% of Jordan’s total area (Nawash and Al-Horani, 2011; Orenstein and Groner, 2015). Six large communities reside in Wadi Araba with an estimated population of 10,500 people living in 820 households according to the most recent survey of the region in 2019 (Ministry of Interior, 2019). Wadi Araba is near Aqaba city, a recreational destination popular among citizens from other cities in Jordan and international visitors alike, which, along with Wadi Rum and Petra, constitute Jordan’s most significant tourism sites (El-Naqa et al., 2010). Wadi Araba suffers from a surface water scarcity due to low rainfall rates and spatial fluctuations; in addition, the absence of valleys and permanently flowing torrents affects its ecosystem in general and ESs in particular. Only 8 million cubic meters of floodwater is associated with the valleys and torrents in the Wadi Araba region annually. Floodwater is a crucial water source for the region because it recharges groundwater and increases the moisture in the soil, which facilitates the growth of pastoral plants (Company, 2019).
The selected study sites were all located in the southern part of Wadi Araba including Rahama, Qatar, Ar Rishah, and Beir Mathkour, which host 50% of the region’s population. These were chosen for the unique diversity of the ESs in these locations (Figure 1). The study areas have a high level of ecosystem homogeneity including common climate conditions, biodiversity coverage, and natural features (e.g., waterfalls, mountains, dunes) as well as living standards. A total of 296 samples were randomly selected and equally distributed among the residents in the study areas, which represents 36% of the total households. The random selection process targeted respondents from different backgrounds and ages, without any biases in terms of the profile selection of the studied samples. Data were collected between December 2019 and January 2020 using a structured questionnaire designed to reflect the respondents’ perceptions on ecotourism described as potential CESs. The question topics were chosen following sets of meetings with ten key persons in the Wadi Araba region; the key persons were nominated based on their professions and relations to the community. Throughout these meetings, the residents were unfamiliar with the “Ecosystem Services” concept, which influenced the questionnaire type and structure. Then, the questionnaire was pre-tested by interviewing 8 people and was slightly modified accordingly regarding specific topics. Later, the field researchers were trained for two days on the different sections of the questionnaire. . The questionnaire was composed of five parts to collect the information and opinions of respondents on the ESs of Wadi Araba region. The first part covered the demographic information of the respondents, such as gender, age, education, occupation, income, and family size. The second part was focused on residents’ benefits and interaction with the surrounding ecosystem, such as animal production, grazing, agriculture, vegetation cover, and water-provisioning, as well as focused about the respondents’ perceptions about different cultural services such as hiking, camping, photography, climbing mountains, biking, bird watching, visiting historic sites/museums, etc. During the data collection process, the study participants were prompted to individually indicate CES by drawing dots on a geo-referenced landscape map of the areas they use as presumed CES. SPSS computer (version IBM 20) program was used for data entry. Quantitative techniques were used to assess ecosystem services’ types and utilities according to respondents’ perceptions and evaluations. Through the questionnaire, respondents were most of the time asked open-ended questions and close-ended questions which are noticed as most of the results are represented by frequencies, mean, and standard deviation. In other questions, respondents were asked to rate their perceptions and satisfaction with ecotourism within Wadi Araba. We asked the respondents to rank the importance of ecotourism activities within Wadi Araba and rank the importance of the local products handmade by the local community and which characterize the study area. The rating was conducted on a 10-point scale, of which 1 is not important, and 10 is extremely important. In addition, respondents were asked to express their satisfaction with ecotourism’s contribution to the region using the scale of strongly agree, agree, disagree, and strongly disagree.
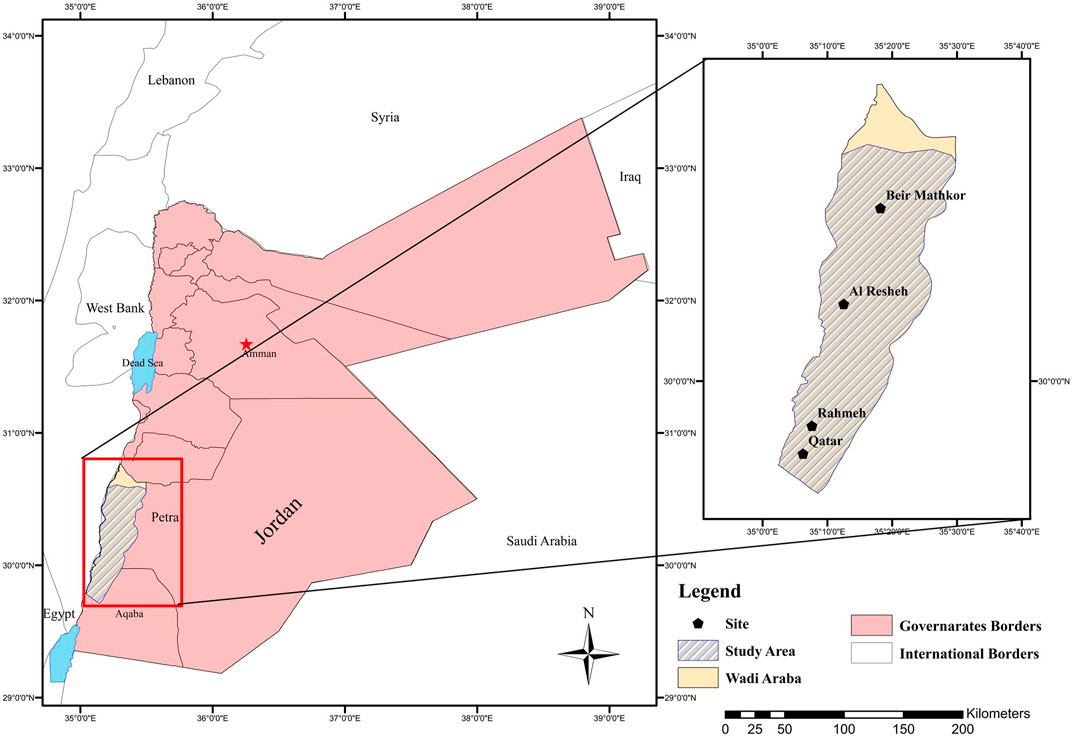
FIGURE 1. Map of the study area in the southern region of Wadi Araba. Source: NARC 2020.
A total of 138 coordinate points collected from the survey were projected into ArcGIS Desktop software ver. 10.6. Then, the projected social value coordinate points were transferred into the Arc GIS geodatabase. After summarizing the descriptive statistics, including the number of CES points mapped in the study area and the number of respondents who mentioned each CES as important. We next used a Chi-square test to identify significant differences regarding the numbers of respondents with certain socio-demographic characteristics who identified the various CES as important and valuable. Since the 138 CES points fell within proximity of one another, the coordinated points were combined using the ‘Collect Event’ tool before performing the hot-spot analysis to consolidate all of the CES events in the same geographical location with the new point feature class “ICOUNT”, which was then introduced as an input feature for the hot-spot analysis tools (Singh et al., 2021).
The hot-spot analysis tools used to determine the concentration of events within a limited geographical area and to evaluate spatiotemporal patterns in CES in Wadi Araba were 1) kernel density estimation (KDE), inverse distance weight (IDW), and 3) the Getis-Ord (Gi*) statistic. KDE is a quadratic kernel function (Silverman, 2018) used to identify the location and degree of spatial clustering of ecosystem hot-spot services; it classifies the density of areas based on the total count of the frequency of geographical events over time around each raster cell output where only a circular neighborhood can create a smooth, continuous surface map to each point with a gradient of variation in the intensity of each event across the study areas without being limited by thematic boundaries (Silverman, 2018). KDE has been widely used to characterize and analyze spatial trends generated by landscape features and the ecological connections or effects on the surrounding environment (Naidoo et al., 2008; Raymond et al., 2009; Sherrouse et al., 2011).
The IDW interpolation method estimates values by hot-spot analysis surrounding the targeted area (Besag and Newell, 1991). IDW takes the distance between the targeted points and the sample points as the weighted average; the closer the sample points to the targeted points, the greater the weight given to the sample points. The values closest to the targeted location have more influence on the targeted value than those farther away (Besag and Newell, 1991; Burrough et al., 2015). The Getis–Ord (Gi*) statistic is a hot-spot analysis developed by Getis and Ord to identify statistically distinct spatial clusters of high value (hot-spots) and low value (cold spots). It also identifies the location and degree of spatial clustering among ESs to determine whether identifiable spatial patterns exist (Ord and Getis, 1995). This tool creates a new Output Feature Class with a z-score, p-value, and confidence level bin (Gi_Bin) for each feature in the Input Feature Class. The Getis–Ord (Gi*) statistic is widely used to identify statistically significant high- and low-value spatial clusters (hot and cold spots, respectively) at the local level (Getis and Ord, 2010).
Recreation and ecotourism are among the most distinguished services in Wadi Araba (Sagie et al., 2013). Thus, this study was designed to provide detailed information about these touristic activities using a participatory approach. Participants’ demographic characteristics are described in our previous publication (Al-Assaf et al., 2021) and are listed in (Table 1). The generated maps are based on the respondents who considered Wadi Araba to be a high tourist attraction area and the participatory approach, where 65.9% of the respondents confirmed that local and foreigner tourists frequently visit the region in September and October when the weather conditions are the most comfortable.
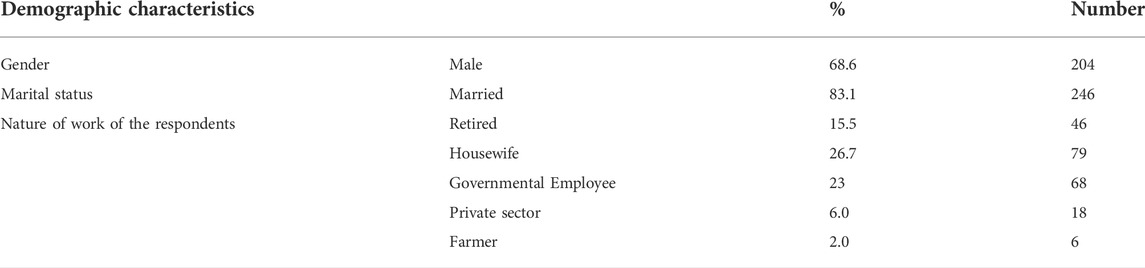
TABLE 1. Demographic information of the study sample with permission of (Al-Assaf et al., 2021).
Despite the importance of the measured CESs in Wadi Araba, the respondents rarely engage in most of these activities except for hiking (81.1%), walking (71.3%), and visiting the dunes (66.2%). While the other CESs and activities were less frequently enjoyed by local residents, they were still regarded as important for locals and visitors; these activities/services include bird watching, hunting, photography, biking, and mountain climbing. These CES’s provide the local community with additional knowledge of the desert environment and allow them to gain the experience required to be tour guides in the region (Figure 2).
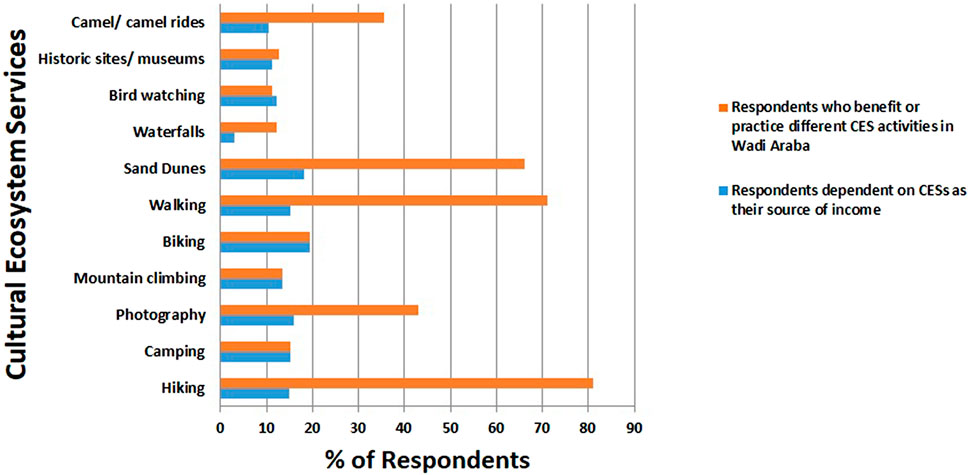
FIGURE 2. Percentage (%) of respondents who benefit or practice different CES activities in Wadi ArabaPercentage (%) of respondents dependent on CESs as their source of income.
Regardless of the diversity of the ES in this region, most of the respondents expressed that these activities are not related to their primary source of income (Figure 2). Several CESs (e.g., sand dunes, biking, photography, mountain climbing, hiking, and camping) proved to be the greatest contributors to the residents’ livelihoods; specifically, the sand dunes (18.2%) and biking (19.3%) were the services most frequently acknowledged by the respondents (Figure 2). However, they pointed out that the direction of change of these activities was mostly increased except for waterfalls, which decreased by 3.6% likely in response to changes in water availability from multiple sources within the study area.
The distribution of CESs according to sites as reported by the respondents is presented in Figure 3. They allocated the most sites to hiking (71 sites), camping, photography, and walking (70 sites). Meanwhile, 53, 52, and 49 sites were attributed to bird watching, mountain climbing, and hunting, respectively. Moreover, 42 and 41 sites were identified for sand dunes and camelback riding. The lowest site numbers were associated with historical locations (25 sites), biking (22 sites), and waterfalls (21 sites).
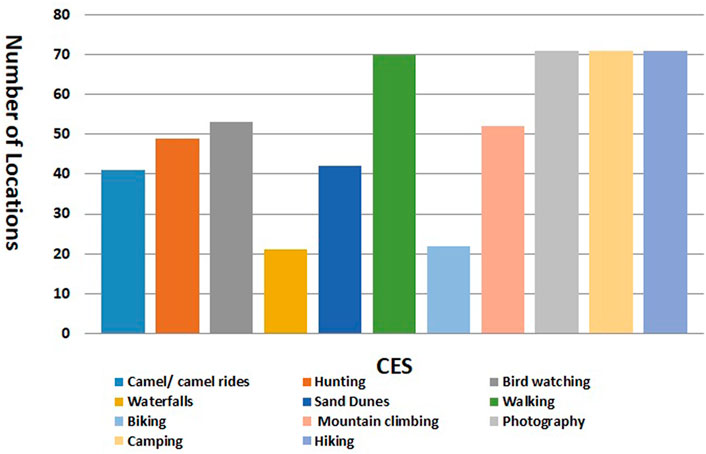
FIGURE 3. Distribution of CESs locations among ecotourism activities according to the respondents.
Most of the Wadi Araba residents included in the present study reported an absence of local tourism products or brands specifically characteristic of the region. The few who reported that such items do exist cited carpets (rugs), precious stones, colored sand, wooden products, and palm fonds as examples. However, among these, carpets and palm fonds are the only ones abundantly available. Even though the respondents were not involved in the production or manufacture of these tourism products, they sell them to tourists to supplement their primary source of income. Moreover, the Wadi Araba residents reported that tourists frequently visit the region for medicinal purposes, especially to collect wild plants for traditional healing remedies (herbal medicine). Collectively, the respondents referenced 26 different wild plants collected by visitors to the Wadi Arab area including Cleome droserifolia (Al Moshta) (21.4%), Artemisia Judaica (Ba’ethran) (16%), and Teucrium (Ja’adeh) (12.8%). Since the locals of the Wadi Araba area are nomads and practice hunting as a traditional activity, hunting is considered a notable activity that draws tourists to the region (51.4%), even though Wadi Araba is not distinguished by a certain type of animal (59.1%). The respondents mentioned 14 types of wild animals and birds attributed to the area, the most popular of which being wild oryx (23.9%), Chlamydotis Al Habari (21.3%), and wild rabbits (12.6%). The local residents reported hunting mostly for personal consumption (36.8%) rather than selling (2.4%). Importantly, hunting is affecting the biodiversity within Wadi Araba, as indicated by most of the respondents observing a negative impact on the number of wild animals in the past 5 years (55.7%). The other reasons posited for the decreased number of wild animals in the area reported by 48.7% of the respondents were the drought (17.1%) and a lack of pastures (13.4%).
The CES hot-spot maps generated using the KDE method is illustrated in Figure 4. For each study area, the derived maps indicate that the CESs were not randomly distributed but, rather, aggregated into clusters and that the hot-spots were homogeneously distributed within the CESs. Only around 9% (156 of 1,600 km2) of the study area was found to contain hot-spots with a high capacity to provide ecotourism and recreation value, as expected of CESs. The hottest spots in the Wadi Araba region tended to increase from south to north from the center of Wadi Araba. Most of the CESs reported by the respondents were located at the edges of residential areas and villages. Most of the hot-spots were allocated to the center of the study area, which has unique geography and topography. The development of the residential areas seemed to positively contribute to CESs with more total services aggregated within or close to villages. The cold spots were allocated to the east and west of the study area and are surrounded by high, steep mountains that are hard to climb and extend to the Dead Sea-Aqaba main highway and the Israeli border, an area restricted to both locals and tourists. In contrast, CES hot-spots were reported near more accessible mountains where hiking, climbing, and collecting local medicinal herbs are more feasible and readily accessible.
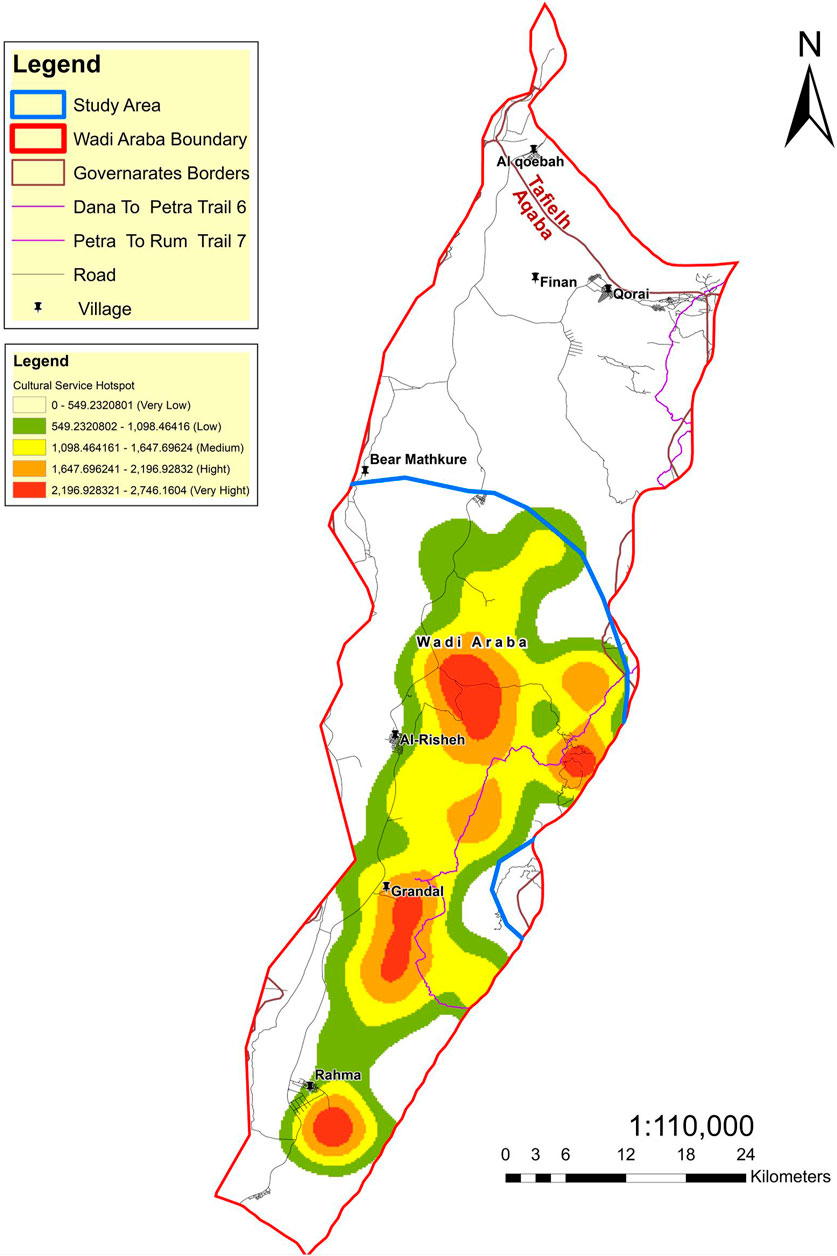
FIGURE 4. CES map constructed using the field survey information provided by the participants as hot -spots, using KDEs for point features. The point densities decrease from red (hot-spots) to orange, then yellow, and green (cold spots).
The hot-spot analysis results were spatially joined using a zonal statistics tool after IDW interpolation to reveal a statistical significance of the hot-spots. The hot-spot analysis calculation based on Getis-Ord Gi* statistics identified hot and cold spots among the CESs (Figure 5). Selecting the areas with the highest z-scores (i.e., the two highest confidence intervals with p = 99% and p = 95%) showed that the most significant hot-spots were located in the southern portion of the study area. These analyses also revealed a congregation of CESs areas in the center of the south of the study area. These CES hot-spots covered 41.7% of the Wadi Araba area included in this study (Figure 5). These areas contain many unique ecological features (e.g., sand dunes, medicinal plants, hiking trails, wild animals for hunting, scenic views, climbing tracks, and historical sites), as depicted in Figure 5. Despite the availability of nature-based attractions in the hot-spot-dense areas, these are not extensively utilized due to accessibility barriers and a lack of infrastructure. As such, these sites have a high potential for development in future years. Cold spot areas, on the contrary, were found to cover 38.5% of Wadi Araba, primarily in the northern portion of the study area. When considering only the core hot-spots (Getis-Ord-Gi* values equal to p = 0.01), the percentage coverage of Wadi Araba areas highly delivering CESs decreased by approximately 19.6% compared with the total hot-spot classification using the Getis-Ord Gi* approach. The relative proportions (%) of the areas covered by Gi* hot and cold spots are summarized in Table 2.

FIGURE 5. Hot-spot and coldspots analysis with different confidence levels using (A). IDW interpolation and (B). Getis-Ord Gi* maps Hotspots and coldspots (The blue and the red color gradient indicate hotspots or coldspots are significant at 99 and 95% level respectively while the yellow color is not significant).
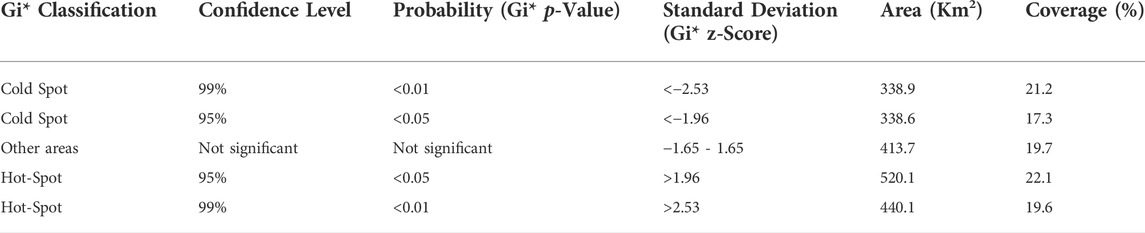
TABLE 2. Hot-spot classification according to Getis-Ord Gi* statistics and coverage percentage of each Gi* hot-spot.
Arid areas around the globe are relatively lacking in provisioning ESs despite having an abundance of CESs (Sagie et al., 2013). The demand for CESs is growing in industrialized societies (Guo et al., 2010) and these services have great potential to secure public support for protecting ecosystems (Guo et al., 2010; Weiler et al., 2013; Wolff et al., 2015). From a socio-ecological perspective, ecotourism and recreation are tightly coupled with the perception of the supply of and demand for CESs (Ruskule et al., 2018). The interrelated relationship between tourism and recreation derived from nature and society mutual influences each other (Mehring et al., 2017). Our results demonstrate that the Wadi Araba desert provides over 12 ecotourism practices that represent rich CESs. Local community members highlighted CESs that has been mentioned in other studies on arid landscapes (Figure 2) (Taylor et al., 2017; Cerda et al., 2018) In our previous study, the respondents emphasized the importance of these services for Wadi Arab with the average importance for all measured services ranging from 6 to 8 out of 10 (Al-Assaf et al., 2021). The dunes were rated by this sample population to be the most important activity in the region followed by hiking and camping (Al-Assaf et al., 2021). Respondents emphasized that CESs are products of both landscape diversity and biodiversity (Sagie et al., 2013). Surprisingly, ecotourism was less recognized by the respondents, with only 38.2% stating that eco-ecotourism could greatly benefit Wadi Araba and ecotourism need not focus only on wildlife and scenic landscapes but should also feature the elements related to Bedouin culture (Sagie et al., 2013; Al-Assaf et al., 2021).
The CES literature is mostly comprised of spatially explicit studies and information concerning human-environment interactions such as green space, (bio)diversity, and recreational infrastructure. A limited amount of documentation and information exists on how a specific landscape and its associated features and ecosystem properties contribute to public perception. Hence, nature protection planning and management programs are negatively affected in terms of deriving the benefits of the landscape (Scholte et al., 2015) due to the limited resources and bad implication of these programs. In addition to a theoretical understanding regarding the extent of CESs’ spatial overlap (i.e., CES hot spots), the findings described here have important practical implications for land use and conservation.
When financial resources are limited, it is vital to allocate hotspots and coldspots locations to help set priorities for maintaining essential ES (Braat and de Groot, 2012; Brown et al., 2012; Crossman et al., 2012). The KDE results in conjunction with the Getis-Ord Gi* statistics used to distinguish more clearly the hot-spot from the coldspot areas. While the KDE provides a visual representation of the hot-spots, hot-spot analysis (Getis-Ord Gi*) identifies statistically significant hot-spots using numerical values (i.e., Getis-Ord Gi* statistic) (Braithwaite and Li, 2007). Most of the residents located hot-spots within or close to their villages, which are in the midst of ongoing development processes (Figure 4). The perception of residents of CES value is influenced by their distance to residential areas, the frequency of use, and their accessibility (Jaligot et al., 2019). Our results are in line with Wang et al. (2021) who found that the residential development process contributes positively to CESs (Wang et al., 2021). CESs hot spot mapping is an essential elements in the management and protection of cultural landscapes. Generally the hotspots are over represented in comparison to the coldspots. We recommend a future place-based environmental resource research incorporate more survey methodologies to ensure respondent rates are more proportional to overcome the bias. To avoid future damages, CES hotspots should get the priority of being conserved; while for the CES coldspots, targeted measures should be taken to improve the severe status quo by analysing and sorting out local drivers of CES conflicts and degeneration (Jiang et al., 2013).
Maps that spatially visualize cultural hot-spots encourage stakeholders and managers to promote and enhance the CESs of specific sites in the study area. The act of bringing stakeholder knowledge to the consciousness of decision-makers is now a cornerstone of the sustainability paradigm (Haberl et al., 2006) of developing more effective, socially-acceptable policies and assuring social equity (Wilson and Howarth, 2002). Stakeholder input is indeed a central tenet of sustainable management theory and should be put into practice whenever possible (Clark and Clark, 2002). Without stakeholder involvement and consultation, decision-makers cannot prioritize management decisions that align with the expressed needs of the public. Areas with low CES densities, in turn, motivate planners to pay special attention to the economics and priority of the ecological objectives of these sites. The residents’ perceptions of the CESs from an arid environment will grow if the tourism facilities grow and create jobs in the tourism industry (Dou et al., 2020).
Based on this preliminary research, we believe that the importance of CESs in arid regions, for example, are underestimated or missed entirely in ecological or economic assessments, despite being the most obvious and prominent ESs in social assessments (Sagie et al., 2013; Orenstein and Groner, 2015); therefore, it seemed crucial to map these services. The Wadi Araba Development Company will start to establish an integrated industrial development zone in Al-Risha (cold spot), a poor CES area. This new industrial zone will be based on light food processing industries. According to the company’s studies, this region is on the cusp of agricultural, industrial, water, and tourism development that will actualize the short- and long-term goals of Wadi Araba and Jordan. The residents of the area investigated in the current study do not object to any of the development plans in the region, as long as these plans consider the local community’s privacy, their traditional way of life and offer them jobs. Rationally, the respondents are being willing to contribute to the constant flow of CESs which agree with the finding of (Sagie et al., 2013; Orenstein and Groner, 2015) who reported that locals of the Wadi Araba exhibits a high affinity to the desert landscape, its mountains, and open spaces. Providing this information to policymakers would relay the individual determination to restore and sustain ecosystem services. Neglecting cultural values, practices, and services decreases the likelihood of successfully implementing development plans (Chan et al., 2012b). Using CES maps will help to pinpoint benchmarks with which to assess the long-term provisions of selected CESs under different development scenarios (Alcamo et al., 2005), which incorporates both national and local factors. ES maps can serve as baseline measures of CES provisions that can change based on the parameters of each development scenario. The national and local factors are analogous to indicators employed by Weinger et al. (2010) that consider the potential of various changes in local land use and their impact on ES provisions (Wainger et al., 2010). It is also important to create protected areas in the region to preserve the hot and cold-spot regions. Protected areas are often more likely to provide cultural and other ESs than non-protected areas (Dudley et al., 2014; Eastwood et al., 2016).
CES’s were mostly appreciated by the residents of the Wadi Araba region compared to other visitors of the region. The respondents reported their willingness to contribute to the constant flow of CESs. This information can serve to inform policymakers of their constituents’ determination to restore and sustain CESs. This study also demonstrates that even the harsh, dry environment of Wadi Araba is still valued among its residents. The estimated conservation value will be useful for future public policy decision-making and assist with the inclusion of ES principles in the development and implementation of these policies. Moreover, this study highlights the importance of engaging the beneficiaries and stakeholders in meaningful dialogues concerning arid ecosystem management; as such, participatory management strategies are optimal for the sustainable utilization of Wadi Araba resources. The CES maps generated using the data collected in this study provide baseline measures of CES provisions that are subject to change according to the parameters of each development scenario.
• These CES maps represent a promising means of assuring optimal land-use decision-making. Furthermore, our results enable managers to isolate and target specific individual CESs in their planning processes, which is important given that specific CESs may require more definite actions. For example, improving access to historical sites could serve to promote ‘social relations’, whereas improving the accessibility of open and blue spaces might enhance ‘inspiration’.
• The Wadi Araba area lacks the infrastructure and accessibility required to support CES hot-spots despite the richness of their nature-based attractions. Hence, these areas are neither extensively enjoyed by local residents nor sources of valuable ecotourism.
• Improving accessibility is the most essential factor in the development of tourism and recreation-related CESs since it would allow people to freely and easily benefit from these enriching ESs (Paracchini et al., 2014).
The raw data supporting the conclusions of this article will be made available by the authors, without undue reservation.
AA, AA-A, AS, KK, and NH performed the conceptualization and the methodology; WH, AH, RK, SA, MD, JA, and GA performed data collection and curation; WH and LN performed data entry; WH and KK processed the data; AA, AA-A, AS, and KK prepared the original draft; AA, AS, AA-A, and MT wrote and edited the paper; NH supervised and funded the APC; KK analyzed the data and AA and NH managed the project. All authors have read and agreed to publish a version of the manuscript.
This research was funded by USAID (M32-044), and the APC was funded by National Agricultural Research Center (NARC).
The authors would like to thank the local community in Wadi Araba for sharing their time and information.
The authors declare that the research was conducted in the absence of any commercial or financial relationships that could be construed as a potential conflict of interest.
All claims expressed in this article are solely those of the authors and do not necessarily represent those of their affiliated organizations, or those of the publisher, the editors and the reviewers. Any product that may be evaluated in this article, or claim that may be made by its manufacturer, is not guaranteed or endorsed by the publisher.
The Supplementary Material for this article can be found online at: https://www.frontiersin.org/articles/10.3389/fenvs.2022.866309/full#supplementary-material
Al-Assaf, A., Albalawneh, A., Majdalawi, M., Nowar, L. A., Kabariti, R., Hjazin, A., et al. (2021). Local communities’ willingness to accept compensation for sustainable ecosystem management in Wadi Araba. South Jordan 13 (9), 5190.
Al-assaf, A., Nawash, O., and Omari, M. (2014). Identifying forest ecosystem services through socio-ecological bundles: A case study from northern Jordan. Int. J. Sustain. Dev. World Ecol. 21 (4), 314–321. doi:10.1080/13504509.2014.919968
Al-Assaf, A. A., Al-Asmar, Y. Y., Johnsen-Harris, B. D., and Al-Raggad, M. M. (2016). Spatial mapping of the social value of forest services: A case study of northern Jordan. J. Sustain. For. 35 (7), 469–485. doi:10.1080/10549811.2016.1212381
Alassaf, A., Alhunaiti, D., Dick, J., and Al-Adwan, T. (2014). Differences in perceptions, attitudes, and use of ecosystem services among diverse communities in an arid region: A case study from the south of Jordan. J. Hum. Ecol. 45 (2), 157–165. doi:10.1080/09709274.2014.11906689
Alcamo, J., Van Vuuren, D., Cramer, W., Alder, J., Bennett, E., Carpenter, S., et al. (2005). Changes in ecosystem services and their drivers across the scenarios. Ecosyst. Hum. well-being 2, 297–373.
Andersson, E., Tengö, M., McPhearson, T., and Kremer, P. (2015). Cultural ecosystem services as a gateway for improving urban sustainability. Ecosyst. Serv. 12, 165–168. doi:10.1016/j.ecoser.2014.08.002
Besag, J., and Newell, J. (1991). The detection of clusters in rare diseases. J. R. Stat. Soc. Ser. A 154 (1), 143–155. doi:10.2307/2982708
Bieling, C., Plieninger, T., Pirker, H., and Vogl, C. R. (2014). Linkages between landscapes and human well-being: An empirical exploration with short interviews. Ecol. Econ. 105, 19–30. doi:10.1016/j.ecolecon.2014.05.013
Braat, L. C., and de Groot, R. (2012). The ecosystem services agenda:bridging the worlds of natural science and economics, conservation and development, and public and private policy. Ecosyst. Serv. 1 (1), 4–15. doi:10.1016/j.ecoser.2012.07.011
Braithwaite, A., and Li, Q. (2007). Transnational terrorism hot spots: Identification and impact evaluation. Confl. Manag. Peace Sci. 24 (4), 281–296.
Brown, G., Montag, J. M., and Lyon, K. (2012). Public participation GIS: A method for identifying ecosystem services. Soc. Nat. Resour. 25 (7), 633–651. doi:10.1080/08941920.2011.621511
Brown, G., and Raymond, C. (2007). The relationship between place attachment and landscape values: Toward mapping place attachment. Appl. Geogr. 27 (2), 89–111. doi:10.1016/j.apgeog.2006.11.002
Brown, G., and Weber, D. (2013). A place-based approach to conservation management using public participation GIS (PPGIS). J. Environ. Plan. Manag. 56 (4), 455–473. doi:10.1080/09640568.2012.685628
Burrough, P. A., McDonnell, R. A., and Lloyd, C. D. (2015). Principles of geographical information systems. Oxford University Press.
Carpenter, S. R., Mooney, H. A., Agard, J., Capistrano, D., DeFries, R. S., Díaz, S., et al. (2009). Science for managing ecosystem services: Beyond the Millennium Ecosystem Assessment. Proc. Natl. Acad. Sci. U. S. A. 106 (5), 1305–1312. doi:10.1073/pnas.0808772106
Cerda, C., Fuentes, J. P., De La Maza, C. L., Louit, C., and Araos, A. N. A. (2018). Assessing visitors’ preferences for ecosystem features in a desert biodiversity hotspot. Environ. Conserv. 45 (1), 75–82. doi:10.1017/s0376892917000200
Chan, K. M. A., Guerry, A. D., Balvanera, P., Klain, S., Satterfield, T., Basurto, X., et al. (2012). Where are cultural and social in ecosystem services? A framework for constructive engagement. BioScience 62 (8), 744–756. doi:10.1525/bio.2012.62.8.7
Chan, K. M. A., Satterfield, T., and Goldstein, J. (2012). Rethinking ecosystem services to better address and navigate cultural values. Ecol. Econ. 74, 8–18. doi:10.1016/j.ecolecon.2011.11.011
Chaudhary, S., McGregor, A., Houston, D., and Chettri, N. (2015). The evolution of ecosystem services: A time series and discourse-centered analysis. Environ. Sci. Policy 54, 25–34. doi:10.1016/j.envsci.2015.04.025
Cheung, L. T. O., and Jim, C. Y. (2013). Ecotourism service preference and management in Hong Kong. Int. J. Sustain. Dev. World Ecol. 20 (2), 182–194. doi:10.1080/13504509.2013.775192
Clark, T. W., and Clark, S. G. (2002). The policy process: A practical guide for natural resources professionals. Yale University Press.
Cowling, R. M., Egoh, B., Knight, A. T., O'Farrell, P. J., Reyers, B., Rouget, M., et al. (2008). An operational model for mainstreaming ecosystem services for implementation. Proc. Natl. Acad. Sci. U. S. A. 105 (28), 9483–9488. doi:10.1073/pnas.0706559105
Crossman, N. D., Burkhard, B., and Nedkov, S. (2012). Quantifying and mapping ecosystem services. Int. J. Biodivers. Sci. Ecosyst. Serv. Manag. 8 (1-2), 1–4. doi:10.1080/21513732.2012.695229
Davidson, M. D. (2013). On the relation between ecosystem services, intrinsic value, existence value and economic valuation. Ecol. Econ. 95, 171–177. doi:10.1016/j.ecolecon.2013.09.002
de Groot, R. S., Wilson, M. A., and Boumans, R. M. J. (2002). A typology for the classification, description and valuation of ecosystem functions, goods and services. Ecol. Econ. 41 (3), 393–408. doi:10.1016/s0921-8009(02)00089-7
Dou, Y., Yu, X., Bakker, M., De Groot, R., Carsjens, G. J., Duan, H., et al. (2020). Analysis of the relationship between cross-cultural perceptions of landscapes and cultural ecosystem services in Genheyuan region, Northeast China. Ecosyst. Serv. 43, 101112. doi:10.1016/j.ecoser.2020.101112
Dudley, N., MacKinnon, K., and Stolton, S. (2014). The role of protected areas in supplying ten critical ecosystem services in drylands: A review. Biodiversity 15 (2-3), 178–184. doi:10.1080/14888386.2014.928790
Eastwood, A., Brooker, R., Irvine, R. J., Artz, R. R. E., Norton, L. R., Bullock, J. M., et al. (2016). Does nature conservation enhance ecosystem services delivery? Ecosyst. Serv. 17, 152–162. doi:10.1016/j.ecoser.2015.12.001
El-Naqa, A., Hammouri, N., Ibrahim, K., and Al-Taj, M. (2010). Integrated approach for groundwater exploration in Wadi Araba using remote sensing and GIS. Jordan J. Civ. Eng. 3.
Getis, A., and Ord, J. K. (2010). The analysis of spatial association by use of distance statistics. Perspectives on spatial data analysis. Springer, 127–145.
Guo, Z., Zhang, L., and Li, Y. (2010). Increased dependence of humans on ecosystem services and biodiversity. PLOS ONE 5 (10), e13113. doi:10.1371/journal.pone.0013113
Haberl, H., Winiwarter, V., Andersson, K., Ayres, R. U., Boone, C., Castillo, A., et al. (2006). From LTER to LTSER: Conceptualizing the socioeconomic dimension of long-term socioecological research. Ecol. Soc. Nat. Resour. 11 (2).
Haines-Young, R., and Potschin, M. (2011). Common international classification of ecosystem services (CICES): 2011 update. Nottingham: Report to the European Environmental Agency.
Helliwell, D. R. (1969). Valuation of wildlife resources. Reg. Stud. 3 (1), 41–47. doi:10.1080/09595236900185051
Hernández-Morcillo, M., Plieninger, T., and Bieling, C. (2013). An empirical review of cultural ecosystem service indicators. Ecol. Indic. 29, 434–444. doi:10.1016/j.ecolind.2013.01.013
Hirons, M., Comberti, C., and Dunford, R. (2016). Valuing cultural ecosystem services. Annu. Rev. Environ. Resour. 41 (1), 545–574. doi:10.1146/annurev-environ-110615-085831
Jaligot, R., Hasler, S., and Chenal, J. (2019). National assessment of cultural ecosystem services: Participatory mapping in Switzerland. Ambio 48 (10), 1219–1233. doi:10.1007/s13280-018-1138-4
Jiang, M., Bullock, J. M., and Hooftman, D. A. (2013). Mapping ecosystem service and biodiversity changes over 70 years in a rural E nglish county. J. Appl. Ecol. 50 (4), 841–850. doi:10.1111/1365-2664.12093
King, R. T. (1966). Wildlife and man. New York Conservationist. Editors I. A. Bailey, W. Elder, and McKinney 20 (6), 8–11.
Leemans, R., and De Groot, R. (2003). Millennium ecosystem Assessment: Ecosystems and human well-being: A framework for assessment.
Leyshon, C. (2014). Cultural ecosystem services and the challenge for cultural geography. Geogr. Compass 8 (10), 710–725. doi:10.1111/gec3.12160
Li, Y., Zhang, L., Yan, J., Wang, P., Hu, N., Cheng, W., et al. (2017). Mapping the hotspots and coldspots of ecosystem services in conservation priority setting. J. Geogr. Sci. 27 (6), 681–696. doi:10.1007/s11442-017-1400-x
Martín-López, B., Gómez-Baggethun, E., García-Llorente, M., and Montes, C. (2014). Trade-offs across value-domains in ecosystem services assessment. Ecol. Indic. 37, 220–228. doi:10.1016/j.ecolind.2013.03.003
Martín-López, B., Iniesta-Arandia, I., García-Llorente, M., Palomo, I., Casado-Arzuaga, I., Amo, D. G. D., et al. (2012). Uncovering ecosystem service bundles through social preferences. PLOS ONE 7 (6), e38970. doi:10.1371/journal.pone.0038970
Millennium ecosystem assessment, M. E. A. (2005). Ecosystems and human well-being 5, 563. Washington, DC: Island press.
Mehring, M., Zajonz, U., and Hummel, D. (2017). Social-ecological dynamics of ecosystem services: Livelihoods and the functional relation between ecosystem service supply and demand—evidence from socotra archipelago, Yemen and the sahel region, west africa. Sustainability 9 (7), 1037. doi:10.3390/su9071037
Milcu, A. I., Hanspach, J., Abson, D., and Fischer, J. (2013). Cultural ecosystem services A literature review and prospects for future research. Ecol. Soc. 18 (3).
Naidoo, R., Balmford, A., Costanza, R., Fisher, B., Green, R. E., Lehner, B., et al. (2008). Global mapping of ecosystem services and conservation priorities. Proc. Natl. Acad. Sci. U. S. A. 105 (28), 9495–9500. doi:10.1073/pnas.0707823105
Nawash, O., and Al-Horani, A. S. (2011). The most important medicinal plants in Wadi Araba desert in south west Jordan: A review article. Adv. Environ. Biol. 5, 418–425.
Ord, J. K., and Getis, A. (1995). Local spatial autocorrelation statistics: Distributional issues and an application. Geogr. Anal. 27 (4), 286–306. doi:10.1111/j.1538-4632.1995.tb00912.x
Orenstein, D. E., and Groner, E. (2015). “Using the ecosystem services framework in a long-term socio-ecological research (LTSER) platform: Lessons from the Wadi Araba desert, Israel and Jordan,” in Earth stewardship (Springer), 281–296.
Paracchini, M. L., Zulian, G., Kopperoinen, L., Maes, J., Schägner, J. P., Termansen, M., et al. (2014). Mapping cultural ecosystem services: A framework to assess the potential for outdoor recreation across the eu. Ecol. Indic. 45, 371–385. doi:10.1016/j.ecolind.2014.04.018
Plieninger, T., Dijks, S., Oteros-Rozas, E., and Bieling, C. (2013). Assessing, mapping, and quantifying cultural ecosystem services at community level. Land Use Policy 33, 118–129. doi:10.1016/j.landusepol.2012.12.013
Plieninger, T., Kizos, T., Bieling, C., Le Dû-Blayo, L., Budniok, M-A., Bürgi, M., et al. (2015). Exploring ecosystem-change and society through a landscape lens: Recent progress in European landscape research. Ecol. Soc. 20 (2), art5. doi:10.5751/es-07443-200205
Raymond, C. M., Bryan, B. A., MacDonald, D. H., Cast, A., Strathearn, S., Grandgirard, A., et al. (2009). Mapping community values for natural capital and ecosystem services. Ecol. Econ. 68 (5), 1301–1315. doi:10.1016/j.ecolecon.2008.12.006
Ruskule, A., Klepers, A., and Veidemane, K. (2018). Mapping and assessment of cultural ecosystem services of Latvian coastal areas. One Ecosyst. 3, e25499. doi:10.3897/oneeco.3.e25499
Sagie, H., Morris, A., Rofè, Y., Orenstein, D. E., and Groner, E. (2013). Cross-cultural perceptions of ecosystem services: A social inquiry on both sides of the Israeli–Jordanian border of the southern Arava valley desert. J. Arid Environ. 97, 38–48. doi:10.1016/j.jaridenv.2013.05.007
Satz, D., Gould, R. K., Chan, K. M. A., Guerry, A., Norton, B., Satterfield, T., et al. (2013). The challenges of incorporating cultural ecosystem services into environmental assessment. Ambio 42 (6), 675–684. doi:10.1007/s13280-013-0386-6
Scholte, S. S. K., van Teeffelen, A. J. A., and Verburg, P. H. (2015). Integrating socio-cultural perspectives into ecosystem service valuation: A review of concepts and methods. Ecol. Econ. 114, 67–78. doi:10.1016/j.ecolecon.2015.03.007
Schröter, M., and Remme, R. P. (2016). Spatial prioritisation for conserving ecosystem services: Comparing hotspots with heuristic optimisation. Landsc. Ecol. 31, 431–450. doi:10.1007/s10980-015-0258-5
Sherrouse, B. C., Clement, J. M., and Semmens, D. J. (2011). A GIS application for assessing, mapping, and quantifying the social values of ecosystem services. Appl. Geogr. 31 (2), 748–760. doi:10.1016/j.apgeog.2010.08.002
Shishany, S., Al-Assaf, A. A., Majdalawi, M., Tabieh, M., and Tadros, M. (2020). Factors influencing local communities relational values to forest protected areas in Jordan. J. Sustain. For. [ahead of print], 1–19. doi:10.1080/10549811.2020.1847665
Singh, P. P., Sabnani, C. S., and Kapse, V. S. (2021). Hotspot analysis of structure fires in urban agglomeration: A case of nagpur city, India. Fire 4 (3), 38. doi:10.3390/fire4030038
Tallis, H., Ricketts, T. H., Daily, G. C., and Polasky, S. (2011). Natural capital: Theory and practice of mapping ecosystem services. Oxford University Press.
Taylor, N. T., Davis, K. M., Abad, H., McClung, M. R., and Moran, M. D. (2017). Ecosystem services of the big bend region of the chihuahuan desert. Ecosyst. Serv. 27, 48–57. doi:10.1016/j.ecoser.2017.07.017
Wainger, L. A., King, D. M., Mack, R. N., Price, E. W., and Maslin, T. (2010). Can the concept of ecosystem services be practically applied to improve natural resource management decisions? Ecol. Econ. 69 (5), 978–987. doi:10.1016/j.ecolecon.2009.12.011
Wallace, K. J. (2007). Classification of ecosystem services: Problems and solutions. Biol. Conserv. 139 (3), 235–246. doi:10.1016/j.biocon.2007.07.015
Wang, Z., Xu, M., Lin, H., Qureshi, S., Cao, A., and Ma, Y. (2021). Understanding the dynamics and factors affecting cultural ecosystem services during urbanization through spatial pattern analysis and a mixed-methods approach. J. Clean. Prod. 279, 123422. doi:10.1016/j.jclepro.2020.123422
Weiler, B., Moore, S. A., and Moyle, B. D. (2013). Building and sustaining support for national parks in the 21st century: Why and how to save the national park experience from extinction. J. Park Recreat. Adm. 31 (2), 110–126.
Wilson, M. A., and Howarth, R. B. (2002). Discourse-based valuation of ecosystem services: Establishing fair outcomes through group deliberation. Ecol. Econ. 41, 431–443. doi:10.1016/s0921-8009(02)00092-7
Keywords: cultural ecosystem services, human ecology, spatial analysis., ecosystem services, arid and semiarid ecosystems
Citation: Albalawneh A, Al-Assaf A, Sweity A, Hammour WA, Kloub K, Hjazin A, Kabariti R, Abu Nowar L, Tadros MJ, Aljaafreh S, Diab M, Alwidyan J, Albashbsheh G and Haddad N (2022) Mapping cultural ecosystem services in the hyper arid environment of south of Jordan. Front. Environ. Sci. 10:866309. doi: 10.3389/fenvs.2022.866309
Received: 31 January 2022; Accepted: 31 August 2022;
Published: 14 September 2022.
Edited by:
Lindsay Beaumont Hutley, Charles Darwin University, AustraliaReviewed by:
Panayiotis G Dimitrakopoulos, University of the Aegean, GreeceCopyright © 2022 Albalawneh, Al-Assaf, Sweity, Hammour, Kloub, Hjazin, Kabariti, Abu Nowar, Tadros, Aljaafreh, Diab, Alwidyan, Albashbsheh and Haddad. This is an open-access article distributed under the terms of the Creative Commons Attribution License (CC BY). The use, distribution or reproduction in other forums is permitted, provided the original author(s) and the copyright owner(s) are credited and that the original publication in this journal is cited, in accordance with accepted academic practice. No use, distribution or reproduction is permitted which does not comply with these terms.
*Correspondence: Abeer Albalawneh, YWJlcmZlckB5YWhvby5jb20=
Disclaimer: All claims expressed in this article are solely those of the authors and do not necessarily represent those of their affiliated organizations, or those of the publisher, the editors and the reviewers. Any product that may be evaluated in this article or claim that may be made by its manufacturer is not guaranteed or endorsed by the publisher.
Research integrity at Frontiers
Learn more about the work of our research integrity team to safeguard the quality of each article we publish.