 Shuai Mao1
 Haihong Li
 Fengqin Liu
94% of researchers rate our articles as excellent or good
Learn more about the work of our research integrity team to safeguard the quality of each article we publish.
Find out more
ORIGINAL RESEARCH article
Front. Environ. Sci., 25 April 2022
Sec. Environmental Economics and Management
Volume 10 - 2022 | https://doi.org/10.3389/fenvs.2022.865946
This article is part of the Research TopicGreen Innovation and Industrial Ecosystem Reconstruction in Achieving Environmental SustainabilityView all 34 articles
Low-carbon tourism reflects the degree of environmental concern in the tourism industry and is also the foundation of green, sustainable, and ecological tourism. The transformation of the tourism industry, known as the sunrise industry, to a low-carbon pattern contributes to the sustainable development of tourism cities. In this study, an objective evaluation indicator system for low-carbon tourism cities is constructed from the three dimensions of economy, environment, and society, followed by the determination of the weights of the evaluation indicators using an analytic network process model. Ten low-carbon pilot cities in China are evaluated using statistical data of 2014 and 2019. The main research results show that when a city’s economy has reached a certain level, with the development of the economy and individuals’ income and the gradual reduction in environmental pollution, the city’s development level of low-carbon tourism will also be better. Moreover, although these ten low-carbon pilot cities have similar development levels in terms of their social dimension, they have differed greatly in their economic and environmental dimensions. The tourism cities with better economic development levels also rank higher in terms of low-carbon environment and ecological environment, and the overall development level of low-carbon tourism is also better, which shows the obvious Matthew effect as a whole. This study contributes a set of objective evaluation index systems in line with the connotation of low-carbon tourism and assesses the dynamic difference between the cities. This study provides targeted policy recommendations for the construction of low-carbon tourism cities in China.
In September 2020, China announced to the world that its carbon dioxide emissions would peak before 2030, and carbon neutrality would be achieved by 2060. The emissions peak and carbon neutrality strategy is consistent with the general trend of global low-carbon development and is a strategic move that forces the Chinese economy to move toward high-quality development (Niu et al., 2021). Despite the usual perception that the tourism industry is a smoke-free green industry, the tourism industry has actually become a major carbon emitter (Peeters and Dubois, 2010). According to data from the World Tourism Organization and the United Nations Environment Programme, in 2018, the carbon footprint of the international tourism industry accounted for 8% of global greenhouse gas emissions. From 2005 to 2035, the carbon emissions of the tourism industry are projected to grow at an average annual rate of 2.5%. According to the International Energy Agency, among the global carbon dioxide emitters in 2018, transportation accounted for 24.6%, industry accounted for 18.4%, and agriculture accounted for 1.3%. The carbon emissions of tourism cannot be ignored. If the current state of affairs continues, by 2025, the global tourism carbon footprint will expand by more than 40% year on year, and its carbon dioxide emissions will exceed 6.5 billion tons. Therefore, the promotion of low-carbon tourism has become an inevitable trend in the development of China’s tourism industry (Khanna et al., 2014).
Since China introduced the concept of ecotourism in the early 1990s, it has accumulated rich experience in the fields of ecotourism and tourism energy conservation and emissions reduction. China has successfully constructed of low-carbon cities, low-carbon demonstration zones, and low-carbon tourism demonstration zones. For example, at the beginning of 2008, the Ministry of Construction of China and the World Wildlife Fund (WWF) jointly launched a proposal for a low-carbon city in mainland China. In 2010, the Chinese government issued the Guiding Opinions on Further Promoting Energy Conservation and Emissions Reduction in the Tourism Industry. In 2010, the National Development and Reform Commission of China issued the Notice on the Implementation of Pilot Work in Low-Carbon Provinces and Cities. So far, there are three batches of low-carbon pilot cities across China. The selection of low-carbon tourism demonstration zones was also launched in 2010. In January 2011, 50 tourist attractions, including Huangshan, were selected as the first batch of low-carbon tourism demonstration zones. In 2014, the Central Committee of the Communist Party of China and the State Council jointly issued the National New Urbanization Plan (2014–2020), proposing the concept of the Green City. In 2016, the National Standards Committee issued a standard formulation plan for Evaluation Indicators for Green Towns. However, at present, carbon reduction is not the core indicator of the development of the tourism industry. China’s tourism industry is relatively traditional in terms of its growth mode. The carbon reduction potential of the tourism industry is not fully understood, and there is still a considerable gap in the requirements of low-carbon tourism.
Low-carbon tourism is a new form of sustainable development that can yield greater economic, social, and environmental benefits from tourism through the use of low-carbon technologies. Compared with other countries, the service industry is not very developed in China. Coal is the main fuel in China, while the proportion of oil and natural gas is very low, so there is great pressure on emission reduction. Tourism has inherent low-carbon advantages, making it an important part of China’s emission reduction goals. China’s low-carbon tourism model is still in the primary stage. China needs to clarify the responsibility for the development of low-carbon tourism. Low-carbon tourism is an industry decomposition of China’s responsibility for global climate change, and it is also an inevitable choice if tourism is to cope with its further development.
However, the carbon emission reduction challenges faced by the tourism industry involve many complex, interrelated factors (Liu and Qin, 2016). As Du et al. (2018), Wang et al. (2018), Su et al. (2016), Wang et al. (2019), and Zhang and Zhang (2020) pointed out, besides it is necessary to pay attention to air quality, pollutant treatment, and ecological efficiency, the construction of low-carbon cities must address economic, environmental, and social issues (Zhang and Zhang, 2021), such as economic growth and carbon emissions related to tourism. Therefore, it is necessary to formulate a scientific and reasonable indicator framework to evaluate the low-carbon development level of Chinese tourism cities.
At present, many scholars have carried out evaluation studies on ecology, green, low-carbon, and sustainable forms of development (Sun et al., 2021a). Hu (2014) evaluated low-carbon tourism cities from three main aspects of tourism competitiveness, low-carbon development level, and regional environmental impact. Among these, the low-carbon development indicator only focused on low-carbon cities and lacked low-carbon indicators specific to tourism. Zhang and Zhang (2020) used the fuzzy Delphi method to construct a low-carbon tourism development indicator system and conducted a static assessment of the low-carbon development level of the two tourism cities of Guilin and Lhasa. However, there are still few low-carbon development evaluation studies that have specifically targeted tourism cities. Because the existing studies adopt relatively subjective evaluation indicators, their rationality and feasibility are also questionable.
Based on the above problems, this research mainly focuses on the following two questions: 1) what kind of indicator system should be constructed to ensure the objectivity and validity of the evaluation results? 2) What are the differences in the low-carbon tourism development levels among representative cities? The main contribution of this study is to construct an objective indicator system, in which the analytic network process (ANP) method is used to evaluate the low-carbon development level of 10 representative tourism cities in China using real data.
The rest of this study is organized as follows: the following section presents the literature review. In Indicator System Construction, an evaluation indicator system is constructed and weights are determined. Case Studies presents details on the case studies. In Conclusion and Policy Orientation, conclusions and policy implications are presented.
Compared to broader concerns about achieving a low-carbon economy, the specific issue of low-carbon tourism has begun to receive attention recently. The concept of low-carbon tourism was proposed in 2008. Gössling et al. (2008) raised the issue of low-carbon tourism: new opportunities for destinations and tour operators. They argued that low-carbon tourism is sustainable. In the context of the prevalence of low-carbon concepts, many scholars have paid attention to low-carbon tourism and have conducted extensive research. However, the research objects for evaluating low-carbon development levels include mainly low-carbon cities, sustainable cities, low-carbon tourism. Previous research has focused on establishing an evaluation indicator system and selecting evaluation methods.
Du et al. (2018) constructed a multi-dimensional indicator system from the four aspects of society, economy, energy, and environment and launched an evaluation of low-carbon development in 30 provinces in China from 2003 to 2013. Socio-economic conditions, resource endowments, and region were correlated, but the research was conducted in a wide range, based on provinces as a unit. In fact, cities in each province may have large differences in development, which do not reflect the broader differences in regional development. Blancas et al. (2016) built a dynamic evaluation index through a goal planning approach composed of 85 indicators: 29 social indicators, 36 economic indicators, and 20 environmental indicators. Fu et al. (2010) comprehensively considered the three aspects of economy, society, and environment to construct an indicator system for evaluating the low-carbon level of cities but did not conduct empirical research. Liu and Zhang (2020)used the analytic hierarchy process (AHP) to construct a sustainable tourism development indicator system composed of four dimensions: environmental resource subsystems, social subsystems, economic subsystems, and development support subsystems. They calculated the weight of each indicator to judge the influence of each on the sustainable development of rural tourism for Longnan. However, only the weights were calculated, and no empirical research was conducted on the specific data in Longnan. Li et al. (2017) constructed a low-carbon city development evaluation indicator system composed of 18 objective indicators from the four subsystems of the social system, economic system, environmental system, and scientific and technological system. They used the fuzzy hierarchy comprehensive evaluation method to investigate four municipalities directly under the Central Government and analyzed trends in the data from 2008 to 2013. However, the selected cities were too similar, and the methods used could not consider the interactions between the indicators. In general, the evaluation systems described above considered the three aspects of economy, society, and environment, and a small number of them also incorporated other subsystems such as energy, development, and technology (Luo et al., 2020; Sun et al., 2021b).
When developing evaluation methods for low-carbon tourism cities, many scholars have adopted principal component analysis (PCA) and AHP for indicator selection and weight determination. Guo et al. (2018) comprehensively used PCA and fuzzy analytic hierarchy process (FAHP) to simulate and predict the low-carbon competitiveness of the Wuhan metropolitan area. However, they did not pay attention to the internal relationships between the indicators, and the scope of the selected research area was relatively small. Wang et al. (2021) calculated scores for low-carbon development quality using the TOPSIS method in research on low-carbon urban development. Tan et al. (2017) employed a comprehensive evaluation method for the ranking of low-carbon cities using the entropy weighting factor method. Perez et al. (2016) used a combination of dissimilar algorithms such as distance, data envelopment analysis, and principal component analysis to rank destinations. Shi et al. (2021) and Tao (2017) established green city sustainable development level evaluation indicators and a low-carbon tourism evaluation indicator system based on AHP. However, the AHP method has many shortcomings, such as having no consideration for any correlations between evaluation elements. Kim et al. (2021) proposed a slow city tourism evaluation index based on Delphi-AHP. Hu (2014) and Zhang and Zhang (2020) used the ANP method to overcome this defect. However, their research also has new problems, such as insufficient selection of low-carbon indicators or excessively subjective data. In general, most of the previous studies have used simple and flexible AHP and FAHP methods. A small amount of research has begun to pay attention to the shortcomings of the above evaluation methods, and they have instead adopted the more advantageous ANP network analysis method. The ANP method can consider the interrelationships between indicators, so an indicator system constructed thereby can produce more practical and effective evaluation results.
In terms of the objectivity of the indicator system, many scholars have adopted the idea of combining objective indicators with subjective indicators. Cheng et al. (2013) constructed a low-carbon evaluation indicator system for tourist attractions, including two subjective indicators of the management system and participant attitudes. Moreover, the data for all indicators came from subjective scoring by experts, which inevitably affects the reliability of the results. Cho et al. (2016) used Taiwan as an example to construct an indicator system to evaluate the suitability of low-carbon tourism development, containing 53 second-level evaluation indicators. However, the measurement data relied on subjective scoring, such as low-carbon tourism experience, carbon education, promotion, and dining environment. Zhang and Zhang (2020) adopted a comprehensive method combining the fuzzy Delphi method and ANP to construct an indicator system for evaluating the development of low-carbon tourism in urban destinations. However, the indicators such as low-carbon environmental education, carbon literacy of residents, and low-carbon technology were still too subjective, and only static evaluations were made on the development status of Lhasa and Guilin in 2014. Wu et al. (2016) used remote sensing images, night light values, and PM2.5 concentration inversion data to evaluate the development level of low-carbon cities from the five aspects of low-carbon development, low-carbon economy, low-carbon environment, city scale, and energy consumption. The objectivity of the evaluation indicators was very good. However, the workload was huge, the data was too cumbersome, and the data availability was relatively poor, leading to poor performance. Shi et al. (2021) conducted a green city sustainable development level evaluation study. The data sources were all publicly available official data. The years 2009, 2014, and 2019 were selected for spatial change evaluation. As the indicator system considers official, authoritative data as much as possible, it provides better inspiration for similar research.
ANP generalizes the problem modeling process using a network of criteria (evaluating indicators) and alternatives (strategies), all grouped into clusters. The elements in the network can be related in any possible way. This provides accurate modeling of complex settings and allows handling the usual situation of interdependence among elements used for assessment (Neaupane and Piantanakulchai, 2006). Therefore, this study is based on the ANP Method.
“Related Research on the Evaluation of Low-Carbon Tourism” introduced prior research on the relevant indicators and characteristics of low-carbon tourism evaluation. It was noted that the existing evaluation systems generally include economic, environmental, and social dimensions. Tables 1–3 were thus compiled to list the evaluation indicators related to the development level of low-carbon tourism in the current study. These tables show the indicators, methods, and representative meanings used in previous studies, as well as the focus of each study, for comparison of indicators.
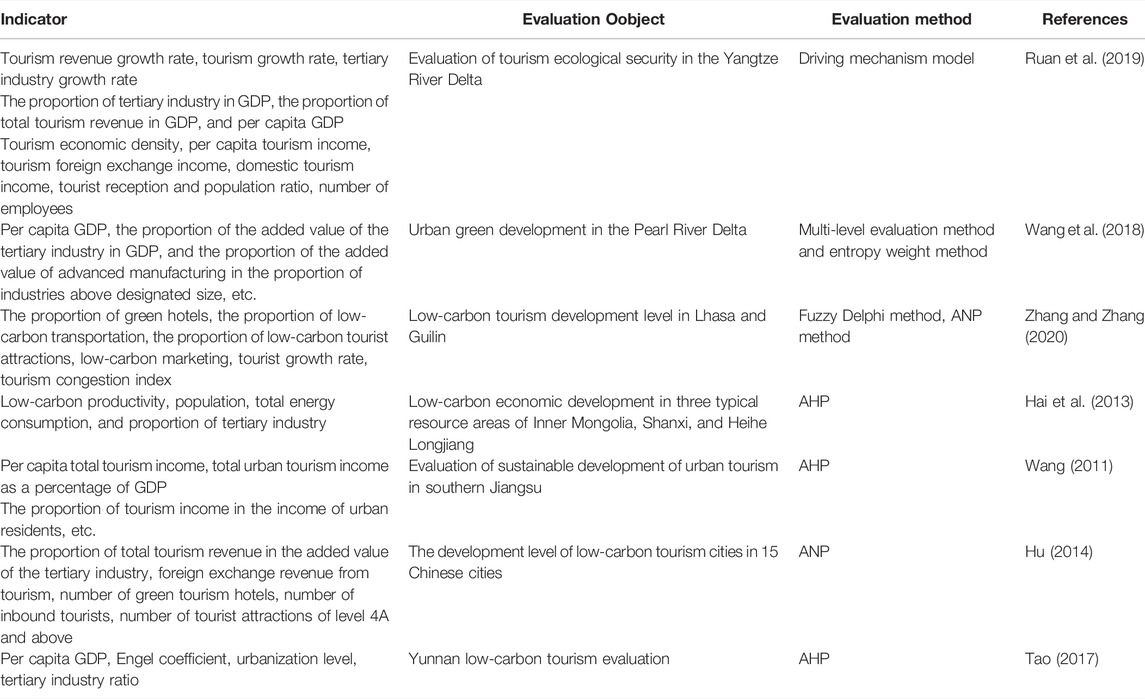
TABLE 1. Indicators of the economic dimension.
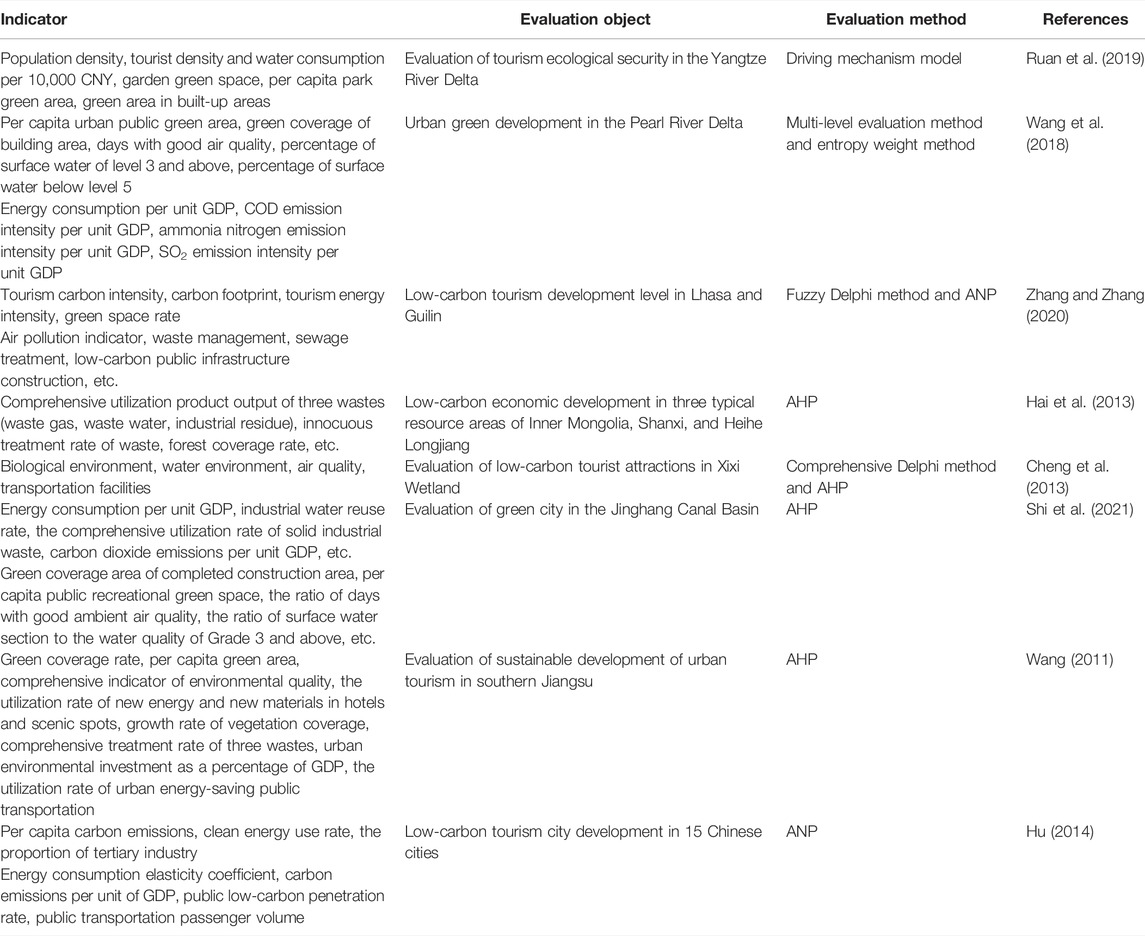
TABLE 2. Indicators of environmental dimension.
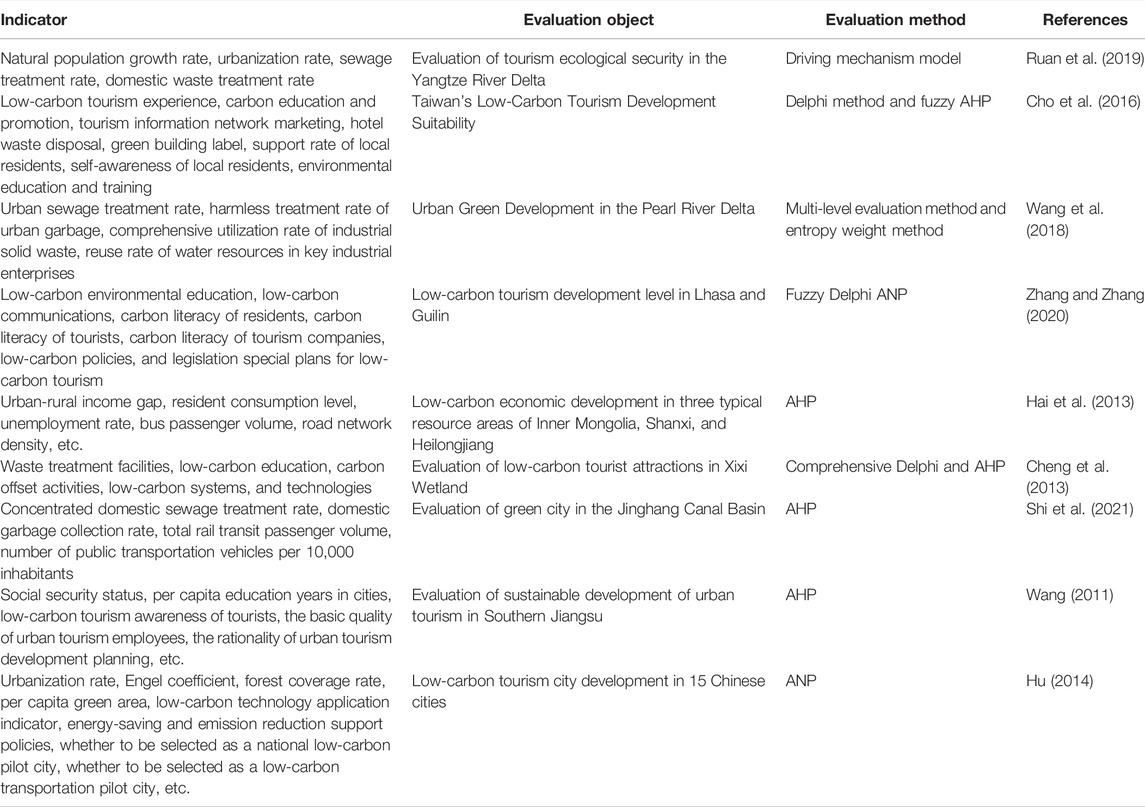
TABLE 3. Indicators of social dimension.
According to the comparison of the above indicators, economic indicators pay more attention to the tertiary industry, the proportion of tourism income in GDP, the growth rate of tourism income, and other relevant indicators that can represent the level of sustainable economic development. Environmental indicators pay more attention to the emission of pollutants, the air quality in the ecological environment, and the coverage of forest green space, among others. Social indicators pay more attention to residents’ low-carbon awareness, basic qualities, urban waste treatment, facility planning, and policies. This study mainly selects the most used indicators in the past, but indicators such as resident literacy can hardly be represented by objective data. We will, therefore, focus on indicators such as garbage or pollutant treatment rate and Engel coefficient.
The evaluation systems used in the studies described above considered the indicators from three aspects of economy, society, and environment. As emphasized by many studies, low-carbon tourism is highly related to a low-carbon economy and sustainability. In order to better clarify the need for a new study to examine the low-carbon development level of tourism cities, this study summarizes the limitations of the current research as follows:
First, most of the current research objects are cities, or a certain particular spot (Cheng et al., 2013; Guo et al., 2018). There are very few relevant studies on tourist cities or tourist destinations. In particular, there has been very little work on the overall evaluation of the low-carbon development of tourism cities.
Second, in terms of evaluation methods for low-carbon tourism cities, an expert (therefore highly subjective) scoring method has usually been used. This study believes that it is more appropriate to adopt official objective data. In addition, there has also been a lack of low-carbon tourism indicators in the low-carbon tourism evaluation indicator systems. Therefore, the selection of indicators in this study will be based on the connotation of low-carbon tourism cities and adopt objective data closer to low-carbon tourism to design a more complete evaluation system.
Third, most of the prior research on evaluating low-carbon tourism cities has adopted the AHP method (Pan et al., 2020). Because the tourism city is an open, dynamic, and complex system, its development requires the interaction of economic, social, and environmental factors to achieve low-carbon sustainable development. Inevitably, there are a large number of interdependencies among many evaluation indicators. Therefore, if the traditional AHP method is used, there is a fatal limitation; the interrelationship between indicators cannot be well solved.
Fourth, most of the prior studies have not carried out specific evaluation work after constructing the indicator system. Even among the small number of evaluation studies that have done so, they have had the problem of too few research areas or static analysis only (Cho et al., 2016; Liu and Zhang, 2020). At present, there has been no targeted comparative analysis or dynamic evaluation in different periods. Therefore, there are no effective measures to improve the performance of cities.
Based on a review of the relevant evaluation research, the following points should be considered when formulating an evaluation indicator system for the low-carbon development of tourism cities.
1) It is necessary to indicate a city’s low-carbon tourism status in an integrated manner, based on social, economic, and environmental factors, as the basic criteria for the evaluation.
2) A more complete indicator system should include the various goals for and ways of achieving low-carbon tourism cities, not only involving the urban economy but also paying attention to the development of the tourism economy, low-carbon development, and the ecological environment. The innovation of this study lies in closely following the scientific connotation of low-carbon tourism cities, focusing on low-carbon tourism development points, and encompassing the basic principles of urban development, plus the city’s carrying capacity, facility construction, and social life indicators. The evaluation results are thereby ensured to be comprehensive and effective.
3) The availability of data is the basis of calculation, and the availability of all indicator data should be guaranteed. Therefore, any statistical data that is difficult to collect and whose consistency cannot be guaranteed for all cities under evaluation (e.g., the proportion of clean energy vehicles) will not be included in the evaluation indicator system for the time being.
4) The evaluation indicators should be based on objective data and quantifiable indicators. Some indicators such as low-carbon recognition, low-carbon literacy, low-carbon policies, and other related factors admittedly have an impact on low-carbon development levels, but they are highly subjective, making it difficult to objectively compare different cities and different time points. Moreover, different evaluation teams will yield different evaluation results, making such indicators unsuitable for the evaluation indicator system.
Based on the literature review above, the evaluation of the development level of low-carbon tourism cities involves many complex factors such as economy, society, and the environment. In this study, ANP is used to construct an evaluation model, according to the main principles and ideas of the ANP, to evaluate cities’ low-carbon tourism development level. The indicator system constructed in this study is divided into three low-carbon subsystems: economy, environment, and society. The second-level indicators include low-carbon carrying support, tourism investment and tourism output, low-carbon environment, ecological environment, low-carbon life, and facility planning. The second-level indicators are decomposed into single-item third-level indicators. The complete indicator system is shown in Table 4. The data sources of the improved indicators are all objective to prevent errors caused by differences in evaluation expert teams.
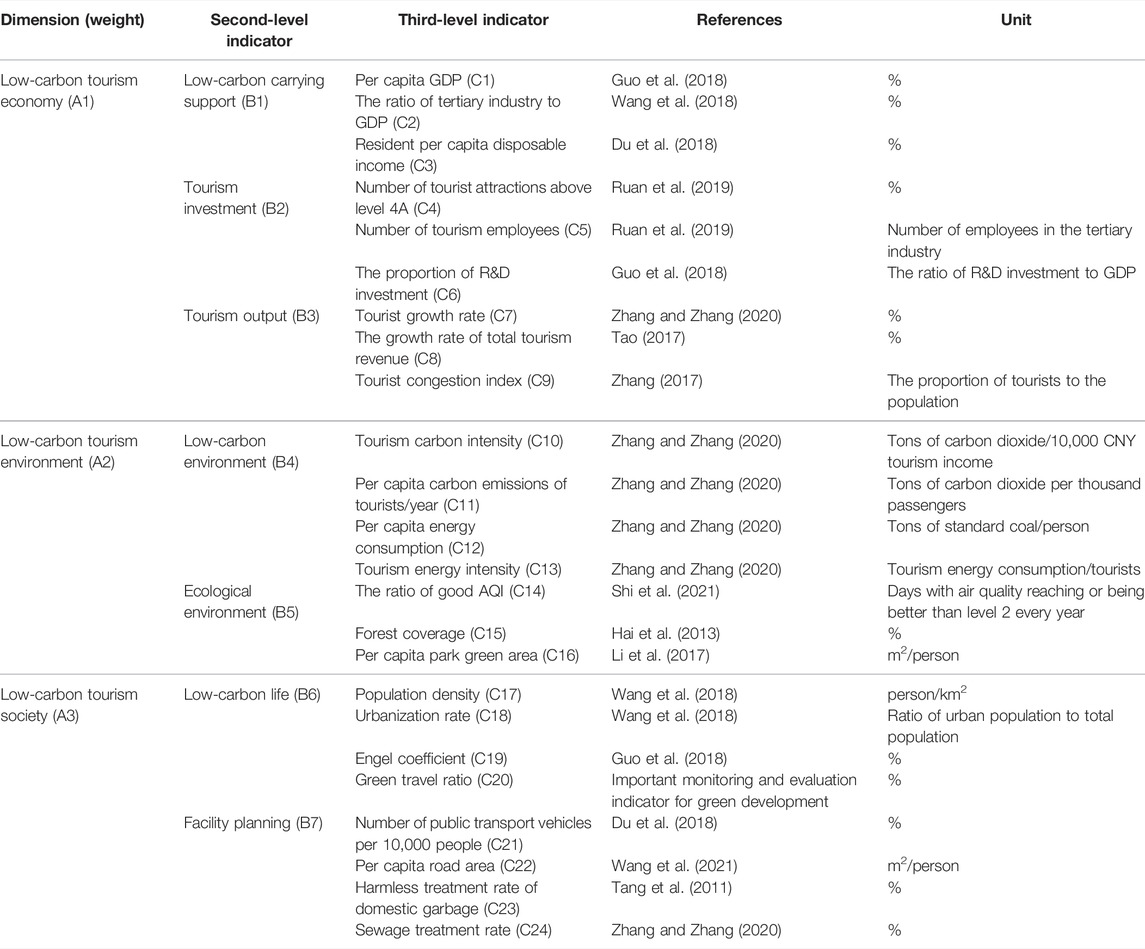
TABLE 4. Low-carbon city tourism evaluation indicators.
1) A1 is the indicator of the tourism economy. The level of economic development has a positive effect on energy intensity and the carbon emissions intensity of the tourism industry. The continuous increase in the current economic development level and the continuous expansion of the tourism industry are inevitable trends (Yao et al., 2021). Economic indicators such as tourism income growth rate, tourism growth rate, tertiary industry growth rate, per capita GDP, and the proportion of tertiary industry in GDP can effectively measure the economic development level and sustainable development capacity of the tourism industry. Socio-economic development and industrial structure are important input factors for the operation of the tourism ecosystem (Lu et al., 2015; Wang et al., 2016). Therefore, low-carbon carrying support (B1) selects three indicators of per capita GDP, the ratio of the tertiary industry to GDP, and the per capita disposable income of residents (Chen et al., 2018; Lu et al., 2018). Tourism investment (B2) selects the number of tourist attractions above level 4A, the number of tourism employees, and the proportion of R&D investment. The output level of the tourism industry is one of the direct manifestations of the development of low-carbon tourism cities. This study selects the tourist growth rate and tourism revenue growth rate to reflect the development status of the city’s tourism economy. Therefore, the tourism output indicator (B3) is based on the three indicators of tourism revenue growth rate, tourist growth rate, and tourism congestion index.
2) A2 is the indicator of a low-carbon environment. By considering low-carbon emissions, resource efficiency, and environmental protection, the indicators are constructed from two aspects: carbon emissions and ecological environment resources. Currently, China’s energy structure is dominated by high-carbon energy. Coal and oil are still the main fuels. Coal consumption will bring about huge carbon emissions, not conducive to environmental protection and emissions reduction. Tourism carbon emissions, energy consumption, and other related indicators can be used to reflect energy consumption and carbon dioxide emissions. Therefore, the low-carbon environment indicator (B4) is based on tourism carbon intensity, tourist per capita carbon emissions/year, per capita energy consumption, and tourism energy intensity. Low-carbon sustainable development depends on the carrying capacity of the ecological environment. Ecological environment (B5) is based on air quality index (AQI), forest coverage, and per capita park green area. Air quality is directly related to CO2 emissions. Per capita public green area is the ratio of park green area to urban non-agricultural population. The forest coverage rate reflects the abundance of urban forest resources and the degree of greening and can reflect a city’s carbon sequestration capacity, environmental health, and sustainable development level.
3) A3 is the indicator of a low-carbon tourism society. Low-carbon life (B6) includes four indicators: population density, urbanization rate, Engel coefficient, and green travel ratio. Population density is considered an indicator directly related to carbon dioxide emissions, which will have a direct impact on the city’s low-carbon development. Low-carbon tourism is a low-carbon development potential in terms of resource endowments, technological advantages, and consumption patterns (Zheng et al., 2011). Engel coefficient and urbanization rate represent the consumption structure and regional development level; these are used because the consumption structure will impact carbon emissions. The green travel ratio can measure the low-carbon level from the perspective of travel consumption. Facility planning (B7) includes the number of public transport vehicles per 10,000 people, per capita road area, the harmless treatment rate of domestic garbage, and the sewage treatment rate. The core of low-carbon tourism is to produce high-quality, low-carbon emission, and low-polluting tourism experiences in the process of transportation, accommodation, sightseeing, shopping, and entertainment (Liu, 2010). The current urbanization rate is continuously rising, the number of private cars is increasing, and the number of people taking public transportation is decreasing, which puts huge pressure on the city’s energy consumption and carbon emissions. Urban transportation is thus a major source of carbon emissions. The number of public buses per capita is obtained by dividing the number of public buses operated by the city by the registered population of the city. Compared with private vehicles, public transportation has a stronger carrying capacity and lower average passenger carbon emissions. The harmless treatment rate of domestic garbage and the sewage treatment rate are the basic indicators that reflect the impact of urban development on the environment and the level of protection.
ANP was proposed by Saaty and Saaty (1996). This method realizes mutual dependence or feedback and replaces the hierarchical structure with a network, which is the promotion of the AHP. Generally speaking, it is difficult for evaluation indicators to be independent or uncorrelated, and there will be much interdependence between indicators (Zhang, 2017). Therefore, the traditional AHP method has serious limitations in determining the weight of each indicator. This study thus uses the ANP method. The specific process of ANP is shown in Figure 1.
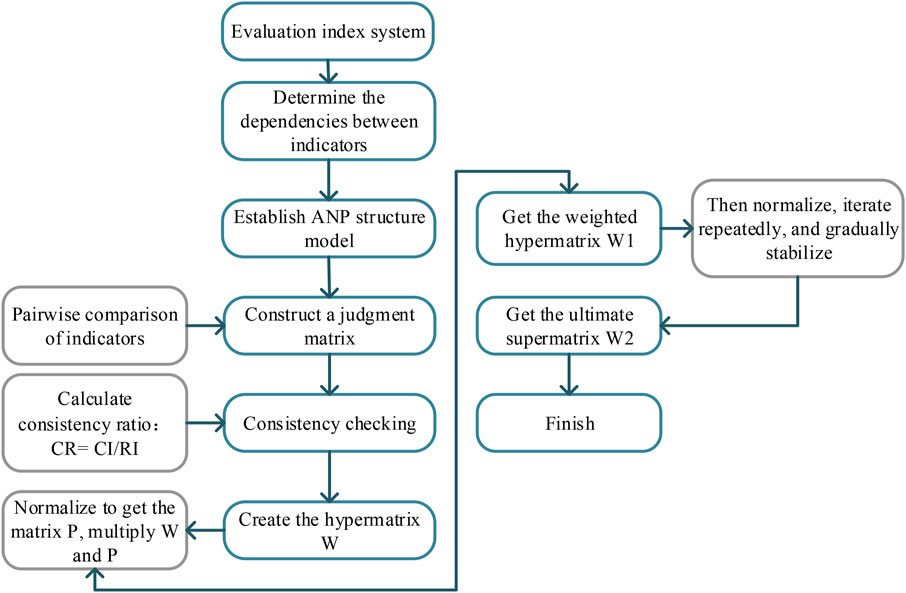
FIGURE 1. ANP flowchart.
We invited 12 experts in the field of low-carbon tourism management to participate in the evaluation. In order to ensure the credibility of the evaluation results, all selected experts are in the fields of low-carbon tourism economy, tourism resource development, or energy: five experts in tourism, one expert in tourism resource development and environmental protection, two experts in low-carbon economy, two experts in low-carbon tourism, and one expert in energy economy. The opinions of experts on the relative importance of these indicators were collected through online questionnaires. The selected experts were asked to use Saaty’s 1–9 scale to compare any pair of indicators. Scale values are shown in Table 5. Finally, by calculating the average of each expert’s decision, all pairwise comparison matrices were obtained.
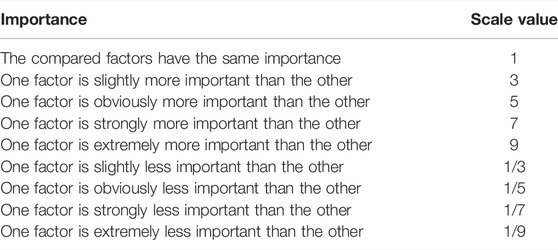
TABLE 5. Assignment of scale value.
The indicators for evaluating the development level of low-carbon tourism cities present a certain hierarchical structure, and there are dependencies and feedback relationships between its levels and indicators. Given the information feedback between the levels and the interdependence of the internal elements of the levels, the interdependence between economy, environment, and society must be considered before weighting the evaluation indicators in the ANP (Zhang, 2017). For example, the tourist growth rate will certainly have a positive impact on tourism carbon intensity and the per capita carbon emissions of tourists; a city’s per capita GDP will affect the city’s facility planning, such as bus deployment and road planning; R&D investment will affect the technological level of domestic waste and sewage treatment; green travel can help reduce carbon dioxide emissions related to tourism; and tourism carbon intensity will affect air pollution. Therefore, there is a substantial interdependence among the 24 indicators in Table 4. This research used a two-dimensional table of expert group surveys to determine the interdependence between different indicators.
The low-carbon tourism city evaluation indicators were input into the ANP calculation software Super Decisions to establish the dependency, control, and feedback relationships among the indicators in the element set and internal units composed of indicators at all levels. In this fashion, the network hierarchy diagram of the evaluation index system was obtained. Under the premise that the consistency test can pass the measurement standard as a matrix, the relationship matrix established by the expert group was input into the software to calculate the unweighted supermatrix, weighted supermatrix, and limit supermatrix. Finally, the weights of the low-carbon tourism city evaluation indicators were obtained, as shown in Table 3.
Figure 2 shows an ANP model for evaluating the development level of low-carbon tourism based on the interdependence of indicators. All the arrows here indicate interdependencies between different indicators. All matrices have passed the consistency test (inconsistency < 0.1), and the maximum inconsistency of all paired comparison matrices is 0.06969.

FIGURE 2. Diagram of ANP model.
Table 6 shows the comprehensive weights and rankings of all evaluation indicators. Among them, the resident per capita disposable income (C3) (0.232941) has the highest weight, followed by the ratio of the tertiary industry to GDP (C2) (0.199121), ratio of good AQI (C14) (0.121527), and Engel coefficient (C19) (0.093717). This indicator ranking shows that experts believe that economic support for low-carbon carrying capacity is particularly important in evaluating low-carbon tourism. Moreover, studies have shown that China reached a relative peak in the environmental pollution in 2012, and the effect of China’s economic growth on the environment has changed from a negative effect to a positive effect (Liu, 2021). Furthermore, the relatively highly ranked indicators include tourism carbon intensity (C10) (0.036373), per capita energy consumption (C12) (0.028328), and green travel ratio (C20) (0.041658). It can be intuitively seen that, in low-carbon development, transportation for tourism travel is a major source of carbon emissions, and green travel can effectively reduce them. Moreover, the overall weight of a low-carbon society is lower than that of a low-carbon economy and low-carbon environment because the economic and environmental indicators are more in line with the connotation of tourism and carbon emissions. From a realistic point of view, some of the economic and environmental indicators affect social indicators, and social indicators slowly change in response. In particular, facility planning (B7) is also based on the government’s plan for the city and the intensity of facility investment, such as garbage treatment and sewage treatment, which requires a sufficient economic foundation and technical conditions. Another example is the increase in resident disposable income, which will produce a corresponding increase in the number of private cars that will affect the green travel ratio.

TABLE 6. Results of weighted indicators.
In order to promote the construction of ecological civilization, promote green and low-carbon development, and ensure the realization of China’s greenhouse gas emissions goals, the National Development and Reform Commission of China has successively launched three batches of national low-carbon pilot projects in 2010, 2012, and 2017, as an important starting point for carbon emission reduction goals. The blue points and green areas in Figure 3 show the current low-carbon pilot cities and their distribution in each province in China. Although China’s overall carbon emissions have decreased, there are still big differences in the effectiveness of carbon emissions reductions across the low-carbon pilot cities, and the establishment of low-carbon pilot cities has not necessarily meant effective implementation (Guo and Wang, 2021; Huo et al., 2022). In fact, as early as 1988, China started the construction of excellent tourism cities. The tourism industry has the characteristics of low energy consumption and low pollution, which are important for cities to adapt to a low-carbon path. Therefore, this article selects a research area that is both an excellent tourist city in China and a low-carbon pilot city to conduct its evaluation of low-carbon tourism. The evaluation results reflect the current implementation status of low-carbon pilot cities.
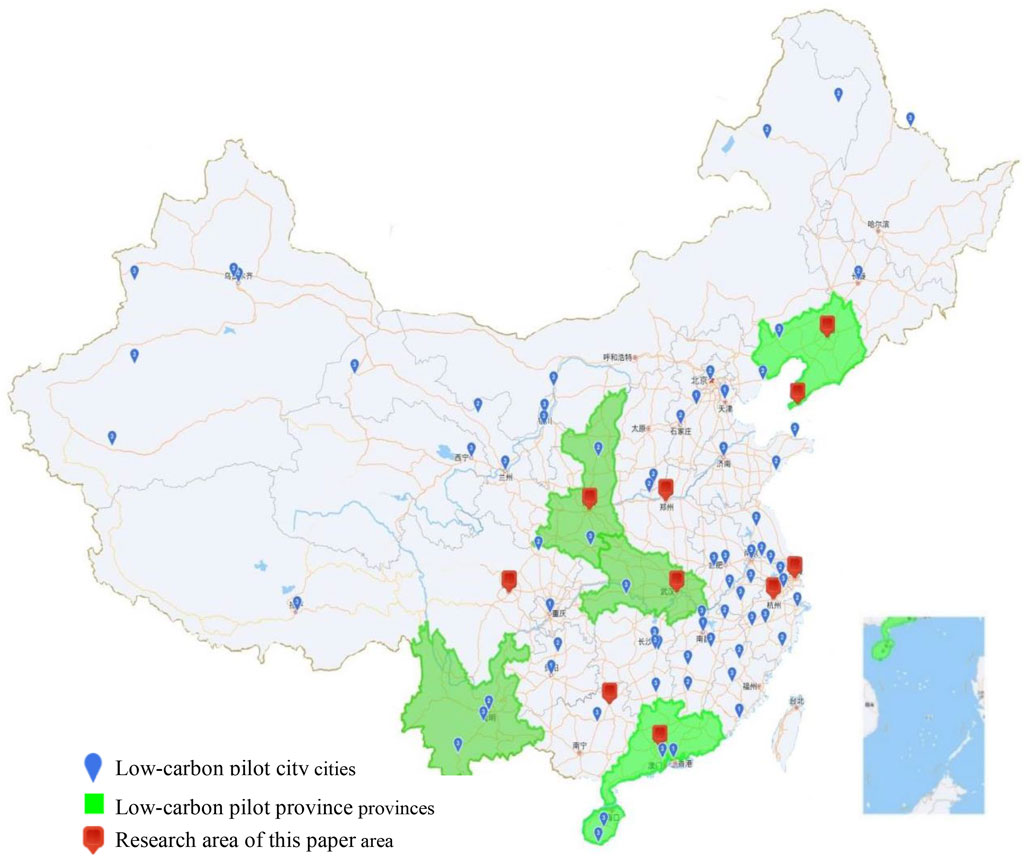
FIGURE 3. Distribution of low-carbon pilot cities.
The main selection principles were as follows: 1) choose at least two cities each in the southeastern, northwestern, and central regions of China to facilitate the analysis of the differences in low-carbon development in these cities; 2) do not limit the choice to cities with tourism as the main form of development, but also include cities in which a non-tourism industry is a leading industry; 3) the development of the tourism industry in the selected city must have good representativeness and should have a certain international reputation. To this end, we selected low-carbon pilot cities from the list of China’s excellent tourism cities.
According to the above requirements, we identified 10 low-carbon cities marked in red in Figure 3. They are two cities in the eastern region (Shanghai and Hangzhou), two cities in the western region (Chengdu, Xi’an), two cities in the southern regions (Guangzhou and Guilin), two cities in the northern region (Shenyang and Dalian), and two cities in the central region (Wuhan and Zhengzhou). Table 7 gives a brief introduction to each city.
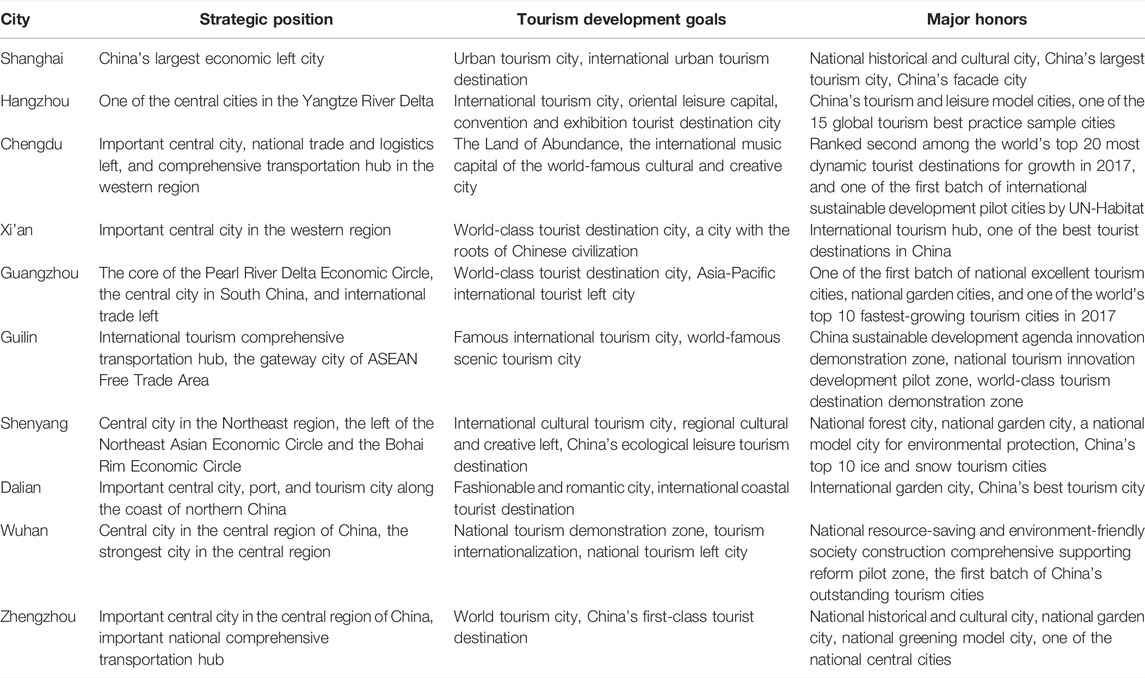
TABLE 7. Brief introduction of low-carbon tourism cities.
The data for the evaluation indicators in this article were mainly derived from annual economic and social statistical bulletins and the statistical yearbooks of the respective cities, the China City Statistical Yearbook, the Statistical Yearbooks of various provinces, and the relevant official websites of the government. The data source of each indicator is shown in Table 8, and the attributes of the indicators are marked.
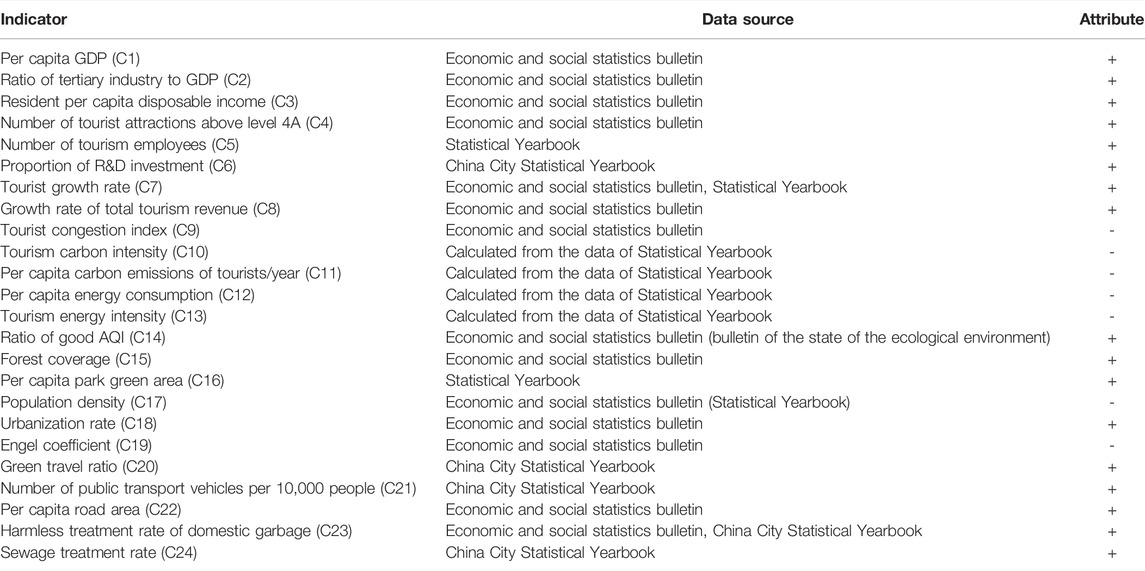
TABLE 8. Data sources of the indicators.
The same standards were applied to all data sources to ensure reliability and accuracy. Because the units of each indicator are different, statistical indicators must be dimensionless. The indicator values in this study are all objective. In order to compare the differences between cities and preserve the degree of variation of the data and the authenticity of the rankings, non-dimensionless processing was conducted on the indicators by
where
Table 9 shows the scores and ranking changes of the ten cities in 2014 and 2019. The negative indicators have been processed with negative values, so the scores of second-level indicators will have negative values. The specific values of all the original data are reflected in the attached table.
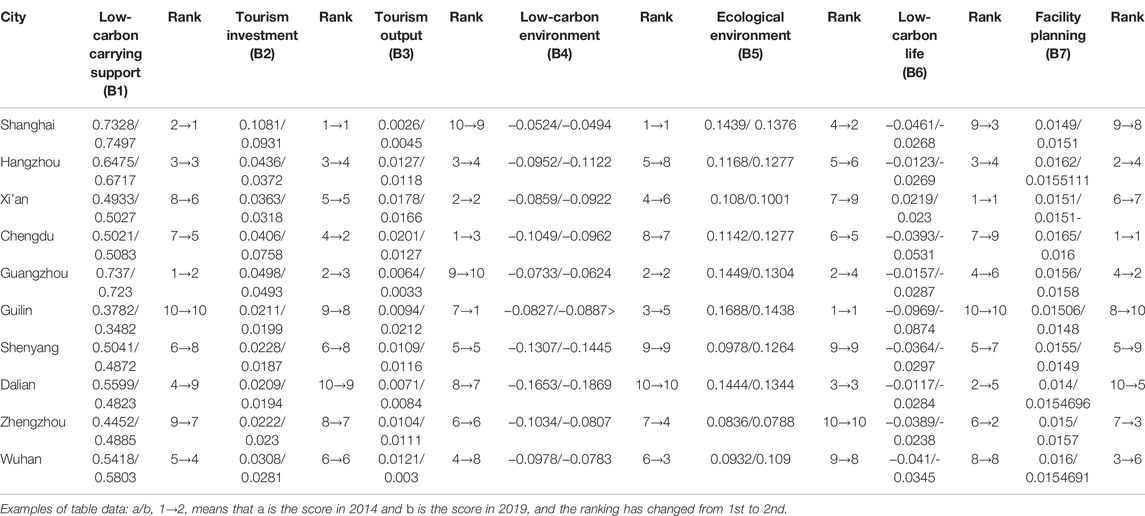
TABLE 9. Results of averaged evaluation scores.
For 2014, the cities ranked by the total score from highest to lowest are Shanghai, Guangzhou, Hangzhou, Xi’an, Dalian, Wuhan, Chengdu, Shenyang, Zhengzhou, and Guilin. For 2019, the ranking is Shanghai, Guangzhou, Hangzhou, Wuhan, Xi’an, Chengdu, Zhengzhou, Shenyang, Dalian, and Guilin. The relative ranking changed over the past 2 years. A detailed analysis of the scores for each city is as follows:
1) Shanghai’s total score (0.9038/0.9238) ranked first in both years. Low-carbon carrying support (B1) (0.7328/0.7497) changed from 2nd to 1st place. Tourism investment (B2) (0.1081/0.0931) and low-carbon environment (B4) (−0.0524/−0.0494) remained first. Tourism output (B3) (0.0026/0.0045) rose from 10th to 9th, and the indicator B3 lagged behind, specifically due to the low tourism growth rate and low tourism income. The ecological environment (B5) (0.1439/0.1376) rose from 4th to 2nd, showing that Shanghai has developed its air quality and forest coverage well. The ranking for low-carbon life (B6) (0.0461/−0.0268) rose from 9th to 3rd, with the largest change in the sub-indicators, due to the change in the Engel coefficient. Facility planning (B7) (0.0149/0.0151) changed from 9th to 7th. Among them, the indicator value for the number of buses owned by 10,000 people was lower than that of other cities.
2) Hangzhou’s total score (0.7293/0.7247) ranked third. Low-carbon carrying support (B1) (0.6475/0.6717) maintained third place. The ranking of tourism investment (B2) (0.0436/0.0372) and tourism output (B3) (0.0127/0.0118) dropped from third to fourth. Low-carbon environment (B4) (−0.0952/−0.1122) dropped from 5th to 8th. Compared with other cities, this indicator has worsened, specifically due to the increase in per capita energy consumption, which increased from 4.85 tons of standard coal/person to 9.62 tons of standard coal/person. Ecological environment (B5) (0.1168/0.1277) dropped from 5th to 6th. Low-carbon life (B6) (−0.0123/−0.0269) drops from 3rd to 4th. Facility planning (B7) (0.0162/0.0155) dropped from 2nd to 4th. Compared with other cities, Hangzhou had a balanced development in all aspects, most of its rankings changed little, and there was no increase in any indicator’s ranking.
3) Xi’an’s total score (0.6066/0.597) ranking dropped from the 4th to 5th place. Low-carbon carrying support (B1) (0.4933/0.5027) rose from 8th to 6th. Tourism investment (B2) (0.0363/0.0318) remained at the 5th place. Tourism output (B3) (0.0178/0.0166) remained in the 2nd place. Low-carbon environment (B4) (−0.0859/−0.0922) dropped from 4th to 6th as a result of an increase in per capita energy consumption and tourism energy intensity. Ecological environment (B5) (0.108/0.1001) dropped from 7th to 9th, mainly due to a reduction in per capita green area. Low-carbon life (B6) (0.0219/0.023) remained at the 1st place. Facility planning (B7) (0.0151/0.0151) dropped from the 6th to 8th place. On the whole, although the score of low-carbon carrying support (B1) increased, the decrease in the low-carbon environment (B4) and ecological environment (B5) brought about a change in the total score. Xi’an should, therefore, pay special attention to carbon emissions and the ecological environment.
4) Chengdu’s total score (0.5494/0.591) rose from 7th to 6th. Low-carbon carrying support (B1) (0.5021/0.5083) rose from 7th to 5th. In recent years, Chengdu has adopted Charming Ancient Capital and Western Heart as one of its strategies and has achieved economic growth with the aid of the Belt and Road Initiative. Tourism investment (B2) (0.0406/0.0758) rose from 4th to 2nd in part because the number of level 4A scenic spots increased significantly from 18 to 48. Tourism output (B3) (0.0201/0.0127) dropped from 1st to 3rd, mainly due to a slowdown in tourist growth in 2019. Low-carbon environment (B4) (−0.1049/−0.0962) rose from 8th to 7th. Ecological environment (B5) (0.1142/0.1277) rose from 6th to 5th. Low-carbon life (B6) (−0.0393/−0.0531) dropped from 7th to 9th. Facility planning (B7) (0.0165/0.016) remained at the1st place. In recent years, the population of Chengdu has increased and population density has changed. However, it has also brought about an increase in local consumption, especially an increase in the use of Chengdu’s international air routes in recent years, which has driven international tourism consumption. It can be seen from the evaluation score that Chengdu has been further developed in all aspects.
5) Guangzhou’s total score (0.8647/0.8308) ranked 2nd. Low-carbon carrying support (B1) (0.737/0.723) changed from 1st to 2nd. Tourism investment (B2) (0.0498/0.0493) changed from 2nd to 3rd. Tourism output (B3) (0.0064/0.0033) dropped from 9th to 10th, similar to Shanghai’s ranking, mainly due to a slowdown in tourist growth rate and tourism income. Low-carbon environment (B4) (−0.0733/−0.0624) remained at the 2nd place. Ecological environment (B5) (0.1449/0.1304) dropped from 2nd to 4th. The values of Guangzhou’s own ecological environment-related third-level indicators have not decreased, mainly due to the small degree of development and changes in the ecological environment, which led to a decline in the ranking. Low-carbon life (B6) (−0.0157/−0.0287) dropped from 4th to 6th because of the green travel ratio. Facility planning (B7) (0.0156/0.0158) rose from 4th to 2nd.
6) Guilin’s total score (0.4129/0.3716) has always ranked last, at 10th place. Its low-carbon carrying support (B1) (0.3782/0.3482) also ranked 10th. Although the tourism industry has always been a major contributor to the economic development of Guilin, the low ranking is greatly related to its poor low-carbon economic carrying capacity. However, Guilin maintained first place in the ecological environment (B5) (0.1688/0.1438) due to Guilin’s emphasis here (Zhang and Zhang, 2020). Tourism investment (B2) (0.0211/0.0199) improved from the 9th to 8th place. Tourism output (B3) (0.0094/0.0212) rose from the 7th to 1st place because the growth rate of tourists and tourism revenue significantly increased. Low-carbon environment (B4) (−0.0827/−0.0887) dropped from third to fifth, and the increase in tourism output also resulted in more energy consumption, leading to a decline in the low-carbon environment score. Low-carbon life (B6) (−0.0969/−0.0874) ranked 10th, partly due to an urbanization rate that was much lower than that of the other cities. Facility planning (B7) (0.015/0.0148) dropped from 7th to 10th, as the number of buses per 10,000 people was lower than that of other cities.
7) Shenyang’s total score (0.484/0.4846) remained at the 8th place. Low-carbon carrying support (B1) (0.5041/0.4872) dropped from 6th to 8th. Tourism investment (B2) (0.0228/0.0187) dropped from 7th to 10th. It can be seen that tourism investment is highly related to low-carbon carrying support, and both underwent major changes. Tourism output (B3) (0.0109/0.0116) remained in the 5th place. Low-carbon environment (B4) (−0.1307/−0.1445) remained in the 9th place. Ecological environment (B5) (0.0978/0.1264) changed from 8th to 7th. The lower ranking of low-carbon environment and ecological environment was related to Shenyang’s main industry being industrial, which consumes considerable energy and easily increases the pressure on the city’s ecological environment. Low-carbon life (B6) (−0.0364/−0.0297) dropped from 5th to 7th. Facility planning (B7) (0.0155/0.0149) dropped from 5th to 9th. The score gap for low-carbon life was relatively small across the ten cities, as was also the case for the low-carbon facility. Shenyang’s urbanization rate and Engel’s coefficient were relatively small, which brought about a large degree of decline in its ranking.
8) Dalian’s total score (0.5692/0.4446) dropped from 5th to 9th, the biggest change among the ten cities. Low-carbon carrying support (B1) (0.5599/0.4823) dropped from 4th to 9th, which was the main reason for the decline in the total score ranking. In recent years, Dalian’s economic development has declined, its industrial resources have also decreased, and its talents have been drained, which has had a great negative impact. Tourism investment (B2) (0.0209/0.0194) changed from 10th to 9th; the lower ranking was greatly affected by economic development. Tourism output (B3) (0.0071/0.0084) changed from 8th to 7th. Low-carbon environment (B4) (−0.1653/−0.1869) ranked at the 10th place, unchanged. Similar to Shenyang, the industrial structure of such cities is based on heavy industry and the energy industry, which has a negative impact on energy consumption. Ecological environment (B5) (0.1444/0.1344) remained at the 3rd place. Low-carbon life (B6) (−0.0117/−0.0284) dropped from 2nd to 5th. Facility planning (B7) (0.014/0.0155) rose from 10th to 4th. The number of buses per 10,000 people in this indicator was the main source of the increase.
9) Zhengzhou’s total score (0.4341/0.5126) improved from 9th to 7th. Low-carbon carrying support (B1) (0.4452/0.4885) rose from 9th to 7th. Tourism investment (B2) (0.0222/0.023) rises from 8th to 7th. Tourism output (B3) (0.0104/0.0111) remained in the 6th place. Low-carbon environment (B4) (−0.1034/−0.0807) improved from 7th to 4th. Ecological environment (B5) (0.0836/0.0788) ranked 10th. Low-carbon life (B6) (−0.0389/−0.0238) rose from 6th to 2nd. Facility planning (B7) (0.015/0.0157) rose from 7th to 3rd. Overall, the ecological environment ranked last, but most rankings are on the rise. However, compared with other cities, Zhengzhou has relatively few tourism resources, a high population density, and poor air quality. Therefore, its score for the ecological environment is low. Zhengzhou should therefore pay attention to the development of its ecological environment.
10) Wuhan’s total score (0.5552/0.6283) improved from 6th to 4th. Low-carbon carrying support (B1) (0.5418/0.5803) changed from 5th to 6th. Tourism investment (B2) (0.0308/0.0281) remained in the 6th place. Tourism output (B3) (0.0121/0.0083) dropped from 4th to 8th, and the growth rate of tourists and tourism income in Wuhan in 2019 is lower than that in 2014. Low-carbon environment (B4) (−0.0978/−0.0783) rose from 6th to 3rd. Ecological environment (B5) (0.0932/0.109) changed from 9th to 8th. Low-carbon life (B6) (−0.041/−0.0345) remained in the 8th place. Facility planning (B7) (0.016/0.0155) changed from 3rd to 4th. With the development of its low-carbon economy, the development of agricultural tourism in the suburbs of Wuhan has obvious advantages, as Wuhan can provide a low-carbon environment and a better ecological environment.
Based on the results of the above comparative analysis, the following conclusions can be drawn:
First, when a city’s economy develops to a certain extent, further development of the economy and per capita income will cause the degree of environmental pollution to gradually decrease, and the development of low-carbon tourism will be better. This result can be reasonably explained from the environmental Kuznets curve hypothesis (Gao et al., 2021). According to scholars such as Grossman and Krueger (1995), Peng and Bao (2006), Wang et al. (2020), and He et al. (2021), when the economy develops to a certain extent, economic growth begins to have a positive impact on the environment. According to Liu’s research, when the per capita annual income reaches about 7000 US dollars, China will reach an inflection point in the environmental Kuznets curve (Liu, 2021). China’s per capita annual incomes in 2014 and 2019 were 8,600 and 10,410 US dollars, respectively. Because there is currently no research literature on the tourist environment Kuznets curve, we can judge that China as a whole may have crossed the inflection point of the environmental Kuznets curve, showing that, with the continuous growth of per capita annual income, the development of low-carbon tourism is indeed improving. It can be seen from their total score and the rankings of their low-carbon carrying support (B1) that Shanghai and Guangzhou have high scores, and their economic development level has passed the inflection point of the environmental Kuznets curve. Therefore, their tourism investment also was more than before, and their low-carbon environment and ecological environment score rankings were also higher. Hence, the development level of low-carbon tourism was better than that of other cities. However, the per capita annual incomes of Guilin in 2014 and 2019 were 4,365 and 3,825 US dollars, respectively. Due to regional development differences, Guilin has not yet reached the inflection point. Its scores for tourism investment (B2) (0.0211, 0.0199) were not high, and its low-carbon tourism development ranking was also at the bottom. Therefore, the development of city tourism can achieve high-quality development only by relying on a solid foundation for economic development.
Second, the development of low-carbon tourism in cities depends on the coordination of other industrial sectors. For example, Shenyang and Dalian, both of which are located in the cold northeast of China, are not only old industrial bases but were also once “heavily polluted areas.” Facing the dual dilemma of lagging economic growth and the deterioration of the ecological environment, indicators such as low-carbon environment, low-carbon carrying support, and tourism investment rank low for both cities. Dalian, a beautiful coastal city, benefits from the sea breeze from the Bohai Sea. Its air is thus fresh, similar to that of Guangzhou and Shanghai. Dalian’s ecological environment indicator score is relatively high, but it still ranks at the bottom, the same as Shenyang in terms of low-carbon environment and tourism investment. The phenomena of continuous deterioration mean that the environmental problems of Dalian and Shenyang have not been fundamentally solved. Therefore, for cities characterized by heavy industrial development that are in the process of developing low-carbon tourism, we should focus on adjusting the industrial structure, adhering to a high-quality growth model, and coordinately promoting the city’s low-carbon tourism and industrial transformation and upgrading. Efforts should be made to form a structurally optimized, clean, and safe modern industrial system supported by new industries and led by green development.
Third, the difference between cities in the development of low-carbon tourism results from the economic and environmental dimensions rather than the social dimension. This is a manifestation of the Matthew effect. The Matthew effect is a common polarization phenomenon in the social economy (Looy et al., 2004). According to the changes in the total scores in 2014 and 2019, as seen in Figure 4, there are certain fluctuations in cities in the middle rank after 5 years, but most of the changes are not obvious. The top cities of Shanghai and Guangzhou and the bottom cities of Shenyang and Guilin had stable rankings. This is a demonstration of the “Matthew effect,” which states that the strong will always be strong and the weak will always be weak. There is also a phenomenon of solidification in the ranking of secondary indicators such as low-carbon carrying support (B1), tourism investment (B2), low-carbon environment (B4), and ecological environment (B5). Why is there such a solidification phenomenon? The main issue is the transmission mechanism relating regional economic growth to the development of tourism. Due to the outstanding polarization of economic growth in different provinces in China, it is difficult for provinces and cities with poor economic growth to provide more guarantees and supplies for tourism development. This is why the differences in the development of low-carbon tourism mainly lie in the economic and environmental dimensions, while the development levels in the social dimension are relatively similar.
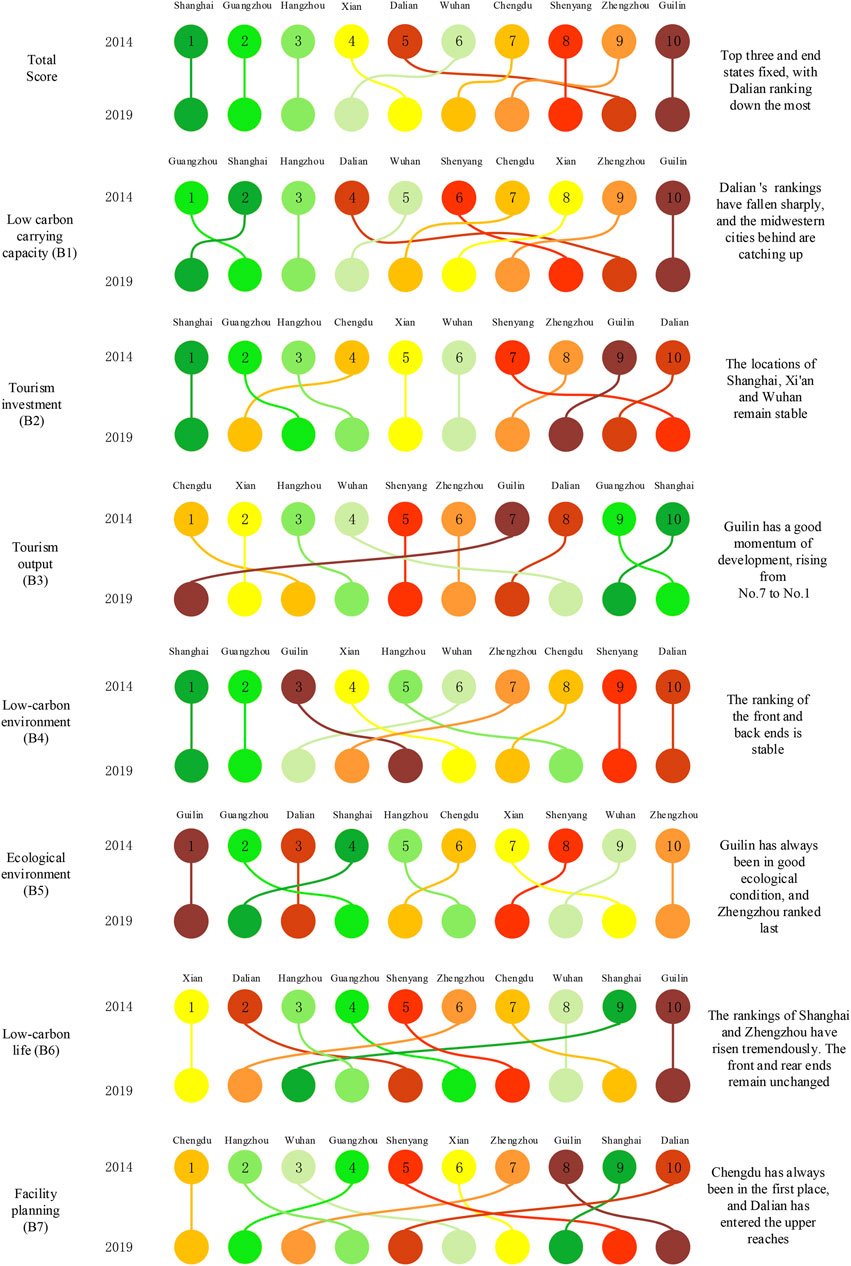
FIGURE 4. Changes in the ranking of cities’ low-carbon tourism development.
This research has made innovative contributions by constructing an objective indicator system for the evaluation of low-carbon tourism cities. Ten cities were selected for empirical research, and a relatively dynamic evaluation was made based on data from 2014 to 2019. The main contributions of this study are as follows:
First, this study posits that the use of objective data can better reflect the development level of low-carbon cities. Therefore, it has made objective improvements to the evaluation indicator system for low-carbon tourism cities. The selected indicator data are all from the public yearbook, which avoids the deviation of results caused by subjective differences and makes the evaluation results more effective and practical. The selection indicators are based on the connotation of low-carbon tourism cities, including the continuous output of tourism economic benefits (such as tourist growth rate and income growth rate), the tourism destination’s or the city’s resources and environmental protection (such as forest coverage rate and ambient air quality indicator), and indicators of the greenness and health of social development (such as population density, Engel’s coefficient, and green travel indicator), as well as the most important tourism industry indicators and carbon relevance. The above content constitutes a comprehensive low-carbon development evaluation system. This is an attempt from a new perspective, which will help measure the development of low-carbon tourism cities more objectively and effectively. Prior studies have mostly adopted expert scoring methods, which were too subjective. Therefore, this study employed more reasonable indicators to evaluate low-carbon tourism cities.
Second, the study area is rich in samples, and ten representative cities were selected for evaluation and ranking comparison. In the past, most studies have only focused on one research area, such as a city, a province, or a scenic spot. The number of studies has been small, and their applicability was low (Cheng et al., 2013; Cho et al., 2016). The results of this article have practical significance for the development of low-carbon tourism in these ten cities. From the comparison results of the rankings of the ten cities, it can be seen that there are some shortcomings in the development of low-carbon tourism in each city, and the differences in regional development are directly related to the development level of low-carbon tourism in the cities. The evaluation conclusions can provide a valuable reference for developing low-carbon tourism in other cities.
Third, 2-year data were selected to make a differential analysis of the relative dynamic changes in the low-carbon tourism development levels of the cities in the study area. Based on inter-annual comparisons and comparisons between cities, the study found that when the city’s economy develops to a certain level, the development of low-carbon tourism will be better. Moreover, differences in the development of low-carbon tourism result from differences in the economic and environmental dimensions rather than the social dimension, which generally shows the Matthew effect. Many previous studies on the evaluation of low-carbon tourism only conducted static analysis on data for 1 year (Shi et al., 2016; Zhang and Zhang, 2020), so they were unlikely to reveal the solidification of cities’ low-carbon development.
The key policy implications of this study are as follows: First of all, for cities that have unique tourism resources but are located in remote and underdeveloped areas, it is necessary to achieve sustained economic growth by insisting on high-quality development and providing sufficient economic carrying capacity for the development of the city’s low-carbon tourism industry. In the process of the city’s low-carbon development, the climbing stage of the environmental Kuznets curve will take a long time to pass, and it will not be easy to adhere to the goal of low-carbon development. Secondly, industrial cities located in cold regions, when developing low-carbon tourism, must overcome the dual dilemma of lagging economic growth and deterioration of the ecological environment. It is key that they must attach great importance to the long-term unresolved problem of environmental degradation (Lu et al., 2019) and coordinately promote the city’s low-carbon tourism and industrial transformation and upgrading. These cities need to develop green-oriented characteristic industrial tourism and form a structurally optimized, clean, and safe modern industrial system supported by new industries and led by green development. Finally, attention should be paid to the polarization in the development of low-carbon tourism. The central government should adopt more transfer payment methods, introduce ecological compensation mechanisms, improve ecological tourism industry standards, coordinate the promotion of low-carbon tourism development in various regions and cities, and achieve a “win-win” of poverty alleviation and low-carbon construction in each city.
This article has some shortcomings that should be addressed. For example, our evaluation indicator system and its weighting scheme may overemphasize the economic dimension. Therefore, follow-up studies can introduce more indicators of low-carbon environmental dimensions and low-carbon social dimensions. Non-provincial capital cities, other low-carbon pilot cities, and international tourism cities can also be used as evaluation objects to expand the scope of application of such evaluations and contribute to the development of low-carbon tourism in these cities. In addition, follow-up studies can try to establish normalized dynamic monitoring, control, and evaluation system for the development of cities’ low-carbon tourism and combine it with other indicators such as the evaluation indicator of ecological tourism in nature reserves and the evaluation indicator of ecological tourism health in nature reserves for a more extensive evaluation.
The original contributions presented in the study are included in the article/Supplementary Material. Further inquiries can be directed to the corresponding authors.
Conceptualization: SM and HL. Methodology: XC. Software: HZ. Formal analysis: SM and FL. Investigation: YS. Data curation: SM and HL. Writing—original draft preparation: SM and HL. All authors have read and agreed to the published version of the manuscript.
The authors declare that the research was conducted in the absence of any commercial or financial relationships that could be construed as a potential conflict of interest.
All claims expressed in this article are solely those of the authors and do not necessarily represent those of their affiliated organizations or those of the publisher, the editors, and the reviewers. Any product that may be evaluated in this article, or claim that may be made by its manufacturer, is not guaranteed or endorsed by the publisher.
The authors are grateful for the financial support provided by the National Natural Science Foundation of China (71463010, 72164007, and 71774071), Key Academic Research Project of Jiaxing University (ICCPR2021007), Zhenjiang Soft Science Research Project (RK2021010), and research participants for their suggestions for the design of this study.
Blancas, F. J., Lozano-Oyola, M., González, M., and Caballero, R. (2016). Sustainable Tourism Composite Indicators: a Dynamic Evaluation to Manage Changes in Sustainability. J. Sustain. Tourism 24 (10), 1403–1424. doi:10.1080/09669582.2015.1122014
Chen, L., Thapa, B., and Yan, W. (2018). The Relationship between Tourism, Carbon Dioxide Emissions, and Economic Growth in the Yangtze River Delta, China. Sustainability 10 (7), 2118. doi:10.3390/su10072118
Cheng, Q., Su, B., and Tan, J. (2013). Developing an Evaluation index System for Low-Carbon Tourist Attractions in China - A Case Study Examining the Xixi Wetland. Tourism Manage. 36, 314–320. doi:10.1016/j.tourman.2012.10.019
Cho, Y.-J., Wang, Y., and Hsu, L. L.-I. (2016). Constructing Taiwan's Low-Carbon Tourism Development Suitability Evaluation Indicators. Asia Pac. J. Tourism Res. 21 (6), 658–677. doi:10.1080/10941665.2015.1068193
Du, H., Chen, Z., Mao, G., Li, R. Y. M., and Chai, L. (2018). A Spatio-Temporal Analysis of Low Carbon Development in China's 30 Provinces: A Perspective on the Maximum Flux Principle. Ecol. Indicators 90, 54–64. doi:10.1016/j.ecolind.2018.02.044
Fu, Y., Liu, Y. J., and Wang, Y. L. (2010). Research on the Evaluation Method and Support System of the Low-Carbon City. China's population-Resources Environ. 20 (08), 44–47. doi:10.3969/j.issn.1002-2104.2010.08.008
Gao, L. J., Shang, X. Q., Yang, F. M., and Shi, L. Y. (2021). A Dynamic Benchmark System for Per Capita Carbon Emissions in Low-Carbon Counties of China. Energies 14 (3), 1–16. doi:10.3390/en14030599
Gössling, S., Hall, C. M., and Weaver, D. (2008). Sustainable Tourism Futures: Perspectives on Systems, Restructuring and Innovations. New York: Routledge. doi:10.4324/9780203884256
Grossman, G. M., and Krueger, A. B. (1995). Economic Growth and the Environment. Q. J. Econ. 110, 353–377. doi:10.1007/978-1-349-24172-9_210.2307/2118443
Guo, H., Yang, C., Liu, X., Li, Y., and Meng, Q. (2018). Simulation Evaluation of Urban Low-Carbon Competitiveness of Cities within Wuhan City Circle in China. Sustain. Cities Soc. 42, 688–701. doi:10.1016/j.scs.2018.04.030
Guo, S. H., and Wang, X. C. (2021). Research on the Policy Implementation Guarantee Mechanism for China's Goal of " Double Carbon "-Empirical Experience from Low-Carbon Pilot Cities. J. Beijing Univ. Tech. (Social Sci. Edition) 21 (06), 57–68. doi:10.12120/bjutskxb202106057
Hai, L. Y., Yang, X., and Han, W. H. (2013). A Study on the Index System for Evaluating Low Carbon Economy of Resource-Based Region Based on AHP. Amr 869-870, 935–941. doi:10.4028/www.scientific10.4028/www.scientific.net/amr.869-870.935
He, L., Zhang, X., and Yan, Y. (2021). Heterogeneity of the Environmental Kuznets Curve across Chinese Cities: How to Dance with 'shackles'? Ecol. Indicators 130, 108128. doi:10.1016/j.ecolind.2021.108128
Hu, Y. Y. (2014). Evaluation of Low-Carbon Tourism City Development Based on ANP. Tech. Manage. 16 (6), 13–17. doi:10.3969/j.issn.1008-7133.2014.06.003
Huo, W., Qi, J., Yang, T., Liu, J., Liu, M., and Zhou, Z. (2022). Effects of China's Pilot Low-Carbon City Policy on Carbon Emission Reduction: A Quasi-Natural experiment Based on Satellite Data. Technol. Forecast. Soc. Change 175, 121422. doi:10.1016/j.techfore.2021.121422
Khanna, N., Fridley, D., and Hong, L. (2014). China's Pilot Low-Carbon City Initiative: A Comparative Assessment of National Goals and Local Plans. Sustain. Cities Soc. 12, 110–121. doi:10.1016/j.scs.2014.03.005
Kim, J. H., King, B. E. M., and Kim, S. (2021). Developing a Slow City Tourism Evaluation index: a Delphi-AHP Review of Cittaslow Requirements. J. Sustain. Tourism 4, 1–23. doi:10.1080/09669582.2021.1897130
Li, Y. Y., Xian, Y. N., and Yin, C. X. (2017). Research on Evaluation Method of Low Carbon City Development - A Case Study of Four Municipalities in China. Ecol. Economy 33 (12), 46–51.
Liu, H. Y., and Zhang, J. C. (2020). Rural Tourism Sustainable Development Evaluation Index System Construction-Longnan City as an Example. Mod. Agriculture 08, 106–109.
Liu, S. M. (2021). Analysis of the Effectiveness of China's Environmental Protection Policy Based on Environmental Kuznets Curve. China's Collective Economy 26, 93–95.
Liu, W., and Qin, B. (2016). Low-carbon City Initiatives in China: A Review from the Policy Paradigm Perspective. Cities 51, 131–138. doi:10.1016/j.cities.2015.11.010
Liu, X. (2010). Low Carbon Tour: a Future Rural Tourism Model of Beijing. Soc. Sci. Beijing 1, 5. doi:10.3969/j.issn.1002-3054.2010.01.007
Lu, C., Li, W., Pang, M., Xue, B., and Miao, H. (2018). Quantifying the Economy-Environment Interactions in Tourism: Case of Gansu Province, China. Sustainability 10 (3), 711. doi:10.3390/su10030711
Lu, C., Wang, C., Zhu, W., Li, H., Li, Y., and Lu, C. (2015). GIS-based Synthetic Measurement of Sustainable Development in Loess Plateau Ecologically Fragile Area-Case of Qingyang, China. Sustainability 7 (2), 1576–1594. doi:10.3390/su7021576
Lu, X., Yao, S., Fu, G., Lv, X., and Mao, Y. (2019). Dynamic Simulation Test of a Model of Ecological System Security for a Coastal Tourist City. J. Destination Marketing Manage. 13, 73–82. doi:10.1016/j.jdmm.2019.05.004
Luo, Y., Mou, Y., Wang, Z., Su, Z., and Qin, Y. (2020). Scenario-based Planning for a Dynamic Tourism System with Carbon Footprint Analysis: A Case Study of Xingwen Global Geopark, China. J. Clean. Prod. 254, 119999. doi:10.1016/j.jclepro.2020.119999
Neaupane, K. M., and Piantanakulchai, M. (2006). Analytic Network Process Model for Landslide hazard Zonation. Eng. Geology. 85 (3-4), 281–294. doi:10.1016/j.enggeo.2006.02.003
Niu, D., Wu, G., Ji, Z., Wang, D., Li, Y., and Gao, T. (2021). Evaluation of Provincial Carbon Neutrality Capacity of China Based on Combined Weight and Improved TOPSIS Model. Sustainability 13 (5), 2777. doi:10.3390/su13052777
Pan, W., Gulzar, M. A., and Hassan, W. (2020). Synthetic Evaluation of China's Regional Low-Carbon Economy Challenges by Driver-Pressure-State-Impact-Response Model. Ijerph 17 (15), 5463–63. doi:10.3390/ijerph17155463
Peeters, P., and Dubois, G. (2010). Tourism Travel under Climate Change Mitigation Constraints. J. Transport Geogr. 18 (3), 447–457. doi:10.1016/j.jtrangeo.2009.09.003
Pérez, V., Hernández, A., Guerrero, F., León, M. A., da Silva, C. L., and Caballero, R. (2016). Sustainability Ranking for Cuban Tourist Destinations Based on Composite Indexes. Soc. Indic Res. 129 (1), 425–444. doi:10.1007/s11205-015-1110-7
Qun, B., and Peng, S. (2006). Economic Growth and Environmental Pollution: A Panel Data Analysis. Res. Financial Econ. Issues 8 (273), 3–17. doi:10.22459/TPCED.08.2006.15
Ruan, W., Li, Y., Zhang, S., and Liu, C.-H. (2019). Evaluation and Drive Mechanism of Tourism Ecological Security Based on the DPSIR-DEA Model. Tourism Manage. 75, 609–625. doi:10.1016/j.tourman.2019.06.021
Saaty, T. L., and Saaty, T. L. (1996). Decision Making with Dependence and Feedback: the Analytic Network Process. International 95 (2), 129–157. doi:10.1007/0-387-33987-6
Shi, B., Yang, H., Wang, J., and Zhao, J. (2016). City Green Economy Evaluation: Empirical Evidence from 15 Sub-provincial Cities in China. Sustainability 8 (6), 551. doi:10.3390/su8060551
Shi, F., Lu, Y., Wu, F., Wang, C., and Hsu, W.-L. (2021). Evaluation of Green Cities in the Drainage Area of China's Beijing-Hangzhou Canal. Water 13 (16), 2145. doi:10.3390/w13162145
Su, M., Zheng, Y., Yin, X., Zhang, M., Wei, X., Chang, X., et al. (2016). Practice of Low-Carbon City in China: The Status Quo and prospect. Energ. Proced. 88, 44–51. doi:10.1016/j.egypro.2016.06.014
Sun, H., Edziah, B. K., Kporsu, A. K., Sarkodie, S. A., and Taghizadeh-Hesary, F. (2021a). Energy Efficiency: The Role of Technological Innovation and Knowledge Spillover. Technol. Forecast. Soc. Change 167, 120659. doi:10.1016/j.techfore.2021.120659
Sun, H., Edziah, B. K., Sun, C., and Kporsu, A. K. (2021b). Institutional Quality and its Spatial Spillover Effects on Energy efficiencySocio-Economic Planning Sciences. Socio-Economic Plann. Sci., 101023. doi:10.1016/j.seps.2021.101023
Tan, S., Yang, J., Yan, J., Lee, C., Hashim, H., and Chen, B. (2017). A Holistic Low Carbon City Indicator Framework for Sustainable Development. Appl. Energ. 185, 1919–1930. doi:10.1016/j.apenergy.2016.03.041
Tang, Z., Shi, C. B., and Liu, Z. (2011). Sustainable Development of Tourism Industry in China under the Low-Carbon Economy. Energ. Proced. 5 (1), 1303–1307. doi:10.1016/j.egypro.2011.03.226
Tao, W. (2017). Multi-point Cooperative Multicast Video Design and Research. Coop. Economy Tech. 20, 36–38. doi:10.13665/j.cnki.hzjjykj.2017.20.014
Van Looy, B., Ranga, M., Callaert, J., Debackere, K., and Zimmermann, E. (2004). Combining Entrepreneurial and Scientific Performance in Academia: towards a Compounded and Reciprocal Matthew-Effect? Res. Pol. 33 (3), 425–441. doi:10.1016/j.respol.2003.09.004
Wang, F., Cao, Y. M., and Chen, S. (2020). Reflection on Environmental Kuznets Curve Hypothesis. Economics (Quarterly) 19 (1), 81–100. doi:10.13821/j.cnki.ceq.2019.04.04
Wang, M.-X., Zhao, H.-H., Cui, J.-X., Fan, D., Lv, B., Wang, G., et al. (2018). Evaluating green Development Level of Nine Cities within the pearl river delta, china. J. Clean. Prod. 174, 315–323. doi:10.1016/j.jclepro.2017.10.328
Wang, S., Sun, C., Li, X., and Zou, W. (2016). Sustainable Development in China's Coastal Area: Based on the Driver-Pressure-State-Welfare-Response Framework and the Data Envelopment Analysis Model. Sustainability 8 (9), 958. doi:10.3390/su8090958
Wang, Y., Fang, X., Yin, S., and Chen, W. (2021). Low-carbon Development Quality of Cities in China: Evaluation and Obstacle Analysis. Sustain. Cities Soc. 64 (9), 102553. doi:10.1016/j.scs.2020.102553
Wang, Y., Li, X., Kang, Y., Chen, W., Zhao, M., and Li, W. (2019). Analyzing the Impact of Urbanization Quality on CO2 Emissions: What Can Geographically Weighted Regression Tell Us? Renew. Sustain. Energ. Rev. 104, 127–136. doi:10.1016/j.rser.2019.01.028
Wang, Y. M. (2011). Construction and Empirical Analysis of Evaluation Index System for Sustainable Development of Urban Tourism - A Case Study of Five Cities in Southern Jiangsu. J. Nanjing Normal University(Natural Sci. Edition) 34 (2), 119–124. doi:10.3969/j.issn.1001-4616.2011.02.022
Wu, J. S., Xu, N., and Zang, X. W. (2016). Evaluation and Spatial Pattern Analysis of Low Carbon Cities in China. Adv. Geogr. Sci. 35 (3), 204–213. doi:10.18306/dlkxjz.2016.02.007
Yao, D., Ren, L. Y., Ma, R. F., Li, Z. K., and Wang, C. J. (2021). Analysis of the Spatial Pattern of Carbon Emission Intensity of Tourism in the Yangtze River Delta and its Influencing Factors. Ecol. Sci. 40 (02), 89–98. doi:10.14108/j.cnki.1008-8873.2021.02.012
Zhang, J. (2017). Evaluating Regional Low-Carbon Tourism Strategies Using the Fuzzy Delphi- Analytic Network Process Approach. J. Clean. Prod. 141 (10), 409–419. doi:10.1016/j.jclepro.2016.09.122
Zhang, J., and Zhang, Y. (2020). Assessing the Low-Carbon Tourism in the Tourism-Based Urban Destinations. J. Clean. Prod. 276 (2), 124303. doi:10.1016/j.jclepro.2020.124303
Zheng, L. C., Fu, J. F., and Li, J. S. (2011). Evaluation of China’s Provincial Low-Carbon Economic Development Level and its Spatial Process. China’s Popul. Resour. Environ. 21 (07), 80–85.
Keywords: low-carbon tourism city, evaluation, indicator system, ANP, carbon emission
Citation: Mao S, Li H, Cai X, Liu F, Zhong H and Song Y (2022) Evaluation of the Development Level of Low-Carbon Tourism in Chinese Cities. Front. Environ. Sci. 10:865946. doi: 10.3389/fenvs.2022.865946
Received: 30 January 2022; Accepted: 21 March 2022;
Published: 25 April 2022.
Edited by:
Huaping Sun, Jiangsu University, ChinaReviewed by:
Jun Zhao, School of Economics, Zhongnan University of Economics and Law, Wuhan, ChinaCopyright © 2022 Mao, Li, Cai, Liu, Zhong and Song. This is an open-access article distributed under the terms of the Creative Commons Attribution License (CC BY). The use, distribution or reproduction in other forums is permitted, provided the original author(s) and the copyright owner(s) are credited and that the original publication in this journal is cited, in accordance with accepted academic practice. No use, distribution or reproduction is permitted which does not comply with these terms.
*Correspondence: Xiang Cai, Z2RjeDA4MTZAMTI2LmNvbQ==; Fengqin Liu, bmJsaXVmZW5ncWluNjE3QDE2My5jb20=
Disclaimer: All claims expressed in this article are solely those of the authors and do not necessarily represent those of their affiliated organizations, or those of the publisher, the editors and the reviewers. Any product that may be evaluated in this article or claim that may be made by its manufacturer is not guaranteed or endorsed by the publisher.
Research integrity at Frontiers
Learn more about the work of our research integrity team to safeguard the quality of each article we publish.