 Hyo-Jun Bae
 Seong-Joong Kim
 Baek-Min Kim
 Hataek Kwon
95% of researchers rate our articles as excellent or good
Learn more about the work of our research integrity team to safeguard the quality of each article we publish.
Find out more
ORIGINAL RESEARCH article
Front. Environ. Sci. , 31 May 2022
Sec. Atmosphere and Climate
Volume 10 - 2022 | https://doi.org/10.3389/fenvs.2022.865775
This article is part of the Research Topic Extreme Events and Their Spatiotemporal Variability over Polar Regions View all 9 articles
On early February of 2020, two consecutive extreme warming events of three day interval at the similar location occurred over the Antarctic Peninsula (AP). The later event, that occurred on February 9, 2020, exhibited a second-highest temperature record of 15.5°C at Marambio station, located on Seymour Island, northeast of the AP. To understand the possible cause of the extreme warming event, we analyzed extreme warming events that occurred on Seymour Island during February over the past 40 years by using observational data from Marambio station alongside the European Center for Medium-Range Weather Forecasts Reanalysis v5 (ERA5) data. The results revealed that the extreme warming event on February 9, 2020 occurred due to the foehn and large-scale horizontal advection. In foehn winds, radiative heating and isentropic drawdown occur simultaneously. The horizontal advection of heat, which leads to extreme warming events, is associated with the strong blocking high in the upper and lower atmosphere. Contrary to the average characteristics of extreme warming events in February over the past 40 years, the extreme warming on February 9, 2020, occurred not only in the AP but also throughout entire West Antarctica.
On February 9, 2020, a temperature of 15.5°C was recorded at Marambio station (64°14′S, 56°37′W, altitude 198 m) located at Seymour Island, northeast of the AP (Figure 1). Three days earlier, on February 6, at Esperanza station (63°24′S, 57°00′W, altitude 24 m), located north of Marambio station (Figure 1), a temperature of 18.3°C the highest temperature in the entire Antarctic continent was recorded (Francelino et al., 2021). Considering that Marambio station is located at about 1° higher in latitude and about 170 m higher in altitude than Esperanza station, 15.5°C is a very high temperature.
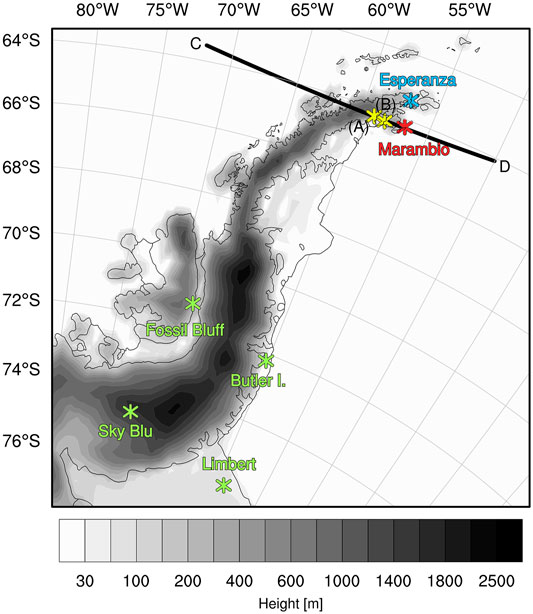
FIGURE 1. Station locations. Red asterisks represent locations of Marambio station, green asterisks represent Butler Island, Limbert station, Fossil Bluff and Sky Blu station, and blue asterisks represent Esperanza station. Yellow asterisks (A,B) represent locations selected from upstream of Marambio station. The (C,D) line represents the path of the vertical cross-section used in Figure 6. Shading represents topography from ERA5.
Figure 2 shows time series of daily maximum 2 m temperature in February from 1981 to 2020. According to the observation data from Marambio station, the daily maximum temperature anomaly of the 2020 event was ∼14.6°C higher than the average for the past 40 years, which was the second-highest record. Seven events exhibited a daily maximum temperature anomaly of >10°C with two events before 2000 and five events since 2000. In the past 40 years, there has been an increasing temperature trend of ∼1.5°C per 40 years at Marambio station in February (Figure 2). However, the contribution of linear trend in the 2020 extreme event was not significant since the trend observed at Marambio station is only 1.5°C increase per 40 years, which is much weaker compared to the warming magnitude of the extreme event.
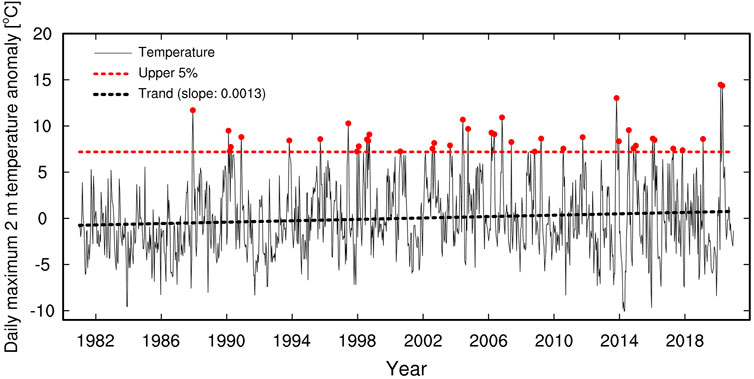
FIGURE 2. Time series of daily maximum 2 m temperature in February from 1981 to 2020. The daily climatological value is calculated based on the period 1981–2020. Black solid line, red dashed line and black dashed line represents temperature, upper 5% and trend, respectively. Red dots represent selected extreme warm events.
At the same time, a record-breaking surface melting occurred at the Larsen C ice shelf in the summer of 2019/2020 (Banwell et al., 2021). Zou et al. (2021) suggested that the foehn was one of the main drivers behind the surface melting of the Ross Ice Shelf. Geographically, the west of Seymour Island is characterized by a cordillera and on the east, the Weddell Sea. The cordillera with a height of ∼2,300 m, width of ∼100 km, and length of 1,500 km provide favorable conditions for foehn formation (Elvidge and Renfrew, 2016). Besides, the warming in the northeast of the AP is caused by strong westerlies, induced by positive Southern Annular Mode (SAM), promoting the foehn (Marshall et al., 2006; Orr et al., 2008; Elvidge et al., 2020). Elvidge and Renfrew (2016) summarized the foehn warming mechanism into isentropic drawdown, latent heating, precipitation, mechanical mixing, and radiative heating. Of these, isentropic drawdown occurs when the air mass is blocked on the upwind side with no possibility to rise. Consequently, another air mass with a potentially warm temperature, located at a higher altitude than the blocked air mass, blows to the downwind side, causing adiabatic compression (Beran 1967; Seibert 1990). Radiative heating occurs when the ridged surface of the mountain is heated by solar radiation, and the air is then heated by diabatic heat re-emitted from the heated ground. Takane and Kusaka (2011) coined the term “foehnlike wind” to denote this phenomenon.
Xu et al. (2021) reported that the extreme warming event observed at Esperanza station on February 6, 2020 was driven by foehn. According to the temperature tendency analysis, the vertical motion contributed the most substantially to the warming through foehn. As mentioned earlier, Esperanza station is located lower latitude and lower elevation than Marambio station. Moreover, no extreme warming event occurred on February 9, 2020 at Esperanza station (Francelino et al., 2021; Xu et al., 2021). Thus, the extreme warming event in Marambio station on February 9 is worth investigation. Most importantly, there are only few studies on extreme warming events on Seymour Island.
To address this gap, in this study, we elucidated the drivers of extreme warming events that occurred on February 9, 2020 and compared the features of extreme warming events with averaged atmosphere conditions for other extreme events that occurred on Seymour Island in February over the past 40 years.
We performed composite analysis for temperature, Mean Sea Level Pressure (MSLP), potential temperature, and wind in the West Antarctic area to elucidate the typical characteristics for extreme warming events on Seymour Island in February and compared these statistics with the 2020 event. The composite was created by averaging the anomalies of the extreme warming events in February on Seymour Island from 1981 to 2020. Extreme warming events are defined in this study as the days in the top 5% or higher of the daily maximum 2 m temperature anomaly, observed at Marambio station over the past 40 years. If consecutive extreme values are recorded during one year, only those that differ by more than 2 days from the higher extreme value are selected. Based on these criteria, 39 events were selected (Figure 2).
To analyze the causes of the warming on Seymour Island, we examined the temperature tendency based on (Holton, 2004), as follows:
where the left side of Eq. 1 reflects the time change in temperature, the first term on the right side represents horizontal advection, the second term on the right reflects adiabatic warming and vertical advection, and the last term on the right expresses diabatic heating. Here, T is the temperature, p is the pressure, R is the gas constant (287 J/kgK), and Cp is the static pressure specific heat (1004 J/kgK). Vertical advection was calculated using the temperatures at 1000 hPa and 850 hPa, while diabatic heating was calculated as a residual. To explain the process of heat transfer from upstream of Marambio station to Marambio station, we further investigated the temperature tendency at the point A (64.75°S, 59.80°W) and B (63.82°S, 58.51°W) located upstream of the Marambio station (Figure 1).
The daily mean ERA5 data with a horizontal resolution of 0.25° × 0.25° provided by the European Center for Medium-Range Weather Forecasts from 1989 to 2020 was utilized for the composite analysis. Hourly ERA5 data from 5 to 9 February was used to quantify the temperature tendency on Seymour Island. To investigate the atmospheric conditions on the AP during the 2020 extreme warming event, we used six-hourly 2 m temperature, wind speed, and wind direction observation data from the British Antarctic Survey at Marambio, Butler Island, Limber, Fossil Bluff, and Sky Blu station. Centering on the AP cordillera, Marambio, Butler Island, and Limbert station are located to the east, Fossil Bluff and Sky Blu station are located to the west from it (Figure 1). Detailed information of the stations and data is presented in Table 1. Note that because relative humidity observation data were not available at the stations, the ERA5 data were applied. In this study, D-day represents the day when the highest temperature occurred at Marambio station.
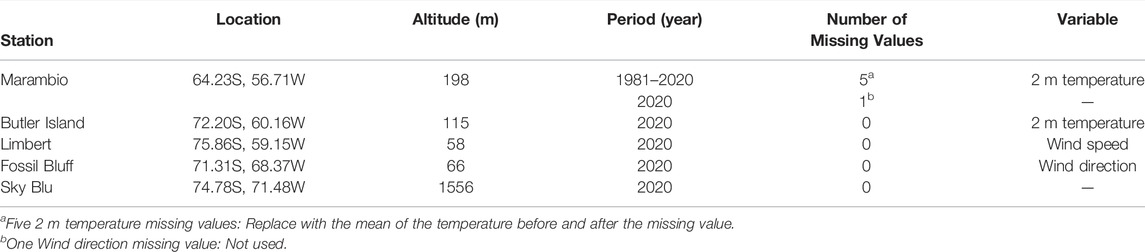
TABLE 1. Station and data information.
Figure 3 shows the six-hourly 2 m temperature, wind speed, and wind direction observed from D-4 to D-day at Marambio station (red), Butler Island (orange), Limbert (blue), Sky Blu (green), and Fossil Bluff (black). We found that the 2 m temperature increased at the stations located in the east from D-3 to D-day. Despite about 1°C increase in temperature at the stations located in the west, there was minimal increase compared to that at the east stations (Figure 3A). At Marambio station, the temperature decreased after extreme warming on D-3 and then gradually about 10°C increased again from D-1, reaching the maximum on D-Day. The relative humidity slowly decreased at Marambio station and rapidly decreased at Butler Island station on D-2. It increased at Limbert station from D-2 and remained above 90% at the western stations (Figure 3B). At the same time, the westerly wind blew from the stations located in the east, and the westerly or northerly wind blew from the stations located in the west (Figure 3D). The wind speed was estimated to be < 9 m/s at the four stations, except at Sky Blu. In the AP, warmer and dry air on the downwind side (rather than the upwind side along with the westerly wind) represents a typical feature when the foehn occurs (Barry 2008; Ahrens 2012). We also identified two peaks with wind speeds of >10 m/s at Marambio station (Figure 3C). Furthermore, the wind speed decreased on D-2 and increased again on D-1. Notably, this increase was similar to the temperature increase period.
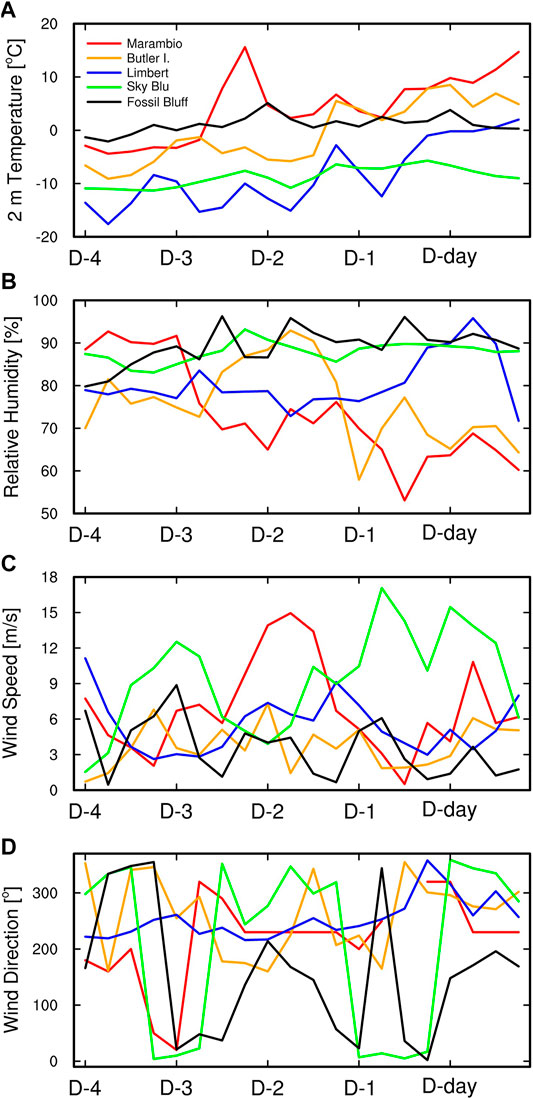
FIGURE 3. Time series of six-hourly 2 m temperature (A), °C, wind speed (C), m/s, wind direction (D), degree at Marambio (red), Butler Island (orange), Limbert (blue), Sky Blu (green), and Fossil Bluff (black) station. Relative humidity (B), % is ERA5 reanalysis grid point data nearest to observation stations.
Figure 4 shows the daily mean 2 m temperature anomalies (shading) and daily mean MSLP anomalies (contours) of the composite for the 40 years (top) and 2020 event (bottom) on D-4, D-2, and D-day. In the composite, on D-4, high pressure intensified at the southern tip of Chile, while low pressure increased in the Amundsen Sea. Warm and moist air can flow from the low-latitude ocean to high latitudes along these high-pressure and low-pressure surfaces, thereby causing the warming to the west of West Antarctica (Figure 4A). In D-2, the high pressure and low pressure moved eastward, and at the same time, the warmed area also moved eastward. The high pressure was strengthened, but the low pressure was further weakened on D-2 compared to those on D-4 (Figure 4B). The high pressure was even more enhanced on D-day, though the low pressure was found to be non-significant. The warming occurred mainly in the AP and was more robust in the east than in the west of the AP cordillera (Figure 4C). The high pressure intensified on D-day, thus, bringing warm and humid air from the low latitudes into the AP by westerly winds from the AP. The topography of the AP may have contributed to the development of the foehn. Thus, the enhanced high pressure at the southern tip of Chile was essential for the extreme warming registered at Marambio station.
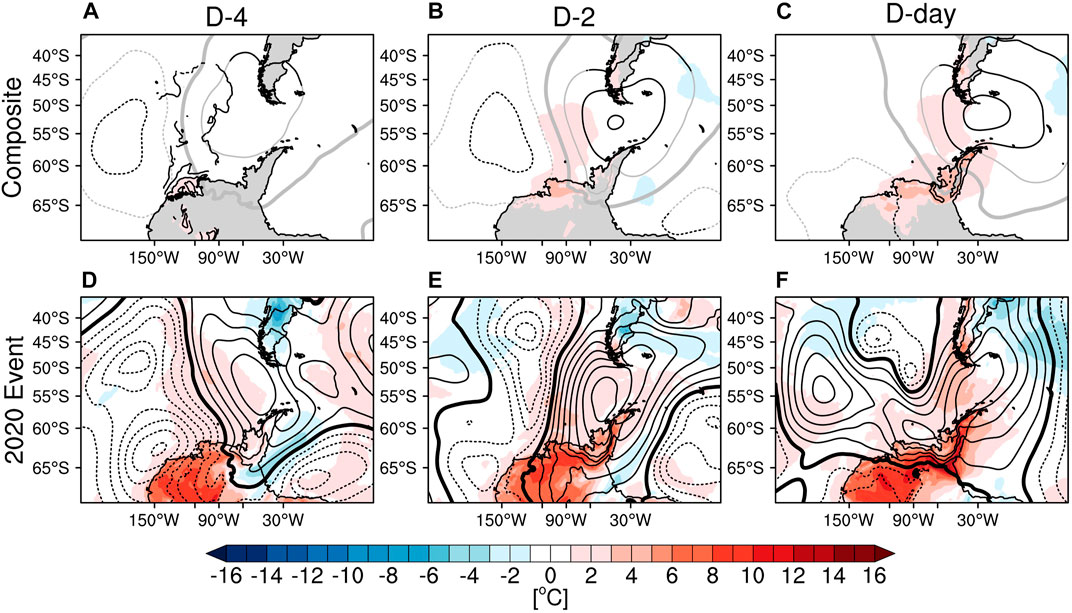
FIGURE 4. Daily mean 2 m temperature anomalies (shading, °C) and daily mean MSLP anomalies (contours, hPa) of composite (top) and 2020 event (bottom) in a region on D-4 (A,D), D-2 (B,E), and D-day (C,F). In the composite, black contours represent significant MSLP at 95% confidence level and the gray contours represent non-significant MSLP at the same level. Thick solid gray contour represents zero, thin black and gray dashed contours are negative, and thin black and solid contours are positive. Contour interval is 4 hPa. Daily mean 2 m temperature anomaly is shown only significant area at 95% confidence level (A–C). In the 2020 event, thick solid black contour represents zero, thin black dashed contours are negative, and thin black contours are positive. Contour interval is 4 hPa (D–F).
Overall, the 2020 event is similar to that of the composite. On D-day, the strongly developed high pressure was located at the southern tip of Chile in the Drake Passage, while more intense warming was registered in the east rather than in the west of the AP (Figures 4D–F). However, there were also some pattern differences between the 2020 event and the composites. In particular, in the composite, the high pressure was intense on D-day, but in the 2020 event, it was intense on D-2. Moreover, as the Amundsen Sea low being blocked by the enhanced high pressure on D-2 could not move eastward and remained in the Amundsen Sea until D-Day. Notably, these results are in line with the phenomenon reported by Xu et al. (2021). From D-2, the Amundsen Sea low started splitting, while on D-day, it was completely cut off and moved to the west coast of Chile and the other inland of West Antarctica, respectively (Figures 4E,F). Owing to the low cut-off located in western Chile, the atmospheric pressure pattern of the 2020 event facilitated the warm air flow from low to high latitudes, compared with the composite air pressure pattern. In the composite, the warming region moved eastward alongside the movement of the pressure system. However, it could not move eastward on D-Day of the 2020 event. Moreover, as the low pressure moved inland to Antarctica, the warming was identified not only in the AP but also in the entire West Antarctica.
Figure 5 shows the 500 hPa geopotential height (GPH) anomalies of the composite and 2020 event in the same space and time as in Figure 4. We identified a condition, resembling the MSLP pattern, thereby indicating a barotropic feature. In the composite, from D-4 to D-day, while high pressure and low pressures moved to the east, high pressure was strengthened, while low pressure was weakened (Figures 5A–C). In other words, Seymour Island experienced the extreme warming events with well-developed high pressure from the lower to the upper layers in the Drake Passage. We found that the 2020 event was also manifested in the form of high pressure and low pressure moving eastward from D-4 to D-day. At D-2, while low pressure weakens, high pressure was more intensified than D-4. Furthermore, the cut-off low was discerned in the upper layer on D-2, while higher potential temperatures and downdrafts were registered in the upper-level anticyclones as shown below.
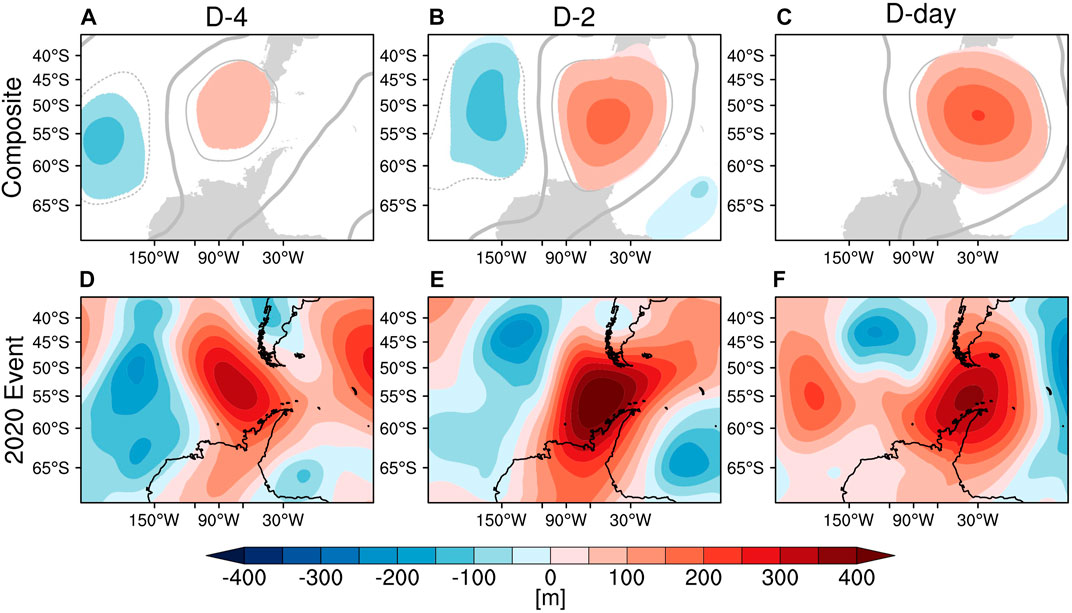
FIGURE 5. A 500 hPa GPH anomaly (m) of composite and 2020 event in the same space and time as in Figure 4. In the composite, the shading and gray contours represent significant and non-significant areas, respectively, at 95% confidence level. Contour interval is 50 m (D–F).
Figure 6 shows the vertical cross-section of daily mean potential temperature and wind anomaly on February 9, 2020 and the composite along the C-D line shown in Figure 1. In the composite, a positive potential temperature anomaly emerged in the upper layer on D-2, and the maximum value of positive anomaly moved eastward over time. This condition (Figures 6A–C) was the same as the movement of the upper-level anticyclones to the east (Figures 5A–C). On D-1, we identified an updraft along the windward side, whereas the mountain blocked the updraft. Moreover, the air of warm potential temperature at a higher altitude was blown downwind side, thereby causing the isentropic drawdown on the downwind side. On D-day, this phenomenon was found to be stronger. The maximum potential temperature anomaly emerged at 1500 m or higher on D-1 but emerged at the layers between 700 and 1500 m on D-day. Notably, this isentropic drawdown is meteorological evidence of foehn.

FIGURE 6. Daily mean potential temperature anomaly (shading, K) and daily mean u-z wind (m/s) anomaly (vector, ref. 5 m/s) vertical cross section of composite and 2020 event on D-2 (A,D), D-1 (B,E), and D-day (C,F). Green asterisk is the location of Marambio station. The y-axis represents altitude (m), and the x-axis represents longitude (degree). In the composite, only significant area is displayed at 95% confidence level.
The same phenomenon was identified for the 2020 event. On D-2, there was a positive potential temperature anomaly in the upper layer, and the maximum anomaly moved eastward over time (Figures 6D–F; Figures 5D–F). In the 2020 event, unlike the composite, on D-2, a warmer potential temperature anomaly emerged in the upper layer than D-day. This finding is consistent with the 500 hPa GPH anomaly being higher than D-day on the D-2. On D-day, the upwind side airflow was blocked, and air at a higher altitude, rather than the blocked airflow, blew downwind. At the same time, isentropic drawdown occurred at the leeward side. However, the airflow descending from the downwind side appeared to be weaker than that in the composite side, which can be deemed as one of the drivers for the weak isentropic drawdown.
Figure 7 shows the time series of temperature tendency at the point A, B, and Marambio station from D-4 to D-day. At the point A and B, Diabatic heating (blue solid line) is the main contributor of the warming from D-2 to D-day. Adiabatic warming (black solid line) also contributes to warming, except for the D-2. Vertical advection (black dashed line) tends to show out of phase with adiabatic warming, but its magnitude is much smaller than that of adiabatic warming. Horizontal advection (red solid line) contributes to warming only at the point B from D-1 to D-day (Figures 7A,B). Unlike points A and B, adiabatic warming and horizontal advection simultaneously contribute the most to warming at Marambio station (e.g., a region of interest) from D-2 to D-day. Diabatic heating, on the other hand, contributed to the cooling (Figure 7C).
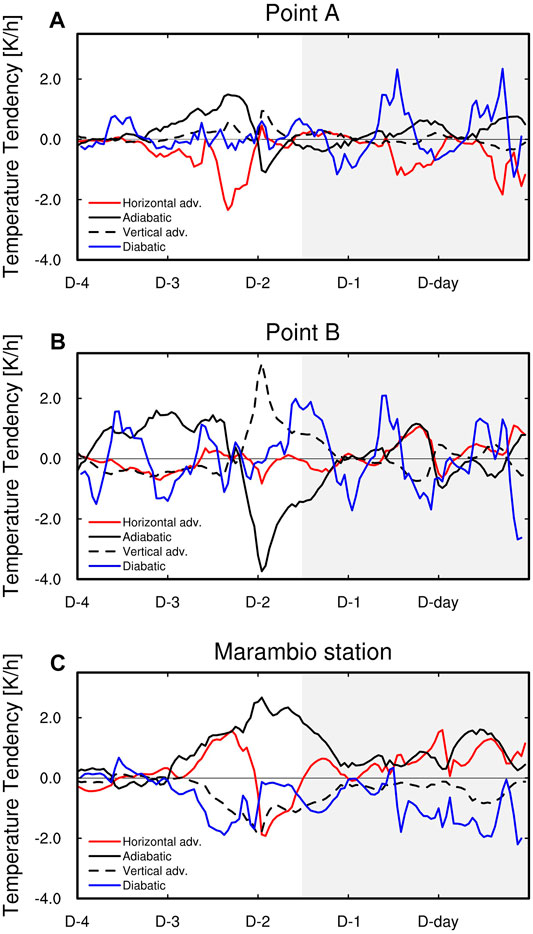
FIGURE 7. Time series of temperature tendency (K/h) at the point A (A), point B (B), Marambio station (C). The contributions of horizontal advection (red solid line), adiabatic warming (black solid line), vertical advection (black dashed line), and diabatic heating (blue solid line) to temperature variations at 2 m from ERA5 for each point from D-4 to D-day. Gray shading is the period that affected the February 9 warming.
We argue that the large contribution of diabatic heating upstream of Marambio station was related to the blocking high. Given the influence of high-pressure persistence for several days, solar radiation increased, and the surface heated by the increased solar radiation re-emitted via the sensible heat. In turn, the air was heated by re-emitted sensible heat. Finally, the heated air was delivered to Marambio station through horizontal advection. This process was fundamentally the same as the radiative heating of the foehn warming mechanism. Adiabatic warming in the upstream region have exacerbated this process as well (Figures 7A,B).
Despite the increase in the solar radiation, the contribution of diabatic heating term to cooling in Marambio station could emerge owing to its geographic location naturally heavily influenced by the ocean. Because Marambio station is located very close to the Weddell Sea, even after solar radiation, the surface is not heated quickly owing to the high specific heat of the ocean, and only the atmosphere continues warming, thereby generating a downward sensible heat flux.
In Marambio station, the two warm events on D-3 and D-day occurred under the same high pressure system (Figure 4). For both cases, temperature increase occurred by a combination of adiabatic warming and horizontal heat advection. But there is a difference between the two events. On D-3, the temperature increased rapidly with adiabatic warming and horizontal heat advection by the intense high pressure. As described in the introduction, strong westerlies promote the foehn (Marshall et al., 2006; Orr et al., 2008; Elvidge et al., 2020). The small contribution of adiabatic warming by isentropic drawdown and horizontal heat advection from D-2 to D-day compared to D-3 is due to westerly wind speed. The increase and decrease of the adiabatic warming contribution are consistent with increases and decreases in wind speed at Marambio station (Figure 7C; Figure 3C). Despite this small contribution of adiabatic warming and horizontal heat advection compared to D-3, the temperature at Marambio station gradually increased by blocking high from D-2 to D-day (Figure 3A).
Meanwhile, the extreme warming event on day D-3 occurred on the same day as the event observed at the Esperanza station. However, the warming mechanism of the events observed at the two stations is different. The contribution of horizontal advection is negative at Esperanza station (Xu et al., 2021), but it is positive at the Marambio station. As mentioned in the introduction, this may be caused by the difference in location and topography between the two stations.
The heat transfer process by horizontal advection of Marambio station described in this study is not the result of quantitative analysis. In addition, although the ERA5 reanalysis data used to calculate the temperature tendency was high-resolution, there was a difference in the actual altitude and topography from the observation stations (Marambio-111 m, Butler I.-81 m, Fossil Bluff-246 m and Sky Blu-14 m). Lagrangian analysis using the trajectory model has been performed in several studies to identify the cause of the foehn quantitatively (Elvidge and Renfrew, 2016; Nishi and Kusaka, 2019; Xu et al., 2021). In addition, model simulation applying detailed topography will be able to improve the effect of difference in altitude. Previous studies used Polar-optimized version of the Weather Research and Forecasting (PWRF) model to investigate the foehn in the West Antarctica (Steinhoff et al., 2013; Steinhoff et al., 2014; Zou et al., 2021). Lagrangian analysis using the PWRF model is thought to be able to identify the cause of the foehn more clearly, and this will be applied in future studies.
In this study, we investigated the features of extreme warming events that occurred on Seymour Island in February over the past 40 years by using composite analysis. We compared these features with the drivers of the strongest warming event that occurred on February 9, 2020 in Marambio station. As a result, we provided an evidence that the major contribution of the 2020 extreme warming event at Marambio station was combined effect of horizontal advection and adiabatic warming by the foehn, which are adiabatic processes in principle. The contribution of horizontal advection is a result of diabatic heating mechanism. The foehn, caused by blocking highs and the topography of the AP continued to increase temperatures on Seymour Island, thereby inducing the maximum warming on February 9, 2020.
Over the past 40 years, in February, the extreme warming at Marambio station was associated with the high pressure developing strongly in the upper and lower layers and was also linked to the foehn. Of the foehn warming mechanisms, the isentropic drawdown mechanism appears to have a significant contribution (Figure 6C). Also, on the day with the extreme warming event at Marambio station, the warming notably occurred in the AP. The extreme warming of February 9, 2020, was similar, but extreme warming occurred not only in the AP but also throughout the entire West Antarctica due to the split of the Amundsen Sea low.
The original contributions presented in the study are included in the article/Supplementary material, further inquiries can be directed to the corresponding authors.
H-JB, S-JK, and B-MK initiated and coordinated the work. H-JB wrote the manuscript and S-JK, B-MK, and HK revised it.
This study was supported by the project “Understanding of Antarctic climate and environment and assessments of global influence” (PE22030) of Korea Polar Research Institute. This work was also partly supported by the project titled ‘Investigation and prediction system development of marine heatwave around the Korean Peninsula originated from the subarctic and western Pacific’, funded by the Korean Ministry of Oceans and Fisheries (20190344) and the National Research Foundation of Korea (NRF) grant funded by the Korea government (NRF-2020R1A2C1014679).
We thank the European Centre for Medium-Range Weather Forecasts (ECMWF) for the ERA5 reanalysis data, the British Antarctic Survey for observation data. And we thank the two reviewers for their helpful suggestions.
The authors declare that the research was conducted in the absence of any commercial or financial relationships that could be construed as a potential conflict of interest.
All claims expressed in this article are solely those of the authors and do not necessarily represent those of their affiliated organizations, or those of the publisher, the editors and the reviewers. Any product that may be evaluated in this article, or claim that may be made by its manufacturer, is not guaranteed or endorsed by the publisher.
Ahrens, C. D. (2012). Meteorology Today: An Introduction to Weather, Climate, and the Environment. Belmont, CA: Brooks Cole, 640.
Banwell, A. F., Datta, R. T., Dell, R. L., Moussavi, M., Brucker, L., Picard, G., et al. (2021). The 32-year Record-High Surface Melt in 2019/2020 on the Northern George VI Ice Shelf, Antarctic Peninsula. Cryosphere 15, 909–925. doi:10.5194/tc-15-909-2021
Barry, R. G. (2008). Mountain Weather and Climate. 3rd ed. Boulder: Cambridge University Press, 506.
Beran, D. W. (1967). Large Amplitude Lee Waves and Chinook Winds. J. Appl. Meteor. 6, 865–877. doi:10.1175/1520-0450(1967)006<0865:lalwac>2.0.co;2
Elvidge, A. D., Kuipers Munneke, P. K., King, J. C., Renfrew, I. A., and Gilbert, E. (2020). Atmospheric Drivers of Melt on Larsen C Ice Shelf: Surface Energy Budget Regimes and the Impact of Foehn. J. Geophys. Res. Atmos. 125, 1–25. doi:10.1029/2020jd032463
Elvidge, A. D., and Renfrew, I. A. (2016). The Causes of Foehn Warming in the Lee of Mountains. Bull. Am. Meteorol. Soc. 97, 455–466. doi:10.1175/bams-d-14-00194.1
Holton, J. R. (2004). An Introduction to Dynamic Meteorology. 4th edn. San Diego: Academic Press, 58–59.
Marshall, G. J., Orr, A., Van Lipzig, N. P. M., and King, J. C. (2006). The Impact of a Changing Southern Hemisphere Annular Mode on Antarctic Peninsula Summer Temperatures. J. Clim. 19, 5388–5404. doi:10.1175/jcli3844.1
Nishi, A., and Kusaka, H. (2019). Effect of Foehn Wind on Record-Breaking High Temperature Event (41.1°C) at Kumagaya on 23 July 2018. SOLA 15, 17–21. doi:10.2151/sola.2019-004
Orr, A., Marshall, G. J., Hunt, J. C. R., Sommeria, J., Wang, C.-G., van Lipzig, N. P. M., et al. (2008). Characteristics of Summer Airflow over the Antarctic Peninsula in Response to Recent Strengthening of Westerly Circumpolar Winds. J. Atmos. Sci. 65, 1396–1413. doi:10.1175/2007JAS2498.1
Seibert, P. (1990). South Foehn Studies since the ALPEX Experiment. Meteorl. Atmos. Phys. 43, 91–103. doi:10.1007/BF01028112
Skansi, M. d. L. M., Colwell, S., Bromwich, D. H., Jones, P., King, J. C., Lazzara, M. A., et al. (2021). WMO Evaluation of Two Extreme High Temperatures Occurring in February 2020 for the Antarctic Peninsula Region. Bull. Am. Meteorol. Soc. 102, E2053–E2061. doi:10.1175/BAMS-D-21-0040.1
Steinhoff, D. F., Bromwich, D. H., and Monaghan, A. (2013). Dynamics of the Foehn Mechanism in the McMurdo Dry Valleys of Antarctica from Polar WRF. Q.J.R. Meteorol. Soc. 139, 1615–1631. doi:10.1002/qj.2038
Steinhoff, D. F., Bromwich, D. H., Speirs, J. C., McGowan, H. A., and Monaghan, A. J. (2014). Austral Summer Foehn Winds over the McMurdo Dry Valleys of Antarctica from Polar WRF. Q.J.R. Meteorol. Soc. 140, 1825–1837. doi:10.1002/qj.2278
Takane, Y., and Kusaka, H. (2011). Formation Mechanisms of the Extreme High Surface Air Temperature of 40.9°C Observed in the Tokyo Metropolitan Area: Considerations of Dynamic Foehn and Foehnlike Wind. J. Appl. Meteorol. Climatol. 50, 1827–1841. doi:10.1175/JAMC-D-10-05032.1
Xu, M., Yu, L., Liang, K., Vihma, T., Bozkurt, D., Hu, X., et al. (2021). Dominant Role of Vertical Air Flows in the Unprecedented Warming on the Antarctic Peninsula in February 2020. Commun. Earth Environ. 2, 133. doi:10.1038/s43247-021-00203-w
Keywords: hot event, Seymour island, horizontal advection, adiabatic warming, insentropic drawdown
Citation: Bae H-J, Kim S-J, Kim B-M and Kwon H (2022) Causes of the Extreme Hot Event on February 9, 2020, in Seymour Island, Antarctic Peninsula. Front. Environ. Sci. 10:865775. doi: 10.3389/fenvs.2022.865775
Received: 30 January 2022; Accepted: 12 May 2022;
Published: 31 May 2022.
Edited by:
Lujun Zhang, Nanjing University, ChinaReviewed by:
Weijun Sun, Shandong Normal University, ChinaCopyright © 2022 Bae, Kim, Kim and Kwon. This is an open-access article distributed under the terms of the Creative Commons Attribution License (CC BY). The use, distribution or reproduction in other forums is permitted, provided the original author(s) and the copyright owner(s) are credited and that the original publication in this journal is cited, in accordance with accepted academic practice. No use, distribution or reproduction is permitted which does not comply with these terms.
*Correspondence: Seong-Joong Kim, c2Vvbmdqa2ltQGtvcHJpLnJlLmty; Baek-Min Kim, YmFla21pbkBwa251LmFjLmty
Disclaimer: All claims expressed in this article are solely those of the authors and do not necessarily represent those of their affiliated organizations, or those of the publisher, the editors and the reviewers. Any product that may be evaluated in this article or claim that may be made by its manufacturer is not guaranteed or endorsed by the publisher.
Research integrity at Frontiers
Learn more about the work of our research integrity team to safeguard the quality of each article we publish.