 Yuanyuan Luo1
 Yanfang Liu
94% of researchers rate our articles as excellent or good
Learn more about the work of our research integrity team to safeguard the quality of each article we publish.
Find out more
ORIGINAL RESEARCH article
Front. Environ. Sci., 13 May 2022
Sec. Environmental Informatics and Remote Sensing
Volume 10 - 2022 | https://doi.org/10.3389/fenvs.2022.864966
This article is part of the Research TopicTowards Sustainable Urban Development: Use of Geographic Big Data for Spatial PlanningView all 25 articles
The COVID-19 pandemic has led to a burgeoning demand for active travel (walking or cycling), which is a healthy, pollution-free, and affordable daily transportation mode. Park green space (PGS), as an open natural landscape, have become a popular destination for active travel trips in metropolitan areas. Pedestrians and cyclists are often at high crash risk when exposed to complicated traffic environments in urban areas. Therefore, this study aims to propose a safety assessment framework for evaluating active travel traffic safety (ATTS) near PGS from the perspective of urban planning and exploring the effect of the point-of-interest (POI) aggregation phenomenon on ATTS. First, links between ATTS and the environment variables were investigated and integrated into the framework using the catastrophe model. Second, the relationship between the POI density and ATTS was investigated using three spatial regression models. Results in the Wuhan Metropolitan Area as a case study have shown that (1) the population density, road density, nighttime brightness, and vegetation situation near PGS have pronounced effects on ATTS; (2) pedestrians near PGS enjoy safer road facilities than cyclists. Active travel traffic near PGS requires more attention than non-park neighborhoods; (3) among four park categories, using active travel to access theme parks is the safest; and (4) SEM has the best fit for POI cluster research. Increases in leisure facility density and residence density may lead to deterioration and improvement in ATTS safety levels near PGSs, respectively. The safety framework can be applied in other regions because the selected environment indicators are common and accessible. The findings offer appropriate traffic planning strategies to improve the safety of active travel users when accessing PGS.
The importance of safety in urban transport and mobility has been recognized in achieving the globally discussed and accepted goals for human development (Poku-Boansi et al., 2019). Road traffic injuries are one of the top 10 causes of death in the world. The World Health Organization (WHO) reported that approximately 1.35 million people die in road traffic accidents every year, while 93% of global road deaths occur in middle- and low-income countries (World Health Organization, 2018). In China, vulnerable road users (i.e., pedestrians, motorcyclists, and pedal cyclists) accounted for more than 70% of the road traffic deaths between 2006 and 2016 (Wang et al., 2019). The crash risk of pedestrians, motorcyclists, and pedal cyclists in urban areas is often higher than that of vehicle users due to their vulnerable characteristics when exposed to complicated traffic environments. However, in most Chinese cities, pedestrian and cyclist infrastructure and travel safety are yet to receive any major attention in terms of research, policies, and interventions. As the number of pedestrians and cyclists actively traveling increases, the risk of injury prompts the in-depth evaluation of route safety (Brown et al., 2017).
Park green space (PGS) plays a significant role in modern society, especially under giant working and psycho pressure (Ekkel and de Vries, 2017; Yang et al., 2019). Due to the purpose of health, most people choose a method of active travel (walk or cycle) to access park green spaces, which have been the main places for leisure and sports. Especially when residences are in the service range of PGS, they are willing to improve their physical activity, psychological restoration, and social contacts by access to PGS with active travel three to four times a week. Recent literature has studied various integrated indexes of walkability to PGS including safety, convenience, comfortability, and accessibility since the walk score was released (Lee and Hong, 2013; Lwin and Murayama, 2011; Xu et al., 2017). As residents access parks searching for recreation and relaxation, safety guarantees have an important influence on their decision (Wang et al., 2015). However, it is common to see many studies examine the methodology of the parks’ internal safety evaluation by multi-criteria but fail to evaluate roadside safety facilities (Baran et al., 2018; Zavadskas et al., 2019). In addition, previous studies mainly conducted in developed Western countries; specialization in the safety index system is urgently needed for developing nations due to incomplete road facilities.
This study uses the Wuhan Metropolitan Area as an example and proposes the ATTS assessment framework based on road units, which includes safety assessment and sociodemographic factor analysis. The safety assessment uses the catastrophe model based on several environmental parameters. Sociodemographic factors were analyzed by converting POI density using kernel density estimation (KDE), followed by OLS, spatial error model (SEM), and spatial lag model (SLM) to explain the macroscopic distribution of AT accidents. We cannot be optimistic about ATTS because the safety situation is not fairly distributed within urban settings. The findings offer appropriate traffic planning strategies to improve the safety of active travel users.
This study contributes to the existing literature in various aspects: 1) an objective and systematic assessment framework for ATTS is first presented; 2) the correlation between various built environment parameters near PGS and active travel crash frequency is investigated; 3) the active travel safety status of roads near four types of parks is evaluated and; 4) the potential effects of the POI aggregation phenomenon near PGS reflected by the ATTS spatial distribution is explored.
The rest of this article is organized as follows: Section 2 reviews the existing literature on the influencing factors of ATTS and presents an overview of the socioeconomic parameters that may affect safety inequity. The methodology and the materials adopted are discussed in Section 3. Section 4 shows the results of the ATTS framework, which comprise the safety assessment and spatial regression. Section 5 presents the research arguments and discusses the determinants of ATTS. Finally, in Section 6, our main conclusions are drawn, while future avenues for research are suggested.
A large proportion of traffic fatalities occur inside urban and metropolitan areas, where the risk factors associated with congestion and high densities of vehicles and pedestrians coexist (Vorko-Jović et al., 2006; Dumbaugh and Rae, 2009). Traffic characteristics (such as traffic flow and speed) and road characteristics (such as road geometry and the quality of infrastructure) may affect road accidents (Ayati and Abbasi, 2011; Lord et al., 2005; Martin, 2002; Wang et al., 2009). The behaviors of vehicle drivers and pedestrians (e.g., driving speed and the use of seat belts) and the change in environmental variables (e.g., road conditions and traffic lights) have been investigated in a previous study related to urban accidents (Ramírez and Valencia, 2021). Walking and cycling have been examined separately in multiple studies at varying depths. Active travel consisting of both has become a trend. However, no studies have been conducted to examine road safety in the built environment for walking and cycling in a unified framework.
Neighborhoods near parks may represent a higher risk of collision injury or death because they attract more susceptible road users. Young energetic tourists and elderly residents may congregate in areas around parks. When it comes to transportation to parks, children prefer to use active transportation (Pont et al., 2009). The elderly are more likely to walk, rather than ride a bike to a local park (Duan et al., 2018). Therefore, active travelers in general are more susceptible in the absence of adequate infrastructure.
In the literature, the risk factors for pedestrian and cyclist–motor vehicle accidents have been mainly examined from the aspects of active travel users’ characteristics, road conditions, and the environment surrounding the accident site. Children and old pedestrians are prone to motor vehicle accidents (O׳Hern and Oxley, 2015; Poku-Boansi et al., 2019; Smith et al., 2020; Värnild et al., 2020; Yee et al., 2006). Road conditions, which comprise road network design and center turning lane settings, the number of traffic lanes, and road demarcation, are important risk factors for the occurrence of pedestrian and cyclist accidents (Shankar et al., 2003; Hess et al., 2004; Donroe et al., 2008). Environmental factors such as location, traffic volume, road lighting, and the time of the day may significantly affect the likelihood of pedestrian and cyclist accidents (Simončič, 2001; Shankar et al., 2003; Wier et al., 2009; Miranda-Moreno et al., 2011). The risk of pedestrian and cyclist injury is relatively high in areas with heavy traffic (Zhang et al., 2014). Findings indicate that pedestrian and cyclist injury or death may easily occur at intersections without traffic lights (Moudon et al., 2011; Hu et al., 2018).
The existing literature focuses on the effects of active travel users’ personal characteristics, such as age, gender, and income, on ATTS. However, no studies have been conducted to compare the variability and injury risk of active traffic accidents due to differences in the environment near various types of parks and explain the macroscopic distribution of active traffic accidents using a three-class spatial regression model. In addition, some specific ATTS risk factors such as road infrastructure (motorized and nonmotorized road facilities) and various urban traffic regulations (i.e., trunk roads, secondary trunk roads, and branch ways) should be taken into consideration.
This study on active travel-involved crashes covers a wide range of factors, which comprise the characteristics of road user behavior. Strong correlations between objective indicators of the built environment and traffic safety are well documented (Saha et al., 2020). Previous studies on the microlevel (road, segments, and intersections) examined the relationship between road safety and various parameters, such as built environment features (Clifton et al., 2009; Galanis et al., 2017). From the perspective of traffic safety, it is proposed that studying traffic characteristics, roadway characteristics, physical characteristics, and POI characteristics can help promote an understanding of the relationship between the built environment and active travel crashes.
Accidents usually occur when traffic moves. Therefore, investigating traffic characteristics to understand their influence on ATTS is significant (Golob and Recker, 2004; Lord et al., 2005). Increases in traffic volume are associated with an increase in the total crash frequency; hence, the effects of traffic exposure and land use characteristics are based on this (Wier et al., 2009; Lee et al., 2015). Various studies have associated greater traffic exposure with a higher frequency of accidents and accident severity (Abdel-Aty et al., 2013). For the improvement of ATTS, environmental indicators are also considered. Traffic calming is a significant transport intervention for population health, which decreases the negative influences of motor vehicles (Morrison et al., 2003; Pucher et al., 2010). Increasing the amount of walking and cycling is an effective way of reducing the chances of incurring injuries (Jacobsen, 2003).
Based on the engineering theory, roads play a significant role in road safety. Improved geometry design and infrastructure could help improve road safety, including ATTS (Noland, 2003; Noland and Oh, 2004). Among the road facilities, sidewalks are a major component of the transportation network and should provide pedestrians with safe, healthy, and attractive walking conditions (Aghaabbasi et al., 2018). The influence of environmental factors on walking, such as sidewalks, has contributed to the development of various measurements of the effects of environmental factors on walking but lacks the macro-level evaluation (Cunningham et al., 2005). Bicycle lanes may lessen the risks for bicycle riders by preventing crashes against motor vehicles, reducing the burden of traffic injuries, improving the sense of safety, and promoting greater participation in cycling. Bicycle lanes have several types: exclusive, shared, and parking lanes; marked wide curbside lanes; and curbside bicycle lanes. Among these types, only exclusive bicycle lanes are associated with decreased accidents, while greater separation provides better protection for cyclists and traffic (Morrison et al., 2019). Guardrails are installed as guides to safe crossing areas and prevent pedestrians from bursting into the road (Retting et al., 2003). In London, accidents at sites with guardrails are reportedly 2.5 times lower than those in areas without such facilities (Zheng et al., 2007). The study shows the importance of sidewalks, bicycle lanes, and guardrails in ATTS. The construction of pedestrian crossing facilities has become the main choice for reducing the negative effect of roads on pedestrians at the cost of crossing convenience. However, building these road facilities using observational and GIS measures requires investments in staff, training, data management, and high-quality data in numerous locations. Using street view can solve these problems (Brownson et al., 2009).
Physical environments exert influences that can facilitate or mitigate traffic safety. The correlation of nighttime brightness and vegetation with urban safety is generally assessed as a significant social humanities environment aspect. Street lighting is a necessary urban feature for improving the clarity when driving (Xu et al., 2018), while vegetation, as an along-street physical environment, may influence safety (Wolfe and Mennis, 2012; Fitzpatrick et al., 2014). Street lighting, walking and cycling paths, and street monitoring by buildings relate to personal safety when people actively travel (Administration, 1992). These two factors show various correlations with urban safety in various regions; thus, the effect of nighttime brightness and vegetation on active traffic safety and its intensity in Wuhan is explored in our study.
While POI data are not a typical factor used in traditional traffic accident analysis, it is specific to land use factors with precise location information (Jia et al., 2018). Previous studies have confirmed that the number, density, and distribution of POIs are significantly correlated with human–vehicle crashes (Kuo and Lord, 2021; Brühwiler et al., 2022; Zhu et al., 2022). Diverse POI types such as hospitals, markets, banks, hospitals, residential areas, and restaurants are often used as the main study subjects (Ng et al., 2002; Jia et al., 2018; Lee et al., 2018).
According to systematic reviews, the physical activities of adults, which include active travel, are affected by the safety environmental attributes from the physical and sociocultural perspectives (Wendel-Vos et al., 2007). However, their research mainly focuses on traffic control, natural monitoring, and concrete driving scene but lacks a general framework with strong application for evaluating the relationship between the built environment and road space.
The integration of transportation modes, which coordinates the harmony of transport modes, such as pedestrian, bicycle, and motor vehicle, is an important issue for urban transportation system safety (Saplıoğlu and Aydın, 2018). Obtaining the ATTS level involves a multi-attribute assessment, and combining indicators to form an effective safety assessment system is challenging. Various studies have focused on the integration method, including the traditional AHP (Żak and Kruszyński, 2015), the AHP with GIS (Saplıoğlu and Aydın, 2018; Zheng et al., 2019), and its hybrid approach based on SERVQUAL and fuzzy TOPSIS (Awasthi et al., 2011; dos Santos et al., 2019; Vavrek and Chovancová, 2019). Quantitative studies on road safety facilities have focused on questionnaire preference surveys (Räsänen et al., 2007; Demiroz et al., 2015; Anciaes and Jones, 2018). For the aforementioned methodologies, an integrated level or index is formulated by assigning weights to the selected indicators via expert evaluation or interview questionnaires. This method is time-consuming and labor-intensive and has a certain degree of subjectivity. Traditional methods are criticized for incorporating inherent uncertainty and their inability to avoid subjectivity (Zhou et al., 2019).
Unlike the aforementioned methods with subjectivity and uncertainty, the catastrophe theory (CT) can explain the internal mechanism of all indicators’ influences on ATTS. The CT has been used to simulate the sudden and inconsecutive phenomena in the natural world (Thom, 1976). According to the inactive importance of indicators, CT-integrated multiple assessments affect the safety of using active travel to green spaces without calculating the weight. The behavior that integrates indices from the bottom- to top-layer systems can be recognized as a steady construction within the catastrophe system. Small variations in the bottom-layer systems would lead to the destruction of the entire steady state (Su et al., 2011). Particularly, prior studies mainly focused on developed Western countries (e.g., the United States, Britain, and Japan); specialization in the safety index framework is urgently needed for developing nations owing to their insufficient road facilities.
The spatial clustering method for macroscopic traffic accident analysis based on POI data is used to identify traffic accident frequency distribution in areas with unreliable conventional traffic accidents and traffic data (Barua et al., 2015). Many researchers have performed crash hotspot identification on point data using various methods, such as crash frequency, crash rate, improvement potential, empirical Bayes (EB), and KDE (Montella, 2010; Yu et al., 2014). In several studies, the KDE correlated method is considered as the most promising method to describe the spatial patterns present in various parameters and adopted (Chainey and Ratcliffe, 2013). There is a lack of example studies using KDE to cluster line-like elements.
Wuhan, the most populated and fastest growing metropolitan, is the capital of Hubei Province in central China. Located in latitude 29°58′–31°22′N and longitude 113°41′–115°05′E, Wuhan comprises 16 administrative districts, including seven central urban districts, four functional districts, and five new urban districts. The latest government data, the statistical communique of the People’s Republic of Wuhan on the 2018 National Economic and Social Development, shows its 81 integrated parks with a per capita area of 9.61 m2/person. The present study uses the case of the Wuhan Metropolitan Area to introduce the ATTS assessment framework evaluating the road to green spaces and examine the effect of the POI aggregation phenomenon on ATTS (shown in Figure 1).
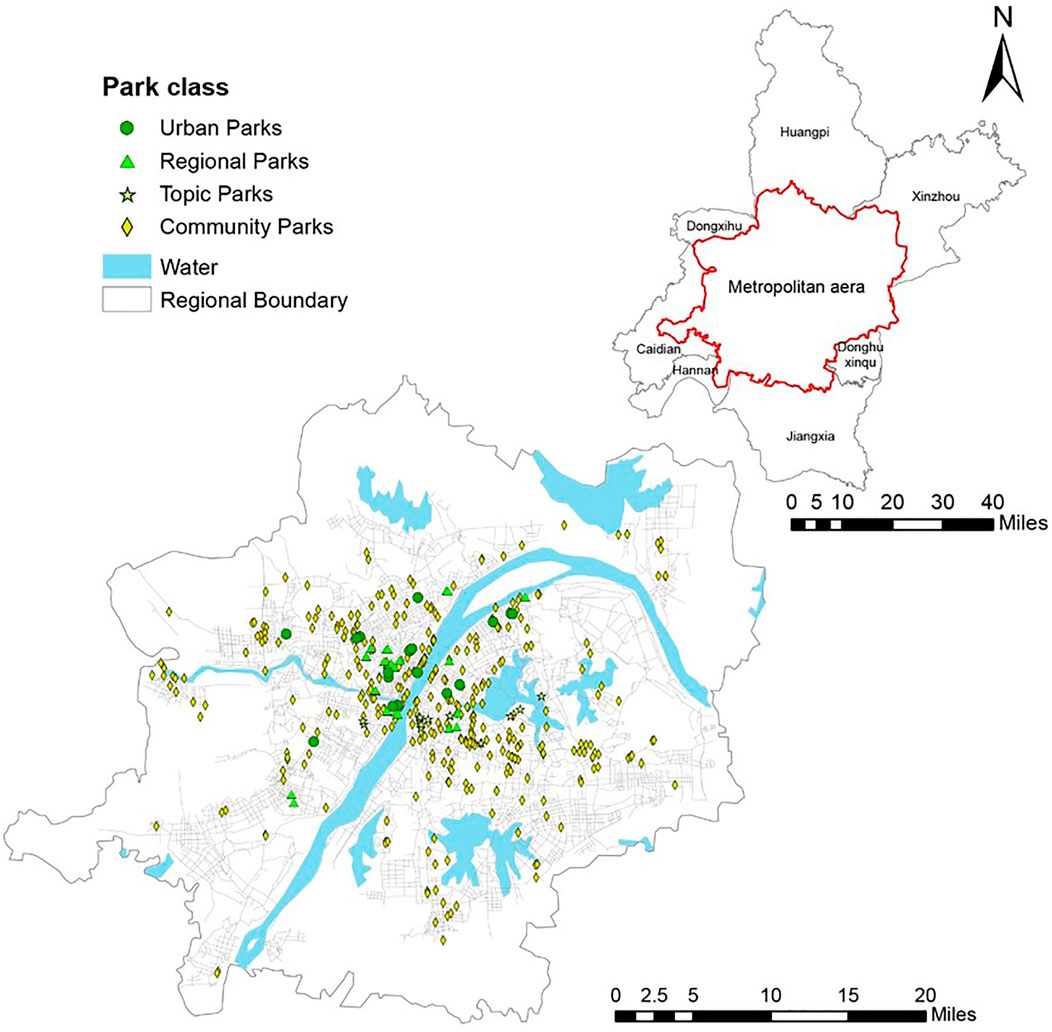
FIGURE 1. Location of the study area and spatial distribution of PGSs.
In this study, according to the Planning Report on the Green Space System in Wuhan from 2011 to 2020, parks are divided into four categories, with each park having its own serving scope and function: (a) urban parks are the main PGSs with various functions, such as recreation, sightseeing, ecological balance, and disaster shelter. Urban parks serve 2 km along the road network; (b) regional parks serve a smaller range of approximately 1 km along the road network than urban parks; (c) topic parks distribute areas into various specific themes, such as zoos and aquatic and cultural parks. Topic parks also serve 1 km along the road network; and (d) community parks cover an area of 2–5 ha and are combined with residential areas, ensuring that people can reach green spaces within 500 m. Residents in the urban center enjoy the functions of large-scale parks (urban, regional, and topic parks) more than those in the metropolitan fringes. Given the large-scale parks that cover a large area (urban, regional, and topic parks accounted for 43.2, 14.4, and 22.6% of the land, respectively), the services provided are very diverse.
The factors of safety assessment are usually related to traffic, road, and physical characteristics (Golob and Recker, 2003; Wang et al., 2013). Figure 2 shows the detailed aspects and data source of the ATTS assessment framework. The framework comprises two major parts: the first step is safety assessment and the second step is spatial regression. First, the safety assessment is performed using a catastrophe model to evaluate a total of 10 variables for traffic characteristics, road characteristics, and physical environment to obtain road-scale ATTS levels. The developed ATTS level brings a standardized measure of road active traffic safety to the field of transportation planning. The second is statistical modeling of POI and ATTS levels with one simple linear regression and two spatial models. This aims to estimate the properties and correlations of POI distributions with ATTS levels.
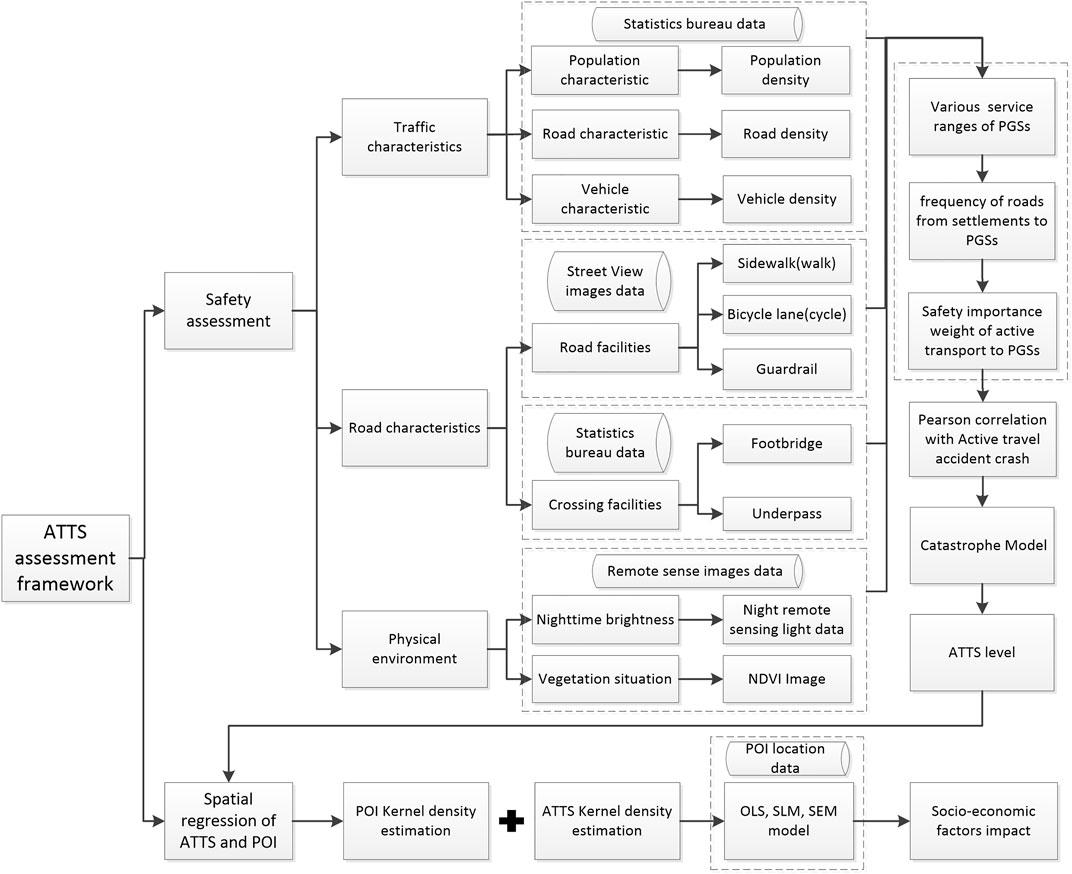
FIGURE 2. ATTS assessment framework.
Wuhan Planning and Design Institute provides 2018 road network data, PGS data, traffic characteristic data, and crossing facilities spatial data for Wuhan. The PGS data comprise the spatial location, size, name, and function category, while the facilities data comprise footbridges and underpasses. Traffic characteristics data, which include population, road, and vehicle number data, are collected on 18 June 2018, in the middle of the year. The original data include all road categories. Thus, we included trunk roads, secondary trunk roads, and branch ways that allow for active travel routes within the green space service range. All fundamental data are transformed into the road level based on the visual interpretation of the street view and the grid processing. Given the unreliable small-scale spatial population data and the unavailability of economic data from the government, this study focuses on the POI density based on spatial analysis. The POI data are integrated with the traffic crash data to identify the varying land use and its effect on traffic safety. When assessing the POI density, the buffer range is set to 500 m with each road as a unit. Table 1 presents the calculated road attributes.
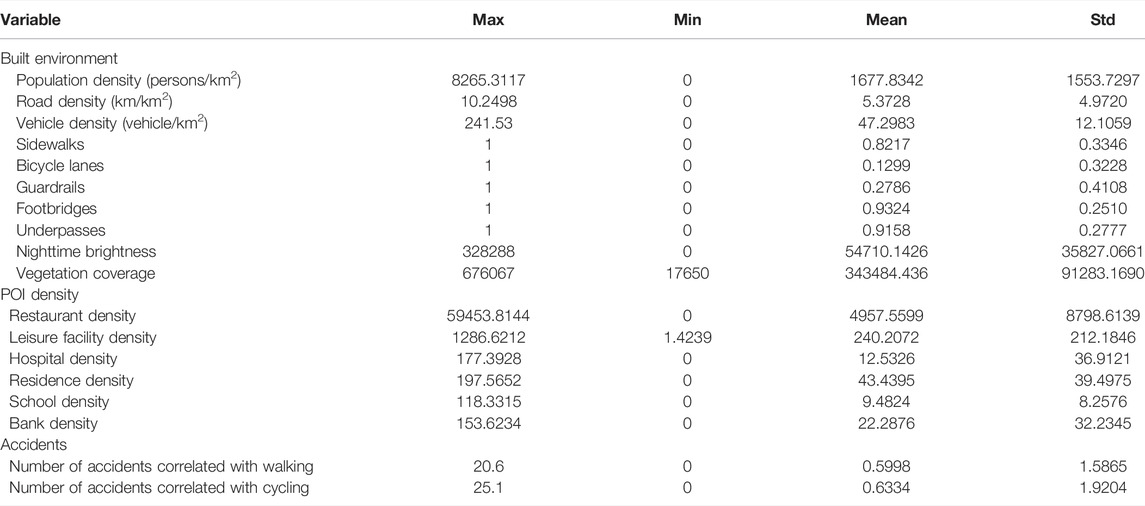
TABLE 1. Data description.
Given the limited police crash report records available in China, the study on ATTS remains largely insufficient. Previous studies used media data for crash information and relevant safety research (Yankson et al., 2010; Goddard et al., 2019). Similar to other types of crashes, walking- and cycling-related crashes with valuable injury information, such as gender, age, and severity, have been reported in the news many times (Yang et al., 2020). Such representative news reports provide useful information and have the potential to facilitate ATTS research.
This study took advantage of a Wuhan official news search engine (www.cjn.cn) to gather media-reported crash information and build a surrogate crash database for analytics. The keywords “road name + walking crash” (e.g., walking crash on the Hongshan Road) and “road name + cycling crash” (e.g., cycling crash on the Hongshan Road) were used to search news websites to determine the crash frequency of every road. The search period was from January 1 to 31 December 2018. This study only targeted crash reports containing essential components, including the date, location, victim description, and crash facts (e.g., type). The collected text information may be duplicated and must be cross-checked. A total of 147 walking crashes and 179 cycling crashes were identified through the mining of news reports during the study period.
We acquired road auxiliary facility data, including sidewalks, guardrails, and bicycle lanes, through the Baidu Maps street view (BMSV) image data using the Baidu Maps API. Given that Google Maps is inaccessible, Baidu Maps is a good substitute. The BMSV documents imagery from 372 cities that covers more than 738,000 km and provides a 360° panorama of cities, streets, and other environments. The BMSV is a free and accessible online scenery map service for everyone. On the basis of the road location next to green spaces supplied by the road network data, we sent an HTTP request with coordinates and the uniform resource locator (URL) parameters of the target road position to obtain a static street view near the PGSs.
Given the complicated road conditions and varying types of facilities, we used visual interpretation to classify the level of road infrastructure. On the basis of the previous research and the local road facility construction criterion, the interpretation rule and a few examples are shown in Table 2 and Figure 3.
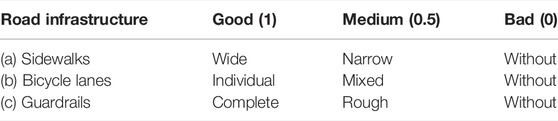
TABLE 2. Visual interpretation judging criteria.
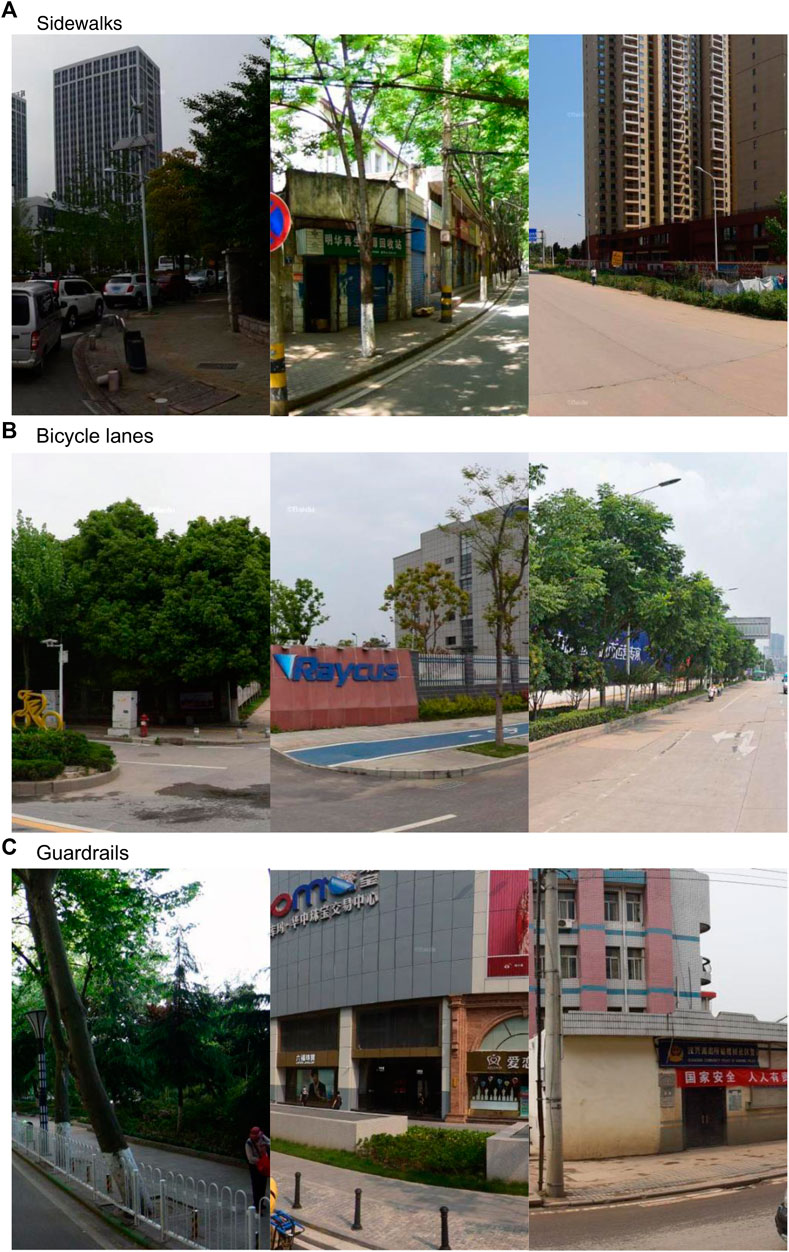
FIGURE 3. Interpretation of the street view (from left to right is good, medium, and bad). (A) Sidewalks, (B) bicycle lanes, and (C) guardrails.
This study obtained the crossing facility shapefiles in Wuhan from a local planning department. Thus, we considered crossing facilities as an indicator integrated into the evaluation framework. Footbridges and underpasses, as grade-separated facilities, tend to be safe when people face the risk of vehicle collisions on the road. The design specification of urban road traffic facilities (http://www.mohurd.gov.cn/wjfb/201908/t20190829_241614.html) states that crossing facilities should be set when the motor width exceeds 25 m. Therefore, not all road-crossing facilities are evaluated using the same criterion. Roads with insufficient widths are assessed as having average standards.
Users can obtain the LJ-01 cloud-free nighttime light imagery data for free by logging in at http://www.hbeos.org.cn/, which is available for scientific research and teaching organizations. Removing noise from the LJ1-01 data is unnecessary because the negative pixels have already been removed (Zhang et al., 2019). According to a released report on LJ1-01, the images are geometrically corrected by the system. However, to investigate the street lighting condition accurately, the experimental images must be geometrically corrected corresponding to the actual road network, which can be recognized clearly with 130-m-resolution imagery. Thus, we collected approximately 30 ground control points in the road intersections. The images also require absolute radiation correction, while the conversion formula adopted is
where L is the radiance value after absolute radiation correction in
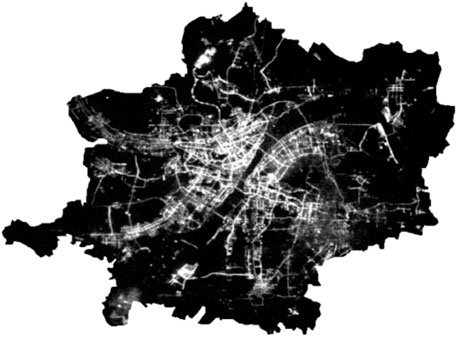
FIGURE 4. Clipped imagery of LJ-01 cloud-free nighttime light imagery data.
The NDVI derived from satellite imagery is a widely used index, which indicates the growth status and parameter of vegetation. In this study, the NDVI values from the 250-m monthly Terra MODIS NDVI (MOD13Q1) in June 2018 are unitless and ranged from −2000 to 10000. After the standardized process, with a scale factor of 0.0001, the range becomes 0–1.0. The high values indicate the increased concentration of green vegetation and bush density.
The CT is a powerful mathematical tool for studying the evolution of the system order. This theory explains and predicts a sudden phenomenon in nature and society. Additionally, the CT has broad application prospects in mathematics, physics, biology, engineering technology, and social science. The system tends to achieve an ideal stable state or enter a defined state range when at rest, without external forces. Upon receiving external forces of change, the system initially attempts to absorb external pressure through reaction. If such forces of change are too strong to be fully absorbed, a catastrophic change occurs, and the system then enters a new stable state; otherwise, it would return to its original state. The return of the system to its original stable state through continuity is impossible. Table 3 introduces the four primary catastrophe models required in the dimensions of the control parameters.
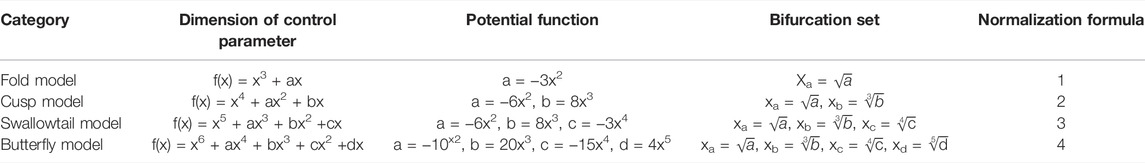
TABLE 3. Summary of possible catastrophe models
Because the object units of our study are roads, the benefit of calculating the distance from each road to the hospital is tiny. Therefore, we calculated the density of POI around the roads. KDE is used to transform discrete check-in points with POIs into continuous surfaces that reflect their spatial density. By using the density method, an arbitrary spatial unit of analysis can be defined that is homogenous for the entire area, which makes the comparison and ultimately classification possible (Jia et al., 2018). The KDE can be described by
where f(s) is the KDE function at location s, h denotes the bandwidth, dis represents the distance from point i to s, and k is a space weight function. Previous studies indicated that the choice of k barely affects the results and that the threshold of the distance decay is important. In this study, the bandwidth ranging from 100 to 1000 m was tested. The optimum bandwidth was tested to be 500 m as it resulted in a density pattern that was neither excessively sharp nor excessively smooth.
General spatial models have the following relative forms (Griffith, 1988):
where
Pearson’s correlation was used to test the correlation between the crash frequency and the built environment factors to indicate ATTS. The effects were negative when the coefficient was positive, and vice versa. Results show that population density has a positive impact on ATTS, and the coefficient is −0.182. This result indicates that individual risk may decline as the volume increases. Road density has a negative effect on ATTS, while the coefficient is 0.095. This result is consistent with the conclusions of previous studies (Kononov et al., 2008). The large number of roads indicates the existence of numerous intersections, which may easily lead to accidents. Road and crossing facilities, except footbridges, were found to have positive influences on ATTS. Among the road facilities, bicycle lanes are the most helpful in improving road safety, while the coefficient is −0.071 (p < 0.01), indicating the importance of maintenance in nonmotorized vehicle lanes due to their proximity to driveways and exposure to accidents. Street nighttime lighting was found to be an important factor that affects ATTS in parks, while the coefficient is −0.121. Improved street nighttime lighting significantly decreases (p < 0.01) the crash frequency because nighttime poses additional risks to pedestrians. However, these risks can be mitigated by lighting (Bernhardt and Kockelman, 2021). The abundance of vegetation can significantly decrease (p < 0.01) the crash frequency. Dense woods where trees isolate lanes and sidewalks can prevent accidents that cause injury. Kaplan (1987) also reported that vegetation may have mentally healing functions that could reduce the psychological harbinger of criminals. The Pearson coefficient results were used in the subsequent catastrophic model calculation.
Based on geospatial big data, we deciphered the ATTS security spatiality near parks by referring to other scholars using spatial statistics, segmented street analysis, sub-loop analysis, and sub-park types compared to not near parks (Xing et al., 2018; Jing et al., 2021).
Table 4 and Figure 5 show the significant differences in walking and bicycling modes for roads near parks and non-park neighborhoods.
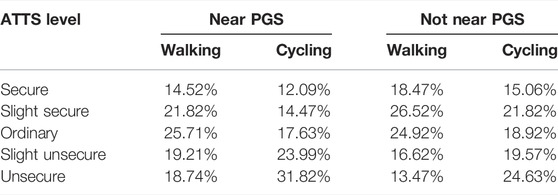
TABLE 4. ATTS-level percentage comparison

FIGURE 5. Spatial disparity of ATTS (A) near PGS and (B) not near PGS.
Roads near parks are concentrated in downtown areas, with higher road density along both sides of the river. The safety level of pedestrians is significantly better than that of cycling, while the difference probably stems mainly from the poorer construction of bike lanes. Roads that are relatively far from parks are mostly distributed along the metropolitan area. Safety levels of pedestrians are also significantly better than those of cycling. There is a general trend of higher to lower levels of pedestrian safety from the center of the metropolitan area outward, and vice versa, for cycling.
By contrast, ATTS levels on roads near non-parks are slightly better than those on roads near parks. Validating the conclusion we found that crash injuries may be higher near parks. The red-lined roads in Figure 5 require urgent government consideration of safety matters related to their active traffic.
Among 16 administrative districts, Hannan district and the Donghu New and High-Technology Development Zone have a good walking safety level for active travel (>0.8). The walking safety level (<0.2) in Hannan and Dongxihu districts is high. The safety result of active travel to parks is not determined by the district.
The evaluated safety levels are grouped according to road location and the four kinds of ring roads stated by the government (shown in Figure 6). Figure 7 indicates the physical differences in the safety level of the ring roads in Wuhan using a box plot. Walking to parks on the first three ring roads has a safety level of 0.9. Away from the third ring road, the safety level shows a dispersed distribution, nearly without an outlier. The low quartile accounts for a relatively high proportion, indicating many citizens outside the third ring road walk to PGSs with a low safety. The mean safety level of cycling to parks is less than 0.8. Unlike that of walking, the cycling safety level does not decrease from the inside to the outside of the ring road. Therefore, nonmotorized vehicle lanes are ignored near downtown because the evolving traffic pressure of automobiles requires urgent consideration. Few road units could be evaluated due to the limited number of parks.
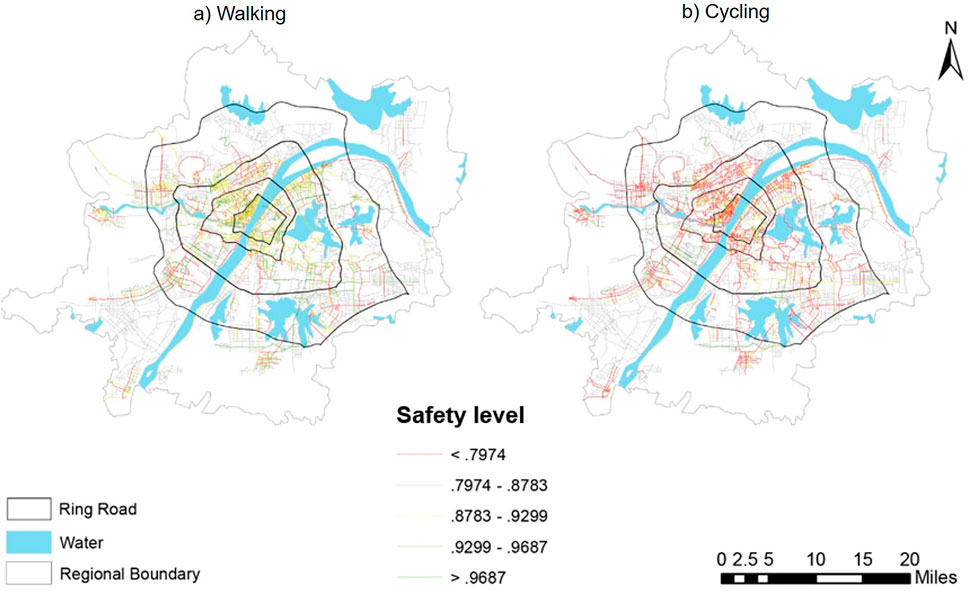
FIGURE 6. Spatial disparity ATTS in the ring road level.
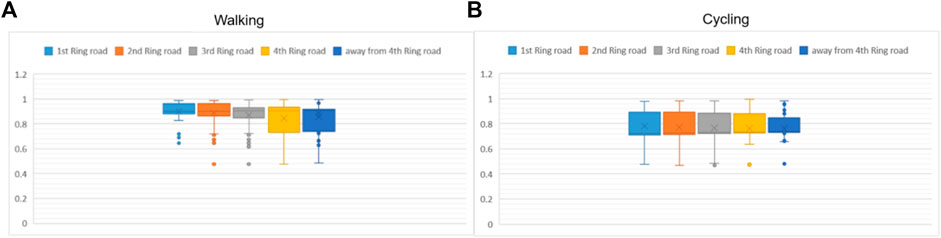
FIGURE 7. Box plots for ATTS in the ring road level.
The comparison among the four categories of parks indicates that the first three green spaces (urban, regional, and topic parks) generally aggregate in central districts in the form of parks and forests. Therefore, districts that have a socioeconomic advantage have more restricted access to green spaces and facilities for ATTS to PGSs (colored roads in Figure 8).
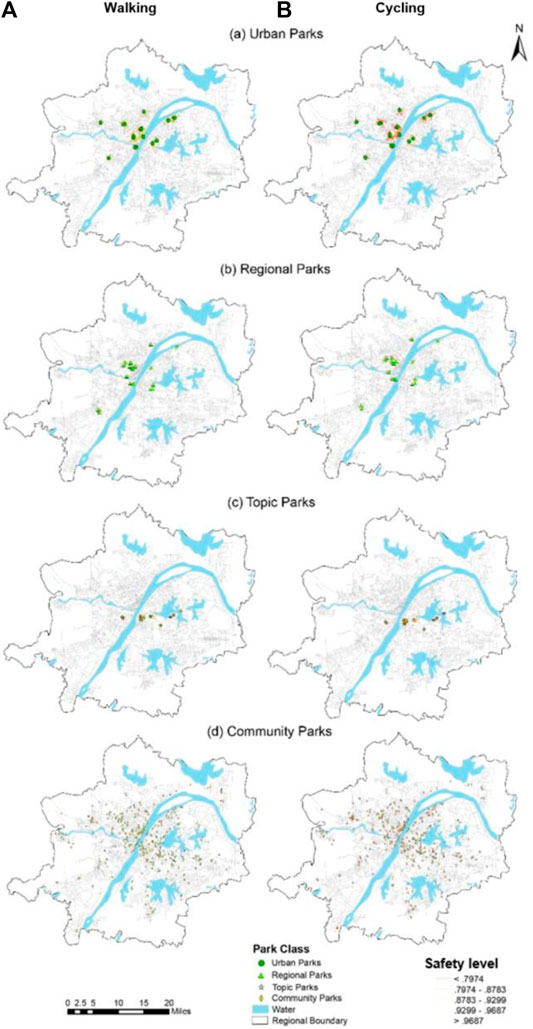
FIGURE 8. Spatial disparity ATTS in the PGS level.
Figure 9 shows that both patterns of safety situations near urban parks, such as the highest-level park, are not ideal. However, compared with the other three park categories, access to topic parks is the safest because of its highest proportion of safety levels (including extremely secure, secure, and middle).
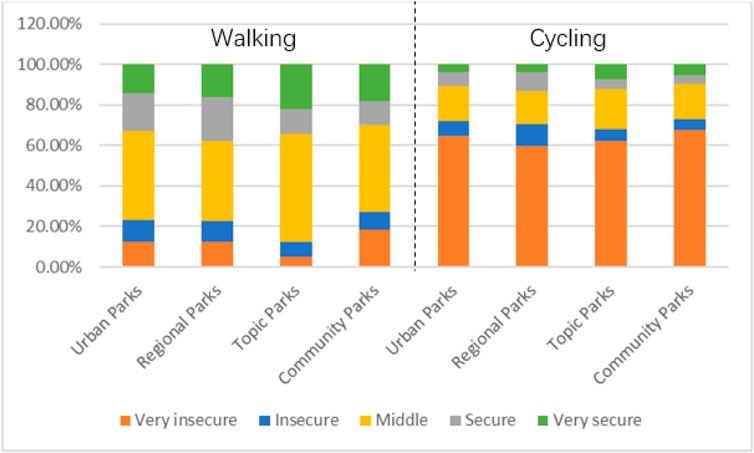
FIGURE 9. Stacked diagram of ATTS situation proportion near different PGSs.
Clustered distributions have been shown to improve model validity more than non-clustered counts in spatial regression analysis (Jia et al., 2018). In this study, the natural break cluster-based KDE method (Barua et al., 2016; Jia et al., 2018) was applied to quantify the POI influencing factors of land use to evaluate the ATTS near PGSs in Wuhan. According to the natural break cluster flowchart in the previous study, the k-value was set to 6 to ensure that the dense and sparse areas are clearly divided into various classes. The POI KDE and ATTS level KDE with natural break cluster reclassification results are presented in Figures 10, 11. The hotpots coded in deep purple and deep red represent high concentrations and are observed in densely populated areas. Different POI data show different features, which reflect the spatial diversity of POI and the land use characteristics for non-hot areas.
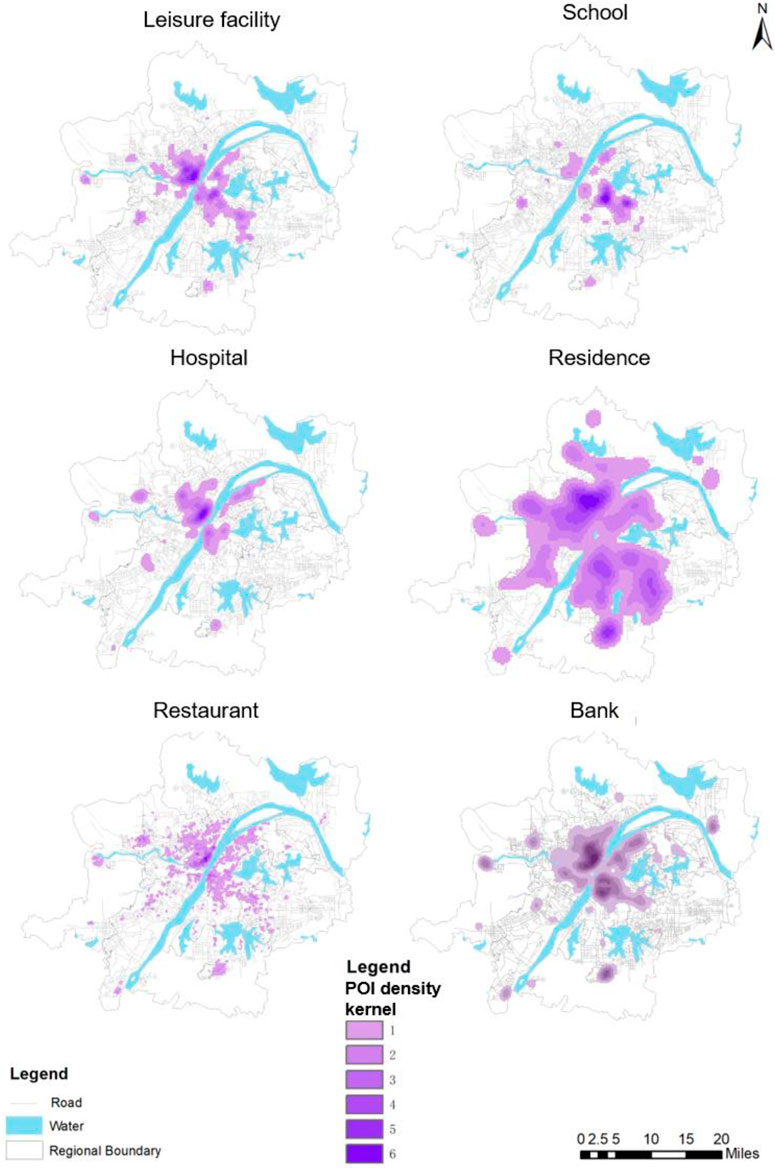
FIGURE 10. POI clusters in Wuhan.
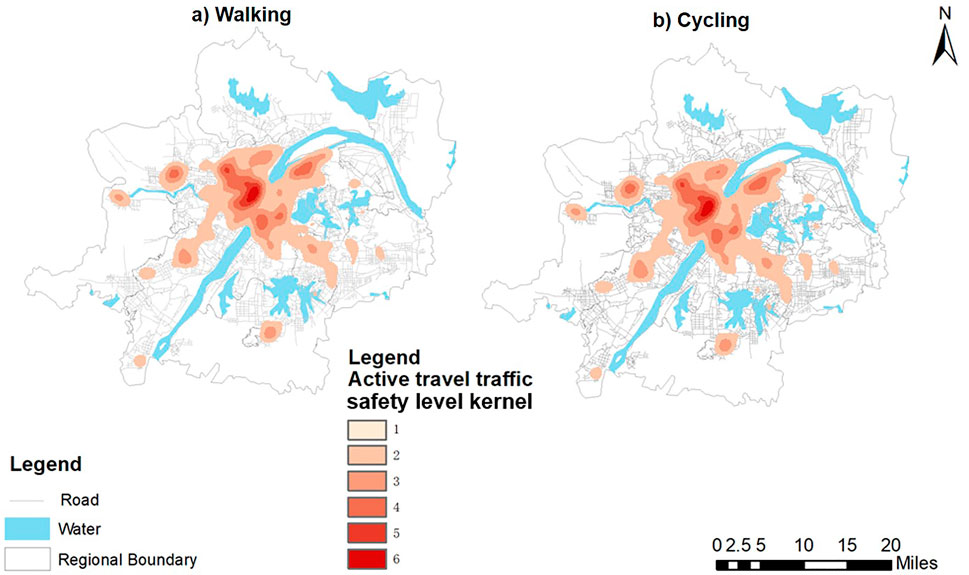
FIGURE 11. ATTS clusters used in Wuhan.
The spatial correlation and Lagrange multiplier (LM) were conducted for ATTS clusters before the spatial econometric models were applied (shown in Table 5). Moran’s I index of ATTS clusters passed the significance test at the 0.01 level for walking and cycling. This indicates that the ATTS clusters are spatially correlated and require a spatial econometric model. Results show that the LM for both the lag and error test statistics of two patterns is highly significant, and the SEM values are larger than the SLM values, indicating a strong spatial dependence in the two cases. Robust LM for the SEM is significantly significant, while the SLM is not, indicating that the SEM is more applicable than the SLM for two patterns. Therefore, the SEM was chosen to further explore the POI metrics.
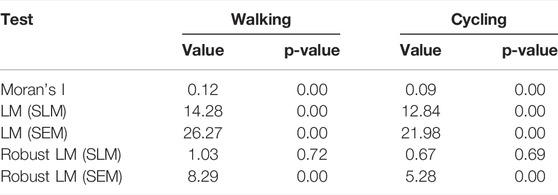
TABLE 5. Results of the Lagrange multiplier (LM) test for walking and cycling.
The comparison of the spatial analysis results of the three models shown in Table 6 verifies that spatial regression outperforms traditional regression methods. The higher the log-likelihood of the model, the better the model fit; the lower AIC indicates a better model fit. Clearly, SEM parameters outperformed those of the other models. The SEM lambda coefficients with statistical significance, higher log-likelihood, and lower AIC indicate a better model fit. Therefore, SEM is the best choice for POI.
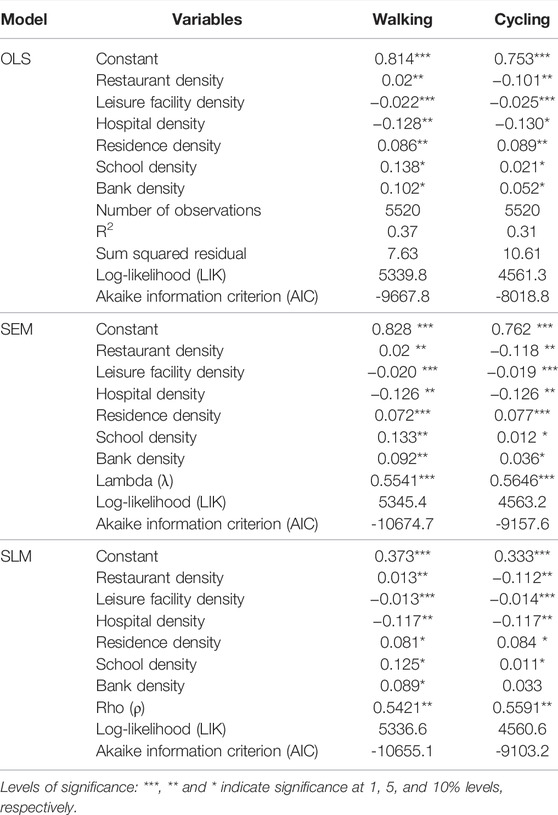
TABLE 6. Model performance and regression result of ATTS and POI density
The SEM results were used to determine the regression results for ATTS safety levels and POI near the park. Regression coefficients for leisure facility and residence were significant. The leisure facility shows a significant negative correlation with the ATTS level near PGSs, indicating that an increase in the density of the leisure facility may lead to a decrease in the ATTS safety level near the park. Leisure facilities include entertainment venues such as Internet cafés, amusement parks, and bars, which gather more mobile people. The traffic flow of cars and people gathered nearby may have a negative effect on the ATTS through the roadway. Residence shows a significant positive correlation with the ATTS safety level near PGSs, indicating that a high density of residence enhances the ATTS safety level near the park. A residential area has a low transient population, and people often come from families. The presence of resident security guards at the entrances and exits of the neighborhoods promotes regular traffic order, wherein people are not at great risk.
The fit of the walking mode is better than the fit of the cycling mode. The variables that differed significantly between the two patterns were restaurant and school. Restaurants showed a more significant negative correlation with the level of cycling safety in PGS neighborhoods and a lower correlation with walking. This indicates that an increase in restaurant density leads to a decrease in the level of cycling safety near parks. This is related to the fact that restaurants often occupy common ground to expand their business area privately. Schools show a significant positive correlation with pedestrian safety near PGSs, and a low correlation with cycling. This indicates that the increased density of schools improves the level of pedestrian safety in the vicinity of PGSs. Traffic control and traffic speed reduction signs, which are common near schools, have a significant effect on pedestrian safety.
The requirements of transport networks accommodated the increasing number of advantages found in active travel. The evidence supporting the net positive health benefits of active travel has been well established (Mueller et al., 2015). Therefore, understanding the factors influencing ATTS is essential for offering a safe travel environment. Our study emphasizes the influences of built environment factors on ATTS and proposes an evaluation framework for ATTS near PGSs. We used the data on traffic, road, and physical characteristics to depict a comprehensive street space. Results show that various built environments have varying influences on ATTS. First, road and crossing facilities have positive influences on ATTS. This finding indicates that the provision of thorough auxiliary facilities at the road level helps increase ATTS. Among these road subsidiary factors, bicycle lanes are the most helpful for improving road safety. Results show the importance of maintaining nonmotorized vehicle lanes due to their proximity to driveways and exposure to crash-related factors. Furthermore, the effects of the other two built environment factors have pronounced effects on ATTS. These effects also presented distinct results from Western countries: nighttime brightness pronounces negative impacts on ATTS, whereas the vegetation situation has a positive influence. Consistent with previous studies, the driver’s reaction capability is reduced, and the reaction time for operation is longer due to the complex and strong light environment at night (He et al., 2021). Roadside vegetation provides numerous environmental and psychological benefits to drivers (Fitzpatrick et al., 2014).
Given the rapid development of bike-sharing in China (Cao and Shen, 2019), a significant increase in cycling behavior is observed. However, the results of this study comparing walking and cycling modes of active travel demonstrate that pedestrians enjoy safer roadway facilities than cyclists. In addition, active travel traffic near PGS requires more attention than non-park neighborhoods. One reason for this is that bike lanes are also not as well constructed. A certain number of roads have no established bicycle lanes. The frequent occurrence of mixed use and occupied use is another important reason. The safety situation near topic parks outweighs that of other parks. This result shows that the safety service provided by urban parks, as the highest-level park in urban cities, does not correspond to their establishment level. Moreover, the comparison among common traffic boundaries in China shows that the safety situation of active travel to parks is not optimistic away from the third ring road (near suburbs).
The OLS, SLM, and SEM are used to investigate the correlation of ATTS with the POI aggregation phenomenon. With regard to the effects of POI aggregation on ATTS, specific land use has a great effect on ATTS. Our study revealed that the SEM has the best fit for the POI cluster, compared to OLS and SLM. Moreover, the fit of the walking pattern is better than the fit of the cycling pattern. Some specific POIs have profound effects on the spatial distribution of ATTS. Specifically, increases in the leisure facility density and residence density lead to deterioration and improvement in ATTS safety levels near PGSs, respectively. Increases in the restaurant density and school density worsen the level of cycling safety and enhance the level of walking safety near PGSs, respectively. Therefore, policy measures should focus on enhancing the active travel environment in areas with many recreational areas and restaurants. The results of the experiment combining all variables indicate the need to improve effective goal-oriented measures in mixed land uses when seeking equitable ATTS in a variety of settings.
This study proposes a new framework for the ATTS assessment framework. The extent to which people are threatened on their way to parks to experience healthy living is estimated. Our proposed assessment framework focuses on the safety of built environment parameters. In addition to the research area of accident (Gilstad-Hayden et al., 2015; Suk and Walter, 2019), we selected several hot factors in recent years, including nighttime brightness and vegetation situation. The proposed framework provides a rational estimation of the performance of ATTS before the occurrence of accidents. Given the site-specific data on roads, the proposed framework can provide concrete and insightful observations that may help in managing the safety of the built environment against hazardous conditions. Compared with other methods of active travel evaluation, our framework presented the following advantages:
1) Previous studies performed cross-sectional surveys by using the multivariate analysis of personal traits (Hansen et al., 2015; Fairnie et al., 2016; Brainard et al., 2019). In this study, a systematic citywide evaluation framework for ATTS was introduced, focusing on the safety effect of the environment parameters.
2) Evaluating the safety of accessibility to PGSs is important because people use active travel, instead of motorized transport when traveling (Jerrett et al., 2016). This study divided PGSs into various levels and estimated safety according to their serving ranges. This process verifies whether the safety levels of various parks correspond to their establishment levels.
3) The perspective of roads in this study differs from that of the segments and intersections presented in previous research (Flahaut, 2004; Barua et al., 2014). Planning administration can use the evaluation based on road units to recognize roads that require urgent repair accurately. The refinement of units can improve the practicality of this study.
4) The natural break cluster method is used to reclassify the kernel density, and the spatial analysis model is used to estimate the correlation of the POI aggregation phenomenon with active travel traffic safety. The exploration helps to obtain the prone areas of active travel traffic accidents according to the characteristics of POI aggregation for preventing accidents early.
This study has several limitations with regard to the framework of ATTS based on PGS classifications. First, this study focuses on the influence of the built environment but lacks in terms of the depiction of street moral character. Second, the definition of active travel used in this study only includes walking and cycling. Other transport modes, such as driving and riding public transport, also play significant roles in accessing PGSs (Xing et al., 2018) and cannot be ignored. Third, this study uses a subjective method to interpret the situation extracted from the street view images. Considerable manpower is required in dealing with original data. Processing greater volumes of data, such as entire city roads, requires an automated method (Zhou et al., 2019), which is included in the agenda of subsequent study. Finally, the present POI variables are limited to six categories. The sociodemographic indicators (e.g., education, income, and age) (Su et al., 2019) should be considered in future research for exploring the inequity of ATTS distribution.
This study estimates the ATTS access to parks by using the proposed spatial assessment framework. The proposed framework highlights the importance of accounting for built environment factors in analyzing ATTS. Additionally, the correlation between POI aggregation and ATTS is explored, identifying the potential land use factors of the ATTS. The results in Wuhan confirmed that traffic, road and physical characteristics greatly affect ATTS, especially population density, road density, nighttime brightness, and vegetation situation. The spatial distribution of ATTS indicated that pedestrians enjoy safer road facilities than cyclists, and roads along the river have a high ATTS level in Wuhan. The spatial regression results urge the authorities to monitor the ATTS in areas with many leisure facilities and residences. Findings indicated that the provision of thorough auxiliary facilities at the road level helps increase the safety of access to PGSs. Furthermore, our proposed framework could be applied to other public facilities that attract active travel users (e.g., schools). The proposed framework offered appropriate traffic planning strategies to improve the safety and equity of ATTS users during their access to PGSs. Transport planners should pay more attention to roads near specific land uses. Improving the safety conditions of walking and cycling near PGSs is recommended to avoid safety inequality.
The original contributions presented in the study are included in the article/Supplementary Material, further inquiries can be directed to the corresponding author.
YYL: conceptualization, methodology, writing—original draft, formal analysis, and investigation. YFL: writing—review and editing, supervision, funding acquisition, and resource. LX: data duration, resource, and software. NW: validation, visualization, and software. LR: resources, visualization, and software.
This study was supported by the National Natural Science Foundation of China (Grant No: 41771432) and the Natural Science Foundation of Hubei Province (Grant No: 2020CFB483).
The authors declare that the research was conducted in the absence of any commercial or financial relationships that could be construed as a potential conflict of interest.
All claims expressed in this article are solely those of the authors and do not necessarily represent those of their affiliated organizations, or those of the publisher, the editors, and the reviewers. Any product that may be evaluated in this article, or claim that may be made by its manufacturer, is not guaranteed or endorsed by the publisher.
Abdel-Aty, M., Lee, J., Siddiqui, C., and Choi, K. (2013). Geographical Unit Based Analysis in the Context of Transportation Safety Planning. Transportation Res. A: Pol. Pract. 49, 62–75. doi:10.1016/j.tra.2013.01.030
Administration, F. H. (1992). Bicycling and Walking Study Case Study No. 3: What Needs to Be Done to Promote Bicycling and Walking? Available at: https://trid.trb.org/view/386096.
Aghaabbasi, M., Moeinaddini, M., Zaly Shah, M., Asadi-Shekari, Z., and Arjomand Kermani, M. (2018). Evaluating the Capability of Walkability Audit Tools for Assessing Sidewalks. Sustainable Cities Soc. 37, 475–484. doi:10.1016/j.scs.2017.12.001
Anciaes, P. R., and Jones, P. (2018). Estimating Preferences for Different Types of Pedestrian Crossing Facilities. Transportation Res. F: Traffic Psychol. Behav. 52, 222–237. doi:10.1016/j.trf.2017.11.025
Awasthi, A., Chauhan, S. S., Omrani, H., and Panahi, A. (2011). A Hybrid Approach Based on SERVQUAL and Fuzzy TOPSIS for Evaluating Transportation Service Quality. Comput. Ind. Eng. 61 (3), 637–646. doi:10.1016/j.cie.2011.04.019
Ayati, E., and Abbasi, E. (2011). Investigation on the Role of Traffic Volume in Accidents on Urban Highways. J. Saf. Res. 42 (3), 209–214. doi:10.1016/j.jsr.2011.03.006
Baran, P. K., Tabrizian, P., Zhai, Y., Smith, J. W., and Floyd, M. F. (2018). An Exploratory Study of Perceived Safety in a Neighborhood Park Using Immersive Virtual Environments. Urban For. Urban Green. 35, 72–81. doi:10.1016/j.ufug.2018.08.009
Barua, S., El-Basyouny, K., and Islam, M. T. (2014). A Full Bayesian Multivariate Count Data Model of Collision Severity with Spatial Correlation. Analytic Methods Accid. Res. 3-4, 28–43. doi:10.1016/j.amar.2014.09.001
Barua, S., El-Basyouny, K., and Islam, M. T. (2015). Effects of Spatial Correlation in Random Parameters Collision Count-Data Models. Analytic Methods Accid. Res. 5-6, 28–42. doi:10.1016/j.amar.2015.02.001
Barua, S., El-Basyouny, K., and Islam, M. T. (2016). Multivariate Random Parameters Collision Count Data Models with Spatial Heterogeneity. Analytic Methods Accid. Res. 9, 1–15. doi:10.1016/j.amar.2015.11.002
Bernhardt, M., and Kockelman, K. (2021). An Analysis of Pedestrian Crash Trends and Contributing Factors in Texas. J. Transport Health 22, 101090. doi:10.1016/j.jth.2021.101090
Brainard, J., Cooke, R., Lane, K., and Salter, C. (2019). Age, Sex and Other Correlates with Active Travel Walking and Cycling in England: Analysis of Responses to the Active Lives Survey 2016/17. Prev. Med. 123, 225–231. doi:10.1016/j.ypmed.2019.03.043
Brown, V., Moodie, M., and Carter, R. (2017). Evidence for Associations between Traffic Calming and Safety and Active Transport or Obesity: A Scoping Review. J. Transport Health 7, 23–37. doi:10.1016/j.jth.2017.02.011
Brownson, R. C., Hoehner, C. M., Day, K., Forsyth, A., and Sallis, J. F. (2009). Measuring the Built Environment for Physical Activity. Am. J. Prev. Med. 36 (4), S99–S123. e112. doi:10.1016/j.amepre.2009.01.005
Brühwiler, L., Fu, C., Huang, H., Longhi, L., and Weibel, R. (2022). Predicting Individuals' Car Accident Risk by Trajectory, Driving Events, and Geographical Context. Comput. Environ. Urban Syst. 93, 101760. doi:10.1016/j.compenvurbsys.2022.101760
Cao, Y., and Shen, D. (2019). Contribution of Shared Bikes to Carbon Dioxide Emission Reduction and the Economy in Beijing. Sustainable Cities Soc. 51, 101749. doi:10.1016/j.scs.2019.101749
Chainey, S., and Ratcliffe, J. (2013). Crime Mapping Case Studies. Gis & Crime Mapping. (2005). Hoboken: Wiley.
Clifton, K. J., Burnier, C. V., and Akar, G. (2009). Severity of Injury Resulting from Pedestrian-Vehicle Crashes: What Can We Learn from Examining the Built Environment? Transportation Res. D: Transport Environ. 14 (6), 425–436. doi:10.1016/j.trd.2009.01.001
Cunningham, G. O., Michael, Y. L., Farquhar, S. A., and Lapidus, J. (2005). Developing a Reliable Senior Walking Environmental Assessment Tool. Am. J. Prev. Med. 29 (3), 215–217. doi:10.1016/j.amepre.2005.05.002
Demiroz, Y. I., Onelcin, P., and Alver, Y. (2015). Illegal Road Crossing Behavior of Pedestrians at Overpass Locations: Factors Affecting gap Acceptance, Crossing Times and Overpass Use. Accid. Anal. Prev. 80, 220–228. doi:10.1016/j.aap.2015.04.018
Donroe, J., Tincopa, M., Gilman, R. H., Brugge, D., and Moore, D. A. J. (2008). Pedestrian Road Traffic Injuries in Urban Peruvian Children and Adolescents: Case Control Analyses of Personal and Environmental Risk Factors. PLOS ONE 3 (9), e3166. doi:10.1371/journal.pone.0003166
dos Santos, B. M., Godoy, L. P., and Campos, L. M. S. (2019). Performance Evaluation of green Suppliers Using Entropy-TOPSIS-F. J. Clean. Prod. 207, 498–509. doi:10.1016/j.jclepro.2018.09.235
Duan, Y., Wagner, P., Zhang, R., Wulff, H., and Brehm, W. (2018). Physical Activity Areas in Urban parks and Their Use by the Elderly from Two Cities in China and Germany. Landscape Urban Plann. 178, 261–269. doi:10.1016/j.landurbplan.2018.06.009
Dumbaugh, E., and Rae, R. (2009). Safe Urban Form: Revisiting the Relationship between Community Design and Traffic Safety. J. Am. Plann. Assoc. 75 (3), 309–329. doi:10.1080/01944360902950349
Ekkel, E. D., and de Vries, S. (2017). Nearby green Space and Human Health: Evaluating Accessibility Metrics. Landscape Urban Plann. 157, 214–220. doi:10.1016/j.landurbplan.2016.06.008
Fairnie, G. A., Wilby, D. J. R., and Saunders, L. E. (2016). Active Travel in London: The Role of Travel Survey Data in Describing Population Physical Activity. J. Transport Health 3 (2), 161–172. doi:10.1016/j.jth.2016.02.003
Fitzpatrick, C. D., Harrington, C. P., Knodler, M. A., and Romoser, M. R. E. (2014). The Influence of clear Zone Size and Roadside Vegetation on Driver Behavior. J. Saf. Res. 49, e1e91–104. doi:10.1016/j.jsr.2014.03.006
Flahaut, B. (2004). Impact of Infrastructure and Local Environment on Road Unsafety. Accid. Anal. Prev. 36 (6), 1055–1066. doi:10.1016/j.aap.2003.12.003
Galanis, A., Botzoris, G., and Eliou, N. (2017). Pedestrian Road Safety in Relation to Urban Road Type and Traffic Flow. Transportation Res. Proced. 24, 220–227. doi:10.1016/j.trpro.2017.05.111
Gilstad-Hayden, K., Wallace, L. R., Carroll-Scott, A., Meyer, S. R., Barbo, S., Murphy-Dunning, C., et al. (2015). Research Note: Greater Tree Canopy Cover Is Associated with Lower Rates of Both Violent and Property Crime in New Haven, CT. Landscape Urban Plann. 143, 248–253. doi:10.1016/j.landurbplan.2015.08.005
Goddard, T., Ralph, K., Thigpen, C. G., and Iacobucci, E. (2019). Does News Coverage of Traffic Crashes Affect Perceived Blame and Preferred Solutions? Evidence from an experiment. Transportation Res. Interdiscip. Perspect. 3, 100073. doi:10.1016/j.trip.2019.100073
Golob, T. F., and Recker, W. W. (2004). A Method for Relating Type of Crash to Traffic Flow Characteristics on Urban Freeways. Transportation Res. Part A: Pol. Pract. 38 (1), 53–80. doi:10.1016/j.tra.2003.08.002
Golob, T. F., and Recker, W. W. (2003). Relationships Among Urban Freeway Accidents, Traffic Flow, Weather, and Lighting Conditions. J. Transp. Eng. 129 (4), 342–353. doi:10.1061/(asce)0733-947x(2003)129:4(342)
Griffith, D. A. (1988). Spatial Econometrics: Methods and Models. Econ. Geogr. 65 (2), 160–162. doi:10.1007/978-94-015-7799-1
Hansen, A. Y., Umstattd Meyer, M. R., Lenardson, J. D., and Hartley, D. (2015). Built Environments and Active Living in Rural and Remote Areas: a Review of the Literature. Curr. Obes. Rep. 4 (4), 484–493. doi:10.1007/s13679-015-0180-9
He, Y., Zhang, X., Quan, L., Mi, R., Cui, Y., Xu, J., et al. (2021). Influence of Coloured Light Projected from Night-Time Excessive Luminance Outdoor LED Display Screens on Vehicle Driving Safety along Urban Roads. Building Environ. 188, 107448. doi:10.1016/j.buildenv.2020.107448
Hess, P., Moudon, A., and Matlick, J. (2004). Pedestrian Safety and Transit Corridors. Jpt 7, 73–93. doi:10.5038/2375-0901.7.2.5
Hu, Y., Zhang, Y., and Shelton, K. S. (2018). Where Are the Dangerous Intersections for Pedestrians and Cyclists: A Colocation-Based Approach. Transportation Res. C: Emerging Tech. 95, 431–441. doi:10.1016/j.trc.2018.07.030
Jacobsen, P. L. (2003). Safety in Numbers: More Walkers and Bicyclists, Safer Walking and Bicycling. Inj. Prev. 9 (3), 205–209. doi:10.1136/ip.9.3.205
Jerrett, M., Su, J. G., MacLeod, K. E., Hanning, C., Houston, D., and Wolch, J. (2016). Safe Routes to Play? Pedestrian and Bicyclist Crashes Near Parks in Los Angeles. Environ. Res. 151, 742–755. doi:10.1016/j.envres.2016.07.029
Jia, R., Khadka, A., and Kim, I. (2018). Traffic Crash Analysis with point-of-interest Spatial Clustering. Accid. Anal. Prev. 121, 223–230. doi:10.1016/j.aap.2018.09.018
Jing, Y., Ma, D., Liu, Y., Cui, J., Zhang, S., and Chen, Y. (2021). Decoding the Street-Based Spatiality of Urban Gyms: Implications for Healthy City Planning. Land 10 (2), 175. doi:10.3390/land10020175
Kaplan, S. (1987). Mental Fatigue and the Designed Environment. Public environments [Press release]. Abingdon: Taylor & Francis.
Kononov, J., Bailey, B., and Allery, B. K. (2008). Relationships between Safety and Both Congestion and Number of Lanes on Urban Freeways. Transportation Res. Rec. 2083 (1), 26–39. doi:10.3141/2083-04
Kuo, P.-F., and Lord, D. (2021). A Visual Approach for Defining the Spatial Relationships Among Crashes, Crimes, and Alcohol Retailers: Applying the Color Mixing Theorem to Define the Colocation Pattern of Multiple Variables. Accid. Anal. Prev. 154, 106062. doi:10.1016/j.aap.2021.106062
Lee, G., and Hong, I. (2013). Measuring Spatial Accessibility in the Context of Spatial Disparity between Demand and Supply of Urban Park Service. Landscape Urban Plann. 119, 85–90. doi:10.1016/j.landurbplan.2013.07.001
Lee, J., Abdel-Aty, M., and Jiang, X. (2015). Multivariate Crash Modeling for Motor Vehicle and Non-motorized Modes at the Macroscopic Level. Accid. Anal. Prev. 78, 146–154. doi:10.1016/j.aap.2015.03.003
Lee, J., Chae, J., Yoon, T., and Yang, H. (2018). Traffic Accident Severity Analysis with Rain-Related Factors Using Structural Equation Modeling - A Case Study of Seoul City. Accid. Anal. Prev. 112, 1–10. doi:10.1016/j.aap.2017.12.013
Lord, D., Manar, A., and Vizioli, A. (2005). Modeling Crash-Flow-Density and Crash-Flow-V/C Ratio Relationships for Rural and Urban Freeway Segments. Accid. Anal. Prev. 37 (1), 185–199. doi:10.1016/j.aap.2004.07.003
Lwin, K. K., and Murayama, Y. (2011). Modelling of Urban green Space Walkability: Eco-Friendly Walk Score Calculator. Comput. Environ. Urban Syst. 35 (5), 408–420. doi:10.1016/j.compenvurbsys.2011.05.002
Martin, J.-L. (2002). Relationship between Crash Rate and Hourly Traffic Flow on Interurban Motorways. Accid. Anal. Prev. 34 (5), 619–629. doi:10.1016/S0001-4575(01)00061-6
Miranda-Moreno, L. F., Morency, P., and El-Geneidy, A. M. (2011). The Link between Built Environment, Pedestrian Activity and Pedestrian-Vehicle Collision Occurrence at Signalized Intersections. Accid. Anal. Prev. 43 (5), 1624–1634. doi:10.1016/j.aap.2011.02.005
Montella, A. (2010). A Comparative Analysis of Hotspot Identification Methods. Accid. Anal. Prev. 42 (2), 571–581. doi:10.1016/j.aap.2009.09.025
Morrison, C. N., Thompson, J., Kondo, M. C., and Beck, B. (2019). On-road Bicycle Lane Types, Roadway Characteristics, and Risks for Bicycle Crashes. Accid. Anal. Prev. 123, 123–131. doi:10.1016/j.aap.2018.11.017
Morrison, D. S., Petticrew, M., and Thomson, H. (2003). What Are the Most Effective Ways of Improving Population Health through Transport Interventions? Evidence from Systematic Reviews. J. Epidemiol. Community Health 57 (5), 327–333. doi:10.1136/jech.57.5.327
Moudon, A. V., Lin, L., Jiao, J., Hurvitz, P., and Reeves, P. (2011). The Risk of Pedestrian Injury and Fatality in Collisions with Motor Vehicles, a Social Ecological Study of State Routes and City Streets in King County, Washington. Accid. Anal. Prev. 43 (1), 11–24. doi:10.1016/j.aap.2009.12.008
Mueller, N., Rojas-Rueda, D., Cole-Hunter, T., de Nazelle, A., Dons, E., Gerike, R., et al. (2015). Health Impact Assessment of Active Transportation: A Systematic Review. Prev. Med. 76, 103–114. doi:10.1016/j.ypmed.2015.04.010
Ng, K.-s., Hung, W.-t., and Wong, W.-g. (2002). An Algorithm for Assessing the Risk of Traffic Accident. J. Saf. Res. 33 (3), 387–410. doi:10.1016/S0022-4375(02)00033-6
Noland, R. B., and Oh, L. (2004). The Effect of Infrastructure and Demographic Change on Traffic-Related Fatalities and Crashes: a Case Study of Illinois County-Level Data. Accid. Anal. Prev. 36 (4), 525–532. doi:10.1016/S0001-4575(03)00058-7
Noland, R. B. (2003). Traffic Fatalities and Injuries: the Effect of Changes in Infrastructure and Other Trends. Accid. Anal. Prev. 35 (4), 599–611. doi:10.1016/S0001-4575(02)00040-4
O׳Hern, S., and Oxley, J. (2015). Understanding Travel Patterns to Support Safe Active Transport for Older Adults. J. Transport Health 2 (1), 79–85. doi:10.1016/j.jth.2014.09.016
Poku-Boansi, M., Amoako, C., and Atuah, D. O. (2019). Urban Travel Patterns and Safety Among School Children Around Accra, Ghana. J. Transport Health 15, 100660. doi:10.1016/j.jth.2019.100660
Pont, K., Ziviani, J., Wadley, D., Bennett, S., and Abbott, R. (2009). Environmental Correlates of Children's Active Transportation: A Systematic Literature Review. Health & Place 15 (3), 849–862. doi:10.1016/j.healthplace.2009.02.002
Pucher, J., Buehler, R., Bassett, D. R., and Dannenberg, A. L. (2010). Walking and Cycling to Health: a Comparative Analysis of City, State, and International Data. Am. J. Public Health 100 (10), 1986–1992. doi:10.2105/AJPH.2009.189324
Ramírez, A. F., and Valencia, C. (2021). Spatiotemporal Correlation Study of Traffic Accidents with Fatalities and Injuries in Bogota (Colombia). Accid. Anal. Prev. 149, 105848. doi:10.1016/j.aap.2020.105848
Räsänen, M., Lajunen, T., Alticafarbay, F., and Aydin, C. (2007). Pedestrian Self-Reports of Factors Influencing the Use of Pedestrian Bridges. Accid. Anal. Prev. 39 (5), 969–973. doi:10.1016/j.aap.2007.01.004
Retting, R. A., Ferguson, S. A., and McCartt, A. T. (2003). A Review of Evidence-Based Traffic Engineering Measures Designed to Reduce Pedestrian-Motor Vehicle Crashes. Am. J. Public Health 93 (9), 1456–1463. doi:10.2105/AJPH.93.9.1456
Saha, D., Dumbaugh, E., and Merlin, L. A. (2020). A Conceptual Framework to Understand the Role of Built Environment on Traffic Safety. J. Saf. Res. 75, 41–50. doi:10.1016/j.jsr.2020.07.004
Saplıoğlu, M., and Aydın, M. M. (2018). Choosing Safe and Suitable Bicycle Routes to Integrate Cycling and Public Transport Systems. J. Transport Health 10, 236–252. doi:10.1016/j.jth.2018.05.011
Shankar, V. N., Ulfarsson, G. F., Pendyala, R. M., and Nebergall, M. B. (2003). Modeling Crashes Involving Pedestrians and Motorized Traffic. Saf. Sci. 41 (7), 627–640. doi:10.1016/S0925-7535(02)00017-6
Simončič, M. (2001). Road Accidents in Slovenia Involving a Pedestrian, Cyclist or Motorcyclist and a Car. Accid. Anal. Prev. 33 (2), 147–156. doi:10.1016/S0001-4575(00)00025-7
Smith, M., Hawley, G., Mackay, L., Hosking, J., Mackie, H., Ikeda, E., et al. (2020). Impact of Changing Road Infrastructure on Children's Active Travel: A Multi-Methods Study from Auckland, New Zealand. J. Transport Health 18, 100868. doi:10.1016/j.jth.2020.100868
Su, S., Li, D., Yu, X., Zhang, Z., Zhang, Q., Xiao, R., et al. (2011). Assessing Land Ecological Security in Shanghai (China) Based on Catastrophe Theory. Stoch Environ. Res. Risk Assess. 25 (6), 737–746. doi:10.1007/s00477-011-0457-9
Su, S., Zhou, H., Xu, M., Ru, H., Wang, W., and Weng, M. (2019). Auditing Street Walkability and Associated Social Inequalities for Planning Implications. J. Transport Geogr. 74, 62–76. doi:10.1016/j.jtrangeo.2018.11.003
Suk, J. Y., and Walter, R. J. (2019). New Nighttime Roadway Lighting Documentation Applied to Public Safety at Night: A Case Study in San Antonio, Texas. Sustainable Cities Soc. 46, 101459. doi:10.1016/j.scs.2019.101459
Thom, R. (1976). Structural Stability and Morphogenesis. Pattern Recognition 8 (1), 61. doi:10.1016/0031-3203(76)90030-3
Värnild, A., Tillgren, P., and Larm, P. (2020). What Types of Injuries Did Seriously Injured Pedestrians and Cyclists Receive in a Swedish Urban Region in the Time Period 2003-2017 when Vision Zero Was Implemented? Public Health 181, 59–64. doi:10.1016/j.puhe.2019.11.019
Vavrek, R., and Chovancová, J. (2019). Assessment of Economic and Environmental Energy Performance of EU Countries Using CV-TOPSIS Technique. Ecol. Indicators 106, 105519. doi:10.1016/j.ecolind.2019.105519
Vorko-Jović, A., Kern, J., and Biloglav, Z. (2006). Risk Factors in Urban Road Traffic Accidents. J. Saf. Res. 37 (1), 93–98. doi:10.1016/j.jsr.2005.08.009
Wang, C., Quddus, M. A., and Ison, S. G. (2013). The Effect of Traffic and Road Characteristics on Road Safety: A Review and Future Research Direction. Saf. Sci. 57, 264–275. doi:10.1016/j.ssci.2013.02.012
Wang, C., Quddus, M., and Ison, S. (2009). The Effects of Area-wide Road Speed and Curvature on Traffic Casualties in England. J. Transport Geogr. 17 (5), 385–395. doi:10.1016/j.jtrangeo.2008.06.003
Wang, D., Brown, G., Zhong, G., Liu, Y., and Mateo-Babiano, I. (2015). Factors Influencing Perceived Access to Urban parks: A Comparative Study of Brisbane (Australia) and Zhongshan (China). Habitat Int. 50, 335–346. doi:10.1016/j.habitatint.2015.08.032
Wang, L., Ning, P., Yin, P., Cheng, P., Schwebel, D. C., Liu, J., et al. (2019). Road Traffic Mortality in China: Analysis of National Surveillance Data from 2006 to 2016. The Lancet Public Health 4 (5), e245–e255. doi:10.1016/S2468-2667(19)30057-X
Wendel-Vos, W., Droomers, M., Kremers, S., Brug, J., and Van Lenthe, F. (2007). Potential Environmental Determinants of Physical Activity in Adults: a Systematic Review. Obes. Rev. 8 (5), 425–440. doi:10.1111/j.1467-789X.2007.00370.x
Wier, M., Weintraub, J., Humphreys, E. H., Seto, E., and Bhatia, R. (2009). An Area-Level Model of Vehicle-Pedestrian Injury Collisions with Implications for Land Use and Transportation Planning. Accid. Anal. Prev. 41 (1), 137–145. doi:10.1016/j.aap.2008.10.001
Wolfe, M. K., and Mennis, J. (2012). Does Vegetation Encourage or Suppress Urban Crime? Evidence from Philadelphia, PA. Landscape Urban Plann. 108 (2), 112–122. doi:10.1016/j.landurbplan.2012.08.006
World Health Organization (2018). Global Status Report on Road Safety 2018. WHO’s Social Determinants of Health. Available at: https://www.who.int/publications/i/item/9789241565684.
Xing, L., Liu, Y., and Liu, X. (2018). Measuring Spatial Disparity in Accessibility with a Multi-Mode Method Based on Park green Spaces Classification in Wuhan, China. Appl. Geogr. 94, 251–261. doi:10.1016/j.apgeog.2018.03.014
Xu, M., Xin, J., Su, S., Weng, M., and Cai, Z. (2017). Social Inequalities of Park Accessibility in Shenzhen, China: The Role of Park Quality, Transport Modes, and Hierarchical Socioeconomic Characteristics. J. Transport Geogr. 62, 38–50. doi:10.1016/j.jtrangeo.2017.05.010
Xu, Y., Fu, C., Kennedy, E., Jiang, S., and Owusu-Agyemang, S. (2018). The Impact of Street Lights on Spatial-Temporal Patterns of Crime in Detroit, Michigan. Cities 79, 45–52. doi:10.1016/j.cities.2018.02.021
Yang, B.-Y., Markevych, I., Bloom, M. S., Heinrich, J., Guo, Y., Morawska, L., et al. (2019). Community Greenness, Blood Pressure, and Hypertension in Urban Dwellers: The 33 Communities Chinese Health Study. Environ. Int. 126, 727–734. doi:10.1016/j.envint.2019.02.068
Yang, H., Ma, Q., Wang, Z., Cai, Q., Xie, K., and Yang, D. (2020). Safety of Micro-mobility: Analysis of E-Scooter Crashes by Mining News Reports. Accid. Anal. Prev. 143, 105608. doi:10.1016/j.aap.2020.105608
Yankson, I. K., Browne, E. N. L., Tagbor, H., Donkor, P., Quansah, R., Asare, G. E., et al. (2010). Reporting on Road Traffic Injury: Content Analysis of Injuries and Prevention Opportunities in Ghanaian Newspapers. Inj. Prev. 16 (3), 194–197. doi:10.1136/ip.2009.024174
Yee, W. Y., Cameron, P. A., and Bailey, M. J. (2006). Road Traffic Injuries in the Elderly. Emerg. Med. J. 23 (1), 42–46. doi:10.1136/emj.2005.023754
Yu, H., Liu, P., Chen, J., and Wang, H. (2014). Comparative Analysis of the Spatial Analysis Methods for Hotspot Identification. Accid. Anal. Prev. 66, 80–88. doi:10.1016/j.aap.2014.01.017
Żak, J., and Kruszyński, M. (2015). Application of AHP and ELECTRE III/IV Methods to Multiple Level, Multiple Criteria Evaluation of Urban Transportation Projects. Transportation Res. Proced. 10, 820–830. doi:10.1016/j.trpro.2015.09.035
Zavadskas, E. K., Bausys, R., and Mazonaviciute, I. (2019). Safety Evaluation Methodology of Urban Public parks by Multi-Criteria Decision Making. Landscape Urban Plann. 189, 372–381. doi:10.1016/j.landurbplan.2019.05.014
Zhang, G., Guo, X., Li, D., and Jiang, B. (2019). Evaluating the Potential of LJ1-01 Nighttime Light Data for Modeling Socio-Economic Parameters. Sensors 19 (6), 1465. doi:10.3390/s19061465
Zhang, G., Yau, K. K. W., and Zhang, X. (2014). Analyzing Fault and Severity in Pedestrian-Motor Vehicle Accidents in China. Accid. Anal. Prev. 73, 141–150. doi:10.1016/j.aap.2014.08.018
Zheng, P., Hall, R. D., and McDonald, M. (2007). “Pedestrian Behaviour and Safety in the Presence of Guard Railing,” in Proceedings of the 2nd International Conference on System Safety, London, UK, 22-24/10/07 (IET Digital Library), 141–146. Paper presented at the. Available at: https://eprints.soton.ac.uk/53077/. doi:10.1049/cp:20070455
Zheng, Y., Lan, S., Chen, W. Y., Chen, X., Xu, X., Chen, Y., et al. (2019). Visual Sensitivity versus Ecological Sensitivity: An Application of GIS in Urban forest park Planning. Urban For. Urban Green. 41, 139–149. doi:10.1016/j.ufug.2019.03.010
Zhou, H., He, S., Cai, Y., Wang, M., and Su, S. (2019). Social Inequalities in Neighborhood Visual Walkability: Using Street View Imagery and Deep Learning Technologies to Facilitate Healthy City Planning. Sustainable Cities Soc. 50, 101605. doi:10.1016/j.scs.2019.101605
Keywords: active travel, urban green space, traffic safety, framework integration, spatial regression
Citation: Luo Y, Liu Y, Xing L, Wang N and Rao L (2022) Road Safety Evaluation Framework for Accessing Park Green Space Using Active Travel. Front. Environ. Sci. 10:864966. doi: 10.3389/fenvs.2022.864966
Received: 29 January 2022; Accepted: 12 April 2022;
Published: 13 May 2022.
Edited by:
Ying Jing, Zhejiang University, ChinaReviewed by:
Sanwei He, Zhongnan University of Economics and Law, ChinaCopyright © 2022 Luo, Liu, Xing, Wang and Rao. This is an open-access article distributed under the terms of the Creative Commons Attribution License (CC BY). The use, distribution or reproduction in other forums is permitted, provided the original author(s) and the copyright owner(s) are credited and that the original publication in this journal is cited, in accordance with accepted academic practice. No use, distribution or reproduction is permitted which does not comply with these terms.
*Correspondence: Yanfang Liu, eWFuZmFuZ2xpdTg4QDE2My5jb20=
Disclaimer: All claims expressed in this article are solely those of the authors and do not necessarily represent those of their affiliated organizations, or those of the publisher, the editors and the reviewers. Any product that may be evaluated in this article or claim that may be made by its manufacturer is not guaranteed or endorsed by the publisher.
Research integrity at Frontiers
Learn more about the work of our research integrity team to safeguard the quality of each article we publish.