 Jieqi Tan1
 Wei Lin
95% of researchers rate our articles as excellent or good
Learn more about the work of our research integrity team to safeguard the quality of each article we publish.
Find out more
ORIGINAL RESEARCH article
Front. Environ. Sci. , 09 March 2022
Sec. Environmental Informatics and Remote Sensing
Volume 10 - 2022 | https://doi.org/10.3389/fenvs.2022.862310
This article is part of the Research Topic Weather and Climate Extremes in the Urban Environment: Modeling and Observations View all 10 articles
The rapid process of urbanization has been accompanied by a disordered expansion of construction land, which has resulted in the degradation of ecosystem services. The identification of ecological security patterns (ESPs) is an important means to coordinating human-land relationships and carrying out ecological restoration strategies, which are of great significance to protecting ecological sustainability. However, previous studies have ignored the mutual impact of urbanization and ecological protection, which leads to the contradiction between them and useless of ESPs. This paper takes a rapidly urbanizing metropolitan area as an example. Ecological sources were identified based on the integration of ecosystem services and socioeconomic indicators by the Ordered Weighted Averaging (OWA) method, which considers the trade-off between ecosystems and socioeconomic systems. The Linkage Mapper tool was used to extract ecological corridors, and thus ecological barrier points and pinch points were identified to implement ecological restoration. ESPs included 158 ecological sources according to the results. In more detail, the ecological sources and corridors were mainly distributed in the area dominated by ecosystem indicators, whereas the central urban area contributed less ecological sources, which indicates that the trade-off between ecosystems and socioeconomic systems has a significant impact on the construction of ESPs. Specifically, 406 ecological corridors were classified into different resistance levels to extract 433.26 km2 barrier points and 458.51 km2 pinch points. The study also proposed primary and secondary ecological restoration strategies for medium-, high- and low-resistance corridors based on the optimization of ESPs, which could not only improve ecosystem quality, but also fulfil the demands of human well-being. The integration of ecosystems and socioeconomic systems improves the existing methods for identifying ecological sources and restoration priority areas, and provides a scientific basis for balancing the development of urbanization and ecological protection in metropolitan regions.
Along with the continuous urbanization of recent decades, disorderly expansion of urban construction land and significant loss of ecological land have restricted the sustainability of urban development (Feist et al., 2017; Peng et al., 2018; Zhai and Huang, 2022). Within a coupled human and natural system, the quantity and quality of the ecosystem services are impacted by anthropogenic disturbances, which affects regional landscape patterns and ecological security (Peng et al., 2017b). As a result, how to ensure the structural stability and functional security of natural ecosystems for sustainable urban development is an urgent issue (Li et al., 2015; Cumming and Allen, 2017; Serra-Llobet and Hermida, 2017). The construction of ecological security patterns (ESPs) was proposed to develop a method for improving ecological security. The ESPs, an interconnected ecological network composed of different ecosystems, is an effective approach to support biological species, maintain natural ecological processes and promote ecosystem services, as well as to achieve regional ecological sustainability (Su et al., 2016; Peng et al., 2018; Fu et al., 2020).The concept of ESPs was derived from landscape ecological planning in the 1990s (Yu, 1996). Many scholars have studied ESPs on different scales from the perspective of landscape ecology and urban planning (Peng et al., 2017b; Peng et al., 2018).
Landscape elements of key significance for ensuring regional ecological processes and ecosystem services, such as ecological sources, ecological corridors and strategic points, are all focused on ESPs (Dong et al., 2021; Gao et al., 2021). Therefore, the basic research paradigm of “identification of ecological sources, construction of resistance surfaces, and extraction of ecological corridors” has been gradually formed (Zhang et al., 2017). The strategy for selecting ecological source areas is fundamental to the construction of an ESPs, which is mainly conducted through assessing the ecological sensitivity, ecological importance or connectivity (Su et al., 2016) (Zhang et al., 2017). The method of identification of ecological sources has changed from the direct selection of nature reserves to the evaluation of ecosystem services that affect regional ecological security (Peng et al., 2017a; Wu et al., 2018). The integration of multiple ecosystem services, such as water yield and biodiversity protection, has been applied to source identification (Peng et al., 2018; Fu et al., 2020).
Integrating various components of coupled human and natural systems is necessary to address complex interconnections and to identify effective solutions to sustainability challenges (Liu et al., 2015). However, ecosystem services and human activities are seldom considered jointly in the assessment of ESPs (Wang et al., 2019); most studies have not adequately considered the ability to fulfill people’s demand for ecosystem services when identifying sources of ESPs, which still focus on ecological patches as the supplier of ecosystem services, ignoring the interaction between ecosystems and human socioeconomic systems (Zhang et al., 2017). These ecological patches with the ability to fulfill human demand (e.g., cultural ecosystem services) is essential to consider when evaluating their capacity to form part of the source area.
It is worth noting that previous studies that considered an integrated valuation approach weighting various overlapping types of ecosystem services, may have overlooked the relationships (trade-offs or synergies) between these services. This may have either induced space competition among multiple ecosystem services or undermined the causal interrelationship among multiple ecosystem services (Dai et al., 2017; Zhao et al., 2020; Pan and Li, 2021). There is thus an urgent need to study and balance the trade-offs among multiple ecosystem services in decision-making processes (Zhang et al., 2015). One of the multicriteria evaluation methods, the ordered weighted averaging (OWA) operator, was first developed in the context of fuzzy set theory (Yager, 1988). The use of the OWA method has proven to be an effective approach in decision-making processes, and proposed a set of scientific and flexible planning methods to balance multiple conflicting ecosystem services in ESPs construction processes (Zhao et al., 2020; Pan and Li, 2021). Moreover, increasing economic development has led to urbanization in previous undeveloped areas (Deng et al., 2021), and caused many ecological and environmental problems in the meanwhile. The increasing ecosystem services may lead to the control of the development of urbanization (Li et al., 2022). These are issues needed to be discussed, the mutual impact of urbanization and ecological protection has not been considered and the trade-off between ecosystems and the socioeconomic system is still unclear. To address this gap, socioeconomic indicators should be considered to integrate with ecosystem services in order to construct the ESPs. Therefore, the OWA method was introduced to resolve the contradiction between ecological protection and urbanization decisions in this study. The optimization of ESPs in most of the current studies focused on the improvement of the evaluation process (Peng et al., 2018; Wang et al., 2019). However, there was little research on optimization after the establishment of ESPs (Fu et al., 2020). ESPs can provide a practicable way for ecological restoration to spatially identify key landscape elements; existing studies have identified key restoration areas in ecological corridors, pinch points, break and barrier points (Wang et al., 2018; Fang et al., 2020), and put forward zoning ecological restoration solutions (Ying et al., 2019; Ni et al., 2020). In addition, the ecological restoration of a coupled ecosystem and socioeconomic system based on ESPs is still in its infancy.
In recent years, Guangzhou has grown rapidly and has spread in a disorderly manner (Fan et al., 2018), and the ecological land has been seriously damaged, which seriously affects the welfare of the residents (Zhang et al., 2020). Hence, the Municipality government of Guangzhou proposed a framework of ecological networks and corridors in the metropolitan area and municipal administrative area according to ecological civilization construction planning (2016–2020). There have been similar approaches to constructing an ecological network of Guangzhou and to improving environmental protection under rapid urbanization (Zhao et al., 2017; Yang et al., 2018). However, previous approaches focused solely on ecological elements, such as forest land, natural reserves and the habitats of crucial species, without using an ecosystem service importance evaluation. The studies mentioned above only assessed the landscape connectivity, failing to consider both the importance of ecosystem services and socioeconomic indicators, as well as restoration strategies. Therefore, it is urgent to move the process of ecological protection and restoration forward in order to identify key restoration regions for Guangzhou based on the optimization of the ESPs.
Based on the above considerations, the research objectives were to identify ecological sources by comprehensively evaluating the integration between ecosystem and socioeconomic indicators, to build ESPs based on the lowest cost path and identify the barrier point and pinch point for the corridors and to propose the optimization of the ecological restoration regions on the basis of ESPs.
Guangzhou is the central city in the Guangdong-Hong Kong-Macao Greater Bay Area, with a total area of 7434.4 km2. There are eleven municipal districts in Guangzhou (Figure 1). Having a topographical structure of densely forested mountains, the northern area is the ecological supporting area of Guangzhou. The central area, with its topography of hilly and basins, is the location of the socioeconomic center. Besides, the southern area is also a potential area for the future development of construction land due to the plain topography. With the rapid socioeconomic development of Guangzhou in the past decade, the construction land has expanded rapidly and the population has grown about 500,000 people per year. Therefore, Guangzhou has become one of the cities where the conflict between urban development and the ecological environment is most prominent in the Greater Bay Area (Li et al., 2021).
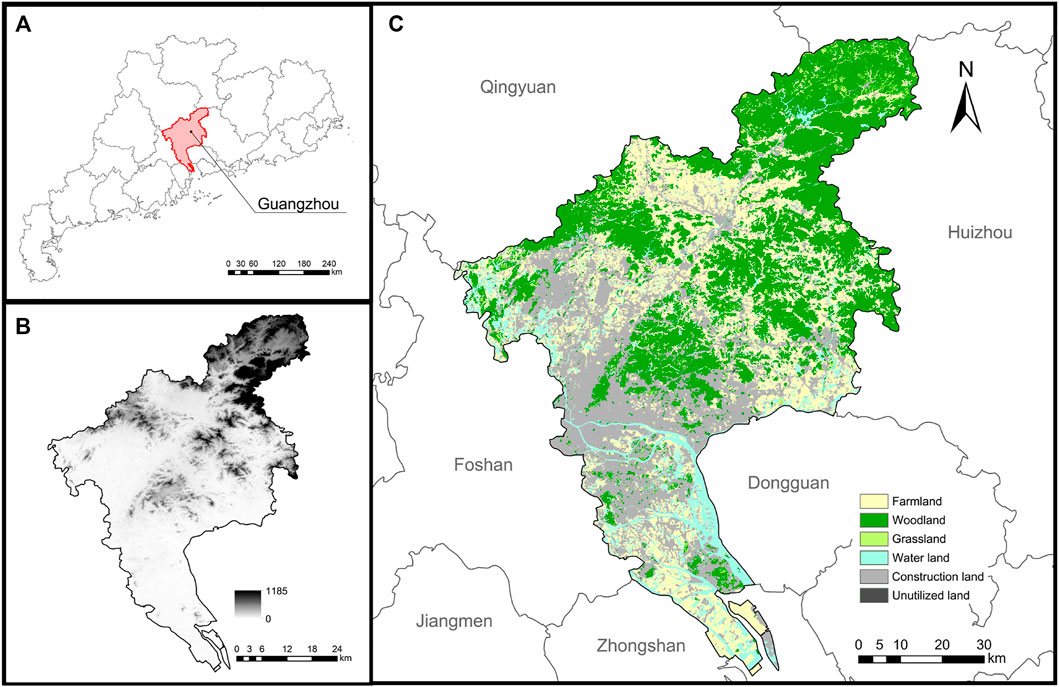
FIGURE 1. (A)is the site of the study area, (B) is the elevation of the study area, (C) is land cover types of the study area.
The basic data in this study mainly include: 1) the 2020 Globe Land 30M surface coverage dataset from Globe Land http://www.globallandcover.com/; 2) the 2020 GDEMV2 30M resolution digital elevation data from NASA https://search.earthdata.nasa.gov/search/; 3) Guangdong Province 30M resolution soil erodibility factor dataset from National Science and Technology Infrastructure Platform - National Earth System Science Data Center http://www.geodata.cn; 4) 2020 MODIS MOD13Q1 NDVI 16-days data from NASA https://modis.gsfc.nasa.gov/data/; 5) 2020 monthly values of basic elements of China’s international exchange station for meteorological radiation and monthly values of China’s ground climate data from the National Meteorological Science Data Center http://data.cma.cn/; 6) 2020 national urban road dataset from Gaode Map https://www.amap.com; 7) 2020 Guangzhou city POI data from Gaode Map https://www.amap.com; 8) NPP/VIIRS annual nighttime lighting index sourced from National Oceanic and Atmospheric Administration https://ncc.nesdis.noaa.gov/VIIRS/; 9) 100 m population density raster dataset for 2020 sourced from worldpop https://www.worldpop.org/; (10) Guangzhou City Park Directory http://lyylj.gz.gov.cn/attachment/6/6806/6806818/7295517.pdf
As shown in Table 1 and Figure 2, The assessment of the importance of ecosystem services is the basis for the construction of ESPs. In terms of the topography and land cover types of Guangzhou, the study area is facing some ecological problems of soil erosion, massive destruction of native vegetation, habitat fragmentation and the decline of water yield. Therefore, ecosystem services of Soil Conservation (SC), Habitat Quality (HQ) and Water Yield (WY) were selected as indicators and Carbon Fixation (CF) was also selected because it is a quantitative approach to the delineation of ecological redline for ecological protection in planning. In the meanwhile, due to the incomplete parks and recreation system and increasing demands of cultural ecosystem service in the study area, Cultural Service (CS) was also selected as ecosystem indicators. On the other hand, the degree of Land-use Development (LD), Population Density (PD) and Nighttime Data (NT) were selected to represent the socioeconomic system (Ding et al., 2019).
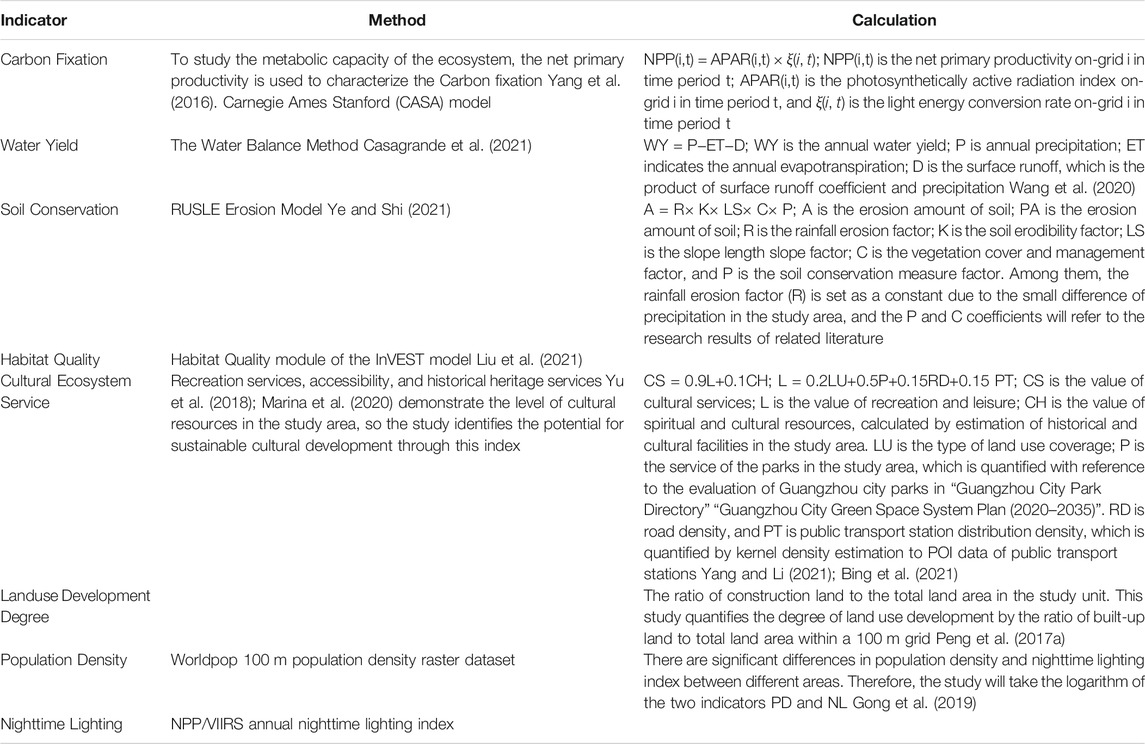
TABLE 1. Assessment methods.
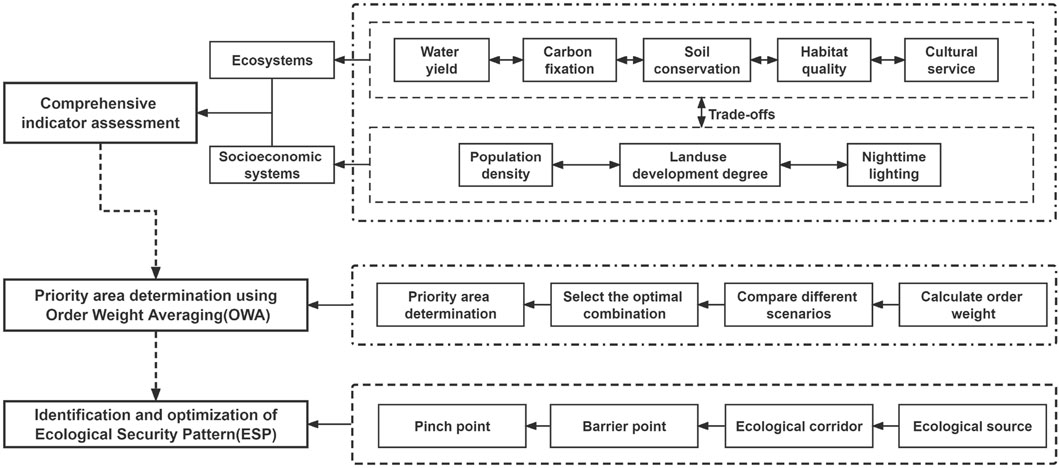
FIGURE 2. The research framework.
According to the previous study, ecosystem and socioeconomic indicator trade-offs and synergies were based on linear data fitting, which can show the direction and intensity of interactions between each of the two indicators (Li et al., 2020). In this study, we first used Pearson correlation analysis to form a correlation matrix by using the GGally package in R, version 4.1.1 The values of eight types of indicators were randomly extracted from a total of 50,000 locations at the scale of the study area. The Pearson correlation coefficients between two indicators were calculated and tested for significance. When the correlation coefficient between two indicators is positive, there was synergy between them. When the correlation coefficient is negative, there were trade-offs between the indicators (Chen et al., 2021). The magnitude of its absolute value reflects the degree of trade-offs or synergy between the indicators. Complex trade-offs may exist among different indicators of the same factor, while specific trade-offs may exist between the ecosystem and socioeconomic system.
Multicriteria evaluation (MCE) can measure and evaluate regional suitability by weighing multiple relationships (Valente and Vettorazzi, 2008). The OWA method can weigh different decision objectives to determine the optimal decision by performing spatial operations on each evaluation metric. OWA method presents different decision sets by considering the trade-off relationships between different criteria (Chen et al., 2021). OWA method can weigh different decision objectives to determine the optimal decision by controlling each evaluation indicator for spatial operations and balance multiple conflicting indicators in the decision-making process. By considering the trade-offs between different criteria, different decision scenarios were simulated and different decision sets were presented. The formula is as follows (Zhao et al., 2020):
where xij is the standardized comprehensive evaluation index value; sij is the sequence value arranged in descending order by xij through the size of the attribute value; wi is the order weight arranged in descending order by xij through the size of the attribute value; n is the number of indicators.
According to different decision risks, the bit-order weights generated and the trade-offs obtained based on the bit-order weights under various decision risks were calculated as follows:
In the formula, QRIM is the monotonical rule function; wi is the number of the bit order; n is the number of indicators; α is the decision risk coefficient under different decisions.
In this study, seven decision scenarios (α of 0.001,0.1,0.5,1,2,10,1000)were presented, It shows that under the decision scenario of α < 1, ecology space will be restricted protected or even reach the scenario of Complete Protection. On the other hand, changes in decision making from α = 1 to α = 1,000 gradually shows the scenario of developing with the risk of ecological destruction (Li et al., 2022). In the process of OWA method, eight evaluation indicators were min-max normalized from 0 to 1 and ranked in descending order by the mean size of the normalized values to obtain the rank order weights of each indicator. The decision risk level was ordered into seven types, and a total of eight decision scenarios were dynamically generated for different decision levels. By multiplying the rank order weights of each indicator with the weighted weight values of the eight assessment indicators and their indicator values, comprehensive ecosystem and socioeconomic evaluation maps can be obtained under different scenarios. The top 20% of each scenario were identified as ecological priority areas based on the comprehensive evaluation map (Chen et al., 2021). By comparing the degree of trade-off in different scenarios, the scenario with the highest degree of trade-off was selected as the optimal scenario. In this scenario, ecological conservation and socioeconomic development will be in dynamic balance, and the city will be in a state of effective conservation while developing (Li et al., 2022).
In this study, ecological sources were identified by combining ecosystem and socioeconomic system. Ecological priority areas of a certain size are essential for the material and energy connection of the ecological network (Cui et al., 2020). Referring to previous studies and the actual situation of Guangzhou (Long et al., 2018), our study integrated and screened all
Urban ecological corridors connect ecological sources in the urban system network (Mao et al., 2020). The resistance surface is the key to influencing material and energy flow between ecological sources. Therefore, the resistance surface value was determined based on the comprehensive evaluation value of the ecosystem and socioeconomic system. In particular, we normalized the integrated assessment value raster to calculate the resistance of the raster with the following equation (Peng et al., 2018).
where Ri is the surface value of resistance in grid i; Ai is the comprehensive evaluation value in grid i.
In the next step, the least-cost path was calculated by the Linkage Mapper tool and set the maximum cost-weight distance as 20,000 (Xu et al., 2021a). Linkage Mapper filters the optimal corridors from the source to the neighboring source to map the optimal paths by simulating the minimum cost distance accumulated by ecosystem services (Song and Qin, 2016). This study identifies each ecological corridor’s average resistance level by the ratio of the cost-weighted distance of each least-cost path to the Euclidean distance between sources. The corridor ratios were separated by the natural breakpoint method into extremely high resistance, high resistance, medium resistance, low resistance, and extremely low resistance (Su et al., 2021).
Barrier points are high-resistance areas that prevent ecological corridors from connecting to the ecological source (Pan and Wang, 2021). In this study, the Barriers Mapper function in the Linkage Mapper tool was used to identify ecological barriers by setting 250, 500, 750 and 1000 m as the search radius. Five intervals were set based on the identification results by the natural breakpoint method, and the highest-value interval was selected as the barrier point (Wang et al., 2022).
Ecological pinch point is a high-flow, key node in the ecological process, that should be protected as a priority. Pinch points play an important role in ecological connectivity, being in areas of high resistance and making a large contribution to connecting ecological corridors (Peng et al., 2018). Pinch points can be identified using the Pinch point Mapper function in the Linkage Mapper tool. In this study, the analysis results were divided by the natural breakpoint method. The category with the highest current values (which means the least average resistance distance) is extracted as the ecological pinch point (Zhu et al., 2020).
The normalization result of each indicator value was shown in Figure 3. The high values of HQ and SC were located in the northern area and river around the southern area, and therefore would be rich in biodiversity and high soil retention. Besides, the high value of CF was concentrated in the northern area due to the high vegetation cover and woodland there. What’s more, there was a relatively low WY capacity due to the effects of high urbanization in the central area. By contrast WY was generally at high value in the northern and southern areas because of abundant precipitation and the impact of rivers in the study area. However, compared with other ecosystem indicators, the high value areas of the CS are situated sporadically in the large forest parks and landscape areas from northern and central area in hilly. In addition, the indicators from the socioeconomic system including LD, PD and NL were highly similar. Their high value was concentrated in the highly urbanized areas in the central area and the southern area under rapid development (Ding et al., 2019).
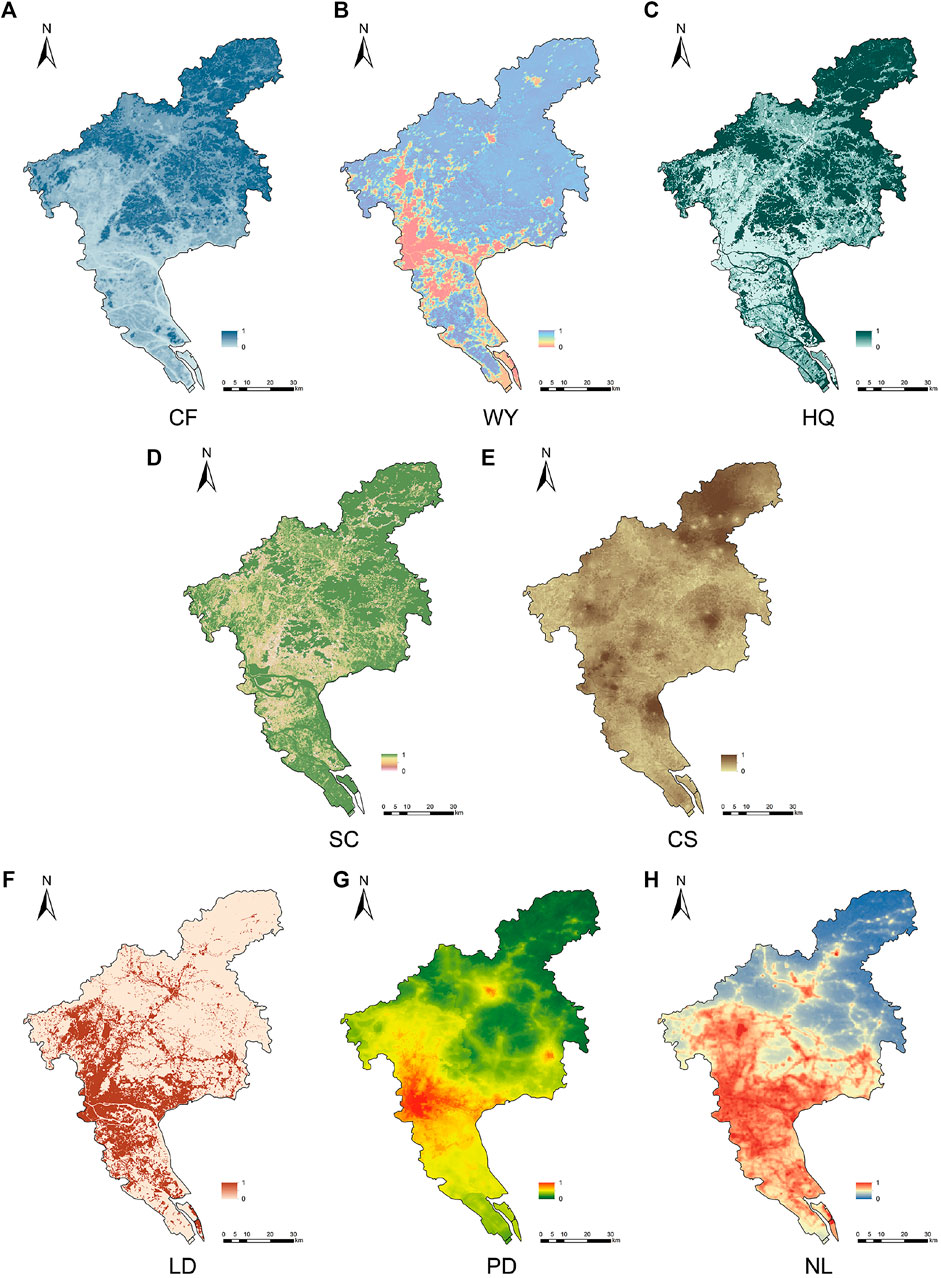
FIGURE 3. Spatial pattern of ecosystem and socioeconomic system indicators in Guangzhou.
The study calculated the correlation coefficients among the comprehensive evaluation indicators (Figure 4).The correlation coefficients between ecosystem indicators generally showed a positive correlation. Most indicators’ correlation indices were concentrated in the range of 0.1–0.5. The correlation between CF-WY (0.544) and CF-HQ (0.705) showed a significantly positive correlation, indicating synergies between these two relationships, while CS weakly correlated with WY and SC at 0.012 and 0.037, respectively. On the other hand, the data revealed significant positive correlations between the socioeconomic indicators.

FIGURE 4. Correlation matrix.
Overall, all indicators show negative correlation between ecosystem and socioeconomic system, which indicates that there was an apparent trade-off relationship between them.
As shown from Table 2, with the increase in the decision risk coefficient, the rank order weight of high-level comprehensive evaluation indexes decreases continuously. In contrast, the rank order weight of low-level comprehensive evaluation indicators increases continuously.
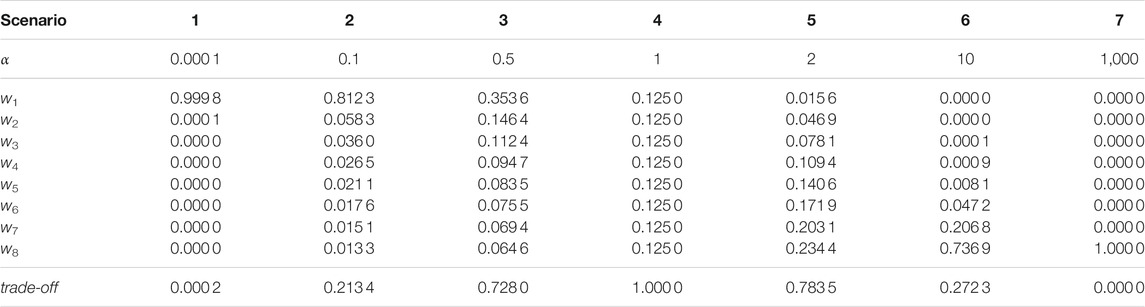
TABLE 2. Bit order weight operators under different decision risk scenarios.
Under different scenarios, the top 20% of the comprehensive evaluation value was selected as the ecological priority area. Consequently, the map of ecological priority areas under different scenarios was shown (Figure 5). From the seven different types of scenarios (Table 3), it can be seen that the decision result was optimistic at α = 0.001,0.1,0.5. The high-value areas were mainly concentrated in the north and south of the study area, and most of the land types in the ecological priority protection areas were woodlands. Obviously, this type of scenario makes it difficult to develop construction land and maybe not easy to meet the growing population needs of megacities. Meanwhile, the criterion weights of all indicators in this study were 0.125 when α = 1. The high-value areas were evenly distributed throughout the study area, and the ecological priority areas were mainly forest land at that time. Moreover, farmland, water area and construction area occupy part of the ecological priority area. The comprehensive evaluation weighting value was the largest when α = 1. However, when α = 2,10,1000, the decision result was pessimistic. The high-value area was concentrated in the central area, and the ecological priority protection area was mainly dominated by construction land. The indicator of the socioeconomic system currently dominates the comprehensive evaluation indicator, and the area was at a high-risk level. As the ecological risk gradually increases, the ecological priority area changes from green space, woodland and grassland, to farmland and construction areas.
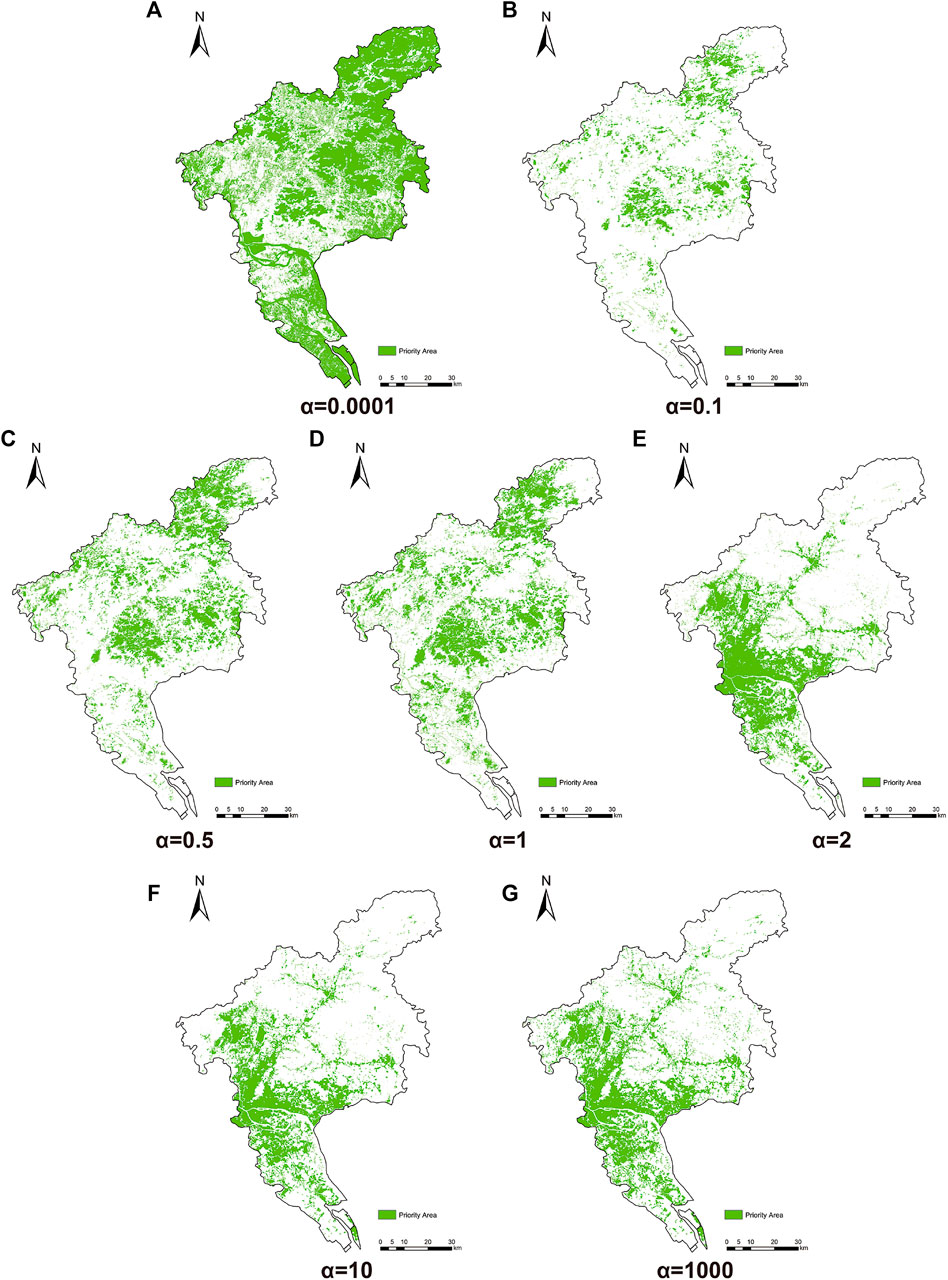
FIGURE 5. Ecological priority area of different scenarios in Guangzhou.
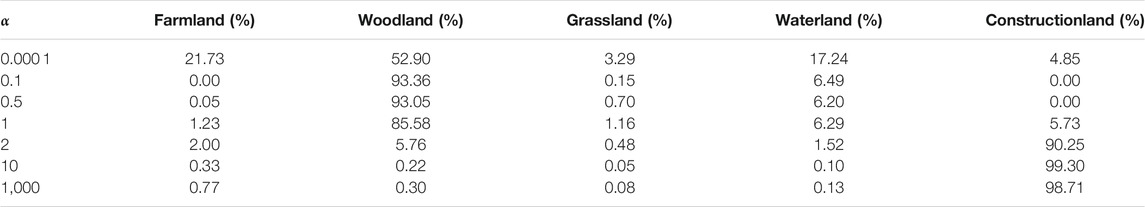
TABLE 3. Changes in the proportion of land use in ecological priority areas under different scenarios.
By simulating the decision risk of each scenario in the OWA method, the result (α = 1), with the highest trade-off was selected as the final scenario. Therefore, the comprehensive evaluation was shown in Figure 6A and resistance surface was shown in Figure 6B based on the final scenario. In this study, spots of more than 1 km2 were selected as ecological sources of the study area.
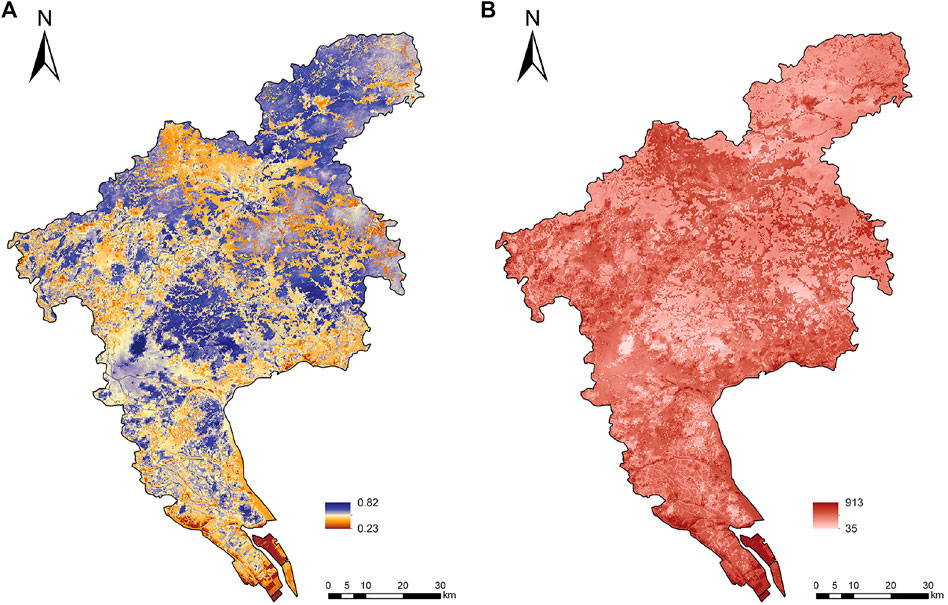
FIGURE 6. (A) is comprehensive evaluation, (B) is resistance surface.
According to Figure 7, the number of ecological sources was 158 and the total area of ecological sources was 1,085.34km2, accounting for 15.03% of the total area of Guangzhou.
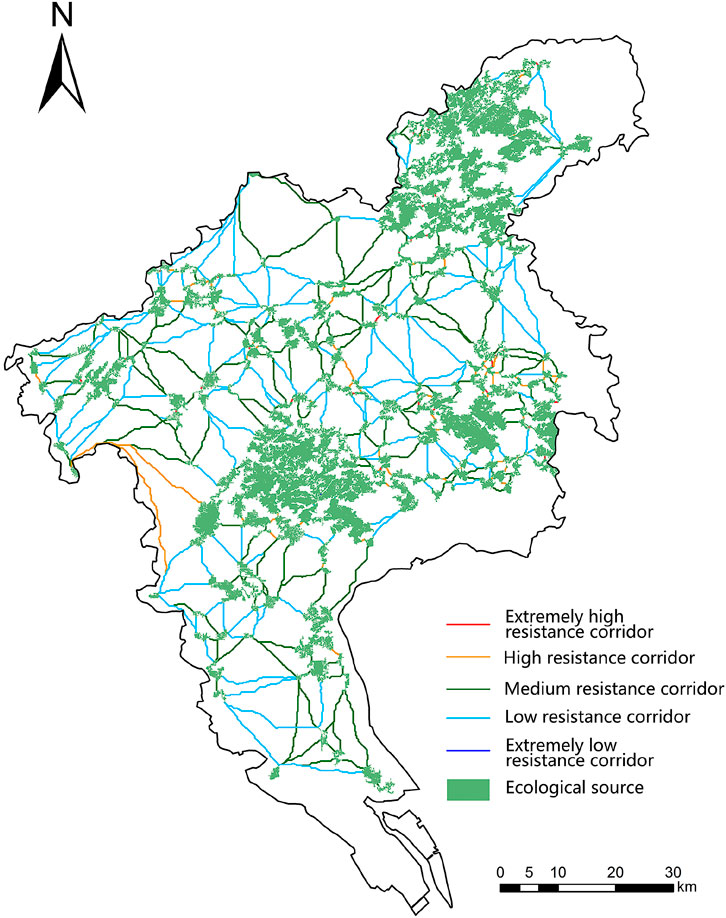
FIGURE 7. Ecological source and corridor.
From the spatial layout, most ecological sources were distributed in the northern area, accounting for 84.91% of the total area of ecological sources.
The ecological sources in the central area account for 8.88% of the total area of ecological sources. This revealed the fragmentation of green space caused by the expansion of urban construction areas in the central area of Guangzhou, as there were relatively few ecological sources with eligible area and high comprehensive evaluation values.
Moreover, the area of ecological sources in the southern part accounts for 6.21% of the total area of ecological sources. The ecosystem values were much lower than those of the northern part of the study area, where woodland was the main land cover type. The socioeconomic system indicators were lower than those of the central area due to the lack of urbanization activities and population density, which results in a low overall evaluation value. Ecological sources were spatially scattered, and the area of individual sources was small.
Most of the ecological sources were woodland, accounting for 85.58% of the total area of ecological sources, with a small proportion of water land and construction land. Due to the trade-offs between ecosystem and socioeconomic system, the sources in the northern and southern area were mostly dominated by ecosystem indicators. Moreover, the ecological sources in the central urban area were generally dominated by economic indicators.
In total, 406 major ecological corridors with a total length of 1520 km and an average length of 3.3 km were identified in Guangzhou. As shown in Figure 7, the ecological corridor in Guangzhou was uniformly distributed, changing from dense in the northern area to sparse in the southern area.
The northern area in Guangzhou has the largest number of ecological corridors, with 334 in total. There was a short average corridor length due to the dense and continuous distribution of ecological sources. Some of the smaller ecological sources connect the northern area through dense, low-cost-distance corridors, occupying most of the area. Therefore, most of the northern corridor could maintain the connectedness of the whole area. There was the lowest number of ecological corridors in the central area, at 30. The spatial layout of corridors in this area was in a circular radial shape. The socioeconomic system index-driven ecological sources link the northern and southern parts, increasing ecological space connectedness in the central zone. However, the average cost distance of corridors in the region was much higher. There were 41 ecological corridors in the southern area. Due to the remote distance between ecological sources, the average distance of corridors was relatively long, and they have a higher cost distance. The southern area was in its initial development stage, and the socioeconomic conditions were far lower than the central area.
Overall, 30 extremely high-, 65 high-, 161 medium-, 147 low- and 2 extremely low-resistance corridors were identified. Extremely high- and high-resistance corridors were normally distributed in the north area, at extremely close distances among the ecological sources. However, the intervening patches of extremely low ecological value significantly reduce the connectedness of the corridor between two sources. Furthermore, medium-resistance corridors were generally located in two ecological sources with longer cost-weighted distances. The complex and various land-use types have an impact on the overall resistance of the corridor.
Comparing the results of the different radii, the four different radii have a similar range of barriers. The search results from a smaller radius can accurately search for a higher barrier score in the fine area in the corridor. Therefore, a 250 m radius was selected to identify ecological barrier point and the total area was 433.26 km2 (Figure 8A).
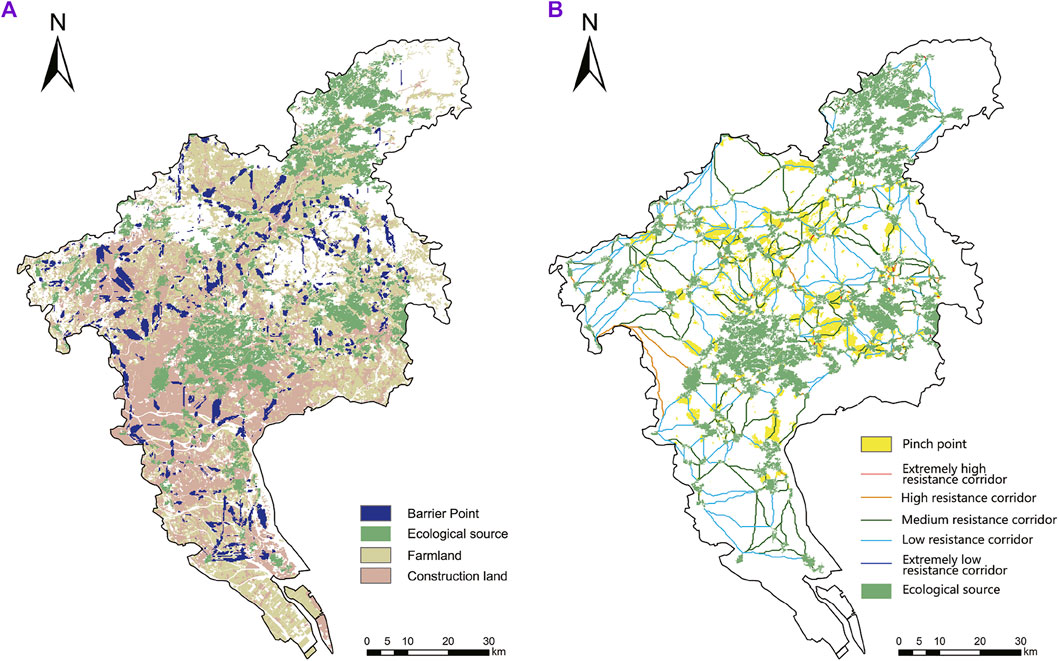
FIGURE 8. (A) is ecological barrier point, (B) is ecological pinch point.
Most of the ecological barrier points were located in the farmland and construction land. When it comes to the spatial layout, there were a large number of scattered barrier points in the northern part of the study area, and it would be very difficult to completely remove them in the future. In the central and southern areas, there were large-scale barrier points. Corridor connectivity can be significantly improved by removing barrier points in this area. Ecological restoration measures should be recommended for optimization.
The results (Figure 8B) show that the ecological pinch points were mainly located in the northern area. Pinch points were mostly situated in woodland, with a small amount in farmland and construction land. On the other hand, in the southern area, the proportion of pinch points in farmland and construction land was significantly higher.
The narrow pinch point area acts as a catalyst for corridor connectively when the relatively high-resistance patches spread around the area. However, the analysis of ecological corridors with different resistance types shows that although the study identifies high-value pinch points, they were mostly in low-resistance corridors. Medium- and high-resistance corridors were impeded by the disorderly encroachment of construction land in the northern and southern areas, resulting in the fragmentation of green space and farmland patches. The fragmented areas were highly mixed with various land-use types, and therefore contribute less to connectivity.
Previous studies directly select forest patches or habitat areas of wild animals as source areas, but the subjective interference in this selection method was large. Although good accessibility was considered in this selection method, the results only identified ecological patches as the sources of Guangzhou (Yang et al., 2018). Therefore, the high comprehensive value areas in other land-use types tend to be ignored. Furthermore, by changing the selection criteria of sources, the importance of core patches could also be quantitatively evaluated based on the structure of ecosystem and ecological sensitivity (Peng et al., 2017a; Su et al., 2022). The ecosystem services-based ESPs were regarded as an effective method for strengthening the integrity of ecosystems and socioeconomic systems (Fan et al., 2021). It is reasonable to rank patches based on their multifunction of providing key ecosystem services, however, the interaction between the ecosystem and human socioeconomic system cannot be neglected due to the role of ESPs in figuring out the contradiction between ecological land protection and urban development.
We proposed a comprehensive selection method containing five crucial ecosystem services in Guangzhou; aside from regulation and provision ecosystem services, cultural services were also included to quantify the importance of ecological areas. To understand the relationship between ecosystem and socioeconomic system, several scenarios based on the OWA method were compared to identify the ecological sources. Our approach identified the demand for human well-being and the ability to provide effective services (Peng et al., 2017a). Green space and parks in the central part of Guangzhou were also extracted, although the patches were fragmented due to the expansion of construction land. Specifically, a small proportion of construction land also extracted due to the trade-offs between ecosystem and socioeconomic system, which can be identified as the strategic points in the ESPs. Our selection method, therefore, is more conducive to the identification of ecological sources.
In the context of global climate change and anthropogenic disturbances, socioeconomic development will lead to more prominent eco-environmental problems (Liu, 2016). Aiming to solve problems of ecological security,the Guangzhou government has carried out a series of projects and plans such as ecological protection redline, however, these “bottom-line” policies mainly concerned ecological space while neglected the human-land contradiction in metropolitan area (Xu et al., 2021b), or neglect the potential crucial patches outside the ecological protection redline (Ye et al., 2018). To address this gap, this study considered both the ecosystem and socioeconomic system to construct the ESPs. It is worth noting that the most ecological sources were distributed in the hilly area with woodland, which tend to be threatened by unforeseeable human activities. It should be of great concern to integrate ecosystem and socioeconomic system to deal with future climate changes and sustainable development.
Previous studies mostly used the artificial discrimination method to eliminate results directly, but it was not easy to determine the ecological sources (Fu et al., 2020). In this study, the ecological sources were selected under the specified threshold, and as a result, ecological sources in the southern and central areas of Guangzhou were much less abundant than in the northern area. Several important “green core” areas such as Dafu Mountain, Seagull Island, and Huang Shan lu forest park were identified. Some important patches such as Nansha wetland in the southern area were eliminated due to their small area, though they may have potential value in other ecosystem services. Future study is still needed to determine the rationality of the threshold, and the assessment indexes need to be enhanced to make sure that the ecological sources are in their best state.
Referring to related studies, the selection of ecosystem indicators is mainly based on support, cultural and regulating services. However, the farmland is usually contributed to the provision of ecosystem services and may be underestimated when the study does not select food production as an indicator (Xu et al., 2014). As a result, high-quality farmland in the southern area may not be highly valued, leading to a reduction in ecological sources in the south. Therefore, the range of evaluation indicators could be expanded in future studies, which could add into the integration of ecosystem and socioeconomic system relationships in comparison with the results of current studies.
The connectivity of heterogeneous landscapes can be effectively identified by the least-cost path. However, the identification of corridor importance merits further discussion (Song and Qin, 2016). Circuit theory can provide multiple potential corridors and contribute to identifying corridors of priority importance (Liu et al., 2021; Pan and Wang, 2021), but it is not possible to intuitively investigate corridor movement pathways and connectivity because of random-walk (LaPoint et al., 2013). Therefore, we use the intuitive least-cost path to describe the priority of each corridor and ratio of cost-weighted distance to length to determine the relative resistance. This could be more flexible in researching corridor connectivity. However, compared with circuit theory it is still insufficient in identifying the importance of multiple pathways (McRae et al., 2008).
Different ecological corridor widths have an impact on the identification of ecological barrier points and pinch points. Consequently, they can provide the scientific basis for the definition of ecological restoration and protection areas in ecological corridors (Hou et al., 2021). An agreement regarding the widths of different ecological corridors has not yet been reached (Peng et al., 2017c). Therefore, determining the widths of corridors is an essential point in the implementation of ESPs (Zhai and Huang, 2022). However, this has not been discussed due to the constraints of the study, but should be considered in future research.
Different strategies should be proposed depending on the land-use types of different areas. For the northern areas dominated by the ecosystems, it is necessary to consider this area as the role of the ecological supporting area and focus on ecological conservation strategy. Ecological protection areas such as forest parks should be strictly protected, while appropriate recreational services should be provided as rationally direct ecological resources. For the central area, which is dominated by socioeconomic systems, small green spaces should be constructed and distributed throughout the area. Moreover, green spaces should be designed to deliver recreational and cultural characteristics, balancing ecosystem values with socioeconomic system values. In addition, in the southern area, which is a potential area for urban construction in Guangzhou according to Territorial Spatial Planning, the expansion of construction land should be rationally restricted to prevent the shrinkage of ecological space. Strategies such as exposure to green space and ecological greenways (Zhang et al., 2021), which can deliver different kinds of ecosystem services and enhance the multifunctionality of corridors, are recommended to integrate complementary ecosystem connectivity (Carlier and Moran, 2019).
Corridors play an important role in the maintenance of ecological processes (Peng et al., 2018). Furthermore, in order to implement ecological restoration in ecological corridors, the areas of barriers points and pinch points should be given more priority (Peng et al., 2018). Medium-to-high-resistance ecological corridors should be set as priority areas for future ecological restoration. Ecological restoration should start by prioritizing the removal of ecological barriers. In urban spaces, corridors should be connected by road green belts and greenways. It is possible to improve the corridor barrier points by enriching the green space with various types, vegetation species and vertical structures. Furthermore, the barrier point can be also improved by combining green and blue spaces to form an ecological network and green infrastructure (Yu et al., 2020), which simultaneously contribute to human well-being and sustainable climate adaption planning (Ignatieva et al., 2011; Monteiro et al., 2020; Yang et al., 2020; Yu et al., 2021). When it comes to the connectedness of farmland, high-standard farmland should be interpenetrated by building connecting channels within the space which could interfere with the corridor’s connectivity.
Ecological pinch points should be a conservation priority, including strategies to maintain and recover the areas (Castilho et al., 2015). It is necessary to integrate the fragmented patches through land consolidation, which can integrate different spaces with various land-use types in a unified way and carry out spatial reconfiguration. Low-resistance ecological corridors should be flexibly maintained. These scattered barrier points can be set as secondary areas for ecological restoration and can be gradually improved by nature-based solutions (Bush and Doyon, 2019). In the future, the area needs to avoid being divided into fragmented spaces. Throughout the stages of development, these areas should be centrally classified by a unified authority, which will also facilitate maintenance at a later stage.
Although previous studies have identified ecological security patterns based on multiple ecosystem services, traditional methods only identified what were considered “ecological patches” as the suppliers, and lacked integration between ecosystems and the socioeconomic systems. This study selected comprehensive evaluation indicators including ecosystems and socioeconomic systems to identify ecological sources, introducing the OWA method from the perspective of trade-off. The highest trade-off scenario was selected and, finally, the ecological sources and resistance surfaces were identified.
There were 158 ecological sources with an area of 1,085.34 km2 and 406 ecological corridors with a total length of 1506 km in Guangzhou. The pattern of ecological sources and corridors from various areas were influenced by the dominant ecosystem or socioeconomic system, which indicates that the trade-off between ecosystem and socioeconomic system has a significant impact on the construction of ESPs. Moreover, ecological barrier points and pinch points with total areas of 433.26 and 458.51 km2, respectively, were recognized to implement ecological restoration. This study also proposed primary ecological restoration strategies for medium- and high-resistance corridors. A large number of scattered barrier points were located in the northern area and large-scale barrier points were generally situated in the central and southern areas. Therefore, restoration strategies including enriching vegetation types and vertical structures and building green belts and greenways should be proposed to restore large-scale barriers points. When it comes to pinch points, land consolidation strategies such as construction land reclamation and farmland preservation should be implemented in medium- and high-resistance corridors, while buffer zones should be constructed to enhance the resilience of low-resistance corridors. This could achieve the win-win scenario of preserving ecological space while furthering urban development.
The integration of ecosystems and the socioeconomic systems was used as a fundamental basis to improve the existing methods of constructing ecological security patterns. The proposed ecological restoration solutions based on this method contribute to the overall improvement of the connectivity of the ESPs, offering a reference for balancing the development of urbanization and ecological protection in other metropolitan areas.
Information about the existing publicly accessible datasets is contained within the article, further inquiries can be directed to the corresponding author.
Conceptualization, WL JT, and HL; methodology, WL and JT; data analysis, JT; validation, WL and JT; investigation, WL; resources, WL; writing—original draft preparation, JT and WL; writing—review and editing, WL and HL; visualization, JT; supervision, WL and HL; project administration, HL; funding acquisition, HL All authors have read and agreed to the published version of the manuscript.
This research was financially supported by the National Natural Science Foundation of China (No. 52078222), and the Key Research Project of Department of Education of Guangdong Province (No. 2020ZDZX1033).
The authors declare that the research was conducted in the absence of any commercial or financial relationships that could be construed as a potential conflict of interest.
All claims expressed in this article are solely those of the authors and do not necessarily represent those of their affiliated organizations, or those of the publisher, the editors and the reviewers. Any product that may be evaluated in this article, or claim that may be made by its manufacturer, is not guaranteed or endorsed by the publisher.
The authors are grateful to the reviewers and editors for their detailed comments and valuable suggestions.
Bing, Z., Qiu, Y., Huang, H., Chen, T., Zhong, W., and Jiang, H. (2021). Spatial Distribution of Cultural Ecosystem Services Demand and Supply in Urban and Suburban Areas: A Case Study from Shanghai, china. Ecol. Indic. 127, 107720. doi:10.1016/j.ecolind.2021.107720
Bush, J., and Doyon, A. (2019). Building Urban Resilience with Nature-Based Solutions: How Can Urban Planning Contribute? Cities 95, 102483. doi:10.1016/j.cities.2019.102483
Carlier, J., and Moran, J. (2019). Landscape Typology and Ecological Connectivity Assessment to Inform Greenway Design. Sci. Total Environ. 651, 3241–3252. doi:10.1016/j.scitotenv.2018.10.077
Casagrande, E., Recanati, F., Rulli, M. C., Bevacqua, D., and Melià, P. (2021). Water Balance Partitioning for Ecosystem Service Assessment. A Case Study in the Amazon. Ecol. Indic. 121, 107155. doi:10.1016/j.ecolind.2020.107155
Castilho, C. S., Hackbart, V. C. S., Pivello, V. R., and dos Santos, R. F. (2015). Evaluating Landscape Connectivity for Puma Concolor and panthera Onca Among atlantic forest Protected Areas. Environ. Manage. 55, 1377–1389. doi:10.1007/s00267-015-0463-7
Chen, T., Li, P., and Wang, Q. (2021). Identification of Ecological Security Patterns in Chengdu-Chongqing Urban Agglomeration Based on Multi-Scenario Decision Making and Ecosystem Service Trade-Offs. Chin. Environ. Sci., 1–23. doi:10.19674/j.cnki.issn1000-6923.20210324.001
Cui, L., Wang, J., Sun, L., and Lv, C. (2020). Construction and Optimization of green Space Ecological Networks in Urban Fringe Areas: A Case Study with the Urban Fringe Area of Tongzhou District in Beijing. J. Clean. Prod. 276, 124266. doi:10.1016/j.jclepro.2020.124266
Cumming, G. S., and Allen, C. R. (2017). Protected Areas as Social-Ecological Systems: Perspectives from Resilience and Social-Ecological Systems Theory. Ecol. Appl. 27, 1709–1717. doi:10.1002/eap.1584
Dai, E.-f., Wang, X.-l., Zhu, J.-j., and Xi, W.-m. (2017). Quantifying Ecosystem Service Trade-Offs for Plantation forest Management to Benefit Provisioning and Regulating Services. Ecol. Evol. 7, 7807–7821. doi:10.1002/ece3.3286
Deng, C., Liu, J., Nie, X., Li, Z., Liu, Y., Xiao, H., et al. (2021). How Trade-Offs between Ecological Construction and Urbanization Expansion Affect Ecosystem Services. Ecol. Indic. 122, 107253. doi:10.1016/j.ecolind.2020.107253
Ding, Y., Zhang, L., and Zeng, X. (2019). The Construction of an Ecological Function Network and its Application in the Greater bay Area, china. J. Ecol. Rural Environ. 35, 573–581. doi:10.19741/j.issn.1673-4831.2018.0244
Dong, J., Jiang, H., Gu, T., Liu, Y., and Peng, J. (2021). Sustainable Landscape Pattern: a Landscape Approach to Serving Spatial Planning. Landscape Ecol. 37, 31–42 .doi:10.1007/s10980-021-01329-0
Fan, S., Chen, X., Ren, H., Shen, W., Rongbo, X., Zhang, Q., et al. (2018). Landscape Structure and Network Characteristics of the Greenway System in Guangzhou City, south china. Landscape Ecol. Eng. 15, 25–35. doi:10.1007/s11355-018-0358-x
Fan, F., Liu, Y., Chen, J., and Dong, J. (2021). Scenario-based Ecological Security Patterns to Indicate Landscape Sustainability: a Case Study on the Qinghai-Tibet Plateau. Landscape Ecol. 36, 2175–2188. doi:10.1007/s10980-020-01044-2
Fang, Y., Wang, J., Huang, L.-y., and Zhai, T.-l. (2020). Determining and Identifying Key Areas of Ecosystempreservation and Restoration for Territorial Spatial Planning Based on Ecological Security Patterns: A Case Study of Yantai City. J. Nat. Res. 35, 190. doi:10.31497/zrzyxb.20200116
Feist, B. E., Buhle, E. R., Baldwin, D. H., Spromberg, J. A., Damm, S. E., Davis, J. W., et al. (2017). Roads to Ruin: Conservation Threats to a sentinel Species across an Urban Gradient. Ecol. Appl. 27, 2382–2396. doi:10.1002/eap.1615
Fu, Y., Shi, X., He, J., Yuan, Y., and Qu, L. (2020). Identification and Optimization Strategy of County Ecological Security Pattern: A Case Study in the Loess Plateau, china. Ecol. Indic. 112, 106030. doi:10.1016/j.ecolind.2019.106030
Gao, J., Du, F., Zuo, L., and Jiang, Y. (2021). Integrating Ecosystem Services and Rocky Desertification into Identification of Karst Ecological Security Pattern. Landscape Ecol. 36, 2113–2133. doi:10.1007/s10980-020-01100-x
Gong, J., Liu, D., Zhang, J., Xie, Y., Cao, E., and Li, H. (2019). Tradeoffs/synergies of Multiple Ecosystem Services Based on Land Use Simulation in a Mountain-basin Area, Western china. Ecol. Indic. 99, 283–293. doi:10.1016/j.ecolind.2018.12.027
Hou, Q., Du, Y., Dong, W., Zeng, Z., Zhang, L., Duan, Y., et al. (2021). Smart City Oriented Ecological Corridor Layout of Sanshui River basin in Arid Area of Loess Plateau. Sustainable Energ. Tech. Assess. 44, 100993. doi:10.1016/j.seta.2021.100993
Ignatieva, M., Stewart, G. H., and Meurk, C. (2011). Planning and Design of Ecological Networks in Urban Areas. Landscape Ecol. Eng. 7, 17–25. doi:10.1007/s11355-010-0143-y
LaPoint, S., Gallery, P., Wikelski, M., and Kays, R. (2013). Animal Behavior, Cost-Based Corridor Models, and Real Corridors. Landscape Ecol. 28, 1615–1630. doi:10.1007/s10980-013-9910-0
Li, C., Zheng, H., Li, S., Chen, X., Li, J., Zeng, W., et al. (2015). Impacts of Conservation and Human Development Policy across Stakeholders and Scales. Proc. Natl. Acad. Sci. 112, 7396–7401. doi:10.1073/pnas.1406486112
Li, Z., Deng, X., Jin, G., Mohmmed, A., and Arowolo, A. O. (2020). Tradeoffs between Agricultural Production and Ecosystem Services: A Case Study in Zhangye, Northwest china. Sci. Total Environ. 707, 136032. doi:10.1016/j.scitotenv.2019.136032
Li, X., Xiao, J., Wang, J., Wu, J., and Long, N. (2021). Research on the Evaluation and Application of Natural Resources Assets for Ecological Restoration: A Case Study of Guangzhou City. Acta Ecol. Sin. 42, 1192–1202.
Li, H., Yao, Y., Yang, X., Dong, X., Yang, J., Ma, Z., et al. (2022). Simulating Ecologucal Security Pattern in the Xiong’an New Area Based on the Multicriteria Evaluation of AHP-OWA. Acta Ecol. Sin. 42 (1), 1–11. doi:10.5846/stxb202010162642
Liu, J., Mooney, H., Hull, V., Davis, S. J., Gaskell, J., Hertel, T., et al. (2015). Systems Integration for Global Sustainability. Science 347, 1258832. doi:10.1126/science.1258832
Liu, Z., Huang, Q., and Yang, H. (2021). Supply-demand Spatial Patterns of Park Cultural Services in Megalopolis Area of Shenzhen, china. Ecol. Indicators 121, 107066. doi:10.1016/j.ecolind.2020.107066
Liu, G. (2016). Formation and Evolution Mechanism of Ecological Security Pattern in Southwest china. Acta Ecol. Sin. 36, 7088–7091. doi:10.5846/stxb201611212364
Long, N., Huang, H., Li, X., Wu, J., and Lei, D. (2018). A Research on Urban Ecological Corridors Network Planning of Megacities: A Case Study of Guangzhou. Urban. Architect. 3, 53–57. doi:10.19892/j.cnki.csjz.2018.03.010
Mao, C., Dai, L., Qi, L., Wang, Y., Zhou, W., Zhou, L., et al. (2020). Constructing Ecological Security Pattern Based on Ecosystem Services: A Case Study in Liaohe River basin, Liaoning Province, china. Acta Ecol. Sin. 40, 6486–6494. doi:10.5846/stxb201909191954
Marina, L. S., Antonio, T. C., and Mercedes, L. G. d. P. (2020). The Potential Role of Cultural Ecosystem Services in Heritage Research through a Set of Indicators. Ecol. Indic. 117, 106670. doi:10.1016/j.ecolind.2020.106670
McRae, B. H., Dickson, B. G., Keitt, T. H., and Shah, V. B. (2008). Using Circuit Theory to Model Connectivity in Ecology, Evolution, and Conservation. Ecology 89, 2712–2724. doi:10.1890/07-1861.1
Monteiro, R., Ferreira, J. C., and Antunes, P. (2020). Green Infrastructure Planning Principles: An Integrated Literature Review. Land 9, 525. doi:10.3390/land9120525
Ni, Q., Hou, H., Ding, Z., Li, Y., and Li, J. (2020). Ecological Remediation Zoning of Territory Based on the Ecological Security Pattern Recognition: Taking Jiawang District of Xuzhou City as an Example. J. Nat. Res. 35, 204. doi:10.31497/zrzyxb.20200117
Pan, J., and Li, L. (2021). Optimization of Ecological Security Pattern in Gansu Section of the Yellow River basin Using OWA and Circuit Model. Trans. Chin. Soc. Agric. Eng. 37, 259–268. doi:10.11975/j.issn.1002-6819.2021.03.031
Pan, J., and Wang, Y. (2021). Ecological Security Evaluation and Ecological Pattern Optimization in Taolai River basin Based on CVOR and Circuit Theory. Acta Ecol. Sin. 41, 2582–2595. doi:10.5846/stxb202005111183
Peng, J., Yang, Y., Xie, P., and Liu, Y. (2017a). Zoning for the Construction of green Space Ecological Networks in Guangdong Province Based on the Supply and Demand of Ecosystem Services. Acta Ecol. Sin. 37, 4562–4572. doi:10.1016/j.chnaes.2016.12.002
Peng, J., Zhao, H., Liu, B., and Wu, J. (2017b). Research Progress and prospect on Regional Ecological Security Pattern Construction. Geogr. Res. 36, 407. doi:10.11821/dlyj201703001
Peng, J., Zhao, H., and Liu, Y. (2017c). Urban Ecological Corridors Construction: A Review. Acta Ecol. Sin. 37, 23–30. doi:10.1016/j.chnaes.2016.12.002
Peng, J., Yang, Y., Liu, Y., Hu, Y., Du, Y., Meersmans, J., et al. (2018). Linking Ecosystem Services and Circuit Theory to Identify Ecological Security Patterns. Sci. Total Environ. 644, 781–790. doi:10.1016/j.scitotenv.2018.06.292
Serra-Llobet, A., and Hermida, M. A. (2017). Opportunities for green Infrastructure under ecuador’s New Legal Framework. Landscape Urban Plann. 159, 1–4. doi:10.1016/j.landurbplan.2016.02.004
Song, L., and Qin, M. (2016). Identification of Ecological Corridors and its Importance by Integrating Circuit Theory. Chin. J. Appl. Ecol. 27, 3344–3352. doi:10.13287/j.1001-9332.201610.035
Su, Y., Chen, X., Liao, J., Zhang, H., Wang, C., Ye, Y., et al. (2016). Modeling the Optimal Ecological Security Pattern for Guiding the Urban Constructed Land Expansions. Urban For. Urban Green. 19, 35–46. doi:10.1016/j.ufug.2016.06.013
Su, J., Yin, H., and Kong, F. (2021). Ecological Networks in Response to Climate Change and the Human Footprint in the Yangtze River delta Urban Agglomeration, china. Landscape Ecol. 36, 2095–2112. doi:10.1007/s10980-020-01129-y
Su, X., Shen, Y., Xiao, Y., Liu, Y., Cheng, H., Wan, L., et al. (2022). Identifying Ecological Security Patterns Based on Ecosystem Services Is a Significative Practice for Sustainable Development in Southwest china. Front. Ecol. Evol. 9, 810204. doi:10.3389/fevo.2021.810204
Valente, R. d. O. A., and Vettorazzi, C. A. (2008). Definition of Priority Areas for forest Conservation through the Ordered Weighted Averaging Method. For. Ecol. Manage. 256, 1408–1417. doi:10.1016/j.foreco.2008.07.006
Wang, M., Hou, X., and Wang, J. (2018). Resilience Mechanism and Practical Insights from Water-Related Physical Form in Jiangnan Based on Traditional Ecological Wisdom. Landcape Archit. J. 25, 52–57. doi:10.14085/j.fjyl.2018.06.0052.06
Wang, D., Chen, J., Zhang, L., Sun, Z., Wang, X., Zhang, X., et al. (2019). Establishing an Ecological Security Pattern for Urban Agglomeration, Taking Ecosystem Services and Human Interference Factors into Consideration. PeerJ 7, e7306. doi:10.7717/peerj.7306
Wang, L., Feng, X., Chang, Q., Liu, H., and Wang, J. (2020). Pattern Construction of Habitat Network for Urban green Space Based on the Compound Model of InVEST and MCR. Chin. Landscape Archit. 36, 113–118. doi:10.19775/j.cla.2020.06.0113
Wang, X., Zhao, P., Zhao, Y., Song, W., and Liu, X. (2022). Identification of key areas of land space ecological protection and restoration based on the pattern of ecological security in Guangdong, Hong Kong and Macau. Acta Ecol. Sin. 1–12, 450–461. doi:10.5846/stxb202011072848
Wu, J., Ma, H., and Peng, J. (2018). Improving Urban Ecological Security Pattern Based on Functional Nodes-Key Corridors: A Case Study of Shenzhen City. Prog. Geogr. 37, 1663–1671. doi:10.18306/dlkxjz.2018.12.008
Xu, L., Yin, H., Li, Z., and Li, S. (2014). Land Ecological Security Evaluation of Guangzhou, china. Int. J. Environ. Res. Public Health 11, 10537–10558. doi:10.3390/ijerph111010537
Xu, C., Cheng, L., Su, J., Yin, H., and Guo, Y. (2021a). Developing Regional Ecological Networks along the Grand Canal Based on an Integrated Analysis Framework. J. Resour. Ecol. 12, 801–813. doi:10.5814/j.issn.1674-764x.2021.06.008
Xu, C., Meng, N., Zhang, Y., Xie, S., Han, B., Su, Z., et al. (2021b). Urban Ecological Conservation Redlines Delineation and Management: A Case Study of macao Special Administrative Region. Acta Ecol. Sin. 41, 9103–9117. doi:10.5846/stxb202105071200
Yager, R. (1988). On Ordered Weighted Averaging Aggregation Operators in Multicriteria Decisionmaking. IEEE Trans. Syst. Man, Cyber. 18, 183–190. doi:10.1109/21.87068
Yang, Y., and Li, Q. (2021). Distribution Pattern and its Formation Mechanism of Public Recreational Space Based on POI Data: A Case Study of the Main Urban Area of Changsha City. Mod. Urban Res. 3, 91–97. doi:10.3969/j.issn.1009-6000.2021.03.013
Yang, X., Zhou, Z., Li, J., Fu, X., Mu, X., and Li, T. (2016). Trade-offs between Carbon Sequestration, Soil Retention and Water Yield in the Guanzhong-Tianshui Economic Region of china. J. Geogr. Sci. 26, 1449–1462. doi:10.1007/s11442-016-1337-5
Yang, Z., Jiang, Z., Guo, C., Yang, X., Xu, X., Li, X., et al. (2018). Construction of Ecological Network Using Morphological Spatial Pattern Analysis and Minimal Cumulative Resistance Models in Guangzhou City, china. Chin. J. Appl. Ecol. 29, 3367–3376. doi:10.13287/j.1001-9332.201810.019
Yang, G., Yu, Z., Jørgensen, G., and Vejre, H. (2020). How Can Urban Blue-green Space Be Planned for Climate Adaption in High-Latitude Cities? a Seasonal Perspective. Sustain. Cities Soc. 53, 101932. doi:10.1016/j.scs.2019.101932
Ye, L., and Shi, Z. (2021). Analysis of RUSLE Model Parameter Acquisition Methods Based on Domestic Literature. Yunnan Geogr. Environ. Res. 33, 45–51. doi:10.3969/j.issn.1001-7852.2021.02.006
Ye, X., Zou, C., Liu, G., Lin, N., and Xu, M. (2018). Main Research Contents and Advances in the Ecological Security Pattern. Acta Ecol. Sin. 38, 53–57. doi:10.5846/stxb201701110083
Ying, L., Wang, J., and Zhou, Y. (2019). Ecological-environmental Problems and Solutions in the Minjiang River basin, Fujian Province, china. Acta Ecol. Sin. 39, 8857–8866. doi:10.5846/stxb201905291106
Yu, L., Liu, J., Li, T., and Zhu, H. (2018). Research Progress of Urban Public Recreational Space in china. Acta Geogr. Sin. 73, 1923–1941. doi:10.11821/dlxb201810008
Yu, Z., Yang, G., Zuo, S., Jørgensen, G., Koga, M., and Vejre, H. (2020). Critical Review on the Cooling Effect of Urban Blue-Green Space: A Threshold-Size Perspective. Urban For. Urban Green. 49, 126630. doi:10.1016/j.ufug.2020.126630
Yu, Z., Zhang, J., and Yang, G. (2021). How to Build a Heat Network to Alleviate Surface Heat Island Effect? Sustain. Cities Soc. 74, 103135. doi:10.1016/j.scs.2021.103135
Yu, K. (1996). Security Patterns and Surface Model in Landscape Ecological Planning. Landscape Urban Plann. 36, 1–17. doi:10.1016/S0169-2046(96)00331-3
Zhai, T., and Huang, L. (2022). Linking MSPA and Circuit Theory to Identify the Spatial Range of Ecological Networks and its Priority Areas for Conservation and Restoration in Urban Agglomeration. Front. Ecol. Evol. 10. doi:10.3389/fevo.2022.828979
Zhang, L., Fu, B., Lü, Y., and Zeng, Y. (2015). Balancing Multiple Ecosystem Services in Conservation Priority Setting. Landscape Ecol. 30, 535–546. doi:10.1007/s10980-014-0106-z
Zhang, L., Peng, J., Liu, Y., and Wu, J. (2017). Coupling Ecosystem Services Supply and Human Ecological Demand to Identify Landscape Ecological Security Pattern: A Case Study in Beijing–Tianjin–Hebei Region, china. Urban Ecosyst. 20, 1–14. doi:10.1007/s11252-016-0629-y
Zhang, Y., Hu, Y., and Zhuang, D. (2020). A Highly Integrated, Expansible, and Comprehensive Analytical Framework for Urban Ecological Land: A Case Study in Guangzhou, china. J. Clean. Prod. 268, 122360. doi:10.1016/j.jclepro.2020.122360
Zhang, J., Yu, Z., Cheng, Y., Sha, X., and Zhang, H. (2021). A Novel Hierarchical Framework to Evaluate Residential Exposure to green Spaces. Landscape Ecol. Available at: https://link.springer.com/article/10.1007/s10980-021-01378-5. doi:10.1007/s10980-021-01378-5
Zhao, K., Li, X., and Yuan, N. (2017). From American ”greenway” to European Greenway: The Construction of Ecological Network in Urban and Rural Space—a Case Study of Zengcheng District of Guangzhou. Chin. Landscape Archit. 33, 82–87.
Zhao, W., Han, Z., Yan, X., and Zhong, J. (2020). Ecological Security pattern construction based on multi-scenario trade-off of ecosystem services: A Case Study of wafangdian, Dalian. J. Nat. Res. 35, 546. doi:10.31497/zrzyxb.20200304
Keywords: ecological security pattern, ecosystem services, socioeconomic system, trade-off, OWA method, Guangzhou
Citation: Tan J, Li H and Lin W (2022) Integrating Ecosystems and Socioeconomic Systems to Identify Ecological Security Pattern and Restoration Strategy in a Rapidly Urbanizing Landscape. Front. Environ. Sci. 10:862310. doi: 10.3389/fenvs.2022.862310
Received: 25 January 2022; Accepted: 18 February 2022;
Published: 09 March 2022.
Edited by:
Zhaowu Yu, Fudan University, ChinaCopyright © 2022 Tan, Li and Lin. This is an open-access article distributed under the terms of the Creative Commons Attribution License (CC BY). The use, distribution or reproduction in other forums is permitted, provided the original author(s) and the copyright owner(s) are credited and that the original publication in this journal is cited, in accordance with accepted academic practice. No use, distribution or reproduction is permitted which does not comply with these terms.
*Correspondence: Wei Lin, Z2lzX3hpZmFuQDE2My5jb20=
Disclaimer: All claims expressed in this article are solely those of the authors and do not necessarily represent those of their affiliated organizations, or those of the publisher, the editors and the reviewers. Any product that may be evaluated in this article or claim that may be made by its manufacturer is not guaranteed or endorsed by the publisher.
Research integrity at Frontiers
Learn more about the work of our research integrity team to safeguard the quality of each article we publish.