 Xiong He
 Yiting Zhu2
 Chunshan Zhou
- 1School of Geography and Planning, Sun Yat-sen University, Guangzhou, China
- 2Key Laboratory of the Sustainable Development of Xinjiang’s Historical and Cultural Tourism, College of Tourism, Xinjiang University, Urumqi, China
The study of urban agglomeration boundaries is helpful to understand the internal spatial structure of urban agglomeration, evaluate the development level of urban agglomeration, and thus, assist in the formulation of regional planning and policies. However, previous studies often used only static spatial elements to delineate the boundaries of urban agglomerations, ignoring the spatial connections within urban agglomerations. In this study, night-time light and Tencent user location data were evaluated separately and fused to delineate urban agglomeration boundaries from both static and dynamic spatial perspectives. Additionally, it has been shown in the study results that the accuracy of urban agglomeration boundary delineated by night-time light data is 84.90%, with Kappa coefficient as 0.6348. The accuracy delineated by Tencent user location data is 82.40%, with Kappa coefficient as 0.5637, while the accuracy delineated by data fusion is 92.70%, with Kappa coefficient as 0.7817. Therefore, it can be concluded that the fusion of night-time light and Tencent user location data had the highest accuracy in delineating urban agglomeration boundaries, which verified that the fusion of dynamic spatial elements on a single static spatial element can supplement the spatial connection of urban agglomeration. Our findings enrich the understanding of urban agglomerations, and the accurate delineation of urban agglomerations boundaries can aid urban agglomeration planning and management.
1 Introduction
Urban agglomeration refers to city clusters, which are composed of metropolises relying on a developed infrastructure network including both transportation and communication network in a certain geographical area. The organization is tighter and the economic interaction is closer in urban agglomeration. Additionally, the purpose of urban exploration is the realization of urban integration (Yu et al., 2019; Guo et al., 2021). Therefore, urban agglomeration has a key role in a country, with a deeper impact on surrounding cities than the administrative boundary (Xiaoming, 2021). As disorderly and unsystematic spatial structures would greatly restrict the development of urban agglomeration, it is necessary to explore a suited spatial development pattern (Liu et al., 2019).
Although the accurate delineation of urban agglomeration boundary is of great importance to the actuality recognition and development analysis, the current urban agglomeration boundaries are inevitably featured within the regional factors (Yang et al., 2019). In addition, with the increasing rapid development of China’s urbanization, its major urban agglomeration is approaching that of the first class of global agglomeration worldwide, especially the Pearl River Delta, Yangtze River Delta, and Beijing-Tianjin-Hebei urban agglomeration (Chen et al., 2011; Bie et al., 2018). On the one hand, the boundary delineation of China’s mega urban agglomeration will undoubtedly be helpful to enrich the theoretical and methodological research on boundary delineation, On the other hand, the internal spatial structure of megacities can be explored through the boundary delineation so as to further put forward optimization strategies.
As one of the basic remote sensing satellite data, night-time light data (NTL) is an important data source for analyzing some urban interior problems (Liu et al., 2015), including population, GDP, and carbon emission, because of its advantage in reflecting urban activities via capturing the NTL brightness in the urban city (Zhao et al., 2015; Zhang et al., 2017; You et al., 2021), Additionally, it has also been shown by relevant studies that urban night-time light is also directly related to urban surface temperature, which also plays an important role in reflecting the urban heat island effect (Liu et al., 2021; Ren et al., 2022). Currently, there are three types of NTL data: DMSP/OLS (Elvidge et al., 2001; Small et al., 2013), NPP/VIIRS (Elvidge et al., 2021a; 2021b), and Luojia-01 (Wang et al., 2021). NTL data are mainly used to identify urban centers and delineate urban boundaries; thresholds combined with NTL are used as the main tools, owing to their easier operation steps (Liu et al., 2016). However, there are also some problems in the use of threshold method, which is mainly reflected in the large difference of thresholds in different regions and the threshold values of NTL data in different periods are different, making it difficult to ensure the accuracy of using a single threshold value to delineate urban agglomeration boundaries. Therefore, mutation detection and spatial comparison methods, which could delineate urban boundaries more accurately, are more widely used. For example, the mutation of NTL data could be detected using graph classification, and a high-resolution satellite graph could be used for analysis (Ma et al., 2018). Although NTL could delineate the urban interior spatial structure more correctly, the area of lighting is larger than that of actuality. Additionally, the rough space resolution of NTL itself could affect the delineation accuracy of the urban boundary (Huang et al., 2021).
Recently, the application of urban big data provided a new observation perspective for the study of urban spatial characteristics. Urban big data has been more widely used to modify NTL data because of its high temporal-spatial resolution, particularly POI (Point of Interest) could effectively reduce the spillover effect of NTL data (Liu et al., 2017). More and more scholars have found that location-based social media data can improve the image quality of NTL data through social perception, which can effectively alleviate the phenomenon of oversaturation of NTL data (Zhao et al., 2019). Therefore, researchers began trying to correct NTL data with different location big data, including Twitter and Tencent. As one of the population measurement indices, Tencent user location (TL) data mainly reflects population floating in a certain region within a certain period with the advantages of a wider coverage range, a higher spatial resolution, and a shorter observation time compared with other indices (Zikirya et al., 2021). TL is an important data source for studies relevant to population migration. For example, TL could simulate the risk of COVID-19(Corona Virus Disease) transmission and the urban population diffusion effect of large-scale cities (He et al., 2021; Zhang and Yuan, 2021). Additionally, there have been studies that attempted to delineate urban agglomeration boundary using the exchange of interior spatial information in an urban agglomeration, and some of them obtained reliable study results. Compared with POI data that only relies on urban interior spatial morphology to delineate urban agglomeration boundary (Xue et al., 2018), TL data focuses on the dynamic interaction among people within urban agglomeration, which enables it to supplement dynamic analysis to static space of the NTL data.
Guangdong-Hong Kong-Macao Greater Bay Area (GBA) is China’s largest urban agglomeration with significant urban development and economic construction level; however, the interior spatial construction within GBA is chaotic and disordered (Li et al., 2018). For example, the GBA urban agglomeration is mainly delineated by static data, such as administrative division and statistic data, which ignores the information exchange generated by population flow within the agglomeration. Therefore, to delineate GBA urban agglomeration boundary more comprehensively and accurately, this study combined TL with NTL data by fusing both dynamic and static spatial data to improve the delineation accuracy. Additionally, we compared and evaluated the use of both datasets separately regarding the accuracy for GBA urban agglomeration boundary delineation. We aimed to propose a new method to delineate urban agglomeration boundaries to improve urban planning and management. As for the novelty of the study, it has been implied by the overall logical flow, wherein the fusion of NTL and TL data is the focus of the novelty.
2 Materials and Methods
2.1 Study Area
GBA, comprised 11 cities, including two special administrative regions (Hong Kong and Macao) and nine cities within Guangdong province (Guangzhou, Shenzhen, Zhuhai, Foshan, Huizhou, Dongguan, Zhongshan, Jiangmen, and Zhaoqing). GBA urban agglomeration (Figure 1) (Tu et al., 2021)is currently China’s largest urban agglomeration with a total area of 56,000 km2 and a total permanent resident population of 83.0598 million people by the seventh National Census in 2020. Historically, the region has a unique governance pattern, with “one country, two systems” in GBA. The differences in policy, laws, and administration made GBA develop a system of its own in the world urban agglomerations (Jing et al., 2015). The unique governance system and economic environment make China’s urban agglomeration development different from that of exciting urban agglomerations around the world. Therefore, it is believed that the accurate delineation of the GBA urban agglomeration boundary is of great reference value to the spatial characteristic studies of Chinese urban agglomerations.
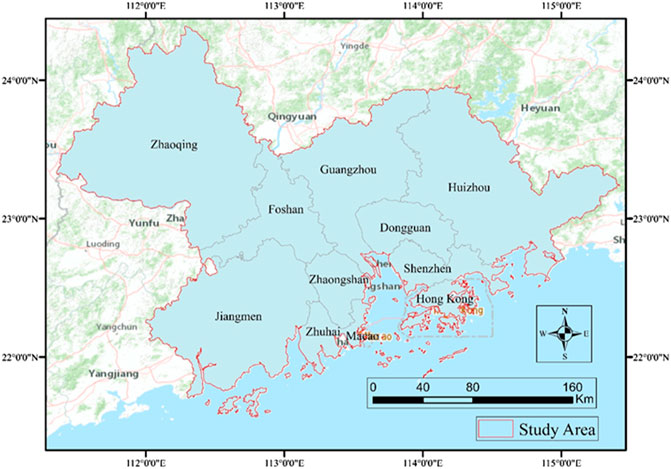
FIGURE 1. Study area.
2.2 Study Data
Luojia-01 NTL and TL data were used in this study. Luojia-01 NTL data, provided by the Luojia-01 experimental satellite, has a higher spatial resolution than DMSP/OLS and NPP/VIIRSNTL, with a spatial resolution up to 130 m and 260 km width, which allows a refinement of the urban interior space (Wang et al., 2020). Luojia-01 NTL data was downloaded from http://59.175.109.173:8888/app/login.html for the period between October 2018 and March 2019. The pre-processing results of NTL data in GBA can be obtained after mosaicking, radiating, and averaging the data, and the results are shown in Figure 2A.
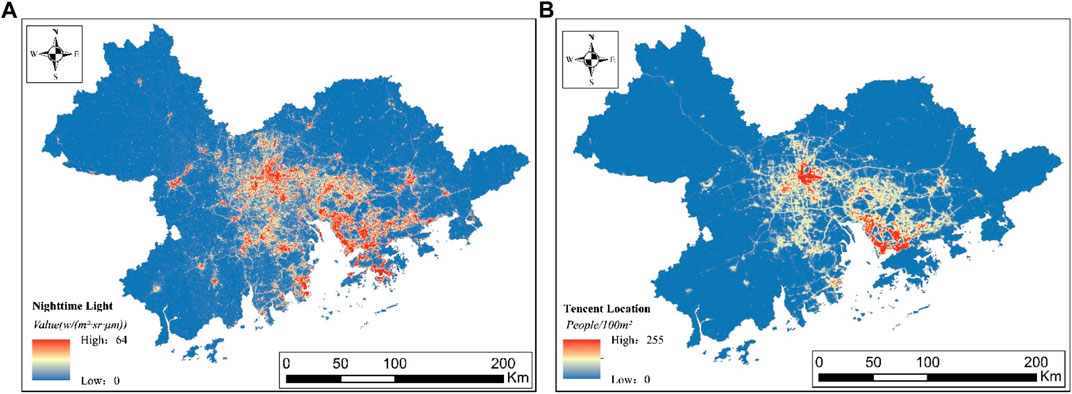
FIGURE 2. (A) Pre-processing results of NTL data. (B) Population flow results in GBA.
As for TL data, it comprises a Tencent location big data of user’s real-time positioning acquired by accessing an application made by Tencent (Pan and Lai, 2019). As the data format of Tencent user location data is latitude and longitude as well as the number of users, the change of location data over a period of time can reflect the population change in urban areas. Tencent user location data is updated every 5 min. Therefore, this study obtains data at 12 o ’clock on the 1st, 11th, and 21st of each month from January 2020 to December 2020. The obtained point data interval is 0.001 degree, that is, the spatial resolution is about 110 m. As shown in Figure 2B, the thermal map of population change in the Greater Bay Area can be obtained after the monthly spatial mapping and average processing of obtained Tencent location data.
2.3 Multi-Resolution Segmentation
Image classification is one of the most important methods to delineate urban agglomeration boundaries using NTL data (Zhang and Zhang, 2019). Image segmentation is an important part of image classification and feature extraction. As one of the image segmentation algorithms, multi-resolution segmentation could segment images by combining with region merging technology to average and reduce the heterogeneity between segmented objects, while the homogeneity between pixels within objects is increased by merging the adjacent segmented objects whose pixels are too small (Zheng et al., 2013). The key parameters of multi-resolution segmentation are scale parameters and composition of homogeneity criteria. Scale parameters are mainly used to confirm the maximum diversity value allowed by the generated image; the higher the value is, the bigger the scale of the generated image is. Moreover, the composition of homogeneity criteria is mainly used to represent the minimum heterogeneity between homogeneities. The homogeneity is composed of two parts, namely, spectrum and shape, which together sum up to weights of 1.0. However, the shape also consists of two parts—smoothness and tightness—whose weight is also 1.0. Therefore, “spectrum” and “shape”, as well as “smoothness” and “tightness,” could be considered as a pair of inverse values.
The mean variance is used in multi-resolution segmentation to verify the accuracy of scale parameters. The mean value refers to the mean of all pixel gray values within certain objects, while mean variance is the variance of pixel gray mean values of all objects within the entire image. When the mean variance is the highest, the corresponding segmented scale is the best.
Where n represents the pixel number of geographical objects after segmentation; Ci represents the digital numbers (DN) of the value of pixel ith of k segments; m represents the sum of the geographical objects after segmentation; S represents the mean variance of geographical objects’ DN value after segmentation.
2.4 Estimation of Scale Parameters
The estimation of segmentation using multi-resolution segmentation only uses the single band information, failing to make full use of multi bands characteristic of remote sensing, which results in a disconnection between the estimation of segmentation results and process. Therefore, the best scale in the mean variance curve is a value rather than a range, and it is necessary to use ESP to optimize segmentation results and first calculate the local variance of different objects within one band and then calculate the mean value of the local variance within multi bands (Dragut et al., 2010).
Where LV stands for the local variance and LVn stands for the local variance of an object within one band.
If the segmentation scale is much bigger than the objects in the sense, the heights would be similar among most of the segmented objects, then the estimation value of local variance would be lower. If the segmentation scale is similar to the target object, the differences between objects would be bigger and then the local variance would be larger. By calculating the local variance of different segmentation scales, the local variance would constantly increase with the increase of the segmentation scale until the scale matches with the real objects in the scene. Consequently, the local variance value is the biggest, the interior homogeneity of one object reaches its maximum value, the differences among objects is the biggest, and the largest scale of local variance is defined as the optimal segmentation scale.
2.5 Spectral Difference Segmentation
As a segmentation optimization method, SDS assists with decisions on whether to merge objects, by evaluating and analyzing whether the brightness differences between adjacent segmented objects meet the given threshold value based on multi-resolution segmentation and ESP(Dragut et al., 2014). After merging, the fragmentation of segmented images could be greatly improved, thus contributing to a higher generalization of image segmentation. The formula of SDS after normalizing weights of bands is as follows:
Where Sdiff represents the spectral difference value between adjacent objects; k represents the number of bands; WK represents the weight of kth band; w represents the sum of all bands weight; n and m represent the sum of pixels within adjacent objects; Bn and Bm represent the gray value of n pixel and m pixel within adjacent objects, respectively. Sdiff is the only parameter of the SDS algorithm; the bigger the value is, the easier the merge of adjacent objects is.
2.6 Spectral Difference Segmentation
Data fusion refers to fusing data oriented on the same target or in the same region, obtained using different methods. Fused data could greatly improve the effectiveness and availability by comprehensively representing the characteristics of different data to evaluate a target and region more accurately (Wang et al., 2017). While the fusion algorithm is based on image scale, WT could partially enlarge the local characteristics of image information with the use of a dynamic observation window of time-frequency variation to comprehensively consider the interrelationship between time and frequency within an image. The main feature of WT is that it can decompose an image into two independent parts—time and frequency—without losing the images’ original information. In addition, WT can focus on specific characteristics of image information (Peng et al., 2016).
where, f(t) represents the signal vector; t represents the wavelet function; a, t, and b represent scale, translation, and parameter, respectively. The procedure of fusing images by WT is as follows: first, the image is decomposed with WT; then, the details of different images are compared within the wavelet region; finally, the fusion image can be obtained after wavelet inverse conversion is accomplished.
2.7 Accuracy Verification
Kappa consistency test is used in this study to verify the accuracy of different data and data fusion in delineating urban agglomeration boundaries. Among which, Kappa coefficient is an indicator to measure classification accuracy, and the formula for consistency test is as follows:
Where:
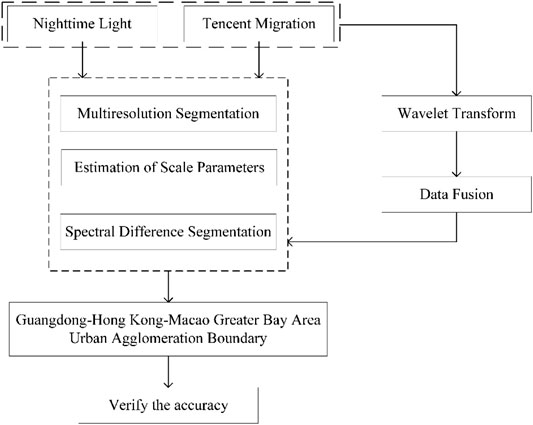
FIGURE 3. Study framework.
3 Results
3.1 The Delineation of GBA Urban Agglomeration
3.1.1 Urban Agglomeration Boundary Delineated Using NTL Data
Based on the pre-processing results of NTL data in GBA (Figure 2A), we noted that the high values of NTL were mainly concentrated in southern and central parts of GBA, including Guangzhou, Shenzhen, Hong Kong, Macao, Dongguan, and Zhuhai. The low values were mainly distributed in the western and eastern mountains of GBA. Therefore, we conclude that there is a significant special difference in development level in GBA urban agglomeration. In addition, this special difference is the foundation of delineating GBA urban agglomeration.
Multi-resolution segmentation was used in this study to segment NTL images. Additionally, mean variance and ESP were used to determine the scale parameter of multi-resolution segmentation because different segmentation scales could have an effect on the number of segmented regions. SDS was used to merge NTL images. Finally, GBA urban agglomeration was delineated using NTL data.
After analyzing GBA urban agglomeration delineated using different scale parameters (16, 0.5, 0.5; Figure 4), we found that the GBA urban agglomeration delineated using NTL data covered an area of 8,917.43 km2, accounting for 16.03% of the administration area. Delineated urban agglomeration was mainly concentrated in an area with higher urbanization levels in GBA, such as Guangzhou, Shenzhen, and Hong Kong. Additionally, the urban agglomeration boundaries delineated using multi-resolution segmentation of NTL showed that the batteries delineated in Guangzhou and Shenzhen were relatively more complete, while the batteries delineated in Huizhou, Zhongshan, and Shaoguan were less complete (Xia et al., 2019). Compared with Figure 2A, high NTL values were mainly concentrated in Guangzhou, Shenzhen, and Hong Kong, while in Huizhou, Zhongshan, and Shaoguan, there were only a few gathering clusters of high light values. Therefore, we concluded that there was a severe fragmentation of the urban agglomeration boundary when we delineated using the NTL data, except for some main cities including Guangzhou, Shenzhen, and Hong Kong.
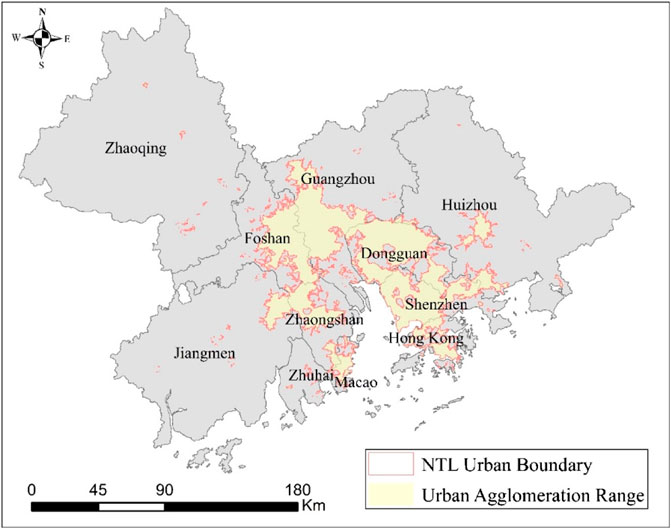
FIGURE 4. GBA urban agglomeration boundary delineated using NTL data.
3.1.2 Urban Agglomeration Boundary Delineated Using TL Data
The population flow results in GBA (Figure 2B) showed high values of population flow, mainly concentrated in Guangzhou, Shenzhen, Dongguang, Zhuhai, and some areas of Hong Kong, while the low values of population flow were mainly distributed in the eastern and western sides of GBA. In addition, there were some medium and high values of population flow distributed between some cities, including Zhongshan and Guangzhou, Zhuhai and Jiangmen, and Huizhou and Shenzhen. Theoretically, the higher the population flow value is, the higher the urban development level is. Therefore, not only the development level of different cities within GBA urban agglomeration could be evaluated by analyzing population flow trend, but the connection strength among different cities could also be evaluated (Van Rossum and Triest, 2010).
Multi-resolution segmentation was used in this study to segment population flow data, and the segmentation ratio parameters were determined as 14, 0.4, and 0.6 using mean variance and ESP. Additionally, SDS was used to merge the resulting segmentation by population flow image and the urban agglomeration boundary of GBA delineated using TL data (Figure 5). Figure 5 shows that the urban agglomeration delineated using TL data covered an area of 8,542.81 km2, accounting for 15.26% of the administrative area, which is similar to that delineated using NTL data. Additionally, we found similarities between the urban agglomeration delineated using NTL data; TL data were also mainly concentrated in the area with a more resident population including Guangzhou, Shenzhen, Hong Kong, Dongguan, and some parts of Zhuhai. Although the area of the main cities delineated using TL data was smaller than those delineated using NTL data, including Guangzhou, Shenzhen, Hong Kong, Dongguan, and Zhuhai, the most area in these cities was delineated within the boundaries. Moreover, compared with Figure 2B, although the city regions with more population flow were mainly delineated within the agglomeration, some core areas of Guangzhou and Shenzhen failed to be delineated within the agglomeration due to a lower population flow in these core areas. Therefore, between the two datasets, we concluded that although the area delineated using TL data was smaller, the connection among cities was more intensive, which contributed to improving the edge details of urban agglomeration.
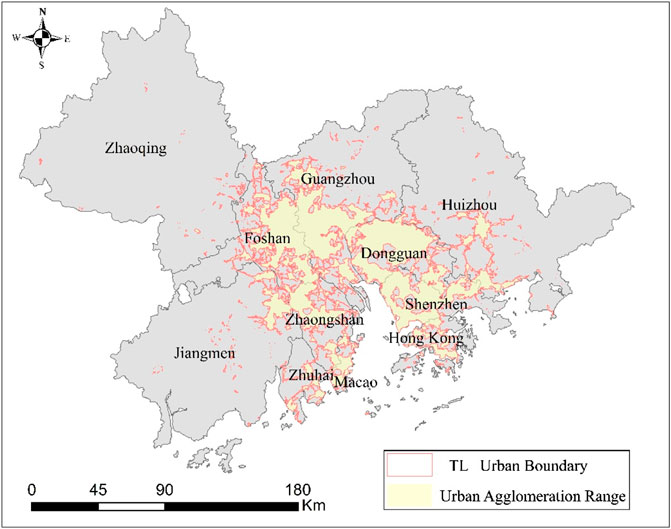
FIGURE 5. GBA urban agglomeration boundary delineated using TL data.
3.1.3 Urban Agglomeration Boundary Delineated Using the Combined NTL and TL Data
NTL data mainly refers to the light brightness within cities; thus, the higher the light brightness is, the more active the urban activity is. TL data mainly refers to the population change within a certain region in a certain period; thus, the faster the flow is, the more active the urban activity is. Therefore, there was an obvious spatial correlation between NTL and TL data; the fused data is shown in Figure 6.
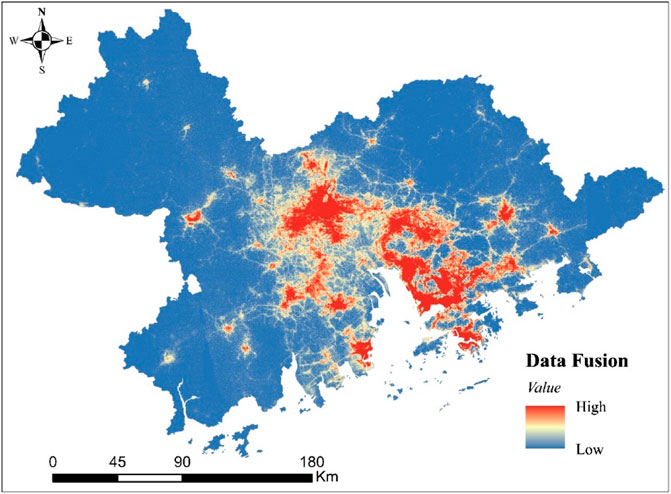
FIGURE 6. Data fusion results of NTL and TL data.
After the fusion of NTL and TL data using WT, the high values were mainly concentrated in Guangzhou, Shenzhen, Zhuhai, Hong Kong, and most regions of Dongguan, while the low values were mainly concentrated in the western and eastern sides of GBA, as well as in northern mountains. Compared with only NTL and TL data, the high values delineated using fusion data were more concentrated and there was also a certain spatial correlation among cities. The scale parameters determined using mean variance and ESP were 15, 0.4, and 0.6, after the image segmentation of data fusion using multi-resolution segmentation. The urban agglomeration boundary of GBA delineated using data fusion after the merging of segmentation results obtained using SDS is shown in Figure 7. Figure 7 shows that the urban agglomeration area delineated using data fusion was 9,291.34 km2, accounting for 16.59% of the total administrative area, which is larger than that delineated by both NTL and TL data; the urban range was mostly concentrated in the urban area of Guangzhou, Shenzhen, Hong Kong, Dongguan, and Zhuhai. This urban agglomeration boundary delineation was more complete with more detailed edges compared with that delineated using only NTL and TL data.
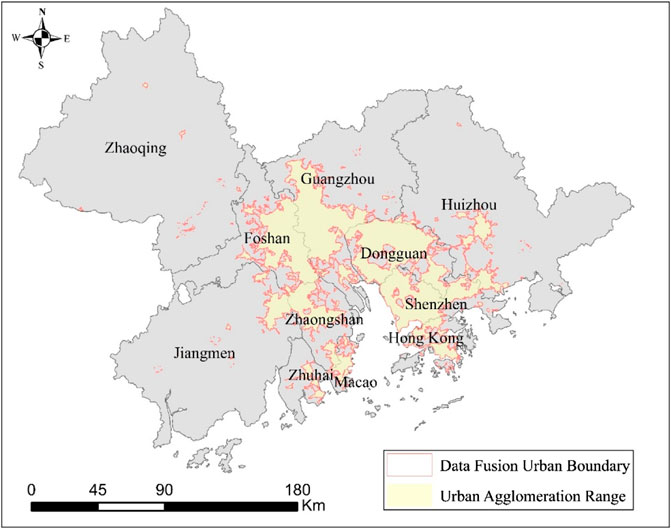
FIGURE 7. Urban agglomeration boundary delineated using data fusion.
3.1.4 Urban Agglomeration Boundary Delineated Using the Combined NTL and TL Data
The interior spatial structure of GBA urban agglomeration delineated using data fusion was similar to that delineated using only NTL and TL data (Figure 8). The spatial distribution of high and low values delineated before and after data fusion was also similar, with the high values mainly concentrated in core cities including Guangzhou, Shenzhen, and Hong Kong. Moreover, the overall value showed a downward trend from the above core cities to the edge of these cities. The above results indicate that NTL and TL data and data fusion could delineate urban agglomeration boundaries by reflecting the spatial structures of urban agglomeration.
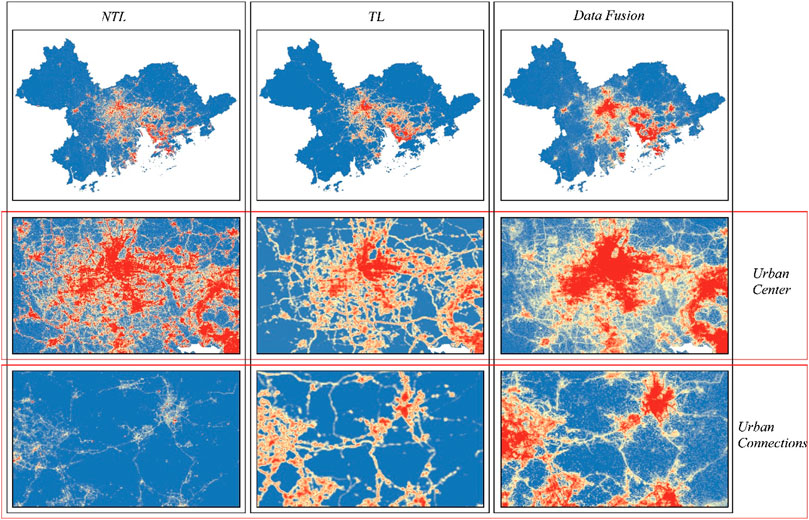
FIGURE 8. Comparison and analysis of delineation before and after the fusion of NTL and TL data.
However, there is only one attribute of NTL data, which is light brightness, for the evaluation of regions in the urban agglomeration boundary, which could result in an error in this delineation. For example, although there is a high light brightness value in airports and harbors, these places would still not be delineated within the urban agglomeration, as they are often far from the city center. Similarly, there are certain distances among cities within urban agglomeration that have relatively lower light values or even no light value within these connection places. NPL data failed to delineate these places within the urban agglomeration boundary, which led to the fragmentation of the urban agglomeration boundary. However, after the fusion with TL data based on light brightness value, the interactions among cities are considered, which contributes to the spatial modification of the distribution of high and low values of NTL data.
On the other hand, TL data considers only population floating, which means that only when the population floating in a region is higher than a certain threshold value, this region would be delineated within the urban agglomeration boundary. However, within cities, population floating mainly refers to the floating within certain regions, while within urban agglomeration, population floating mainly refers to the floating among regions (certain areas within urban agglomeration). Population floating data focus on the interaction among regions rather than the internal spatial delineation of core cities within urban agglomerations. Therefore, the fusion of NTL and TL data could effectively supplement the analysis of urban spatial structures by reflecting urban interior spatial interconnection, which is more in line with the development status quo of urban agglomeration.
3.2 Comparative Verification and Analysis of Urban Agglomeration Delineation Results
Figure 9 shows that the urban agglomeration areas delineated using NTL, TL data, and data fusion were 8,917.43 km2, 8,542.81 km2, 9,291.34 km2, accounting for 16.03, 15.62, and 16.59% of administrative area, respectively. From the perspective of the urban area delineated, although the area delineated using data fusion was the largest and the area delineated using TL data was the smallest, there were no significant differences among the delineation results. From the perspective of delineated urban agglomeration boundary, the boundary delineated using NTL data was relatively fragmented with a discrete boundary, while the boundary delineated using TL data was relatively continuous. However, the urban agglomeration boundary of certain regions in core cities delineated using TL data was smaller, with the exciting of partial boundary cavities, which means that it is necessary to strengthen the delineated urban agglomeration boundary effectiveness.
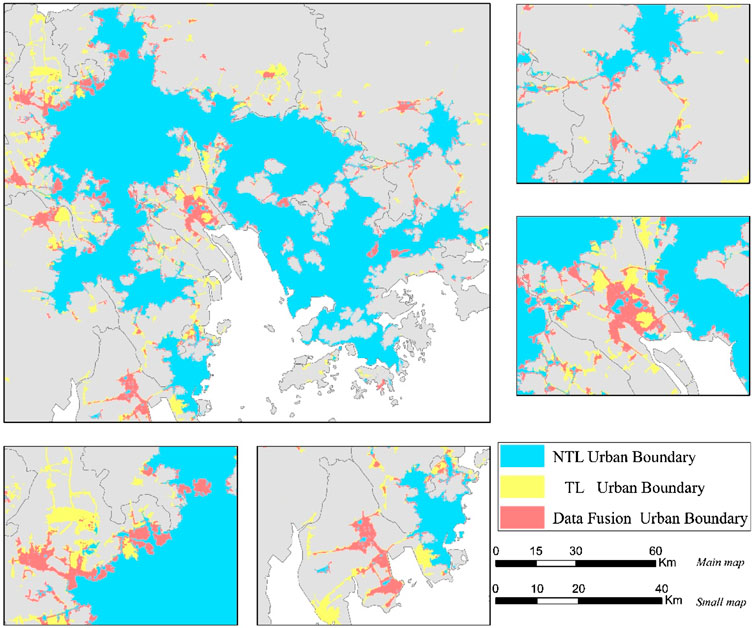
FIGURE 9. Comparison of urban agglomeration boundary delineated using different datasets.
There was an evident fragmentation and discontinuity in the boundary delineated using NTL data when compared to data fusion due to the light brightness differences. With this fragmentation and discontinuity, the manifestation of urban agglomeration boundary is too complex, especially in Qingyuan and Zhuhai. In contrast, after the fusion with TL data, the fragmented boundary was modified using the spatial dynamic connection within urban agglomeration based on combining the high and low values of the spatial distribution of light brightness, which made the delineated boundary more consecutive and integrated.
Comparing the boundary delineated using TL data and data fusion, the regional floating of the population within urban agglomeration resulted in delineated urban agglomeration being mainly concentrated between cities and between cities and clusters. However, within cities, especially within the core cities, large amounts of urban regions failed to be delineated within the boundary, including eastern parts of Guangzhou and northern parts of Zhuhai, which made the delineation area smaller. After the fusion with NTL data, the urban spatial development differences were greatly strengthened.
Overall, the urban agglomeration boundary was successfully delineated using NTL data, TL data, and data fusion. NTL data used more interior spatial construction under static space of urban agglomeration, which made the delineated boundary more fragmented and discrete. TL data focused on the dynamic interaction among cities within urban agglomeration; although the fragmented boundary was modified, there was a lower expression of static pace. Comparatively, after the fusion, the static space and dynamic interactions of urban agglomeration were combined and the development of different urban spaces was considered, which greatly strengthened the spatial connection and made the delineated boundary more veritable and reliable.
To verify the veracity of the urban agglomeration boundary delineated using different datasets, 1,000 random pixel points were selected within GBA urban agglomeration. After the verification by high-resolution satellite images, 837 random pixel points were determined to be located within the city, while 173-pixel points were located in non-urban cities. Then, the confusion matrix was used to determine the number of random pixel points that were successfully verified. This is shown in Table 1. Additionally, the urban agglomeration boundary accuracies delineated using NTL data, TL data, and data fusion were 84.90, 82.40, and 92.70%, respectively. From the perspective of delineation accuracy, there was no significant difference between the results delineated using NTL or TL data; however, the delineation accuracy was greatly improved after data fusion. The kappa coefficient of the boundary delineated using NTL data, TL data, and data fusion was 0.6348, 0.5637, and 0.7817, respectively, which indicates that the boundary delineated after data fusion presented higher accuracy.
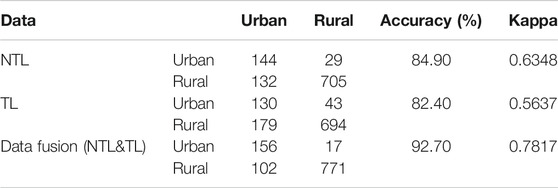
TABLE 1. Accuracy verification of urban agglomeration boundary delineation results.
In general, the urban agglomeration boundaries delineated using only NTL and TL data was insufficient due to the different emphasis of different data, while data fusion could not only improve the integrity of urban agglomeration spatial structure but also could strengthen spatial interaction within urban agglomeration, contributing to the improvement of delineation accuracy of urban agglomeration boundary.
4 Discussion
In this study, WT was used to fuse NTL static and TL dynamic data. Then, the urban agglomeration boundary was delineated using NTL data, TL data, and data fusion combined with multi-resolution segmentation, ESP, and SDS, respectively. In addition, the delineation results were comparatively verified and analyzed to obtain a simple and reliable method for the delineation of urban agglomeration boundary.
As one of the data that are widely used in the identification of urban centers, NTL data can directly reflect the development difference of regions within cities by capturing the light brightness (Cai et al., 2017). Then, the city range can constantly be determined, which is also a key factor of urban agglomeration boundary delineation. However, previous studies showed that the delineation accuracy obtained using NTL data is restricted due to the attributes of NTL data itself (Jiang J. et al., 2016). In contrast, other studies found that there is a strong spatial relevance between urban big data and NTL data within the urban city, which they used to modify the error generated by NTL data in the urban agglomeration boundary delineation with urban big data, contributing to a better delineation result (Liu et al., 2020). However, there are static factors in the real-world urban agglomeration space, such as city light brightness, the distribution of urban infrastructure, and the dynamic floating of elements between cities and clusters (CastelIs-Quintana, 2017; Tang et al., 2021). NTL data and current urban big data focus on the static space reflected in urban space rather than the dynamic floating. Therefore, NTL data and TL data were fused in this study to consider both static and dynamic factors (Feng et al., 2020).
Previous studies on urban agglomeration boundary mainly delineated the boundary using the static data of administrative division and remote sensing data, as well as urban big data (Abed and Kaysi, 2003; Jiang P. et al., 2016). Although remarkable progress has been made, these static data can no longer meet the development of urban interior spatial structure because of the changing of the structure itself. Even though floating factors are of primary importance in the evaluation of urban agglomeration, only a few studies have considered them (Wang and Yang, 2008).
In this study, urban agglomeration boundary results delineated using NTL and TL data were compared and a new method of delineating urban agglomeration boundaries by fusing static and dynamic factors was explored. The fusion of NTL and TL data not only modified the error generated by NTL data but also compensated for the weaknesses generated by TL data, which in the case study of GBA urban agglomeration, is of important reference value to evaluate the current urban agglomeration boundary system.
There were certain limitations to this study. First, from the perspective of the data used, although the Tencent user location data used in this study reflects the location change information of the population in the urban agglomeration, the elderly and children do not use smart phones and relevant Tencent Application, so the collected Tencent location data does not contain the location information of these people. This directly leads to a lower population movement value obtained than the actual population movement value, which has a great impact on the results of delineating urban agglomeration boundaries only using Tencent user location data. From the perspective of delineation results, although both static and dynamic factors within urban agglomeration are comprehensively considered and the boundary is accurately delineated by this study, the delineation boundary is still static rather than dynamic. Therefore, it is necessary to not only combine static and dynamic factors in the delineation of urban agglomeration but also further analyze the evolution trend of urban agglomeration boundary within a certain space and time, to formulate better regional development strategies and achieve high-quality development of urban agglomeration.
5 Conclusion
Delineating the boundaries of urban agglomerations is an important prerequisite for accurately understanding urban agglomerations, which is important to understand the evolution of internal space. Therefore, this study fused static NTL data and dynamic TL data to delineate the boundaries of urban agglomerations of GBA. Due to the fragmentation of delineating the boundaries of urban agglomerations by NTL data, the fusion of population migration data, and the consideration of dynamic spatial elements of population flow based on static spatial elements within urban agglomerations, the spatial connections within urban agglomerations were strengthened. It was also verified that in the boundary delineation of urban agglomeration, the fusion of static elements and dynamic elements can achieve higher delineation accuracy than a single dataset. Compared with previous studies, the fusion of dynamic TL data compensates for the deficiency of single NTL data. The boundary of the urban agglomeration was more accurate, and an efficient method of boundary delineation of the urban agglomeration was explored, which can aid to formulate urban agglomeration planning and development of policies.
Data Availability Statement
The raw data supporting the conclusion of this article will be made available by the authors, without undue reservation.
Author Contributions
Conceptualization, XH; methodology, YZ and PC; software, XH; validation, XH and CZ; formal analysis, CZ; investigation, XH and YZ; data curation, PC; writing—original draft, XH; writing—review and editing, CZ. All authors have read and agreed to the published version of the manuscript.
Conflict of Interest
The authors declare that the research was conducted in the absence of any commercial or financial relationships that could be construed as a potential conflict of interest.
Publisher’s Note
All claims expressed in this article are solely those of the authors and do not necessarily represent those of their affiliated organizations, or those of the publisher, the editors and the reviewers. Any product that may be evaluated in this article, or claim that may be made by its manufacturer, is not guaranteed or endorsed by the publisher.
References
Abed, J., and Kaysi, I. (2003). Identifying Urban Boundaries: Application of Remote Sensing and Geographic Information System Technologies. Can. J. Civ. Eng. 30, 992–999. doi:10.1139/l03-051
Bie, X., Sun, T., Sun, R., Wang, J., Zhang, T., and Chen, L. (2018). Urban Expansion and its Spillover Effects on Economic Growth in the Beijing- Tianjin-Hebei Urban Agglomeration. Acta Ecologica Sinica 38, 4276–4285. doi:10.5846/stxb201801310276
Cai, D., Fraedrich, K., Guan, Y., Guo, S., and Zhang, C. (2017). Urbanization and the thermal Environment of Chinese and US-American Cities. Sci. Total Environ. 589, 200–211. doi:10.1016/j.scitotenv.2017.02.148
CastelIs-Quintana, D. (2017). Malthus Living in a Slum: Urban Concentration, Infrastructure and Economic Growth. J. Urban Economics 98, 158–173.
Chen, H., Lu, L., and Zheng, S. (2011). The Spatial Network Structure of the Tourism Destinations in Urban Agglomerations Based on Tourist Flow:A Case Study of the Pearl River Delta. Acta Geographica Sinica 66, 257
Chen Zheng, C., Leiguang Wang, L., Rongyuan Chen, R., and Xiaohui Chen, X. (2013). Image Segmentation Using Multiregion-Resolution MRF Model. IEEE Geosci. Remote Sensing Lett. 10, 816–820. doi:10.1109/lgrs.2012.2224842
Drăguţ, L., Csillik, O., Eisank, C., and Tiede, D. (2014). Automated Parameterisation for Multi-Scale Image Segmentation on Multiple Layers. ISPRS J. Photogramm Remote Sens 88, 119–127. doi:10.1016/j.isprsjprs.2013.11.018
Dragut, L., Tiede, D., and Levick, S. R. (2010). ESP: a Tool to Estimate Scale Parameter for Multiresolution Image Segmentation of Remotely Sensed Data. Int. J. Geo. Information Science 24, 859. doi:10.1080/13658810903174803
Elvidge, C. D., Nelson, I., Hobson, V. R., Safran, J., and Baugh, K. E. (2001). Detection of Fires at Night Using DMSP-OLS Data. Editors F. J. Ahern, J. G. Goldammer, and C. O. Justice, 125–144.
Elvidge, C. D., Zhizhin, M., Ghosh, T., Hsu, F., and Taneja, J. (2021a). Annual Time Series of Global VIIRS Nighttime Lights Derived from Monthly Averages: 2012 to 2019. Remote Sensing 13. doi:10.3390/rs13050922
Elvidge, C. D., Zhizhin, M., Hsu, F. C., Sparks, T., and Ghosh, T. (2021b). Subpixel Analysis of Primary and Secondary Infrared Emitters with Nighttime VIIRS Data. Fire-Switzerland 4. doi:10.3390/fire4040083
Feng, Z., Peng, J., and Wu, J. (2020). Using DMSP/OLS Nighttime Light Data and K-Means Method to Identify Urban-Rural Fringe of Megacities. Habitat International 103, 1–11. doi:10.1016/j.habitatint.2020.102227
Guo, M., Zhang, M., Wang, H., Wang, L., Liu, S., Zong, L., et al. (2021). Dual Effects of Synoptic Weather Patterns and Urbanization on Summer Diurnal Temperature Range in an Urban Agglomeration of East China. Frontiers Environmental Science 9. doi:10.3389/fenvs.2021.672295
He, X., Zhou, C., Wang, Y., and Yuan, X. (2021). Risk Assessment and Prediction of COVID-19 Based on Epidemiological Data from Spatiotemporal Geography. Frontiers Environ. Sci. 9. doi:10.3389/fenvs.2021.634156
Huang, X., Yang, J., Li, J., and Wen, D. (2021). Urban Functional Zone Mapping by Integrating High Spatial Resolution Nighttime Light and Daytime Multi-View Imagery. Isprs J. Photogrammetry Remote Sensing 175, 403–415. doi:10.1016/j.isprsjprs.2021.03.019
Jiang, J., Zhang, J., Zhang, Y., Zhang, C., and Tian, G. (2016). Estimating Nitrogen Oxides Emissions at City Scale in China with a Nightlight Remote Sensing Model. Sci. Total Environ. 544, 1119–1127. doi:10.1016/j.scitotenv.2015.11.113
Jiang, P., Cheng, Q., Gong, Y., Wang, L., Zhang, Y., Cheng, L., et al. (2016). Using Urban Development Boundaries to Constrain Uncontrolled Urban Sprawl in China. Ann. Am. Assoc. Geogr. 106, 1321–1343. doi:10.1080/24694452.2016.1198213
Jing, Y., Cui, Y., and Li, D. (2015). The Politics of Performance Measurement in China. Pol. Soc. 34, 49–61. doi:10.1016/j.polsoc.2015.02.001
Li, X., Zhou, J., Huang, Y., and Huang, M. (2018). Understanding the Guangdong-Hong Kong-Macao Greater Bay Area from the Perspective of Mega-City Region. Prog. Geogr. 37, 1609. doi:10.18306/dlkxjz.2018.12.003
Liu, G., Yao, X., Luo, Z., Kang, S., Long, W., Fan, Q., et al. (2019). Agglomeration Centrality to Examine Spatial Scaling Law in Cities. Comput. Environ. Urban Syst. 77. doi:10.1016/j.compenvurbsys.2019.101357
Liu, H., Huang, B., Zhan, Q., Gao, S., Li, R., and Fan, Z. (2021). The Influence of Urban Form on Surface Urban Heat Island and its Planning Implications: Evidence from 1288 Urban Clusters in China. Sust. Cities Soc. 71, 1–12. doi:10.1016/j.scs.2021.102987
Liu, J., Deng, Y., Wang, Y., Huang, H., Du, Q., and Ren, F. (2020). Urban Nighttime Leisure Space Mapping with Nighttime Light Images and POI Data. Remote Sensing 12. doi:10.3390/rs12030541
Liu, J., Zhang, G., Zhuang, Z., Cheng, Q., Gao, Y., Chen, T., et al. (2017). A New Perspective for Urban Development Boundary Delineation Based on SLEUTH-InVEST Model. Habitat Int. 70, 13–23. doi:10.1016/j.habitatint.2017.09.009
Liu, Y., Delahunty, T., Zhao, N., and Cao, G. (2016). These Lit Areas Are Undeveloped: Delimiting China's Urban Extents from Thresholded Nighttime Light Imagery. Int. J. Appl. Earth Observation Geoinformation 50, 39–50. doi:10.1016/j.jag.2016.02.011
Liu, Y., Wang, Y., Peng, J., Du, Y., Liu, X., Li, S., et al. (2015). Correlations between Urbanization and Vegetation Degradation across the World's Metropolises Using DMSP/OLS Nighttime Light Data. Remote Sensing 7, 2067–2088. doi:10.3390/rs70202067
Ma, T., Yin, Z., and Zhou, A. (2018). Delineating Spatial Patterns in Human Settlements Using VIIRS Nighttime Light Data: A Watershed-Based Partition Approach. Remote Sensing 10. doi:10.3390/rs10030465
Pan, J., and Lai, J. (2019). Spatial Pattern of Population Mobility Among Cities in China: Case Study of the National Day Plus Mid-autumn Festival Based on Tencent Migration Data. CITIES 94, 55–69. doi:10.1016/j.cities.2019.05.022
Peng, J., Zhao, S., Liu, Y., and Tian, L. (2016). Identifying the Urban-Rural Fringe Using Wavelet Transform and Kernel Density Estimation: A Case Study in Beijing City, China. Environ. Model. Softw. 83, 286–302. doi:10.1016/j.envsoft.2016.06.007
Ren, J., Yang, J., Zhang, Y., Xiao, X., Xia, J. C., Li, X., et al. (2022). Exploring thermal comfort of Urban Buildings Based on Local Climate Zones. J. Clean. Prod. 340, 130744. doi:10.1016/j.jclepro.2022.130744
Small, C., Elvidge, C. D., and Baugh, K. (2013). Mapping Urban Structure and Spatial Connectivity with VIIRS and OLS Night Light Imagery" 2013 JOINT URBAN REMOTE SENSING EVENT. Sao Paulo, Brazil: JURSE, 230–233.
Tang, C., Guan, M., and Dou, J. (2021). Understanding the Impact of High Speed Railway on Urban Innovation Performance from the Perspective of Agglomeration Externalities and Network Externalities. Techn. Soc. 67. doi:10.1016/j.techsoc.2021.101760
Tu, W., Zeng, X., and Liu, Q. (2021). Aging Tsunami Coming: the Main Finding from China's Seventh National Population Census. Aging Clin. Exp. Res. doi:10.1007/s40520-021-02017-4
Van Rossum, F., and Triest, L. (2010). Pollen Dispersal in an Insect-Pollinated Wet Meadow Herb along an Urban River. Landscape Urban Plann. 95, 201–208. doi:10.1016/j.landurbplan.2010.01.004
Wang, C., Chen, Z., Yang, C., Li, Q., Wu, Q., Wu, J., et al. (2020). Analyzing Parcel-Level Relationships between Luojia 1-01 Nighttime Light Intensity and Artificial Surface Features across Shanghai, China: A Comparison with NPP-VIIRS Data. Int. J. Appl. Earth Observation Geoinformation 85, 101989. doi:10.1016/j.jag.2019.101989
Wang, H.-z., Li, G.-q., Wang, G.-b., Peng, J.-c., Jiang, H., and Liu, Y.-t. (2017). Deep Learning Based Ensemble Approach for Probabilistic Wind Power Forecasting. Applied Energy 188, 56–70. doi:10.1016/j.apenergy.2016.11.111
Wang, L., Zhang, H., Xu, H., Zhu, A., Fan, H., and Wang, Y. (2021). Extraction of City Roads Using Luojia 1-01 Nighttime Light Data. Appl. Sciences-Basel 11. doi:10.3390/app112110113
Wang, Z., and Yang, Y. (2008). Analysing the Primary Pattern of the Space Expansion of the Mountainous City Guided by Urban Planning. J. Mountain Sci. 26, 652. doi:10.3901/JME.2008.05.160
Xia, C., Zhang, A., Wang, H., and Yeh, A. G. O. (2019). Predicting the Expansion of Urban Boundary Using Space Syntax and Multivariate Regression Model. Habitat Int. 86, 126–134. doi:10.1016/j.habitatint.2019.03.001
Xiaoming, Y. (2021). An Empirical Study on the Impact of Economic Agglomeration on Environmental Pollution. IOP Conf. Ser. Earth Environ. Sci. 772, 12095. doi:10.1088/1755-1315/772/1/012095
Xue, X., Yu, Z., Zhu, S., Zheng, Q., Weston, M., Wang, K., et al. (2018). Delineating Urban Boundaries Using Landsat 8 Multispectral Data and VIIRS Nighttime Light Data. Remote Sensing 10. doi:10.3390/rs10050799
Yang, C., Li, Q., Hu, Z., Chen, J., Shi, T., Ding, K., et al. (2019). Spatiotemporal Evolution of Urban Agglomerations in Four Major bay Areas of US, China and Japan from 1987 to 2017: Evidence from Remote Sensing Images. Sci. Total Environ. 671, 232–247. doi:10.1016/j.scitotenv.2019.03.154
You, H., Yang, J., Xue, B., Xiao, X., Xia Cecilia, J., Jin, C., et al. (2021). Spatial Evolution of Population Change in Northeast China during 1992-2018. Science Total Enviro. 776, 146023. doi:10.1016/j.scitotenv.2021.146023
Yu, J., Zhou, K., and Yang, S. (2019). Land Use Efficiency and Influencing Factors of Urban Agglomerations in China. LAND USE POLICY 88. doi:10.1016/j.landusepol.2019.104143
Zhang, J., and Yuan, X. (2021). COVID-19 Risk Assessment: Contributing to Maintaining Urban Public Health Security and Achieving Sustainable Urban Development. Sustainability 13. doi:10.3390/su13084208
Zhang, Q., and Zhang, P. (2019). An Uncertainty Descriptor for Quantitative Measurement of the Uncertainty of Remote Sensing Images. Remote Sensing 11. doi:10.3390/rs11131560
Zhang, X., Wu, J., Peng, J., and Cao, Q. (2017). The Uncertainty of Nighttime Light Data in Estimating Carbon Dioxide Emissions in China: A Comparison between DMSP-OLS and NPP-VIIRS. Remote Sensing 9. doi:10.3390/rs9080797
Zhao, M., Zhou, Y., Li, X., Cao, W., He, C., Yu, B., et al. (2019). Applications of Satellite Remote Sensing of Nighttime Light Observations: Advances, Challenges, and Perspectives. Remote Sensing 11. doi:10.3390/rs11171971
Zhao, N., Zhou, Y., and Samson, E. L. (2015). Correcting Incompatible DN Values and Geometric Errors in Nighttime Lights Time-Series Images. IEEE Trans. Geosci. Remote Sensing 53, 2039–2049. doi:10.1109/tgrs.2014.2352598
Keywords: spatial structure, Guangdong-Hong Kong-Macao greater bay area, night-time light, population floating, data fusion, Urban expansion
Citation: He X, Zhu Y, Chang P and Zhou C (2022) Using Tencent User Location Data to Modify Night-Time Light Data for Delineating Urban Agglomeration Boundaries. Front. Environ. Sci. 10:860365. doi: 10.3389/fenvs.2022.860365
Received: 22 January 2022; Accepted: 02 March 2022;
Published: 18 March 2022.
Edited by:
Peng Liu, Institute of Remote Sensing and Digital Earth (CAS), ChinaReviewed by:
Jun Yang, Northeastern University, ChinaNaizhuo Zhao, McGill University Health Centre, Canada
Copyright © 2022 He, Zhu, Chang and Zhou. This is an open-access article distributed under the terms of the Creative Commons Attribution License (CC BY). The use, distribution or reproduction in other forums is permitted, provided the original author(s) and the copyright owner(s) are credited and that the original publication in this journal is cited, in accordance with accepted academic practice. No use, distribution or reproduction is permitted which does not comply with these terms.
*Correspondence: Chunshan Zhou, emhvdWNzQG1haWwuc3lzdS5lZHUuY24=