
94% of researchers rate our articles as excellent or good
Learn more about the work of our research integrity team to safeguard the quality of each article we publish.
Find out more
ORIGINAL RESEARCH article
Front. Environ. Sci. , 02 March 2022
Sec. Freshwater Science
Volume 10 - 2022 | https://doi.org/10.3389/fenvs.2022.859427
This article is part of the Research Topic The Urban Fluvial and Hydro-Environment System View all 21 articles
 Jeffery Nazrien Ng1
 Aizat Mohd Taib1*
 Irfan Haziq Razali1Norinah Abd Rahman1
 Wan Hanna Melini Wan Mohtar1Othman A. Karim1Safari Mat Desa2Suriyani Awang2
 Mohd Syazwan Faisal Mohd2
Many slope failures take place during or after rainfall events. Landslides are one of the tragedies associated with slope failures and often lead to fatal accidents. A study on the effects of extreme rainfall on slope stability considering the historical rainfall data, slope characteristics and properties, and flow boundary conditions was undertaken. This study investigated the behaviour of the Sg Langat slope under the influence of extreme rainfall gathered from historical data. Sg Langat was selected as the research area because of its high riverbank failures. The focus of this study are as follows: 1) to determine the effect of slope angles on slope stability, 2) to assess the development of pore-water pressure based on the changing groundwater levels, and 3) to analyse the influence of extreme rainfall events on the slope behaviour via numerical modelling. This study enhances the understanding of certain slope conditions and contributes to the analysis of slope stability through numerical modelling, making it relatively convenient to observe the soil conditions for determining the slope stability of the research area in regards to the effect of extreme rainfall. The results were obtained with respect to the changes in the pore-water pressure and the factor of safety. It was observed that the pressure changes were different for every channel, demonstrating that the generation of negative pore-water pressure was not directly affected by the type of analysis and the rainfall infiltration alone. Moreover, the slopes on all channels presented were considered unstable because of the considerable changes in the negative pore-water pressure at a relatively shallow depth, causing soil strength reduction. The factor of safety recorded for Channel 1 was the lowest at 0.18, whereas Channel 3 had the highest factor of safety of 1.11 but was still considered unsafe as it fell below the standard safety margin of 1.3. Apart from the different rainfall intensities applied, the geometry of the slopes also affected the slope stability.
Industrialisation, urbanisation, and population growth have increasingly led to intensive land use. The number of slope failures in Malaysia is increasing year on year. In general, the rise in cases is linked to rapid manmade development (such as highways, roads, dams, and hill residential buildings) that has an impact on the surrounding areas (Che Ghani et al., 2020). Many landslides often occur during the construction stages of infrastructures and have caused significant damage to properties, the environment, and people. The potential of landslide occurrence during slope construction depends on many factors such as topography, soil type, vegetation, and local climate (Jeong et al., 2017). Other factors including non-homogeneous soil layers, tension, cracks, dynamic loading or earthquakes, and seepage flow may also affect landslide occurrence (Rahimi et al., 2011). According to the data of the Korea Meteorological Administration (2002) from 1993 to 2002, the death toll by slope failures including natural hazards and accidents during construction was up to 22.7% of the total death toll by natural hazards in Korea. Thus, slope failure can be considered one of the most serious natural hazards (Duc Long and Dung, 2020). As rainfall can be associated with slope failures, several studies have been conducted to determine the changes in the shear strength of unsaturated slopes (Fredlund et al., 1978; Schreiner, 1987; Rahardjo and Fredlund, 1995; Feuerharmel et al., 2005).
In Malaysia, slope failure is not an uncommon natural disaster that usually takes place during the wet monsoon. The unsaturated conditions in the shallow zone can easily be affected by rainfall infiltrations. Back in 2017, a landslide occurred at Kajang, Selangor. It was reported that the incident happened after heavy rainfall on the same day (Hou et al., 2018). Furthermore, the damage was extensive because of the high rainfall intensity and the insufficient slope protection installed to withstand the moving soil mass. This scenario shows the influence of extreme rainfall that affects the slope strength, thus causing landslides and posing a fatal threat to the residents nearby. Therefore, this study was undertaken to investigate the behaviour of the Sg Langat slope under the influence of extreme rainfall from historical records, considering the different slope angles, changing groundwater level, and various extreme rainfall intensities. As many recent studies have attempted to generate future rainfall models, historical records are often used as a baseline (Coe and Stern 1982). This study attempted to establish the historical rainfall intensities for predicting slope failures. Zhenping Zhang et al. (2021) stated that the use of the orientation and gradient to simulate and predict slope stability over extreme rainfall conditions in soil sloping areas is a novel idea. On top of that, this study explores the properties and conditions of Sg Langat involving extreme rainfall so that the results could be applied to other areas with similar conditions.
Infiltration is defined as the flow of water to the soil through the surface of the ground. Rainfall is a major cause of slope failures that claim the lives of many and lead to significant economic losses around the world. Rainwater that fails to percolate into the ground turns into runoff and flows down the slope. Both of these scenarios (rainfall infiltration and runoff) contribute to the loss of suction in the soil, resulting in slope failure (Taib et al., 2020). Hence, it is established that rainfall is the main triggering factor for the slope failure; however, the effect of the soil density with the associated soil properties on the stability of the slopes has not received adequate attention (Zhao et al., 2019). One of the most challenging factors that engineers face is adapting to climate change. Since the 1900s, considerable research has been conducted to predict extreme weather events. Global weather patterns, such as temperature and rainfall distributions, can have significant economic and societal consequences (Dijkstra and Dixon 2010). Because of rainfall infiltration, various types of slope stability show failure phenomena, such as erosion, and can cause changes, such as different mass flow movements, depending on the slope morphology, characteristic soil curves, and the shear strength involved. The complicated linkages between rainfall circumstances, pore water pressure, soil strength, safety variables, and movement rates have been revealed (Lee et al., 2021).
Understanding the spatial and temporal characteristics of rainfall variability is important for gaining knowledge of the water balance dynamics on various scales for water resources management and planning (Uhlenbrook, 2009). Laboratory and field tests have proven that a homogeneous slope under rainfall conditions is prone to suffer from surface erosion or shallow landslides, whereas landslide surveys have indicated that deep-seated failures are often induced by rainfall in slopes with pre-existing cracks or weak layers (Zhang et al., 2012). For example, the landslides in the South Auckland region of New Zealand were due to pore pressures within cracks after rainstorms (Chatra et al., 2017). Furthermore, the changes in groundwater hydrology can reduce the effective stress and the shear strength of soil, resulting in rainfall-induced slope failures too (Taylor et al., 2008; Chatra et al., 2017). Regarding deep landslides, their activity is essentially governed by pore water pressure fluctuations, that affect the operational shear strength along the slip surface and are in turn regulated by the seasonal environmental conditions (Rianna et al., 2014). One way to prevent these undesirable rainfall-induced slope failures is to understand the variation in rainfall intensity, which can be used to determine rainfall patterns in the future.
The water infiltration characteristics associated with irrigation activities contribute to slope stability failures (Hou et al., 2018). The infiltration of water significantly reduces the shear strength of soil that is initially in a state of unsaturated condition and contributes to the instability of the slope (Aung et al., 2001). The functional relationship between water content and soil suction, referred to as the soil-water characteristic curve (SWCC), plays a central role in understanding the behaviour of unsaturated soil (Zhou and Jian-lin, 2005). SWCCs have been used to estimate the hydraulic conductivity, shear strength, volume change, and aqueous diffusion functions of unsaturated soils (Thu et al., 2011). For such unsaturated soils, the general practice is to provide the SWCCs or soil-water retention curves (SWRCs), describing the relationship of an unsaturated soil moisture content change and its degree of saturation change with its total suction change, which affects its shear strength behaviour (Egeli and Pulat, 2011; Cavalcante and Mascarenhas, 2021).
Rainfall-induced slope failure is a common geohazard for tropical and sub-tropical areas where residual soils are abundant (Furuya et al., 2006; Cho, 2009; Rahardjo, et al., 2012; Bordoni et al., 2015; Tang et al., 2016). Rainfall decreases the suction of the matrix and increases the weight of soil units, leading to a less stable soil slope (Rahardjo et al., 2005; Cho, 2014; Ering and Babu, 2016). According to Zhang et al. (2000), the infiltration rate depends on the initial soil water content, and the presence of stratigraphic instability may influence the infiltration pattern. Fredlund and Xing (1994) described the characteristics of soil curves for soil defined as the relationship between water content and soil suction (Williams, 1982). Water content is defined as the amount of water contained in the pores. It is undeniable that rainfall is the main causing factor for slope failure, hence the effort of research and applying sound techniques and methods to control slope failures shall never rest.
Seasonal wind patterns along with local topographic properties determine the pattern of rainfall distribution in Malaysia. During the northeast season, exposed areas such as the east coast of Peninsular Malaysia, West Sarawak, and the northeastern coast of Sabah experience periods of heavy rainfall. In contrast, the hinterland or areas protected by mountain ranges are relatively free from this influence. To enhance the understanding of the rainfall distribution in Malaysia, the distribution is described with respect to the typical seasons. Hence, Table 1 shows the categorised rainfall distribution according to the rainfall intensity. Moreover, the minimum and maximum rainfall intensities are presented in Table 1, representing the lowest and the highest rainfall intensities calculated for all the areas in Malaysia.
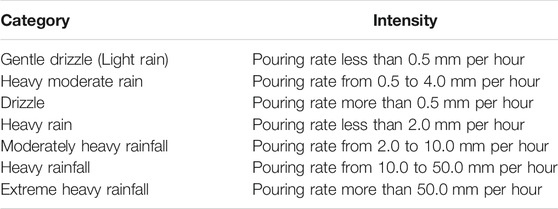
TABLE 1. Category of rainfall distribution.
Seasonal rainfall changes in Peninsular Malaysia as shown in Figure 1 can be divided into three main types:
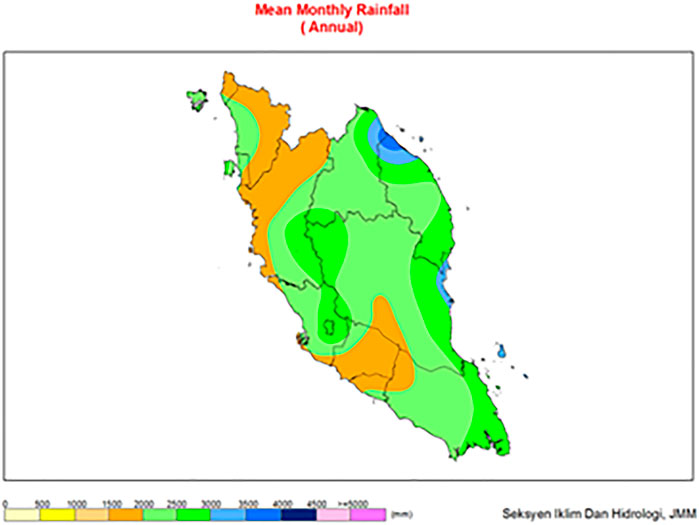
FIGURE 1. Annual mean monthly rainfall in Peninsula Malaysia (Suhaila et al., 2010).
For the states on the east coast of Peninsular Malaysia, November to January are the months with the maximum rainfall, while June and July have the minimum rainfall.
Rainfall patterns in the southwest coast of Peninsular Malaysia show two maximum rainfall periods separated by two minimum rainfall periods. The primary maximum usually occurs from October to November, while the secondary maximum occurs from April to May. In the northwest, the primary minimum occurs from January to February, while the secondary minimum occurs from June to July. Elsewhere, primary minimums occur from June to July, while secondary minimums occur in February.
The rainfall pattern on the southwest coast of Peninsular Malaysia is considerably marked by the “Sumatra” incident in the morning from May to August and the maximum and minimum double patterns do not exist. October and November are the months with the maximum rainfall, while February is the month with the minimum rainfall. The maximum from March to May and the minimum from June to July do not exist or are less clear (Suhaila et al., 2010).
Seasonal rainfall changes in Sabah and Sarawak as shown in Figure 2 can be divided into five main types:
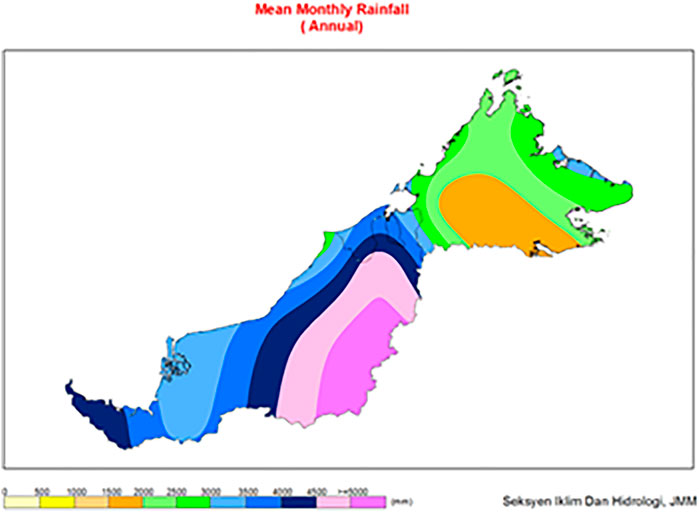
FIGURE 2. Annual mean monthly rainfall in Sabah and Sarawak (Uhlenbrook 2009; Suhaila et al., 2010).
The coastal areas of Sarawak and northeast Sabah experience one maximum and one minimum rainfall pattern. Both areas experience maximum rainfall in the same month, which is January, while the months for minimum rainfall are different. In the coastal areas of Sarawak, minimum rainfall occurs in June or July, while in the northeast area of the Sabah coast, minimum rainfall occurs in April. Under this rule, most of the rainfall is received during the northeast monsoon months, from December to March. Indeed, more than half of the annual rainfall is received in western Sarawak.
The hinterland of Sarawak generally experiences fairly even annual rainfall. However, slightly less rainfall is received during the period June to August, following the prevailing southwest winds. Note that the highest annual rainfall in Malaysia occurs on the hillside of the interior of Sarawak. Long Akah receives an average annual rainfall of more than 5,000 mm.
The northwest coast of Sabah experiences two maximum and two minimum rainfall patterns. The primary maximum occurs in October, and the secondary maximum occurs in June. The primary minimum occurs in February, while the secondary minimum occurs in August. Although the difference in the amount of rainfall received in the two maximum months is small, the difference in the amount of rainfall received at the primary minimum is lower than that at the secondary minimum. In some places, the difference reaches four times as high.
In the central part of Sabah where the conditions are hilly and sheltered by mountain ranges, the rainfall received is lower than that received in other areas, and the distribution is relatively even. However, two maximums and two minimums can be observed. In general, two minimums occur in February and August, while two maximums occur in May and October.
The southern part of Sabah experienced an even distribution of rainfall. The amount of annual rainfall received can be compared to that received in the central part of Sabah. February to April is a relatively dry period as compared to the other months (Uhlenbrook, 2009).
Therefore, this study would be more applicable to West Malaysia because the research area was in Peninsular Malaysia (West Malaysia) and the soil properties and the slope geometry are different from those in East Malaysia.
The numerical modelling of unsaturated soil slopes has progressed quickly, and numerous studies have proposed improved solutions to the slope boundary problems. The general concept in numerical modelling is still important to provide correct calculations, particularly when using finite element methods (Taib et al., 2018). Finite element modelling utilises approximate solutions of ordinary and differential equations to describe the distribution of stresses and strains in soil as well as finite understanding of unsaturated behaviour (Taib et al., 2019). With respect to the research objectives, the geometry models, namely CH1, CH2, and CH3, were set up, and the soil properties (mechanical and hydraulic) and the water level were included in the simulation models. The slope geometries are illustrated in Figure 3. Each of the geometry models was designed according to the different locations of riverbanks from Sg Langat and with different patterns of slope geometry. Each soil layer was assigned a different colour and indicated by its existing depth.
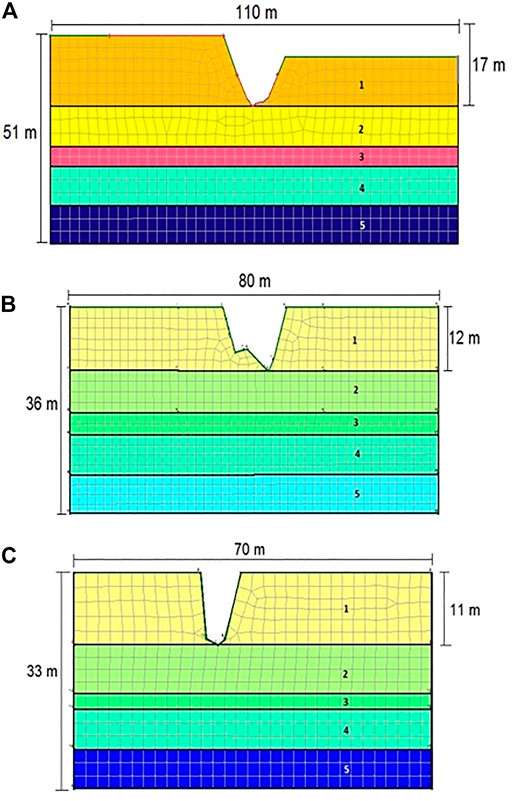
FIGURE 3. Slope dimension for (A) Channel 1, (B) Channel 2 and (C) Channel 3.
Furthermore, the rainfall data gathered from the historical records were analysed based on four selected rainfall stations. They were Kg. Jenderam Hilir, Puncak Niaga Putraya, Kolam Takungan Sg Merab, and RTM Kajang. The highest rainfall intensity recorded for a month in the selected years at a location close to the research site was obtained. Next, numerical modelling through a slope model simulation by using Geostudio was undertaken with different groundwater levels (i.e., high, intermediate, and low), various slope angles, and changing rainfall events with different intensities. SLOPE/W and SEEP/W in Geostudio were applied to compute the factor of safety of slopes and analyse both simple and complex problems for a variety of slip surface shapes as well as pore-water pressure conditions. The results obtained from the output of the Geostudio were presented in terms of the pore-water pressure and factor of safety. The generation of the pore-water pressure was measured against the slope depth, and the factor of safety was calculated against the event of extreme rainfall.
In SEEP/W, the channels were initially sketched and regions were drawn in the model geometry to differentiate between the upper layer and lower layer soils. Next, materials of models were defined based on the soil hydraulic properties, namely the SWCC parameters (i.e., hydraulic conductivity, hydraulic boundary, and volume water content) and soil types, as shown in Figure 4, before these model parameters were assigned to the soil models. The SWCC presented the relationship between the soil-water suction and the water content of the soil. This relationship assisted to define the magnitude of matric suction that occurred in a soil deposit when the water content was less than saturated (Baker and Frydman 2009). The quantity of water retained in the soil at a certain magnitude of suction depended on many factors: particle shape, particle size, distribution of pore spaces, mineralogy, the surface activity of solid grain particles, and chemical composition of interstitial water (Aubertin et al., 2003).
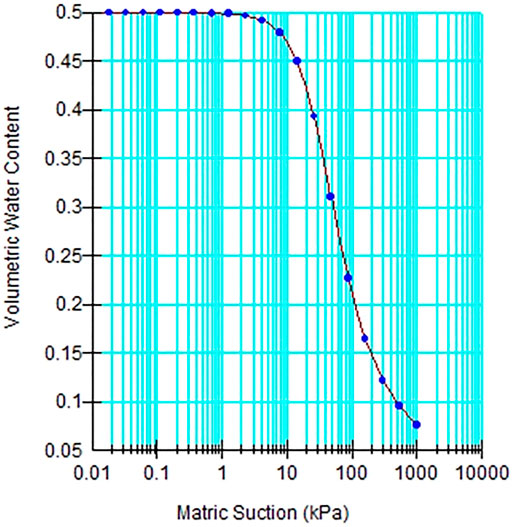
FIGURE 4. SWCC parameters used in SEEP/W analysis for all channels.
Next, the boundary conditions such as seepage and pressure head were defined and labelled in the model to assign the boundaries of each condition. The element mesh was also applied to the soil models. The mesh sizes were determined automatically, and triangular and rectangular shapes were used. Once the groundwater level was assigned, the groundwater flow analysis can be solved. The rainfall data were applied to the slope via the seepage behaviour. Then, the analysis was ready to be conducted. In the output, the pore-water pressure of the slope can be obtained on a different contour level.
In SLOPE/W, similar model geometry procedures were conducted as in the SEEP/W models. Initially, materials of models were defined according to the soil mechanical parameters including soil unit weight, cohesion, and angle of friction, thus assigned to the soil models. The phreatic lines were drawn on the soil layer to generate the existing pore-water pressure. Moreover, entry and exit slip surfaces were determined in the model to indicate the critical slip surface. It is important to allow the visualisation of the critical zones before solving the analysis to capture the relevant factor of safety. The entry would be at the highest surface of the slope (crest), and the exits would be at the lowest surface of the slope (toe). The calculation was set, and the analysis can then be solved. The input demonstrated the factor of safety, which can be chosen with respect to the slope stability and the position of the slip surface.
The models were analysed as plane strain models with 15-node mesh elements. As the slope geometry was drawn, the soil parameters were assigned to the three channels, as stated in Table 2. Among the soil parameters included were the unit weight for both saturated and unsaturated conditions, soil permeability, stiffness, and angle of friction. The constitutive model used to present the slope behaviour was Mohr-Coulomb under the influence of the drained conditions. In addition, general fixities were created in the slope models concerning the flow boundary conditions. General fixities consisted of an open flow along the top surface, lateral flow at both sides, and a close boundary at the bottom layer. These fixities were applied to ensure that a natural water flow took place within the respected boundaries. The rainfall was applied as water infiltration via the transient flow analysis. Therefore, Table 3 presents the SWCC and the permeability function noting the curve parameters.

TABLE 2. Unsaturated soil parameter.

TABLE 3. SWCC dan permeability function parameter.
In the rainfall data obtained, some of the data were found missing and there were errors in the data for a certain date. Some stations had short breaks in the records because of the absence of the observer or may be due to instrumental failures. It is a general practice to estimate missing rainfall records. In this study, the missing data of a station were estimated from the observations of other stations that were as close to and as evenly spaced around the station with the missing record. The stations with missing data were named as the interpolation station, and the gauging stations that are used to calculate the missing station data were called index stations. Hence, in this situation, the simple arithmetic mean method was used to recover and calculate the missing data as follows:
For example, as shown in Table 4, there was a data error that showed −999 on the dates 01/06/2009 and 03/06/2009 at RTM Kajang. From the equation based on the simple arithmetic mean method, Px, which represents the stations with missing data, was calculated. Table 5 represents the recovered missing rainfall data.

TABLE 4. Missing data rainfall in the four stations.

TABLE 5. Recovered data rainfall in the four stations.
Figures 5–8 show the daily rainfall intensity from year 2008–2016. Kampung Jenderam Hilir is located near Sungai Langat, which is close to the Dengkil area. According to the rainfall data for the considered years, on 26 February 2013 in Figure 5, Kampung Jenderam Hilir had the highest rainfall intensity, which was 152 mm, as shown in Figure 9A. Puncak Niaga Putrajaya is located close to Putrajaya Lake. Based on its rainfall data, on 28 November 2012 in Figure 6, Puncak Niaga Putrajaya had the highest rainfall intensity, which was 115.9 mm, as presented in Figure 9B. Sungai Merab is located between Dengkil and Bandar Baru Bangi. As pointed out, on 10 October 2013 in Figure 7, Kolam Takungan Sg. Merab had the highest rainfall intensity, which was 121 mm, as shown in Figure 10A. RTM Kajang is located at Kajang near Jalan Cheras. According to the rainfall data given, 9 April 2012 in Figure 8 had the highest rainfall intensity, which was 142 mm, in the RTM Kajang area, as presented in Figure 10B. In the end, according to the entire rainfall data obtained from all of the four stations, Kampung Jenderam Hilir had the most extreme rainfall intensity, which was 152 mm, on 26/02/2013. Furthermore, Figure 11 shows the overall rainfall intensities from all four stations from 2008 until 2016.
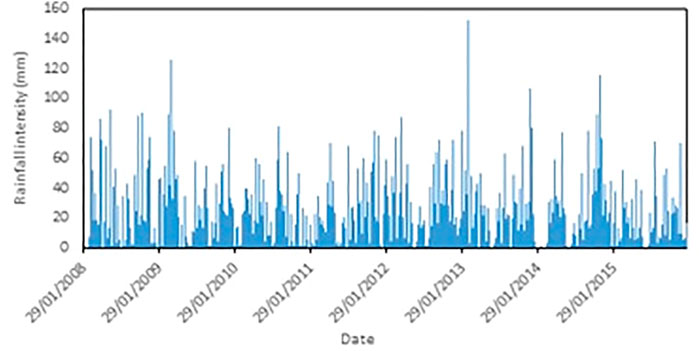
FIGURE 5. Rainfall intensity at Kg. Jenderam Hilir in 8 years.
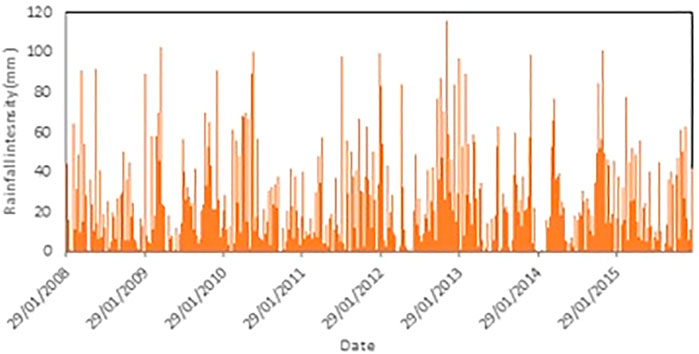
FIGURE 6. Rainfall intensity at Puncak Niaga Putrajaya in 8 years.
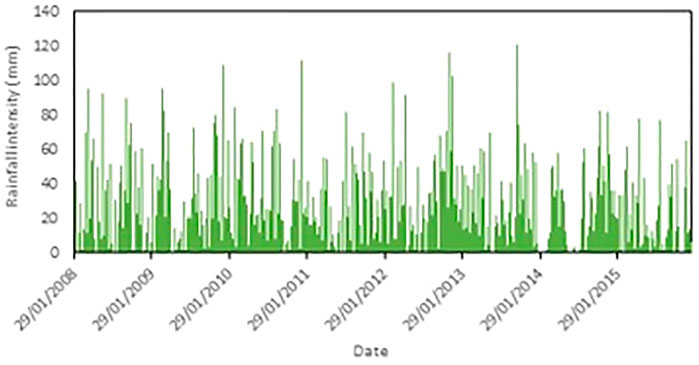
FIGURE 7. Rainfall intensity at Kolam Takungan Sg. Merab in 8 years.
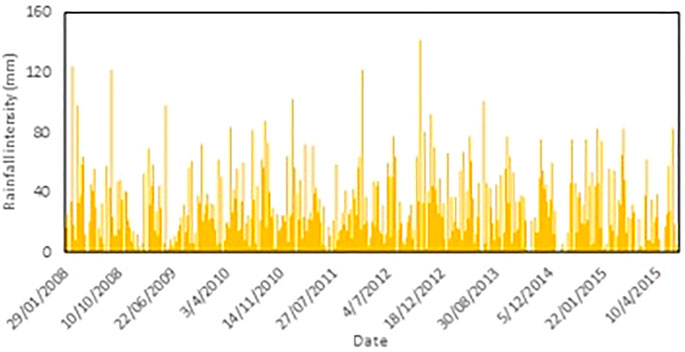
FIGURE 8. Rainfall intensity at RTM Kajang in 8 years.
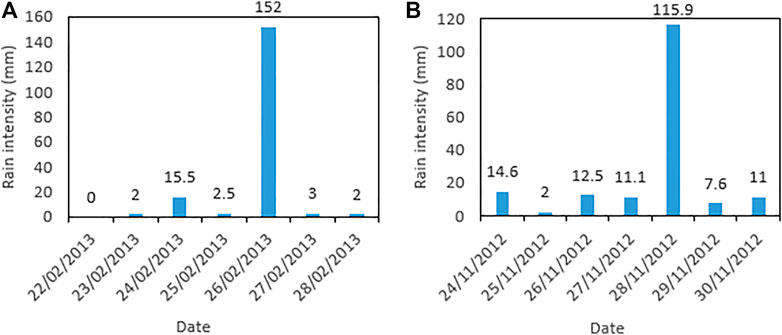
FIGURE 9. Extreme rainfall in 1-week interval in (A) Kg. Jenderam Hilir and (B) Puncak Niaga Putrajaya.
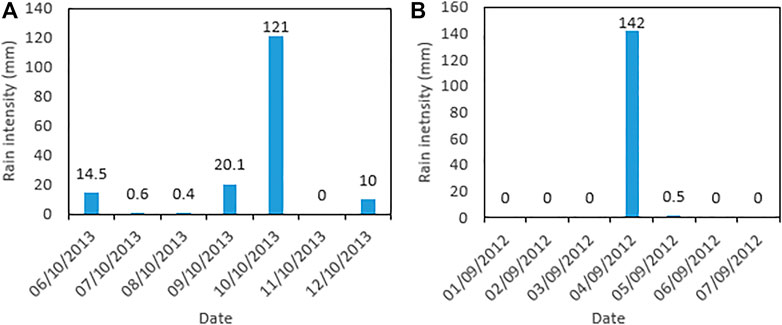
FIGURE 10. Extreme rainfall in 1-week interval at (A) Kolam Takungan Sg. Merab and (B) RTM Kajang.
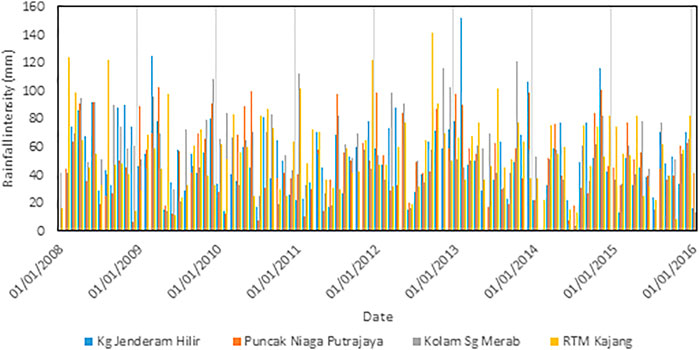
FIGURE 11. Overall rainfall intensity from 2008—2016 for all four stations.
The results from the study are presented in terms of pore-water pressure, factor of safety and the water seepage. The behaviour of Sg Langat slopes is analysed and discussed due to the effect of extreme rainfall within the typical slope behaviour analysis. The seepage analysis is an added behaviour described in the changes of water total head against a period of three weeks of RTM Kajang rainfall station.
In this study, the calculation phases were divided into two stages; which were the static (named as phase 1) and consolidation (named as phase 2). The static phase was used to generate the initial conditions which determined the existing pore-water pressure at the site. The following consolidation phase was undertaken with the effect of phreatic level (9.81 kN/m) applied in the slope model. The durations for both calculations were different as the steady-state was conducted immediately under zero-hours, whereas the consolidation phase was simulated as transient for eight years. No water infiltration (i.e. rainfall) was applied at the first stage. The results were localised to represent the initial changes in the existing pore-water pressure underground. The staged construction which involved loading the input under the time interval was incrementally increased. The results for these two phases were presented in the generation of the pore-water pressure.
The results of the pore-water pressure were obtained from SEEP/W for all the analyses with respect to the three channels. Each of the pore-water pressures developed can be seen on different contour levels with values in Figure 12. The arrows illustrated between the channel openings show the active pore pressure around the surface of the soil. It can be seen that Channel 1 has slightly higher pore-water pressure followed by Channels 2 and 3. Zero pore-water pressure indicates the location of groundwater level; hence, the zones at the channel openings with high pore-water pressure faced the possibility of soil erosion via runoff.
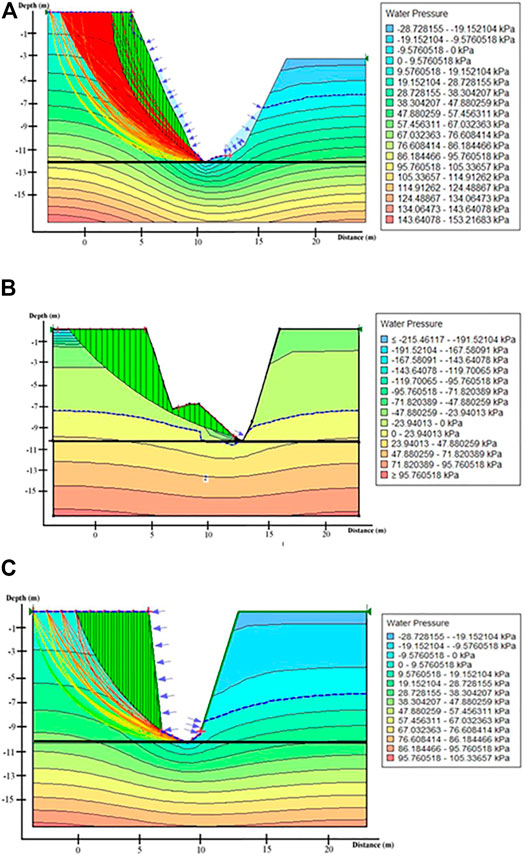
FIGURE 12. Pore-water pressure based on different contour levels for Channel (A) 1, (B) 2 and (C) 3.
In the RTM Kajang rainfall event, as shown in Figure 13, high pore-water pressure changes in the shallower depth can be observed between phase 1 and phase 2 for Channel 1. Furthermore, phase 2 of the transient analysis showed smaller changes with lower negative pore-water pressure (i.e. −36 kPa) and at a lower depth than the steady-state analysis (i.e. −40 kPa), indicating the influence of rainfall infiltration. In Channel 2, the generation of pore-water pressure in both phases was observed to be similar to that in the case of Channel 1 but with a smoother negative pore-water pressure profile. The highest pore-water pressure for Phases 1 and 2 in Channel 2 was observed at the same depth (−12 m). In contrast, the pressure changes in Channel 3 were different, demonstrating that the generation of negative pore-water pressure was not directly affected by the type of analysis and the rainfall infiltration alone. The geometry of the slope may induce the changes of phase 2 found at a shallower depth. The changes were observed occurring abruptly with the slight fluctuating reading of negative pore-water pressure profile starting at the depth of −5 m and then developed to the highest value at −29 kPa. Furthermore, all channels were found to shift the pore-water pressure values by the level of groundwater at the depths of −15, −16, and −12 m.
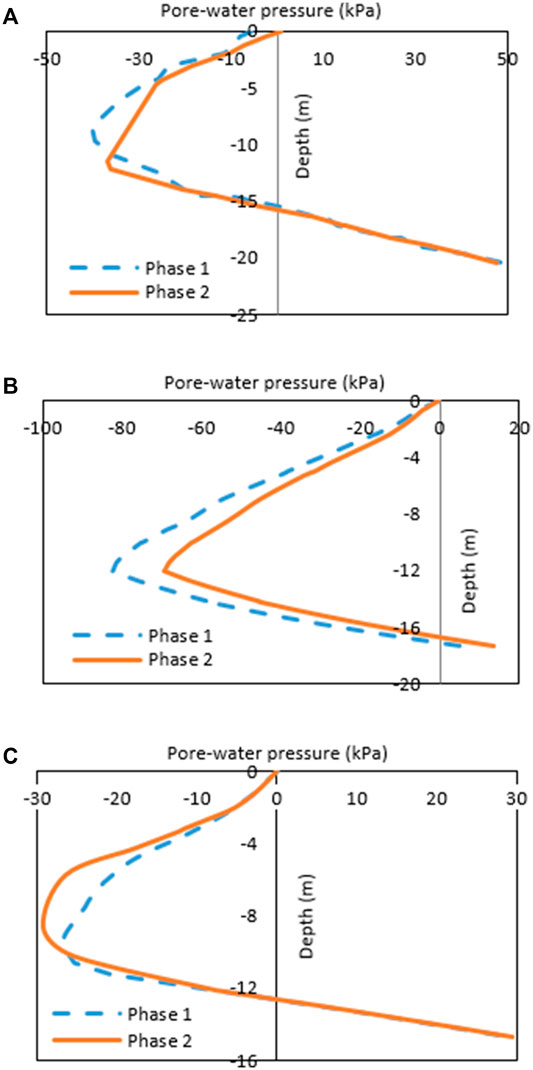
FIGURE 13. Pore-water pressure measured against depth for Channel (A) 1, (B) 2 and (C) 3.
Throughout the results, the instability of slopes was observed and established by the negative pore-water pressure changes in the soil for the steady-state and consolidation. A comparison with previous studies, such as Cooper et al. (2010), and Pontier et al. (2004) revealed that the slopes on all of the channels presented were still considered unstable because of the considerable changes in the negative pore-water pressure at a shallower depth for both phases due to the rainfall infiltration, causing the soil strength to reduce and leading to slope failure. Hence, the development and the changes in the negative pore-water pressure were analysed using a method similar that has been used in the slope stability analysis by Perrone et al. (2008). Moreover, several studies have stressed that pore-water pressures may also be affected by the different types of soils (; Rahimi et al., 2011 Sagitaningrum, and Bahsan, 2017).
The ratio between the available strength and the strength necessary for a state of incipient failure along a probable slip surface is known as the factor of safety of the slope (Khajehzadeh et al., 2012). In engineering, the factor of safety is the ratio of a structure’s absolute strength (structural capability) to an actual applied load. It expresses how much stronger a system is than it needs to be for an intended load. The factor of safety of the potential sliding surface inside the slope is the most common index used to assess slope stability. The calculation often relies on the limit equilibrium model, which builds on the assumption that the slope consists of rigid materials and that possible destruction occurs along the potential sliding surface over a large number of the randomly selected sliding surfaces (Lichao Zhang et al., 2021). In terms of the limit equilibrium principle, a factor of safety less than one represents the failure in a slope. Hence, the factor of safety was obtained based on the stresses by using the SLOPE/W package. The SLOPE/W utilised the limit equilibrium method that models heterogeneous soil types, complex stratigraphic and slip surface geometry and variable pore-water pressure conditions under the development of a large selection of soil models. Limit equilibrium methods are used to calculate factors of safety with five input parameters: height of slope, unit weight of slope material, angle of slope, coefficient of cohesion, and internal angle of friction (Mohamed et al., 2012).
The factor of safety from Sg Langat channels was obtained where it described the slip surfaces between an entrance and an exit. The factor of safety of each trial slip surface was drawn with a slip surface colour that helped to visualise both the number of trial slip surfaces with a factor of safety close to the critical value and the most likely shape of the failure zone. The data were divided into three categories, namely the minimum, intermediate, and maximum value of the factor of safety. Figure 14 presents a bar chart of the factor of safety against the lambda value of the minimum, intermediate, and maximum values for all the channels. Lambda can be defined as the ratio of the interslice shear and interslice normal forces generating the same factor of safety for both moment and force equilibrium (Matsuura et al., 2008).
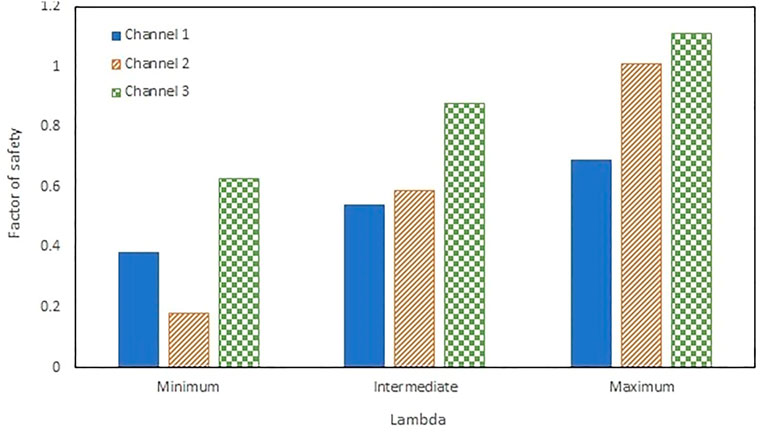
FIGURE 14. Graph of the factor of safety for all channels.
In other words, lambda is understood as the width of the gap between two slip surfaces. Thus, the factor of safety can be strongly determined by lambda to compare the differences in the factor of safety for each slip surface. Figure 14 for Channel 1 shows the factor of safety calculated at the convergence of 0.38, 0.54, and 0.69, respectively, for the minimum, intermediate, and maximum values. These values, however, promote slope instability as it fails to reach a factor of safety of more than 1.0 at the least. A comparison with the previous studies which involved a similar situation (Matsuura et al., 2008; Merat et al., 2019) revealed that although Channels 2 and 3 demonstrated a higher factor of safety, even when exceeding the 1.0 values, the factors of safety calculated were still very low to maintain for long-term stability. At these points, lowering the shear strength by means of continuous water infiltration or rigorous runoff on the slope surface may easily initiate a slope failure (Hou et al., 2018). Hence, the value of the factor of safety is controlled by the amount of rainfall infiltration rate into the soil. The higher the rate of infiltration of rain, the less the safety factor value estimated. Continuous rainwater that infiltrates into the unsaturated zone of soil slope decreases the matric suction, increases the shear strength of soil, which corresponds to the minimum factor of safety under the influence of rainfall duration and consequently, causes slope failure. It is, therefore, highly recommended that the riverbank slope of Sg Langat be protected by both natural and reinforced walls to preserve the slope from further failure due to the influence of rainfall.
SEEP/W package was used to determine the behaviour of the Sg Langat riverbank under the influence of rainfall; Figure 15 shows the water seepage of the rainfall in RTM Kajang in 3-weeks intervals. As the rainfall intensity was too low to have affected the slope instability, two recurrent series of rainfall events were applied. The second session of rainfall intensity was multiplied with the original first event of factor 5 and the third session with a factor 7. According to Figure 15, in the first session of the rainfall series, the data showed minimal values of water total head and the highest value of the first 7 days was only 0.22 m. The second session showed the highest water total head among all the rainfall series, which was on the 14th day with a value of 1.15 m. Then, the third session of rainfall showed a decreasing pattern of the water total head.
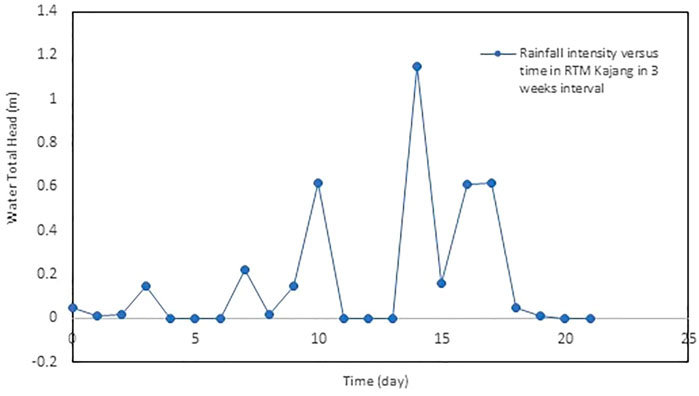
FIGURE 15. Three sessions of rainfall events applied in SEEP/W.
The results of the parametric study were presented in the following sections: 1) the influence of rainfall intensity on the strength of soil, 2) the influence of slope angle during heavy rainfall, and 3) the rainfall intensity to cause a shallow slope failure. The relationship between rain infiltration and slope stability was recorded by greater rainfall infiltration, causing the slope to behave unstably and subsequently fail. The results of the analysis revealed that the pressure changes were different for every channel, demonstrating that the generation of negative pore-water pressure was not directly affected by the type of analysis and the rainfall infiltration alone. The geometry of the slope may induce changes in the negative pore-water pressure. Moreover, the slopes on all of the channels presented were still considered unstable as changes in the negative pore-water pressure at a relatively shallower depth were found due to the effect of rainfall infiltration, causing a reduction of the soil strength and thus leading to a slope failure. Furthermore, the extreme rainfall event influenced the factor of safety of the slopes, which corresponded to the minimum factor of safety under the influence of rainfall intensity. The factor of safety recorded for Channel 1 was the lowest at 0.18, whereas Channel 3 had the highest factor of safety of 1.11 but was still considered unsafe as it fell under the minimum factor of safety of 1.3. The slope behaviour of Sg Langat was analysed taking into account the rainfall slope angles, groundwater level, and rainfall intensity (Wang et al., 2001; Mukhlisin and Taha, 2012).
The raw data supporting the conclusion of this article will be made available by the authors, without undue reservation.
All authors listed have made a substantial, direct, and intellectual contribution to the work and approved it for publication.
The authors declare that the research was conducted in the absence of any commercial or financial relationships that could be construed as a potential conflict of interest.
All claims expressed in this article are solely those of the authors and do not necessarily represent those of their affiliated organizations, or those of the publisher, the editors and the reviewers. Any product that may be evaluated in this article, or claim that may be made by its manufacturer, is not guaranteed or endorsed by the publisher.
The author would like to thank the people involved in the research project and acknowledge the University Kebangsaan Malaysia for the financial assistance under grant GUP-2021-022 and National Hydraulic Research Institute of Malaysia for funding this research under the grant KK-2020-009.
Aubertin, M., Mbonimpa, M., Bussière, B., and Chapuis, R. P. (2003). A Model to Predict the Water Retention Curve from Basic Geotechnical Properties. Can. Geotech. J. 40, 1104–1122. doi:10.1139/t03-054
Aung, K. K., Rahardjo, H., Leong, E. C., and Toll, D. G. (2001). Relationship between Porosimetry Measurement and Soil-Water Characteristic Curve for an Unsaturated Residual Soil. Geotechnical Geol. Eng. 19, 401–416. doi:10.1007/978-94-015-9775-3_9
Baker, R., and Frydman, S. (2009). Unsaturated Soil Mechanics. Critical Review of Physical Foundations. Eng. Geology. 106 (1–2), 26–39. doi:10.1016/j.enggeo.2009.02.010
Bordoni, M., Meisina, C., Valentino, R., Lu, N., Bittelli, M., and Chersich, S. (2015). Hydrological Factors Affecting Rainfall-Induced Shallow Landslides: From the Field Monitoring to a Simplified Slope Stability Analysis. Eng. Geology. 193, 19–37. doi:10.1016/j.enggeo.2015.04.006
Cavalcante, A. L. B., and Mascarenhas, P. V. S. (2021). Efficient Approach in Modeling the Shear Strength of Unsaturated Soil Using Soil Water Retention Curve. Acta Geotech. 16, 3177–3186. doi:10.1007/s11440-021-01144-6
Chatra, A. S., Dodagoudar, G. R., and Maji, V. B. (2017). Numerical Modelling of Rainfall Effects on the Stability of Soil Slopes. Int. J. Geotechnical Eng. 13, 425–437. doi:10.1080/19386362.2017.1359912
Cho, S. (2009). Infiltration Analysis to Evaluate the Surficial Stability of Two-Layered Slopes Considering Rainfall Characteristics. Eng. Geology. 105, 32–43. doi:10.1016/j.enggeo.2008.12.007
Cho, S. (2014). Probabilistic Stability Analysis of Rainfall-Induced Landslides Considering Spatial Variability of Permeability. Eng. Geology. 171, 11–20. doi:10.1016/j.enggeo.2013.12.015
Coe, R., and Stern, R. D. (1982). Fitting Models to Daily Rainfall Data. J. Appl. Meteorology 21, 1024–1031. doi:10.1175/1520-0450(1982)021<1024:fmtdrd>2.0.co;2
Cooper, M., Vidal-Torrado, P., and Grimaldi, M. (2010). Soil Structure Transformations from Ferralic to Nitic Horizons on a Toposequence in Southeastern Brazil. Rev. Bras. Ciênc. Solo 34 (5), 1685–1699. doi:10.1590/s0100-06832010000500021
Dijkstra, T. A., and Dixon, N. (2010). Climate Change and Slope Stability in the UK: Challenges and Approaches. Q. J. Eng. Geology. Hydrogeology 43 (4), 371–385. doi:10.1144/1470-9236/09-036
Duc Long, P., and Dung, N. T. (2020). Correction to: Geotechnics for Sustainable Infrastructure Development. Lecture Notes Civil Engineering,Geotechnics Sust. Infrastructure Dev. 62, C1–C3. doi:10.1007/978-981-15-2184-3_186
Egeli, I., and Pulat, H. F. (2011). Mechanism and Modelling of Shallow Soil Slope Stability during High Intensity and Short Duration Rainfall. Scientia Iranica 18 (6), 1179–1187. doi:10.1016/j.scient.2011.09.010
Ering, P., and Babu, G. (2016). Probabilistic Back Analysis of Rainfall Induced Landslide—A Case Study of Malin Landslide, India. Eng. Geology. 208, 154–164. doi:10.1016/j.enggeo.2016.05.002
Feuerharmel, C., Bica, A. V. D., Gehling, W., and Flores, J. A. (2005). “A Study of the Shear Strength of Two Unsaturated Colluvium Soils,” in Proceedings of the International Symposium on Advanced Experimental Unsaturated Soil Mechanics, Jan 2005, 169–174.
Fredlund, D. G., Morgenstern, N. R., and Widger, R. A. (1978). The Shear Strength of Unsaturated Soils. Can. Geotech. J. 15, 313–321. doi:10.1139/t78-029
Fredlund, D. G., and Xing, A. (1994). Equations for the Soil-Water Characteristic Curve. Can. Geotech. J. 31 (4), 521–532. doi:10.1139/t94-061
Furuya, G., Suemine, A., Sassa, K., Komatsubara, T., Watanabe, N., and Marui, H. (2006). Relationship between Groundwater Flow Estimated by Soil Temperature and Slope Failures Caused by Heavy Rainfall, Shikoku Island, Southwestern Japan. Eng. Geology. 85, 332–346. doi:10.1016/j.enggeo.2006.03.002
Ghani, A. N. C., Taib, A. M., and Hasbollah, D. Z. A. (2020). Effect of Rainfall Pattern on Slope Stability. Lecture Notes Civil Eng. 62 (January), 887–892. doi:10.1007/978-981-15-2184-3_115
Gofar, N., Min Lee, L., and Lee, L. M. (2008). Extreme Rainfall Characteristics for Surface Slope Stability in the Malaysian Peninsular. Georisk: Assess. Manag. Risk Engineered Syst. Geohazards 2, 65–78. doi:10.1080/17499510802072991
Hou, X., Vanapalli, S. K., and Li, T. (2018). Water Infiltration Characteristics in Loess Associated with Irrigation Activities and its Influence on the Slope Stability in Heifangtai Loess highland, China. Eng. Geology. 234, 27–37. doi:10.1016/j.enggeo.2017.12.020
Jeong, S., Lee, K., Kim, J., and Kim, Y. (2017). Analysis of Rainfall-Induced Landslide on Unsaturated Soil Slopes. Sustainability 9 (7), 1280–1320. doi:10.3390/su9071280
Khajehzadeh, M., Taha, M. R., El-shafie, A., and Eslami, M. (2012). A Modified Gravitational Search Algorithm for Slope Stability Analysis. Eng. Appl. Artif. Intelligence 25 (8), 1589–1597. doi:10.1016/j.engappai.2012.01.011
Lee, W.-L., Martinelli, M., and Shieh, C.-L. (2021). An Investigation of Rainfall-Induced Landslides from the Pre-failure Stage to the Post-Failure Stage Using the Material Point Method. Front. Earth Sci. 9 (November), 1–13. doi:10.3389/feart.2021.764393
Lichao Zhang, L., Liu, X., Song, Y., Li, J., Cai, C., Zhao, X., et al. (2021). Characterization of Surface Runoff Pathways and Erosion Using Hydrological Attributes under Simulated Rainfall. Front. Earth Sci. 9 (July), 1–13. doi:10.3389/feart.2021.683473
Matsuura, S., Asano, S., and Okamoto, T. (2008). Relationship between Rain And/or Meltwater, Pore-Water Pressure and Displacement of a Reactivated Landslide. Eng. Geology. 101, 49–59. doi:10.1016/j.enggeo.2008.03.007
Merat, S., Djerbal, L., and Bahar, R. (2019). “Rainfall Effect on Slope Stability Using Numerical Analysis,” in Recent Advances in Geo-Environmental Engineering, Geomechanics and Geotechnics, and Geohazards. CAJG 2018. Advances in Science, Technology & Innovation (IEREK Interdisciplinary Series for Sustainable Development). Editor A. Kallel (Cham: Springer), 419–424.
Mohamed, T., Kasa, A., and Mukhlisin, M. (2012). Prediction of Slope Stability Using Statistical Method and Fuzzy Logic, 2.
Mukhlisin, M., and Taha, M. R. (2012). Numerical Model of Antecedent Rainfall Effect on Slope Stability at a Hillslope of Weathered Granitic Soil Formation. J. Geol. Soc. India 79 (5), 525–531. doi:10.1007/s12594-012-0077-0
Perrone, A., Vassallo, R., Lapenna, V., and Maio, C. D. (2008). Pore Water Pressures and Slope Stability: a Joint Geophysical and Geotechnical Analysis. J. Geophys. Eng. 5, 323–337. doi:10.1088/1742-2132/5/3/008
Pontier, H., Williams, J. B., and May, E. (2004). Progressive Changes in Water and Sediment Quality in a Wetland System for Control of Highway Runoff. Sci. Total Environ. 319, 215–224. doi:10.1016/s0048-9697(03)00410-8
Rahardjo, H., and Fredlund, D. (1995). Procedures for Slope Stability Analyses Involving Unsaturated Soils Asian Institute of Technology, Lecture Series on Slope Failures and Remedial.
Rahardjo, H., Lee, T. T., Leong, E. C., and Rezaur, R. B. (2005). Response of a Residual Soil Slope to Rainfall. Can. Geotech. J. 42, 340–351. doi:10.1139/t04-101
Rahardjo, H., Satyanaga, A., and Leong, E. (2012). Effects of Flux Boundary Conditions on Pore-Water Pressure Distribution in Slope. Eng. Geology. 165, 133–142. doi:10.1016/j.enggeo.2012.03.017
Rahimi, A., Rahardjo, H., and Leong, E.-C. (2011). Effect of Antecedent Rainfall Patterns on Rainfall-Induced Slope Failure. J. Geotech. Geoenviron. Eng. 137 (5), 483–491. doi:10.1061/(asce)gt.1943-5606.0000451
Rianna, G., Zollo, A., Tommasi, P., Paciucci, M., Comegna, L., and Mercogliano, P. (2014). Evaluation of the Effects of Climate Changes on Landslide Activity of Orvieto Clayey Slope. Proced. Earth Planet. Sci. 9, 54–63. doi:10.1016/j.proeps.2014.06.017
Sagitaningrum, F. H., and Bahsan, E. (2017). Parametric Study on the Effect of Rainfall Pattern to Slope Stability. MATEC Web Conf. 101, 05005. doi:10.1051/matecconf/201710105005
Schreiner, H. D. (1987). “The Use of Predictive Methods in Expansive Soils Engineering,” in Proceedings of the 9th African Regional Conference on Soil Mechanics and Foundation Engineering, Lagos, Nigeria, 135–141. Vol 1.
Suhaila, J., Deni, S. M., Zawiah Zin, W. A. N., and Jemain, A. A. (2010). Trends in Peninsular Malaysia Rainfall Data during the Southwest Monsoon and Northeast Monsoon Seasons: 1975-2004. Sains Malaysiana 39 (4), 533–542.
Taib, A. M., Taha, M. R., and Hasbollah, D. Z. A. (2018). Validation of Numerical Modelling Techniques in Unsaturated Slope Behaviour (Pengesahan Teknik Pemodelan Berangka Dalam Tingkah Laku Cerun Tak Tepu). Jurnal Kejuruteraan SI 1 (5), 29–35. doi:10.17576/jkukm-2018-si1(1)-05
Taib, A. M., Taha, M. R., and Hasbollah, D. Z. A. (2019). Validation of Numerical Modelling Techniques in Unsaturated Slope. Behaviour 1 (5), 29–35.
Taib, A. M., Taha, M. R., Rahman, N. A., Razuhanafi, M., and Yazid, M. (2020). The Effect of Soil-Root Interaction by Vetiver Grass on Slope (January 2021).
Tang, J., Niu, X., Wang, S., Gao, H., Wang, X., and Wu, J. (2016). Statistical Downscaling and Dynamical Downscaling of Regional Climate in China: Present Climate Evaluations and Future Climate Projections. J. Geophys. Res. Atmos. 121, 2110–2129. doi:10.1002/2015jd023977
Thu, T., Rahardjo, H., and Leong, E. (2011). Elastoplastic Model for Unsaturated Soil with Incorporation of the Soil-Water Characteristic Curve. Can. Geotechnical J. 44, 67–77. doi:10.1139/t06-091
Wang, Y.-J., Yin, J.-H., and Lee, C. F. (2001). The Influence of a Non-associated Flow Rule on the Calculation of the Factor of Safety of Soil Slopes. Int. J. Numer. Anal. Meth. Geomech. 25 (13), 1351–1359. doi:10.1002/nag.177
Williams, P. J. (1982). The Surface of the Earth, an Introduction to Geotechnical Science. New York: Longman.
Wong, C. L., Venneker, R., Uhlenbrook, S., Jamil, A. B. M., and Zhou, Y. (2009). Variability of Rainfall in Peninsular Malaysia. Hydrol. Earth Syst. Sci. Discuss. 6 (4), 5471–5503. doi:10.5194/hessd-6-5471-2009
Zhang, G., Wang, R., Qian, J., Zhang, J.-M., and Qian, J. (2012). Effect Study of Cracks on Behavior of Soil Slope under Rainfall Conditions. Soils and Foundations 52 (4), 634–643. doi:10.1016/j.sandf.2012.07.005
Zhang, X., Vincent, L. A., Hogg, W. D., and Niitsoo, A. (2000). Temperature and Precipitation Trends in Canada during the 20th Century. Atmosphere-Ocean 38, 395–429. doi:10.1080/07055900.2000.9649654
Zhao, B., Zhang, L., Xia, Z., Xu, W., Xia, L., Liang, Y., et al. (2019). Effects of Rainfall Intensity and Vegetation Cover on Erosion Characteristics of a Soil Containing Rock Fragments Slope. Adv. Civil Eng. 2019, 1–14. doi:10.1155/2019/7043428
Zhenping Zhang, Z., Fu, X., Sheng, Q., Yin, D., Zhou, Y., and Huang, J. (2021). Effect of Rainfall Pattern and Crack on the Stability of a Red Bed Slope: A Case Study in Yunnan Province. Adv. Civil Eng. 2021, 1–21. doi:10.1590/S0100-06832010000500021
Keywords: extreme rainfall, slope stability, pore-water pressure, Rainfall, factor of safety
Citation: Nazrien Ng J, Mohd Taib A, Razali IH, Abd Rahman N, Wan Mohtar WHM, A. Karim O, Mat Desa S, Awang S and Mohd MSF (2022) The Effect of Extreme Rainfall Events on Riverbank Slope Behaviour. Front. Environ. Sci. 10:859427. doi: 10.3389/fenvs.2022.859427
Received: 21 January 2022; Accepted: 14 February 2022;
Published: 02 March 2022.
Edited by:
Alfrendo Satyanaga, Nazarbayev University, KazakhstanReviewed by:
Dayang Zulaika Abang Hasbollah, University of Technology Malaysia, MalaysiaCopyright © 2022 Nazrien Ng, Mohd Taib, Razali, Abd Rahman, Wan Mohtar, A. Karim, Mat Desa, Awang and Mohd. This is an open-access article distributed under the terms of the Creative Commons Attribution License (CC BY). The use, distribution or reproduction in other forums is permitted, provided the original author(s) and the copyright owner(s) are credited and that the original publication in this journal is cited, in accordance with accepted academic practice. No use, distribution or reproduction is permitted which does not comply with these terms.
*Correspondence: Aizat Mohd Taib, YW1vaGR0YWliQHVrbS5lZHUubXk=
Disclaimer: All claims expressed in this article are solely those of the authors and do not necessarily represent those of their affiliated organizations, or those of the publisher, the editors and the reviewers. Any product that may be evaluated in this article or claim that may be made by its manufacturer is not guaranteed or endorsed by the publisher.
Research integrity at Frontiers
Learn more about the work of our research integrity team to safeguard the quality of each article we publish.