 Baoshan He1,2
 Guangyuan Yu
 Xin Zhang
 Qizhen Liu
 Yan Zhang
95% of researchers rate our articles as excellent or good
Learn more about the work of our research integrity team to safeguard the quality of each article we publish.
Find out more
ORIGINAL RESEARCH article
Front. Environ. Sci. , 28 March 2022
Sec. Atmosphere and Climate
Volume 10 - 2022 | https://doi.org/10.3389/fenvs.2022.858685
This article is part of the Research Topic Air Pollution and Climate Change: Interactions and Co-mitigation View all 18 articles
Understanding the formation and development processes of air pollution events is key to improving urban air quality. In this study, the air pollution episodes in stable synoptic conditions were selected to analyze the multi-phase evolution processes of heavy air pollution in Shanghai, a coastal city. The observation data and the WRF-CMAQ model were used to diagnose and simulate the pollution characteristics of the heavy pollution episodes. The results showed that the transport and dilution characteristics of PM2.5 were different during autumn and winter in Shanghai as a receptor of pollution transport. The development of PM2.5 pollution events were divided into four stages: accumulation stage, stagnation stage, enhancement stage, and dilution stage. The accumulation stage was before stable weather, and provided the foundations for PM2.5 pollution. The stagnation stage was nighttime during stable weather, in which the low wind speed and temperature inversion weakened regional transport and the dilution of PM2.5, which was defined as “retention effect”. The “retention effect” played a dominant role during the stagnation stage, accounting for 71.2% and 41.2% of total PM2.5 in winter and autumn case, respectively. The enhancement stage followed the stagnation stage, in which the newly regional transport was occurred due to stronger wind speed, accounting for 86.3% and 46.2% in winter and autumn episodes, respectively. The dilution stage was after the whole stable weather, when meteorological conditions were beneficial for PM2.5 dilution. Local emissions were dominant (63.0%) for PM2.5 pollution in the autumn case but regional transport was dominant (81.3%) in the winter case. Therefore, preventing the heavy particulate pollution caused by the diverse stable weather calls for the suitable emission control in a regional scale. Our study also shows that the simulation accuracy during stable weather needs to be improved in future studies.
1. The multi-stage analysis of air pollution events during stable weather helps to better understand the formation of air pollution.
2. The regional transport of air pollutants in pre-stagnation stage was proved to be fundamental to air pollution episodes by the retention effects.
3. Probing the external and local contributions to air pollution during stable weather provides rationales to make air pollution control strategies.
In recent years, air pollution under stable weather conditions have been paid more and more attention (Shu, et al., 2017; Xiang, et al., 2019) for its adverse health and economic impacts (Zhang, et al., 2020a). The meteorological conditions in local and regional scale play an essential role in the day-to-day variation and the long-term trend of air quality. Many studies have shown that stable weather prevents the development of vertical air movement and the dilution of pollutants in the vertical direction (Zhu and Lu, 2008; Chen, et al., 2016) from causing heavy air pollution. Generally, during stable weather, the wind speed is low, and the dynamic and thermal characteristics of the lower atmosphere are stable. In China, stable weather often occurs in autumn and winter when the temperature is low. The contribution of stable weather to air pollution has been a wide concern (Daneshpajooh and Azoji, 2020; Peng, et al., 2021a). Since 2013, the annual average concentration of PM2.5 in China has decreased year by year (Hou, et al., 2019), but heavy pollution cases in the Yangtze River Delta (YRD) region are still frequent (Chen, et al., 2019), and these pollution events were strongly affected by weather conditions (Zhang, et al., 2019). For the YRD region, stable weather is one of the most important reasons for heavy pollution of PM2.5. For example, Yu, et al. (2021) studied a case of heavy pollution in Zhejiang Province in the southern YRD in 2013, which was caused by the combined effect of large-scale circulation (e.g., the weakening of the East Asian Trough) and local weather conditions [e.g., low wind speed and planetary boundary layer height (PBLH)]. In addition, under special weather conditions, the aerosol–boundary layer interaction can amplify the haze regional transport, and the transport distance can reach more than 1,000 km (Huang, et al., 2020). Meteorological conditions and pollutant emission reduction are equally important for air pollution prevention, and an important evidence was that heavy pollution events could not be avoided even under the condition that the pollutant emissions were greatly reduced during the COVID-19 lockdown (Wang, et al., 2020a).
Urban air pollution during stable weather in China has been widely studied in recent years. Beijing was often polluted due to stable weather, and the stable weather index calculated by Zhang, et al. (2017) was closely related to PM2.5, which can quantify the contribution of local emissions and meteorological conditions to PM2.5 pollution. In Shanghai, PM2.5 and O3 showed that regional transport from north China was an important factor for the stable weather in the region (Li, et al., 2019; Zhang, et al., 2020b). However, due to substantial and complex local emission sources (industry, agriculture, traffic, etc.), the contribution of local pollution cannot be ignored (Yu, et al., 2021). Autumn and winter were the seasons of frequent stable weather in Guanzhong area, which made it difficult for pollutants to be diluted, forming a heavy haze by local emission (Hu, et al., 2020). A study in Ningbo found that the dominant components of PM2.5 during stable weather under different meteorological conditions were different, which provides a new idea for stable weather pollution control in different regions (Zhang, et al., 2020c).
The model simulation based on observation data could help analyze the processes of urban air pollution during stable weather. The principal component analysis in T-mode (PCT) was often used in weather classification. A study based on PCT in Chengdu showed the characteristics of two typical heavy pollution synoptic types, quantitatively calculating the potential contribution of the PM2.5 concentration during stable weather (Zhang, et al., 2020d). The Weather Research and Forecast model (WRF) has been proved to capture mesoscale meteorological characteristics (Zhang, et al., 2012; Businger, et al., 2015; Li and Chen, 2017). A study based on the WRF-chem model in Shanghai showed that anthropogenic emission regional transport and meteorological condition during stable weather contributed 32.2% and 17.2% to PM2.5, respectively (Chang, et al., 2016). A similar study in Beijing found that meteorological factors accounted for approximately 51% of PM2.5 during stable weather in winter (Xu, et al., 2020a). The Community Multiscale Air Quality (CMAQ) driven by the WRF (WRF-CMAQ) has been widely used in the assessment of atmospheric pollutants such as O3 and PM2.5 (Fann and FulcherK Baker, 2013; Baker JKelly, 2014; Zawacki, et al., 2018), and it is advantageous to calculate the contribution of local emissions or regional transport. A study in Chengdu based on the WRF-CMAQ showed that automobile emission (29%), dust (26%), and domestic pollution (24%) were the main sources of the total PM2.5 during stable weather (Xu and Xue, 2020b). There are other models to study meteorology and air quality, such as the Computational Fluid Dynamics (CFD) (Tominaga and Stathopoulos, 2013; Yin, et al., 2019), the WRF-CHIMERE (Dumka, et al., 2021), the Artificial Neural Network (ANN) (Feng, et al., 2015). Although there were a lot of studies on the impact of stable weather on air pollution (Cheng, et al., 2015; Chen, et al., 2018; Dong and Li, 2018), few elaborated the multi-phase evolution processes of air pollution during stable weather in detail (Cai, et al., 2020).
Shanghai, located in front of the YRD, is frequently affected by regional and cross-regional transport (Chen, et al., 2020). As a megacity with a resident population of 24.87 million (by 2021), local emissions are also important, leading to the complexity in the formation mechanism of air pollution. Stable conditions such as the low PBLH and the air flow from the polluted area are important factors for the formation of air pollution in the area. Based on the long-term observation data and the WRF-CMAQ model, this study aimed to analyze the detailed processes of the heavy air pollution events during stable weather taking megacity Shanghai as an example, including the estimate of the contribution of regional transport and local emissions to air pollution. Two stable weather cases in February and September of 2017 were selected. Specifically, we divided the pollution events into four stages, which helps us understand the evolution process and the source contribution for PM2.5, and provide a reference for accurate pollution control.
In this study, we used the WRF-CMAQ (www.cmascenter.org/cmaq) to simulate the meteorology and air quality. In general, the grid ratio between inner and outer domains in the WRF model is always 3 or 4 to avoid the numerical cumulative error in the downscaling process (Cheng, et al., 2019; Yan, et al., 2020). The WRF model was in a nested operation, and the resolutions of the three horizontal regions are 81 km, 27 km, 9 km, 3 km, and 1 km, respectively. With the accuracy guaranteed by simulation, the CMAQ_v5.0.2 model was in a nested operation, and the resolution of the three horizontal regions are 81 km, 9 km, and 1 km, respectively, which can reduce a lot of tedious work. This study area focused on the third domain, which covered the whole Shanghai area and a part of the YRD downstream area (Figure 1). The coverage ranged from (31.9729°N, 120.6536°E) to (30.4067°N, 122.5857°E), and the horizontal grid unit is 1 km × 1 km (155 × 143 grid points). Time-varying chemical lateral boundary conditions were derived from the 108-km-resolution hemispheric WRF-CMAQ (Mathur, et al., 2017) simulation for the 1990–2010 period (Xing, et al., 2015). The meteorological field used to couple the CMAQ model was provided by the WRF_v3.9 (Skamarock, et al., 2008). The global atmospheric reanalysis data provided by the National Center for Environmental Prediction (NCEP) were used for the initial and boundary data of the model, whose spatial resolution was 1° × 1° and temporal resolution was 6 h. The input data of topographic materials and underlying surface can be divided into three parts: the initial data of the WRF model were used in areas outside Jiangsu, Zhejiang, and Shanghai, which were the underlying surface data provided by United States Geological Survey (USGS); the land use type data of 2000 Landsat TM image interpretation were used in Jiangsu, Zhejiang, and Shanghai; and the land use type data of 2015 were used in China. The meteorological chemical interface program (mcip4.3) generated the CMAQ compatible meteorological fields (Wong, et al., 2012). In the vertical direction, the meteorological field was resolved into 29 layers, from the surface to about 18 km above the sea level. In this study, the air quality field output is 15 layers, and the height extended from the surface to about 5 km above the sea level. The simulation period was February and September of 2017, and all meteorological fields and air quality simulation had a 2-day spin-up period before starting the simulation for the sake of reducing the impact of the initial field. The chemical mechanism used in this study was CB05 (Yarwood, et al., 2005) and AERO6 (Carlton, et al., 2010) issued by the United States Environmental Protection Agency. The specific parameterization schemes for the main physicochemical processes involved in WRF and CMAQ are shown in Supplementary Table S3.
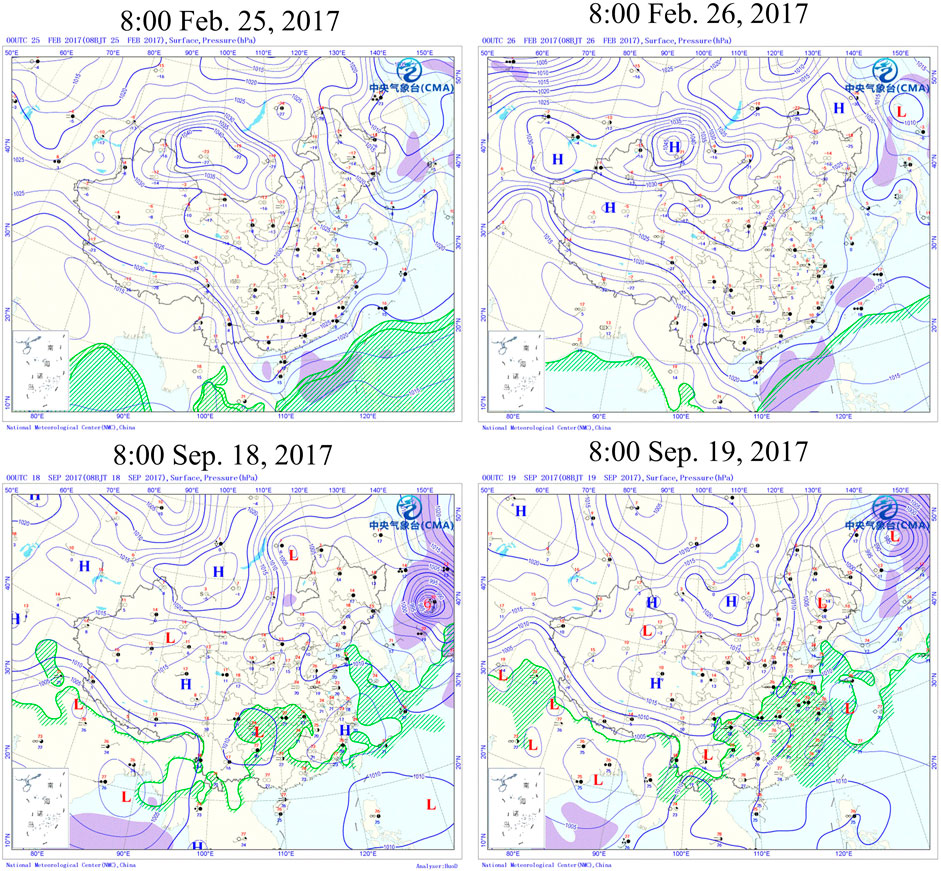
FIGURE 1. CMAQ model nested simulation domains (domain 1: 81 km × 81 km, domain 2: 9 km × 9 km, domain 3: 1 km × 1 km) and distribution map of Shanghai meteorological stations (triangles) and air quality stations (pentagrams).
The Multi-resolution Emission Inventory for China (MEIC) (Squires, et al., 2020; Chen, et al., 2021a) was used for domain 1 and domain 2. The emission data from a previous study (An, et al., 2021) and some survey data from Shanghai Environmental Monitoring Center were combined for domain 3. The total emissions of SO2, NOx, CO, VOCs, PM10, PM2.5, and NH3 in the Shanghai region in 2017 were 32.8, 381.8, 980.2, 209.0, 377.0, 160.8, and 52.2 Gg, respectively. VOCs and CO emissions were mainly from boilers, which accounted for 42.4% of VOCs and 74.1% of CO. The VOCs of biogenic emissions were 5,905.9 Mg generated by MEGAN (Wang, et al., 2021), whose oxidation could significantly contribute to SOA in PM at night. Mobile sources dominated NOx emissions, contributing 52.0% of the total. SO2 emissions were mainly from ship sources, making up 55.7% of the total. Road and construction dust sources accounted for 63.8 and 46.4% of PM10 and PM2.5 emissions, respectively.
The particles in the atmosphere in a certain area can decrease through dry and wet deposition, or can be removed out of the area through atmospheric movement. The “retention effect” of PM2.5 in this study referred to PM2.5 in the atmosphere of a certain region, which can hardly move due to the almost stagnation of atmospheric horizontal and vertical motion during stable weather.
In this study, all PM2.5 already in Shanghai before the stable period (period I) was defined as the retention part of PM2.5, and newly emerged PM2.5 from local emissions and regional transport during stable weather (period II) was defined as new PM2.5. Thus, PM2.5 can be divided into four types: PM2.5 related to regional transport in period I [RT (retention)] and in period II [RT (new)], and PM2.5 related to local emissions in period I [LE (retention)] and in period II [LE (new)].
The switch method of emission inventory was used to obtain the respective contribution proportion and persistence time of local emissions and regional transport (Feng, et al., 2019). The absolute contribution of the pollution source can be obtained by the difference of two simulation schemes that can avoid systematic error and improve the reliability of the results (Stefanik, et al., 2020).
We designed 6 following simulation schemes shown in Supplementary Table S1 to obtain the contributions of LE (new), LE (retention), RT (new), and RT (retention), respectively.
LE (new) = scheme 1 - scheme 3 (1). E (retention) = scheme 1 - scheme 2 (2) RT (new) = scheme 4 - scheme 6 (3). RT (retention) = scheme 4 - scheme 5 (4)
The meteorological and air quality observation data in this study were provided by the Shanghai Meteorological Bureau and Shanghai Environmental Monitoring Center, both of which were in an hourly resolution. The meteorological data included 11 national monitoring stations in Shanghai, and the air quality observation data included 10 national monitoring stations and 45 municipal monitoring stations in Shanghai. The geographical distribution information of the meteorological and the air quality observation stations is shown in Figure 1. All observation stations are uniformly distributed in urban and suburban Shanghai. The vertical meteorological sounding data in this study were downloaded from the website of Wyoming University (http://weather.uwyo.edu/wyoming/). The components data of PM2.5 were from Pudong Environmental Monitoring Centre in the central urban area of Shanghai, and the mass concentration of PM2.5 was measured by an online particulate monitor (FH 62C14 series, Thermo Fisher Scientific Inc.). The study by Zhang, et al.(2020b) has a more detailed description of the measurement methods and instruments.
To determine the cases for analysis, we firstly chose the dates with the air quality index (IAQI) of PM2.5 greater than 100 (Feng, et al., 2013), and then the ground pressure fields every 6 h of each date were analyzed. The cases with sparse isobars, low surface wind speed, and temperature inversion were selected as stable weather candidates. The parameters of the obtained cases were further verified including daily average wind speed near the ground (10 m) < 3.2 m/s, daily average wind speed in the middle troposphere (500 hPa) < 13 m/s, and daily accumulated precipitation <1 mm (Horton, et al., 2014; Zhang, et al., 2016). After quantitative screening, two cases closest to the constraint conditions were selected from different seasons in 2017 as typical cases (Table 1).

TABLE 1. Descriptions of stable weather cases.
Two individual cases were representative of typical stable weather. The February case represented typical winter weather situation. Most parts of China (except for the northeast) were under the control of the cold high pressure, with a previous cold front already pressing south to the coastal areas of southern China and a supplementary cold front in Mongolia. During this period, Shanghai was located in the mean pressure field of the continental cold high pressure. In contrast, September is the seasonal transition month when cold and warm air confront each other. There was a cold high pressure in Mongolia, while Shanghai was located near the subtropical high pressure.
The simulated meteorological variables (temperature and wind speed) and the concentrations of air pollutants including SO2, NOx, PM2.5, and O3 in 2017 were validated by the observation data in Shanghai. As shown in Figure 2, the simulation results of the vertical meteorological conditions (temperature and relative humidity) correlated well with the sounding data (R2 ranged from 0.51 to 0.97) (Supplementary Figure S1). The statistics of validations are listed in Supplementary Table S2 in the supporting information including the root mean square error (RMSE), the mean fractional bias (MFB), and the mean fractional error (MFE) (Yu, et al., 2019). The scattering plot is shown in Supplementary Figure S2. Most of the indicators were within the ideal range (Supplementary Table S2). The simulated values of temperature and NOx were closer to the observed data, which agreed with the results of Liu and Wang (2020a) and Liu and Wang (2020b). However the simulated average wind speed was about 35% higher, which was a problem that most WRF simulations of megacities meteorological field have encountered (Prieto-Herraez, et al., 2021) and were related to urban land use types and parameterization schemes. The simulated values of PM2.5 were generally lower than the observed values, but the temporal variation was in good agreement (Figure 2). For SO2, the average simulated values were close to the observation value, and the error was about 4%. The inventories had realistic statistics on the total emission of SO2, but the variation trend was not well captured. The ozone was underestimated by about 36%, which was likely due to the lower simulated radiation intensity and temperature.
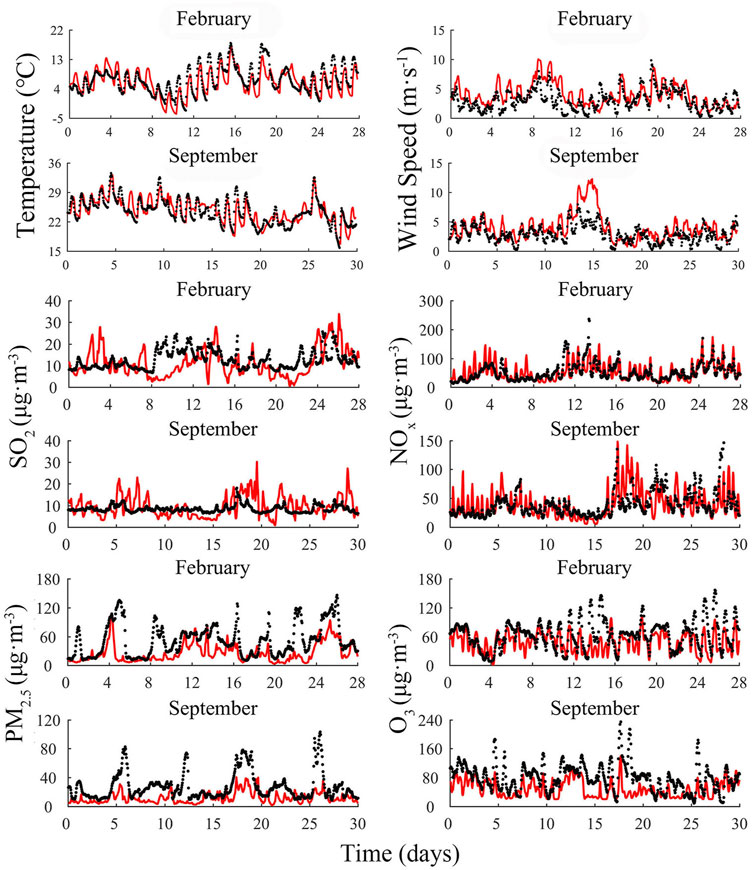
FIGURE 2. Meteorological parameters (temperature and wind speed) and air pollutants (SO2, NOx, PM2.5, and O3) comparison of observed (black) and simulated (red) in February and September in 2017.
The sea-level pressure fields, surface wind observation data, and vertical sounding data were used to describe the typical meteorological conditions during the selected two cases of stable weather.
We studied the regional synoptic pattern in the YRD to obtain the meteorological characteristics in Shanghai. In autumn and winter, the lower troposphere in the YRD is mostly controlled by the uniform pressure field or located at the top of the high pressure (Cheng, et al., 2020; Han and Ma, 2020; Peng, et al., 2021b). These weather conditions are conducive to the accumulation of PM2.5, which is similar to this study. At the 500 hPa level of the troposphere, the general circulation in China was zonal flow, the meridional wind was weak, and the upper air wind speed was small (Supplementary Figure S3). When the two pollution cases occurred, the isobaric distribution of tropospheric 850 hPa showed that the YRD was controlled by a uniform pressure field or a high pressure (Supplementary Figure S4). The surface isobars in YRD were sparse and the wind speed was weak (Figure 3). After the air mass flowed southeastward, a wide range of weak high-pressure centers were formed near the YRD. The above weather situation of different altitude together hindered the vertical and horizontal atmosphere movement, which was a typical meteorological condition in a large scale for long duration, leading to severe PM2.5 pollution. From February 27–28 and September 20–21, the trough moved eastward and brought marine flow, which contributed to pollution dilution.
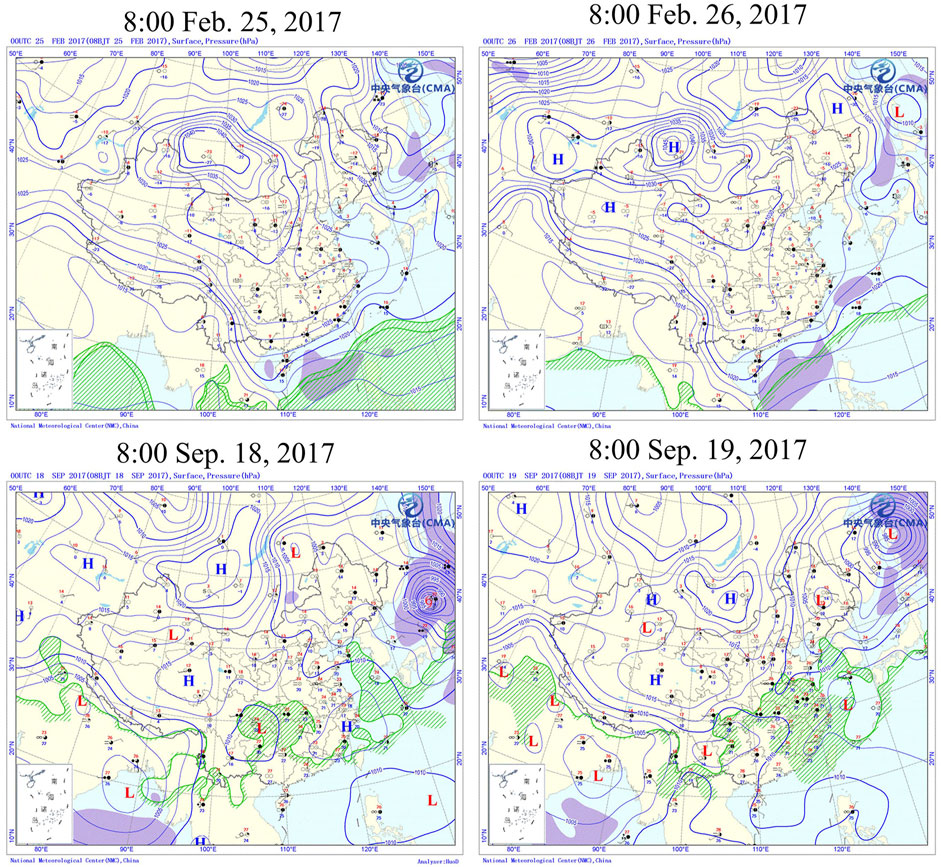
FIGURE 3. Ground map of typical time in February and September cases (http://www.cma.gov.cn/).
As shown in Supplementary Figure S5, for the winter and autumn cases, the wind speed in the YRD cities near Shanghai (a–f) was generally low during the period of stable weather, and the average wind speed in Shanghai (g–j) was even lower. During the nighttime in the period of stable weather, the average wind speed was 0–1 m/s, leading to the fact that air pollutants stagnated in the atmosphere and could not be transported further, while during the daytime in the period of stable weather, the average wind speed was 2–3 m/s, which provided the flowability of more polluted air mass transported into Shanghai. After stable weather, the southerly wind with the average speed back to the initial level was conducive to the dilution of pollutants.
Differently, within 1–2 days before stable weather, the YRD was controlled by the front of a high-pressure system in the February case, and by the typhoon periphery in the September case, although the wind direction in the YRD cities was generally north wind for both cases. However, the wind speed in the winter case reached around 5 m/s, while that in the autumn case was larger (7 m/s). During stable weather, on the ground and at the height of 850 hPa level, the wind speed was 1.6 m/s and 8.0 m/s in the winter case, and 2.7 m/s and 5.3 m/s in the autumn case, respectively. The wind speed at 850 hPa was lower in the autumn case, while the wind direction at 850 hPa in eastern China was not consistent, forming a barrier around the YRD, which was adverse to regional transport.
Figure 4 shows that temperature inversion was observed every day at local time 8:00 in two cases, even at local time 20:00 on September 18. The temperature inversion generally occurred at about 200 m above the ground except September 19 (about 500 m), which was not conducive to the vertical dilution and the transport of pollutants. It was worth noting that the slope between relative humidity and height at local time 08:00 was steeper than 20:00 within the inversion layer due to the evaporation of the ground surface, which was one evidence of vertical stable atmosphere in the boundary layer at night.
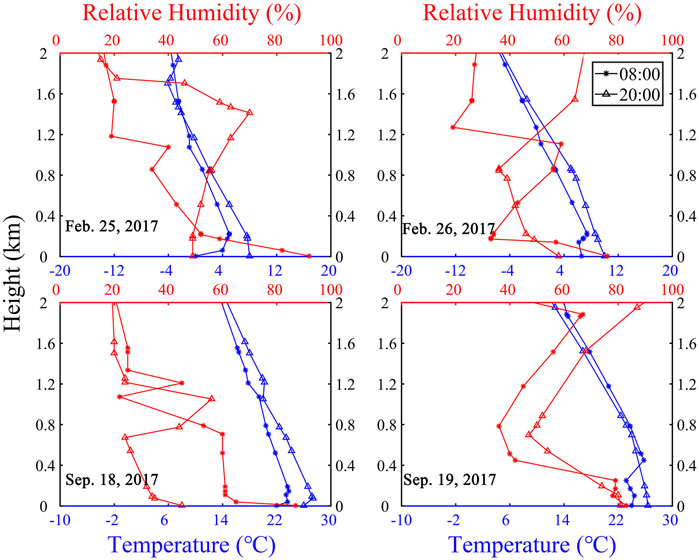
FIGURE 4. Vertical temperature and relative humidity at Baoshan station.
During the two cases in stable weather, PM2.5 broke the national air quality standard. As shown in Figure 5A, the peak PM2.5 concentration in Shanghai reached 162.3 μg/m3 and 83.2 μg/m3 in the case of February and September, respectively. The PM2.5 concentration remained at a relatively high level during the nighttime, but changed substantially during the daytime of stable weather. As shown in Figure 5B, the components of PM2.5 showed similar characteristics. During the two stable episodes, the sulfate concentration varied most slightly, but the nitrate concentration varied most dramatically during the two stable periods. The rise of nitrate concentration was the main reason for the peak PM2.5 concentration. The average values of the nitrate concentration during the two episodes reached 40.1 μg/m3 and 12.2 μg/m3, accounting for 41% and 19% of the total PM2.5, respectively. In addition, the average concentrations of sulfate and ammonium were 14.0 μg/m3 and 17.3 μg/m3, accounting for 14% and 18% of the total PM2.5 for the February case, and 12.8 μg/m3 and 7.7 μg/m3, accounting for 19% and 12% for the September case, respectively.
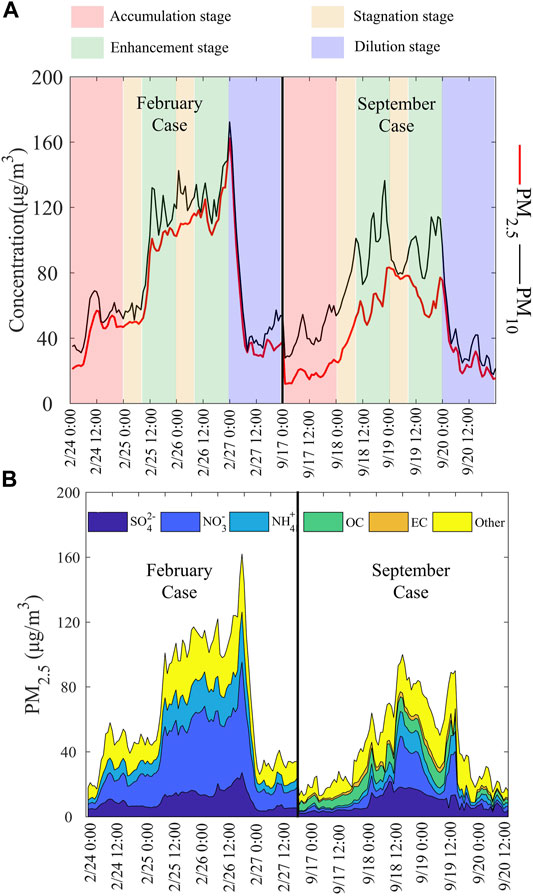
FIGURE 5. Concentration of particulate matter in Shanghai (A) and the components of PM2.5 in Pudong Monitoring Station (B) during two stable cases in 2017.
Figure 6 shows the wind and PM2. 5 concentration field in the Shanghai region, partially explaining the variation pattern of PM2.5 characteristics during day and night. The PM2.5 concentration was higher in the north and west than the south and east of Shanghai. When the wind speed was less than 1 m/s during the stagnation stage, the transport of PM2.5 was hindered. When the wind speed was 2–3 m/s, the regional PM2.5 from the north and west position was transported into Shanghai, and the contrary wind direction along the seashore was disadvantageous to the dilution of PM2.5.
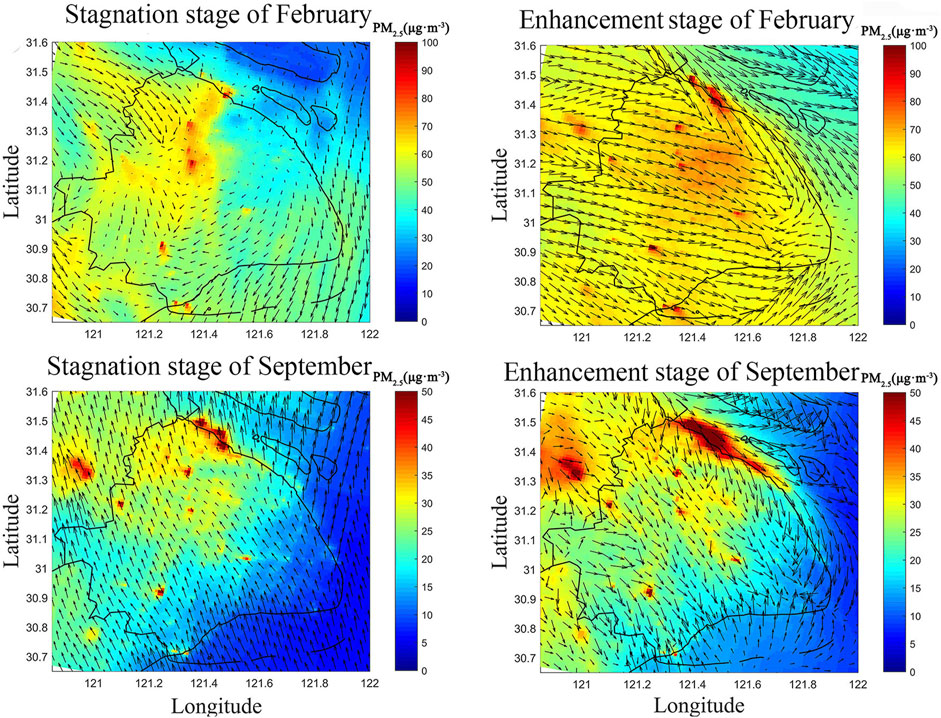
FIGURE 6. Wind field of Shanghai during stable weather in February and September.
Based on the foregoing analysis, the PM2.5 pollution episodes can be divided into the following four stages: the accumulation stage, the stagnation stage, the enhancement stage, and the dilution stage. In detail, the accumulation stage was the period before stable weather when the concentration of PM2.5 was at a relatively low level. However, the higher wind speed at this stage was conducive to the regional transport of pollutants. The stagnation stage was in the wee hours (0:00–8:00) of stable weather, when the temperature inversion (Figure 4) and the small wind speed (Figure 6) occurred, which resulted in the PM2.5 concentration having a flat trend. The enhancement stage was the remaining hours (8:00–24:00) during stable weather, when the temperature inversion disappeared, the PBLH increased, and the solar radiation led to the enhancement of vertical and horizontal convection. The wind speed was larger than that during the stagnation stage, which provided favorable conditions for regional transport. PM2.5 during the enhancement stage experienced a substantial rise from 14:00 to 23:00 in the winter case and 16:00 to 23:00 in the autumn case. During the dilution stage, the stable meteorological conditions disappeared, and the PM2.5 concentration declined rapidly within 2–3 h.
As shown in Figure 5, the components of PM2.5 showed different characteristics under different stages. During the accumulation stage, there were small differences in concentration among PM2.5 components, and the nitrate concentrations were in a relatively low percentage (30% for the February case and 9% for the September case). During the stagnation stage, the characteristics of PM2.5 components were constant and similar to the previous moment. Thus, for the February case, the characteristics of PM2.5 components during the stagnation stage in February 25 were similar to the accumulation stage, but the characteristics of PM2.5 components during the stagnation stage in February 26 were similar to the enhancement stage. During the enhancement stage, nitrate dominated in PM2.5 and the concentrations were 44.7 μg/m3 and 13.7 μg/m3, which accounted for 41% and 19% of total PM2.5 for the February and September case, respectively. After the stable period, the proportions of PM2.5 components were similar to the accumulation stage (it may indicate that local emissions sources were relatively stable), and the percentages of nitrate were 33% and 13% for the February and September case, respectively.
It should be noted that the period during 0:00–8:00 was recognized as the stagnation stage rather than 20:00 to 8:00, because temperature inversion was not obvious at 20:00 (Figure 4), which did not meet the definition of stagnation stage. According to Figure 5, Figure 9, and previous research (Jing, et al., 2011; Liu, et al., 2019; Chen, et al., 2021b), the time from 8:00 to 24:00 was designated the enhancement stage, which guaranteed the accuracy of the definition of the stagnation stage.
The contributions of regional transport and local sources to the pollution episodes was estimated based on the method in Section 2.3. The vertical profile of local and external sources of PM2.5 concentrations is presented in Figure 7, and the analysis was conducted by stages.
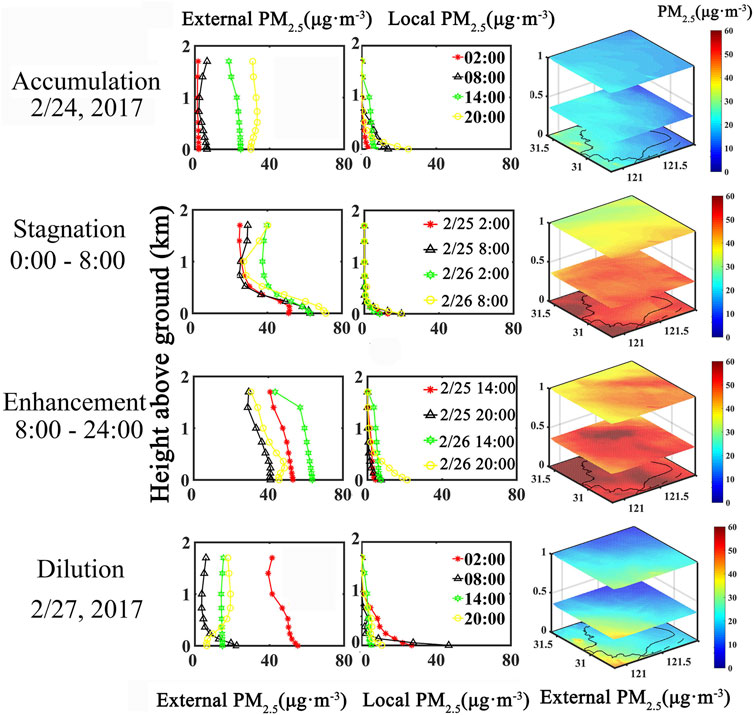
FIGURE 7. Simulated local and external PM2.5 vertical profiles and vertical spatial distribution in four different stages in February 24–27, 2017.
The accumulation stage was February 24 and September 17. As shown in Supplementary Figure S6 and Supplementary Figure S7 for the winter case, the absolute concentration of PM2.5 related to external sources on February 24 gradually increased over time in the atmosphere at different altitudes. For the autumn case, the wind direction and the wind speed were similar to those in the winter case, but there was typhoon in the East China Sea during September 14 to 17, whose cleaning effect blocked the accumulation of PM2.5 (Chang, et al., 2011; Liu, et al., 2018). At the surface level, the local and external sources accounted for 41.7% and 58.3% of PM2.5 in the winter case, respectively, while they accounted for 42.4% and 57.6% of PM2.5 in the autumn case, respectively.
The stagnation stage included 0:00–8:00 of February 25–26 and September 18–19. As shown in Figure 7, for the winter case, the PM2.5 concentration from local emissions and regional transport both gradually decreased from the surface to about 2 km altitude. For the autumn case in Figure 8, only the PM2.5 concentration from local emissions showed a similar trend to that for the winter case. In the winter case, the local (external) PM2.5 concentration was 14.1 μg/m3 (53.4 μg/m3), accounting for 20.9% (79.1%) of the total PM2.5. In the autumn case, the local (external) PM2.5 concentration was 15.6 μg/m3 (5.1 μg/m3), contributing 75.4% (24.6%) to the total PM2.5. The proportion of PM2.5 concentration related to regional transport in the winter case was higher than that in the autumn case. On the one hand, the wind speed was lower in the winter case, resulting in a worse atmospheric diffusion condition. On the other hand, the typhoon in the autumn case blocked the accumulation of PM2.5 during the stage to weaken the air pollution level in this episode.
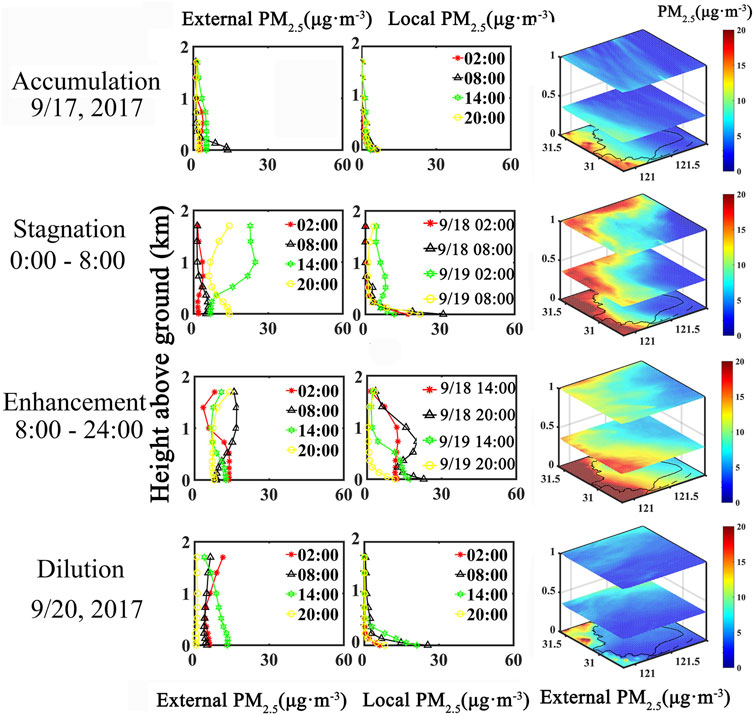
FIGURE 8. Simulated local and external PM2.5 vertical profiles and vertical spatial distribution in four different stages in September 17–20, 2017.
The enhancement stage covered 8:00–24:00 of February 25–26 and September 18–19. As shown in Figures 7, 8, the PM2.5 concentrations from local emissions and regional transport both changed little with height, which was different from the stagnation stage. This result showed that the vertical convection was well mixed during the enhancement stage. In the winter case, the local PM2.5 concentration was 9.2 μg/m3 and accounted for 14.6% of the total PM2.5, while the external PM2.5 concentration was 53.6 μg/m3 and accounted for 85.4% of the total PM2.5. In contrast, in the autumn case, the local PM2.5 concentration was 18.7 μg/m3 and accounted for 60.6% of the total PM2.5, while the external PM2.5 concentration was 12.2 μg/m3 and accounted for 39.4% of the total PM2.5. The minor proportion (39.4%) of external PM2.5 during the enhancement stage came from the weaker northwest wind speed (∼<3 m/s) in the troposphere of 850 hPa (Supplementary Figure S3).
The reasons for the lower peak value of the PM2.5 concentration in the autumn case were the larger wind speed on the ground, the typhoon before stable weather, and the messy wind direction in the troposphere of 850 hPa, which provided better dilution conditions, blocking up of PM2.5 accumulation, and less regional transport, respectively.
The dilution stage was February 27 and September 20. After stable weather, the external PM2.5 concentration at the surface level was lower than that in the upper air, while the local PM2.5 concentration showed a reversed pattern. When the pollution episodes ended, the vertical distribution of the contribution of local and external sources switched to a normal result. In the winter case, the local and external PM2.5 concentrations were 18.4 μg/m3 and 26.3 μg/m3, accounting for 41.2% and 58.8% of the total PM2.5, respectively, while they were 10.2 μg/m3 and 3.5 μg/m3, accounting for 74.5% and 25.5% in the autumn case, respectively.
The “retention effect” was caused by the trapped air pollutants under stable weather conditions. As shown in Figure 9A, during the stagnation stage of February 25, the retention part dominated the PM2.5 pollution by more than 70%, in which the external PM2.5 was the main source of the total PM2.5 (52.4%), whereas the local PM2.5 only accounted for 18.8%, while during the enhancement stage of February 25, the vast majority of total PM2.5 was attributed to the RT (new) with a contribution of 86.3%, but to a much lesser extent, the LE (new) only accounted for 10.6%. The higher wind speed and the northwesterly wind during the enhancement stage facilitated the transport of PM2.5 from the inland YRD to Shanghai, resulting in the predominance of newly transported PM2.5. At the same time, the wind direction at the seaside was disordered, forming a cyclone, and hence a rather weak outflow of highly polluted air mass over Shanghai.
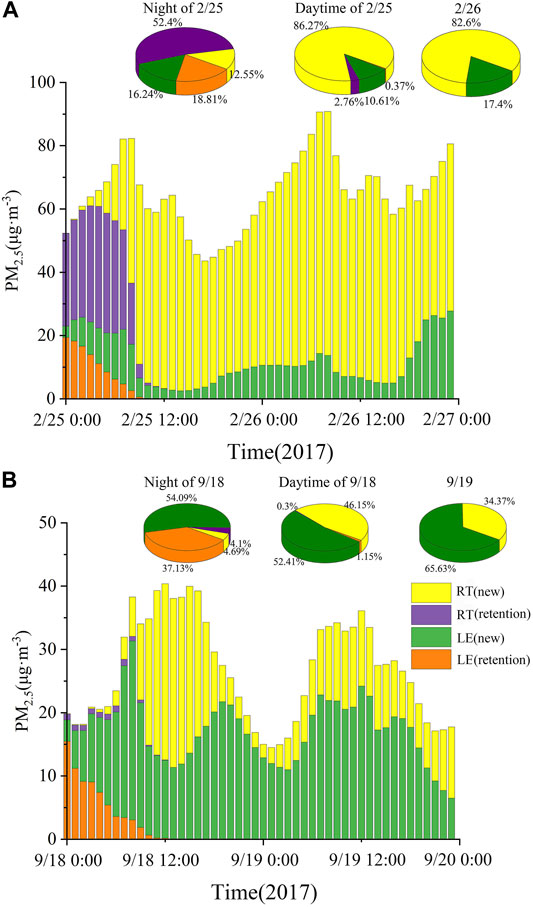
FIGURE 9. The simulated PM2.5 and pie chart of retention PM2.5 and new PM2.5 in Shanghai in February (A) and September (B) 2017 (RT: Regional Transport, LE: Local Emission.
However, as shown in Figure 9B, during the stagnation stage of September 18, the local emissions part dominated the PM2.5 pollution by more than 90%, in which the retention PM2.5 was the main source of the total PM2.5 (54.1%), whereas the new PM2.5 only accounted for 37.1%. The minor proportion (8.2%) of RT compared to the winter case was caused by the blocking-up during the accumulation stage due to the typhoon. During the enhancement stage of September 18, the total PM2.5 was mainly attributed to the LE (new) with a contribution of 52.4%, but to a lesser extent, the RT (new) only accounted for 46.2%. Compared with the winter case during the enhancement stage, the wind speed was weaker at the 850 hPa level, which resulted in the RT (new) accounting for a smaller portion of PM2.5.
To sum up, the PM2.5 concentration was dominated by regional transport of the winter case, while local emission was the main cause of the autumn case.
The general process of the two selected PM2.5 pollution episodes in Shanghai, a coastal city, can be summarized in Figure 10, and the whole pollution process can be divided into four stages. The accumulation stage is the period before stable weather to provide the background of PM2.5 for the following stable stage. If the accumulation stage is blocked, the pollution level will be effectively reduced during the stable period. The stagnation stage is the nighttime during stable weather, when temperature inversion and a fairly small wind speed occur, making the retention PM2.5 highly stable, and the new air pollutants cannot be transported inside at the same time. The enhancement stage following the stagnation stage was key to deciding the air pollution level, but diverse with different stable weather types. The dilution stage comes after the stable stage, during which the PM2.5 concentration will decline rapidly. For the prevention and control of heavy particulate pollution, the integration of local and regional emissions in the YRD considering the diversity of stable weather was of great importance (Wang, et al., 2020b).
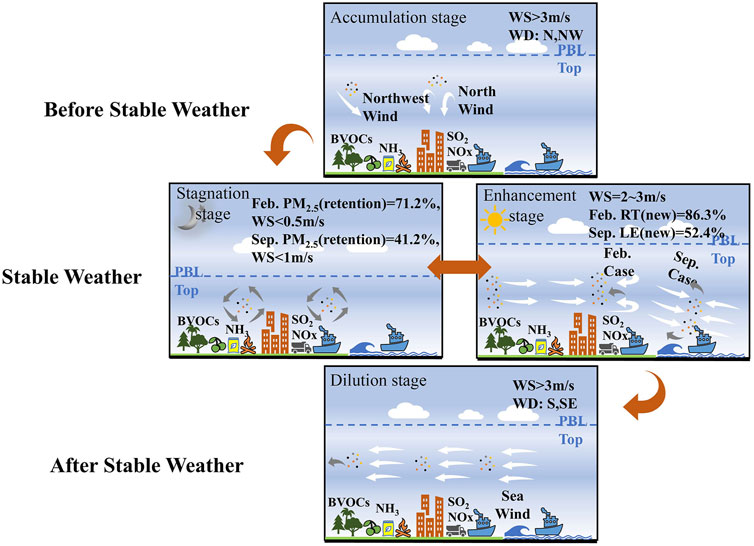
FIGURE 10. The diagrammatic sketch of PM2.5 pollution process in stable weather.
It is noted that the simulation accuracy during stable weather is still challenging. As provided in Section 2.5, the monthly simulation accuracy evaluation was acceptable on the whole, but with a larger underestimation during the stable period (Figure 2). Thus, there must be some uncertainties raised in the retention effect results by the large underprediction in the high PM2.5 in this study. We evaluated the simulation accuracy of the main components of PM2.5 in Supplementary Figure S8 to explain the underestimation in some degree. As shown in Supplementary Figure S8, according to the comparison of component observation data during two episodes, SO42- was close to the observation data, but there was a large underestimation in NO3− and some other components of PM2.5. The simulation of NH4+ was better in the September episode than that in the January episode. In September, the underestimation in nitrate, organic carbon, and elemental carbon concentrations was 5.4 μg/m3, 5.0 μg/m3, and 2.1 μg/m3, accounting for 22%, 20%, and 9% of the PM2.5 underestimation, respectively. However, in the January episode, the underestimation of NO3− and NH4+ reached 14.8 μg/m3 and 9.1 μg/m3, respectively, accounting for the major part of underestimated PM2.5. It indicated that the discrepancy between the simulated and observed components varied with the weather conditions. The underestimated key components of PM2.5 in numerical simulations of stable weather need further attention in the future.
In this study, two air pollution cases in autumn and winter of 2017 were selected to probe the evolution process of heavy air pollution during stable weather, focusing on the contributions of regional transport and local emissions to PM2.5 pollution. According to the concentration of PM2.5 and meteorological conditions, we defined the development of pollution episodes into four stages: accumulation stage, stagnation stage, enhancement stage, and dilution stage.
The accumulation stage before stable weather provided the background of heavy PM2.5 pollution, whose northwest wind was instrumental in regional transport. The “retention effects” led retention PM2.5 to a dominant position during the stagnation stage, which accounted for 71.2% and 41.2% of total PM2.5 in the winter and autumn case, respectively. The enhancement stage was conducive to regional transport, but not to the dilution of PM2.5, which made RT (new) important during the enhancement stage. During the enhancement stage, newly transported PM2.5 from regional transport accounted for 86.3% and 46.2% for the winter and autumn cases, respectively. The dilution stage was after stable weather when south or east clearer sea wind was instrumental in PM2.5 dilution, and hence the PM2.5 concentration reduced rapidly.
The PM2.5 pollution in Shanghai was mainly from local emission in the autumn case but from regional transport in the winter case, accounting for 63.0% and 81.3%, respectively. The blocked accumulation stage by a typhoon and the weaker wind speed in the troposphere could reduce the pollution level during stable weather. Our results suggest that promoting air pollution control in the regional scale is very significant in the prevention and control of heavy particulate pollution caused by stable weather. Further studying the impact of meteorological factors under stable weather versus anthropogenic emissions as well as the precision of simulation is necessary in the near future.
The original contributions presented in the study are included in the article/Supplementary Material, Further inquiries can be directed to the corresponding author.
BH and YZ designed all simulation schemes, and BH wrote the first draft of the manuscript. BH, YZ, GY, and JM reviewed and modified the manuscript. XZ and ZH provided the standard of stable weather and selected the cases of stable weather. QW and QL provided the emission inventory of Shanghai. YZ was in charge of project administration. All authors contributed to manuscript revision, and read and approved the submitted version.
This work was supported by the Major Program of Shanghai Committee of Science and Technology, China (19DZ1205009), the National Natural Science Foundation of China (42077195), and the Program of Pudong Committee of Science and Technology, Shanghai (PKC2020-C004).
The authors declare that the research was conducted in the absence of any commercial or financial relationships that could be construed as a potential conflict of interest.
All claims expressed in this article are solely those of the authors and do not necessarily represent those of their affiliated organizations, or those of the publisher, the editors, and the reviewers. Any product that may be evaluated in this article, or claim that may be made by its manufacturer, is not guaranteed or endorsed by the publisher.
The Supplementary Material for this article can be found online at: https://www.frontiersin.org/articles/10.3389/fenvs.2022.858685/full#supplementary-material
An, J. Y., Huang, Y. W., Huang, C., Wang, X., Yan, R. S., Wang, Q., et al. (2021). Emission Inventory of Air Pollutants and Chemical Speciation for Specific Anthropogenic Sources Based on Local Measurements in the Yangtze River Delta Region, China. Atmos. Chem. Phys. 21 (3), 2003–2025. doi:10.5194/acp-21-2003-2021
BakerJKelly, K. R. T. (2014). Single Source Impacts Estimated with Photochemical Model Source Sensitivity and Apportionment Approaches. Atmos. Environ. 96, 266–274. doi:10.1016/j.atmosenv.2014.07.042
Businger, S., Huff, R., Pattantyus, A., Horton, K., Sutton, A. J. T. Elias., et al. (2015). Observing and Forecasting Vog Dispersion from Kilauea Volcano, Hawaii. Bull. Am. Meteorol. Soc. 96 (10), 1667–1686. doi:10.1175/bams-d-14-00150.1
Cai, Z-y., Yang, X., Han, S-q., and YaoJ-l Liu, Q. (2020). Transport Characteristics of Air Pollution in Tianjin Based on Weather Background. Huanjing Kexue 41 (11), 4855–4863. doi:10.13227/j.hjkx.202004252
Carlton, A. G., Bhave, P. V., Napelenok, S. L., Edney, E. D., Sarwar, G., Pinder, R. W., et al. (2010). Model Representation of Secondary Organic Aerosol in CMAQv4.7. Environ. Sci. Tech. 44 (22), 8553–8560. doi:10.1021/es100636q
Chang, L. T. C., Tsai, J. H., Lin, J. M., Huang, Y. S., and Chiang, H. L. (2011). Particulate Matter and Gaseous Pollutants during a Tropical Storm and Air Pollution Episode in Southern Taiwan. Atmos. Res. 99 (1), 67–79. doi:10.1016/j.atmosres.2010.09.002
Chen, C. Q., Huang, L., Shi, J. H., Zhou, Y., Wang, J., Yao, X. H., et al. (2021a). Atmospheric Outflow of Anthropogenic Iron and its Deposition to China Adjacent Seas. Sci. Total Environ., 750. doi:10.1016/j.scitotenv.2020.141302
Chen, H. M., Zhuang, B. L., Liu, J. N., Wang, T. J., Li, S., Xie, M., et al. (2019). Characteristics of Ozone and Particles in the Near-Surface Atmosphere in the Urban Area of the Yangtze River Delta, China. Atmos. Chem. Phys. 19 (7), 4153–4175. doi:10.5194/acp-19-4153-2019
Chen, L., Ma, J., and Xu, F. G. J. (2016). Analysis of a Typical Air Pollution Event in Shanghai. Meteorol. Monthly 42 (2), 203–212.
Chen, L., Zhou, G., Mao, Z., and Qu, Y. (2020). Variation Characteristics and Meteorological Impact Factors of Three Short-Time Severe Air Pollutions in Shanghai in 2017. Meteorol. Monthly 46 (5), 675–686.
Chen, T., Feng, X., Li, C., Wang, W., Song, W., and Wang, S. (2021b). Study on the Weather Conditions and Inversion Characteristics of Nine Sessions of Atmospheric Heavy Pollution in Chengdu in the winter from 2013 to 2018. J. Lanzhou Univ. Nat. Sci. 57 (1), 82.
Chen, Y. N., Zhu, Z. W., Luo, L., and Zhang, J. W. (2018). Severe Haze in Hangzhou in winter 2013/14 and Associated Meteorological Anomalies. Dyn. Atmospheres Oceans 81, 73–83. doi:10.1016/j.dynatmoce.2018.01.002
Cheng, J., Su, J. P., Cui, T., Li, X., Dong, X., Sun, F., et al. (2019). Dominant Role of Emission Reduction in PM2.5 Air Quality Improvement in Beijing during 2013-2017: a Model-Based Decomposition Analysis. Atmos. Chem. Phys. 19 (9), 6125–6146. doi:10.5194/acp-19-6125-2019
Cheng, N-l., Li, Y-t., Zhang, D-w., Nie, T., Qiu, Q-h., and Xu, W-s. (2015). Formation Mechanism of a Serious Pollution Event in January 2013 in Beijing. Huanjing Kexue 36 (4), 1154–1163.
Cheng, Y., Hou, X., Zhu, B., and Lu, W. (2020). The Meteorological Causes of a Heavy Pollution Process in BTH and YRD Area with Stable Weather Condition. Acta Scientiae Circumstantiae 40 (5), 1575–1586.
Daneshpajooh, N., and Azoji, M. A. (2020). PM Dispersion during Stable winter Episodes in Tehran and Effect of Governmental Emission Regulations. Atmos. Pollut. Res. 11 (8), 1316–1328. doi:10.1016/j.apr.2020.05.008
Dong, Z., Kong, H., and Li, H. (2018). Numerical Simulation and Transport Analysis of Three Heavy Air Pollution Processes in Henan Province in winter. Acta Scientiae Circumstantiae 38 (3), 1071–1079.
Dumka, U. C., Kaskaoutis, D. G., Verma, S., Ningombam, S. S., Kumar, S., and Ghosh, S. (2021). Silver Linings in the Dark Clouds of COVID-19: Improvement of Air Quality over India and Delhi Metropolitan Area from Measurements and WRF-CHIMERE Model Simulations. Atmos. Pollut. Res. 12 (2), 225–242. doi:10.1016/j.apr.2020.11.005
Fann, N., and FulcherK Baker, C. M. (2013). The Recent and Future Health Burden of Air Pollution Apportioned across US Sectors. Environ. Sci. Tech. 47 (8), 3580–3589. doi:10.1021/es304831q
Feng, J. L., Zhang, Y., Li, S. S., Mao, J. B., Patton, A. P., Zhou, Y. Y., et al. (2019). The Influence of Spatiality on Shipping Emissions, Air Quality and Potential Human Exposure in the Yangtze River Delta/Shanghai, China. Atmos. Chem. Phys. 19 (9), 6167–6183. doi:10.5194/acp-19-6167-2019
Feng, Q., Wu, S. J., Du, Y., Xue, H. P., Xiao, F., Ban, X., et al. (2013). Improving Neural Network Prediction Accuracy for PM10 Individual Air Quality Index Pollution Levels. Environ. Eng. Sci. 30 (12), 725–732. doi:10.1089/ees.2013.0164
Feng, X., Li, Q., Zhu, Y. J., Hou, J. X., JinJ, L. Y., and Wang, J. (2015). Artificial Neural Networks Forecasting of PM2.5 Pollution Using Air Mass Trajectory Based Geographic Model and Wavelet Transformation. Atmos. Environ. 107, 118–128. doi:10.1016/j.atmosenv.2015.02.030
Han, B., and Ma, X. (2020). Analysis of the Severe Haze Events in the Yangtze River Delta during the winter of 2014-2018 and the Impact of the Weather Situation on Severe Haze. Acta Scientiae Circumstantiae 40 (7), 2333–2345.
Horton, D. E., Skinner, C. B., Singh, D., and Diffenbaugh, N. S. (2014). Occurrence and Persistence of Future Atmospheric Stagnation Events. Nat. Clim. Change 4 (8), 698–703. doi:10.1038/nclimate2272
Hou, X. W., Zhu, B., and Lu, K. R. K. W. (2019). Inter-annual Variability in fine Particulate Matter Pollution over China during 2013-2018: Role of Meteorology. Atmos. Environ. 214. doi:10.1016/j.atmosenv.2019.116842
Hu, L., Cheng, L., Lin, Y., Hu, S., and He, X. (2020). A Conceptual Model of Regional Pollution and Meteorological Conditions in Guanzhong Region. Arid Zone Res. 37 (6), 1496–1503. doi:10.1039/c9py01701a
Huang, X., Ding, A. J., Wang, Z. L., Ding, K., Gao, J., Chai, F. H., et al. (2020). Amplified Transboundary Transport of Haze by Aerosol-Boundary Layer Interaction in China. Nat. Geosci. 13 (6), 428. doi:10.1038/s41561-020-0583-4
Jing, Y., Jiangyan, W. U., Xia, L. I., Chenghai, P., and Zhongwei, W. (2011). Analysis on Atmospheric Boundary Layer Structure and its Effect on Air Pollution over Urumqi City in Winter. Arid Zone Res. 28 (4), 717–723.
Li, L., An, J. Y., Huang, L., Yan, R. S., and Yarwood, C. H. (2019). Ozone Source Apportionment over the Yangtze River Delta Region, China: Investigation of Regional Transport, Sectoral Contributions and Seasonal Differences. Atmos. Environ. 202, 269–280. doi:10.1016/j.atmosenv.2019.01.028
Li, Y. L., and Chen, L. Y. (2017). Numerical Simulations of Two Trapped Mountain Lee Waves Downstream of Oahu. J. Appl. Meteorology Climatology 56 (5), 1305–1324. doi:10.1175/jamc-d-15-0341.1
Liu, N., Zhou, S., Liu, C. S., and Guo, J. P. (2019). Synoptic Circulation Pattern and Boundary Layer Structure Associated with PM2.5 during Wintertime Haze Pollution Episodes in Shanghai. Atmos. Res. 228, 186–195. doi:10.1016/j.atmosres.2019.06.001
Liu, W. J., Han, Y. X., Yin, Y., Duan, J. P., Gong, J. F., Liu, Z. H., et al. (2018). An Aerosol Air Pollution Episode Affected by Binary Typhoons in East and central China. Atmos. Pollut. Res. 9 (4), 634–642. doi:10.1016/j.apr.2018.01.005
Liu, Y. M., and Wang, T. (2020a). Worsening Urban Ozone Pollution in China from 2013 to 2017-Part 1: The Complex and Varying Roles of Meteorology. Atmos. Chem. Phys. 20 (11), 6305–6321. doi:10.5194/acp-20-6305-2020
Liu, Y. M., and Wang, T. (2020b). Worsening Urban Ozone Pollution in China from 2013 to 2017-Part 2: The Effects of Emission Changes and Implications for Multi-Pollutant Control. Atmos. Chem. Phys. 20 (11), 6323–6337. doi:10.5194/acp-20-6323-2020
Shu, L., Xie, M., Gao, D., Wang, T., Fang, D., and Liu, Q. (2017). Regional Severe Particle Pollution and its Association with Synoptic Weather Patterns in the Yangtze River Delta Region, China. Atmos. Chem. Phys 17 (21), 12871–12891. doi:10.5194/acp-17-12871-2017
Chang, L. Y., Xu, J. M., Zhou, G. Q., Wu, J. B., and Xie, Y. (2016). A Numerical Study of Typical Heavy Air Pollution Episode of PM2.5 in Shanghai. Huanjing Kexue 37 (3), 825–833.
Mathur, R., Xing, J., Gilliam, R., Sarwar, G., Hogrefe, C., Pleim, J., et al. (2017). Extending the Community Multiscale Air Quality (CMAQ) Modeling System to Hemispheric Scales: Overview of Process Considerations and Initial Applications. Atmos. Chem. Phys. 17 (20), 12449–12474. doi:10.5194/acp-17-12449-2017
Peng, W., LiKang, Y. N., Zhu, B., and Yu, X. (2021b). Characteristics and Comparative of Typical Haze Weather during Autumn and winter in the Yangtze River Delta. China Environ. Sci. 41 (7), 3043–3054.
Peng, Y., Wang, H., Zhang, X. Y., Zhao, T. L., Jiang, T., Che, H. Z., et al. (2021a). Impacts of PBL Schemes on PM2.5 Simulation and Their Responses to Aerosolradiation Feedback in GRAPES_CUACE Model during Severe Haze Episodes in Jing-Jin-Ji, China. Atmos. Res. 248. doi:10.1016/j.atmosres.2020.105268
Prieto-Herraez, D., Frias-Paredes, L., Cascon, J. M., Laguela-Lopez, S., Gaston-Romeo, M., Asensio-Sevilla, M. I., et al. (2021). Local Wind Speed Forecasting Based on WRF-HDWind Coupling. Atmos. Res. 248. doi:10.1016/j.atmosres.2020.105219
Squires, F. A., Nemitz, E., Langford, B., Wild, O., Drysdale, W. S., Acton, W. J. F., et al. (2020). Measurements of Traffic-Dominated Pollutant Emissions in a Chinese Megacity. Atmos. Chem. Phys. 20 (14), 8737–8761. doi:10.5194/acp-20-8737-2020
Stefanik, D., Matejovicova, J., Krajcovicova, J., Sediva, T., Nemcek, V., and Beno, J. (2020). Comparison of Two Methods of Calculating NO2 and PM10 Transboundary Pollution by CMAQ Chemical Transport Model and the Assessment of the Non-linearity Effect. Atmos. Pollut. Res. 11 (6), 12–23. doi:10.1016/j.apr.2020.02.012
Tominaga, Y., and Stathopoulos, T. (2013). CFD Simulation of Near-Field Pollutant Dispersion in the Urban Environment: A Review of Current Modeling Techniques. Atmos. Environ. 79, 716–730. doi:10.1016/j.atmosenv.2013.07.028
Skamarock, W. C., Klemp, J. B., Dudhia, J., Gill, D. O., Barker, D. M., Duda, M. G., et al. (2008). A Description of the Advanced Research WRF Version 3. NCAR Technical Notes. Note NCAR/TN-475+STR, 113. doi:10.5065/d68s4mvh
Wang, P. F., Chen, K. Y., Zhu, S. Q., and Zhang, P. W. H. L. (2020a). Severe Air Pollution Events Not Avoided by Reduced Anthropogenic Activities during COVID-19 Outbreak. Resour. Conservation Recycling 158. doi:10.1016/j.resconrec.2020.104814
Wang, Y. J., Liu, Z. Y., Huang, L., Lu, G. B., Gong, Y. G., Yaluk, E., et al. (2020b). Development and Evaluation of a Scheme System of Joint Prevention and Control of PM2.5 Pollution in the Yangtze River Delta Region, China. J. Clean. Prod. 275. doi:10.1016/j.jclepro.2020.122756
Wang, Y. J., Tan, X. J., Huang, L., Wang, Q., Li, H. L., Zhang, H. Y., et al. (2021). The Impact of Biogenic Emissions on Ozone Formation in the Yangtze River Delta Region Based on MEGANv3.1. Air Qual. Atmosphere Health 14 (5), 763–774. doi:10.1007/s11869-021-00977-0
Wong, D. C., Pleim, J., Mathur, R., Binkowski, F., Otte, T., Gilliam, R., et al. (2012). WRF-CMAQ Two-Way Coupled System with Aerosol Feedback: Software Development and Preliminary Results. Geoscientific Model. Dev. 5 (2), 299–312. doi:10.5194/gmd-5-299-2012
Xiang, Y., Zhang, T. S., Liu, J. G., Lv, L. H., and Chen, Y. S. D. Z. Y. (2019). Atmosphere Boundary Layer Height and its Effect on Air Pollutants in Beijing during winter Heavy Pollution. Atmos. Res. 215, 305–316. doi:10.1016/j.atmosres.2018.09.014
Xing, J., Mathur, R., Pleim, J., Hogrefe, C., Gan, C. M., Wong, D. C., et al. (2015). Observations and Modeling of Air Quality Trends over 1990-2010 across the Northern Hemisphere: China, the United States and Europe. Atmos. Chem. Phys. 15 (5), 2723–2747. doi:10.5194/acp-15-2723-2015
Xu, X. J., Jiang, Z. J., Li, J., Chu, Y. Q., Tan, W. S., and Li, C. C. (2020a). Impacts of Meteorology and Emission Control on the Abnormally Low Particulate Matter Concentration Observed during the winter of 2017. Atmos. Environ. 225. doi:10.1016/j.atmosenv.2020.117377
Xu, Y-l., Yi, A-h., and Xue, W-b. (2020b). Modeling Studies of Source Contributions to PM2.5 in Chengdu, China. Huanjing Kexue 41 (1), 50–56. doi:10.13227/j.hjkx.201905041
Yan, D. D., Liu, T. Y., Dong, W. J., Liao, X. H., Luo, S. Q., Wu, K., et al. (2020). Integrating Remote Sensing Data with WRF Model for Improved 2-m Temperature and Humidity Simulations in China. Dyn. Atmospheres Oceans 89. doi:10.1016/j.dynatmoce.2019.101127
Yarwood, G., Rao, S., Yocke, M., and Whitten, G. (2005). Updates to the Carbon Bond Chemical Mechanism: CB05. Technical Report. Final Report to US EPA. RT-0400675.
Yin, S., Nie, W., Liu, Q., and Hua, Y. (2019). Transient CFD Modelling of Space-Time Evolution of Dust Pollutants and Air-Curtain Generator Position during Tunneling. J. Clean. Prod. 239. doi:10.1016/j.jclepro.2019.117924
Yu, X., Venecek, M., Kumar, A., Hu, J. L., Tanrikulu, S., Soon, S. T., et al. (2019). Regional Sources of Airborne Ultrafine Particle Number and Mass Concentrations in California. Atmos. Chem. Phys. 19 (23), 14677–14702. doi:10.5194/acp-19-14677-2019
Yu, Y., Xu, H. H., Jiang, Y. J., Chen, F., Cui, X. D., He, J., et al. (2021). A Modeling Study of PM2.5 Transboundary Transport during a winter Severe Haze Episode in Southern Yangtze River Delta, China. Atmos. Res. 248. doi:10.1016/j.atmosres.2020.105159
Zawacki, M., Baker, K. R., Phillips, S., and Wolfe, K. D. P. (2018). Mobile Source Contributions to Ambient Ozone and Particulate Matter in 2025. Atmos. Environ. 188, 129–141. doi:10.1016/j.atmosenv.2018.04.057
Zhang, C. G., Zou, Z., Chang, Y. H., Zhang, Y., Wang, X. F., and Yang, X. (2020b). Source Assessment of Atmospheric fine Particulate Matter in a Chinese Megacity: Insights from Long-Term, High-Time Resolution Chemical Composition Measurements from Shanghai Flagship Monitoring Supersite. Chemosphere 251. doi:10.1016/j.chemosphere.2020.126598
Zhang, C. X., Wang, Y. Q., Lauer, A., and Hamilton, K. (2012). Configuration and Evaluation of the WRF Model for the Study of Hawaiian Regional Climate. Monthly Weather Rev. 140 (10), 3259–3277. doi:10.1175/mwr-d-11-00260.1
Zhang, H., Lu, M., Zhang, B., An, L., and Rao, X. (2016). Analysis of the Stagnant Meteorological Situation and the Transmission Condition of Continuous Heavy Pollution Course from February 20 to 26,2014 in Beijing-Tianjin-Hebei. Acta Scientiae Circumstantiae 36 (12), 4340–4351.
Zhang, H., Zhang, B., and An, M. L. (2017). Development and Application of Stable Weather Index of Beijing in Environmental Meteorology. Meteorol. Monthly 43 (8), 998–1004.
Zhang, X. Y., Xu, X. D., Ding, Y. H., Liu, Y. J., Zhang, H. D., Wang, Y. Q., et al. (2019). The Impact of Meteorological Changes from 2013 to 2017 on PM2.5 Mass Reduction in Key Regions in China. Sci. China-Earth Sci. 62 (12), 1885–1902. doi:10.1007/s11430-019-9343-3
Zhang, Y. R., Hong, Z. Y., Chen, J. S., Xu, L. L., Hong, Y. W., Li, M. R., et al. (2020c). Impact of Control Measures and Typhoon Weather on Characteristics and Formation of PM2.5 during the 2016 G20 summit in China. Atmos. Environ. 224. doi:10.1016/j.atmosenv.2020.117312
Zhang, Y., Wang, S., Ni, C., Zhang, X., Jia, X., and Feng, X. (2020d). Study on an Objective Synoptic Typing Method for Air Pollution Weather in Chengdu during Winter. Environ. Sci. Tech. 43 (5), 139–144.
Zhang, Y., Yang, P. L., Gao, Y., and Bell, R. L. L. M. L. (2020a). Health and Economic Impacts of Air Pollution Induced by Weather Extremes over the continental US. Environ. Int. 143. doi:10.1016/j.envint.2020.105921
Keywords: stable weather, PM2.5, WRF-CMAQ, shanghai, regional transport, retention effect
Citation: He B, Yu G, Zhang X, He Z, Wang Q, Liu Q, Mao J and Zhang Y (2022) Contributions of Regional Transport Versus Local Emissions and Their Retention Effects During PM2.5 Pollution Under Various Stable Weather in Shanghai. Front. Environ. Sci. 10:858685. doi: 10.3389/fenvs.2022.858685
Received: 20 January 2022; Accepted: 22 February 2022;
Published: 28 March 2022.
Edited by:
Shupeng Zhu, University of California, United StatesReviewed by:
Kai Wu, University of California, United StatesCopyright © 2022 He, Yu, Zhang, He, Wang, Liu, Mao and Zhang. This is an open-access article distributed under the terms of the Creative Commons Attribution License (CC BY). The use, distribution or reproduction in other forums is permitted, provided the original author(s) and the copyright owner(s) are credited and that the original publication in this journal is cited, in accordance with accepted academic practice. No use, distribution or reproduction is permitted which does not comply with these terms.
*Correspondence: Yan Zhang, eWFuX3poYW5nQGZ1ZGFuLmVkdS5jbg==
Disclaimer: All claims expressed in this article are solely those of the authors and do not necessarily represent those of their affiliated organizations, or those of the publisher, the editors and the reviewers. Any product that may be evaluated in this article or claim that may be made by its manufacturer is not guaranteed or endorsed by the publisher.
Research integrity at Frontiers
Learn more about the work of our research integrity team to safeguard the quality of each article we publish.