 Wenjie Zou
 Yi Shi
 Lin Zhang
 Huangxin Chen
94% of researchers rate our articles as excellent or good
Learn more about the work of our research integrity team to safeguard the quality of each article we publish.
Find out more
ORIGINAL RESEARCH article
Front. Environ. Sci., 07 April 2022
Sec. Environmental Economics and Management
Volume 10 - 2022 | https://doi.org/10.3389/fenvs.2022.857516
This article is part of the Research TopicGreen Innovation and Industrial Ecosystem Reconstruction in Achieving Environmental SustainabilityView all 34 articles
The high-tech industry plays a crucial role in reducing carbon emission and achieving green economic development. This research uses Meta-Frontier data envelopment analysis to measure the innovation efficiency level of the high-tech industry in China’s provinces from 1999 to 2018, compares the difference in this industry’s innovation efficiency under the regional Frontier and common Frontier, and inspects the convergence condition of its innovation efficiency in the three major areas of eastern, central, and western China. The results show under the regional Frontier that the difference in innovation efficiency of the western region’s high-tech industry is the biggest, while the difference in the central region is the smallest, and under the national common Frontier the innovation efficiency level of the eastern region’s high-tech industry is the highest, while that of the western region is the lowest. The regional pattern of innovation efficiency in the high-tech industry is consistent with the development trend of the regional economy. Moreover, by using the ratio of the technology gap ratio, we find that the eastern region has the potential optimal technology in China, whereas the central and western regions have large room for improvement. Lastly, the stochastic convergence test shows that the innovation efficiency of the central region’s high-tech industry presents a convergence trend, but the same trend does not occur in the western and eastern regions as well as for the whole country.
China pledged in September 2020 to achieve carbon peak by 2030 and carbon neutrality by 2060. While China’s economy is developing rapidly and its production activities are expanding rapidly, China has become the world’s largest emitter of carbon. According to the World Bank, China has accounted for 30% of the world’s total carbon emissions after 2016, and the so-called carbon neutrality is to achieve net zero emissions of carbon dioxide, so carbon emission reduction is an important way for China to achieve its goal of green and low-carbon development and carbon neutrality, but also to combat global climate change. Carbon emission reduction needs to be carried out from the energy and industry dimensions, giving full play to the support of technological innovation, supporting the improvement of energy use efficiency (Sun et al., 2021a; Sun et al., 2021b), prompting the improvement of energy structure and the adjustment of industrial structure, all of which need to be sustained by the power of green technological innovation (Pan, 2022). Promoting innovation efficiency, enhancing green productivity and reducing carbon emissions are the main targets of the carbon neutrality goals (Zhao et al., 2022), The high-tech industry is the leading force of science and technology innovation in China, and it has led the green innovation process in China to a certain extent (Chen et al., 2020a). Therefore, in the context of carbon neutrality, it has profound theoretical and practical significance to study the innovation capacity and innovation efficiency of China’s high-tech industry to clarify the efficiency and level of green innovation in China.
Promoting the innovation efficiency of high-tech industries can not only upgrade industries and reduce carbon emissions but also ensure green economic development (Li H.-Z et al., 2017; Zhang et al., 2017). China has achieved green economic development by eliminating backward production capacity, adjusting the industrial structure (Liu, 2019). The high-tech industry1 not only encompasses the most active innovation activities in the current era of the knowledge economy. Under the background of today’s dual-carbon, it also plays a crucial role in achieving national green economic development, adjusting the economic structure, and increasing economic benefit. The scale and production efficiency of the high-tech industry reflect a country’s scientific and technological strength and core competitiveness in the global wave of green economic development. Thus, many countries promote the development of this key industry into a national strategic policy that responding the carbon neutrality (Wang et al., 2021; Song et al., 2022).
The China government in the 1990s regarded independent innovation as the core of its national development strategy and the key to enhancing its comprehensive economic strength. It thus began to speed up the promotion of the high-tech industry and transformed the method of promoting economic green growth from mainly relying on material resource consumption toward relying on scientific and technological progress, while at the same time targeting improvement in the quality of workers and green production innovation (Chen et al., 2020b). As a result, in the 21st century China’s high-tech industry has grown very fast, with the added value of high-tech industry accounting for 21.6% of GDP in 2018. The high-tech industry has indeed become an important power of green economic development for this country.
Innovation is the lifeblood of any high-tech industry, and it is very important to continually improve innovation efficiency. This leads to some questions: Has innovation efficiency risen steadily along with the rapid growth of China’s high-tech industry? Has regional imbalance in the development of China’s high-tech industry caused a regional difference in innovation efficiency? Is this difference becoming smaller or bigger? Exploring these issues has important theoretical significance for strengthening the competitive advantage of China’s high-tech industry and the ability of its domestic green economic development.
The remainder of this paper is organized as follows. Section 2 is Literature Review. Section 3 is High-tech Industry’s Innovation Efficiency Calculation. Section 4 is Convergence Test of the High-tech Industry’s Innovation Efficiency. Section 5 is Conclusions.
Innovation efficiency of the high-tech industry has attracted increasing attention from scholars around the world. Prior research studies were mainly performed at the industrial level (Chiu et al., 2010; Ma, 2015; Wang et al., 2016; Du et al., 2019) and the regional level (Li, 2009; Wang et al., 2015; Chen et al., 2020b; Liu C et al., 2020; Lin et al., 2021). The literature on innovation efficiency in the high-tech industry not only has focused on internal influencing factors such as research and development (R and D), technology achievement transformation, etc., but also the roles played by the government and market mechanisms. Zhang et al. (2012) applied the approach of Asaftei and Parmeter (2010) to analyze the influence of Rand D upon the productivity of China’s high-tech industry. Sun (2012) studied the R and D strategic effect of Taiwan’s bio-technology industry. Gao et al. (2018) adopted the threshold effect model to explore the relationship between reverse technology spillover effects and green innovation efficiency. Hong et al. (2015) used a stochastic Frontier analysis model to study the roles of government and market mechanisms in China’s high-tech industry innovation. Cao et al. (2019) employed the stochastic Frontier analysis model to test the impact of market competition on two-stage innovation efficiency for China’s high-tech industry. Su et al. (2021) explored the rules governing the process and operating mechanism of reverse knowledge transfer through cross-border mergers and acquisitions in China’s high-tech industry.
The most widely applied methods for the evaluation of innovation efficiency are non-parametric and parametric techniques, among which stochastic Frontier analysis (SFA) and data envelopment analysis (DEA) are the more relatively popular ones. DEA is an efficiency analysis of DMUs (decision making units) with multiple inputs and outputs in a specific period. Raab and Kotamraju (2006) used the DEA method to examine the input-output efficiency of the U.S. high-tech industry, finding that the technology innovation activities in some states provide significant regional economic benefits. Wang et al. (2020) constructed a high-tech industrial evaluation framework of technological innovation efficiency based on the two-stage DEA model. At the same time, the perspectives and methods of DEA applied by scholars have been gradually expended. Examples includes two-stage DEA employed in innovation efficiencies (Hsieh et al., 2020; Liu H et al., 2020; Feng et al., 2021), Super Slacks-based Measure DEA applied in empirical analysis (Chen et al., 2019; Ma et al., 2020; Shang et al., 2020; Shao et al., 2021), and three-stage DEA used in the measurement of efficiency score (Lu et al., 2019; Dia et al., 2020; Shi et al., 2021). In addition, Stochastic Frontier analysis (SFA) model was introduced simultaneously by Aigner et al. (1977) and Meeusen and Van Den Broeck (1977), and it assumes that a parametric function exists between production inputs and outputs. As an alternative approach to DEA, the great virtue of SFA is that it not only allows for technical inefficiency, but also acknowledges the fact that random shocks outside the control of producers can affect output (Cullinane et al., 2006). Li (2009) employed an SFA method proposed by Battese and Coelli (1995) to measure regional innovation performance and capabilities in 30 provinces of China during the period 1998–2005. Haschka and Herwartz (2020) used the Bayesian SFA model to evaluate innovation efficiency in Europe’s high-tech industries.
The amount of research on innovation efficiency in China’s high-tech industries is swiftly increasing in recent decades. For example, Ma and Goo (2005) employed the DEA and Malmquist Productivity Index (MPI) to study relative efficiency. Chiu et al. (2012) constructed a value-chain DEA model to compute R and D and operation efficiencies. Han et al. (2017) applied DEA to investigate the efficiency of relative R and D investment. An et al. (2018) employed a dynamic two-stage DEA approach and Liu and Huang (2019) proposed a virtual Frontier DEA model to find the driving force of efficiency change. Lin et al. (2020) adopted DEA window analysis with an ideal window width to dynamically investigate technological innovation efficiency.
The above studies in the literature, which look at innovation efficiency of China’s high-tech industry and regard it as a whole for analysis, ignore the imbalances existing in the regional development of its high-tech industry and do not delve into this industry’s regional technology gap. Thus, their conclusions may not fully reflect the reality of innovation efficiency in China’s high-tech industry. The DEA model is suitable for technical efficiency analysis, because all areas in the same country could be assumed to be under the same production technology for the national level, while the Meta-Frontier DEA is needed to investigate the regional technology gap caused by unbalanced regional development among the three distinct regions in China.
Hayami (1969) and Hayami and Ruttan (1973) introduced the concept of a Meta-production function to solve the incomparability of different groups’ performances, the basic thought of which is to emphasize the heterogeneity of production technology with different DMUs to reflect region, type, scale, and other inherent attributes. Battese & Rao (2002) and Battese et al. (2004) proposed the Meta-Frontier production model based on the SFA model, while O’Donnell et al. (2008) established a Meta-Frontier model that can be estimated using non-parametric and parametric methods. Since then, Meta-Frontier model have gained in popularity to assess the technology gaps of DMUs, including that of Chen et al. (2009) on regional productivity growth in China, Hajihassaniasl and Kök (2016) on the Turkish manufacturing industry, Li L.-B et al. (2017) on the Japanese electricity distribution sector, and Walheer (2018) on European sectors. The approach can be briefly explained as follows: DMUs are partitioned into groups in order to capture the heterogeneity present between DMUs.
Wang et al. (2013) used the Meta-Frontier DEA approach to measure energy efficiency by considering the technology gap and analyzed it as a discrete source of energy inefficiency, finding that the technology gap related to energy utilization is the most significant source of energy inefficiency in the central and the west provinces. Li L.-B et al. (2017) constructed a dynamic DEA model based on Meta-Frontier analysis to evaluate the efficiency of China’s regional high-tech industry during 1998–2011. Their empirical result showed that the east region is always in the lead, with the central and west regions obviously lag behind, however, the Meta-technology ratio of the west region has rapidly increased and presents a trend of catching up with the east. Tian and Lin (2018) utilized the non-parametric Meta-Frontier and sequential DEA methods to investigate the technology gap of energy utilization in different regions of China based on data of 30 provinces from 2005 to 2014. The main findings were that promoting dissemination of new technology from the eastern to the central and west regions can be reasonable, because the eastern region has the most advanced technology, and this approach could narrow the technology gap across the three areas in China. Sun et al. (2019) proposed a game Meta-Frontier DEA model and applied it to evaluate production technology in China’s different provinces from 2007 to 2016, presenting that the efficiency of the eastern region is significantly more desirable than that of the western region, while the technological potential of the central and western regions are enormous. These methodologies enable not only the calculation of comparable technical efficiencies for DMUs under different technologies, but also the estimation of technology gaps for DMUs under different technologies relative to the potential technology available to them as a whole.
This research applies Meta-Frontier DEA to study the innovation efficiency of China’s high-tech industry, with some innovative points. First, we apply Meta-Frontier DEA to measure the innovation efficiency of China’s eastern, central, western, and national high-tech industries and compare the innovation efficiency between the regional frontiers and the national common Frontier. Second, this research combines the measured result of innovation efficiency, introduces the technology gap ratio, and analyzes the gap between the technical level of each regional high-tech industry and the optimal technical potential in China. Third, we inspect the convergence condition of innovation efficiency in each region of China as well as the national high-tech industry.
The non-parametric approach has been traditionally assimilated into data envelopment analysis (DEA). DEA is a mathematical programming model applied to observed data that provides a way to construct production frontiers as well as calculate efficiency scores relative to those on a constructed Frontier.
The model developed by Charnes et al. (1979), known as the CCR model, imposes three restrictions on Frontier technology: constant returns to scale, convexity for the set of feasible input-output combinations, and strong disposability of inputs and outputs. The basic assumption of the CCR model is that a DMU has constant returns to scale (CRS), but in reality, a DMU could have increasing returns to scale (IRS) or decreasing returns to scale (DRS). As a result, the inefficiency of a DMU might result not only from an inappropriate configuration of inputs and outputs, but also from the assumption of CRS. Therefore, Charnes et al. (1979) set up the concept of the distance function and loosened the restriction of the variable possibility. The new DMU using variable returns to scale (VRS) is called the BCC model.
Tone (2001) provided a slack-based measure (SBM) model that considers the slacks of the input item and output item to estimate the efficiency value. The estimated efficiency value in the SBM model is between 0 and 1. The SBM model also uses a non-radial method to estimate an efficiency value. Thus, the puzzle in which the efficiency value cannot be achieved in the CCR model and in the BCC model does not happen in the SBM model.
Following the Tone model, Battese et al. (2004), O’Donnell et al. (2008), and Moreira et al. (2010) specified the non-stochastic Frontier estimation, based on the Meta-Frontier concept, to calculate the technology gap. O’Donnell et al. (2008) calculated the technology gap through the radial DEA model. The advantage of the Meta-Frontier model is that it calculates comparable technical efficiencies for firms operating under different technologies. Moreover, the technique includes building a global technology production Frontier (or a Meta-Frontier) and then separating the countries in the sample into relatively homogeneous (or regional) groups and then estimating group-specific frontiers.
This study further develops the SBM technology gap measurement, based on the DEA model, to analyze the differences between various operational technologies. Suppose that the overall DMU can be classified into I groups that employ different operating technologies. The sample size of the ith group is Ji and satisfies
The optimal objective value of
Here,
In order to distinguish the differences between technologies, we define the technology gap ratio (TGR) of efficiency for the ith group’s jth DMU (i.e.,
We define TGR in terms of the utilization of inputs and generation of outputs of an individual DMU as:
We define TGR in terms of the utilization of inputs and generation of outputs of individual groups as:
We now select the innovation input variables. Research personnel and capital are the core input factors of innovation activities. Thus, this paper selects high-tech industry research personnel converted into full-time equivalent as the variable of high-tech industry research personnel investment and selects high-tech industry internal expenditure on R and D as the variable of high-tech industry capital input into R and D. Since research capital investment has an influence of innovation, this paper converts the intramural expenditure on R and D into internal expenditures to measure research capital investment. The conversion process is:
In the formula,
We suppose that the value growth rate of the high-tech industry’s R and D expenditures equals that of R&D expenditures. The beginning value of R and D expenditures can then be:
Here,
We next select the innovation output in variables. The general indicators for the measurements of innovation output are patent applications or grants and new product output value or sales. Patent applications are the intermediate outputs of innovation activities that represent the direct results of innovation activities. New product output value reflects the ultimate economic value of technological innovation, process improvement, and other innovative activities. Therefore, this paper selects the number of patent applications and the value of new products as the output of innovation activities.
This paper selects 29 provinces (autonomous regions and municipalities; hereinafter, referred to as provinces) in China from 1999 to 2018 as the analysis samples (Tibet and Xinjiang are excluded due to serious missing of data, and Taiwan, Hong Kong, and Macao are not included in the scope of analysis). We divide China into three regions: eastern, central, and western.2 Data are from China Statistical Yearbook, China High-tech Industry Statistical Yearbook, and relevant provinces’ statistical yearbooks over the years. Some provinces lack data for individual years, and hence we adopt the average number of the year before and the year after. In order to prevent inflation or economic tightening from impacting the price of the underlying data as they span over a long period of time, this paper selects the price index of investment in fixed assets as the price deflator for the value of new products and the internal expenditure on R&D. We then reevaluate the business accounting data at current prices to comparable data by selecting 1999 as the base year. Table 1 lists the descriptive statistical characteristics of the innovation input and output data from 1999 to 2018 for the high-tech industry in China’s provinces.
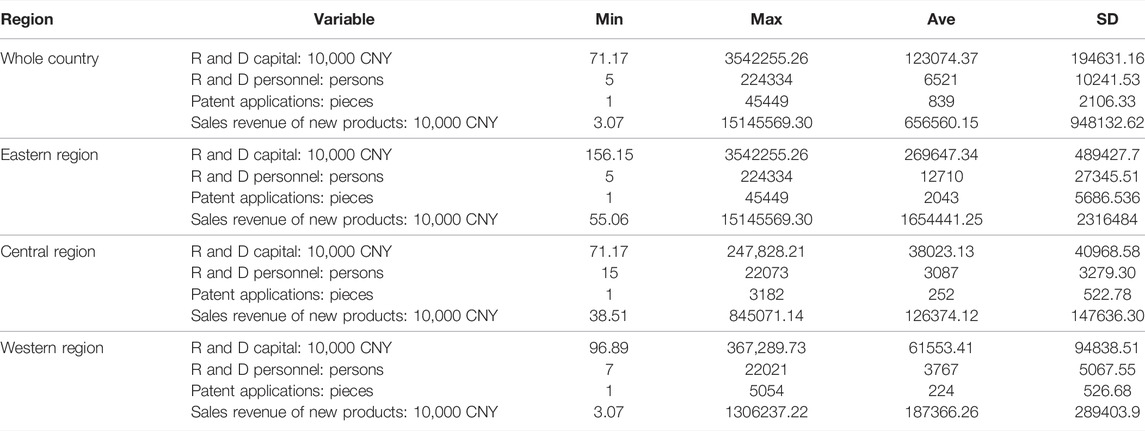
TABLE 1. Descriptive statistical characteristics of the innovation input and output for the high-tech industry in China’s provinces.
The applications are based on input-oriented Meta-Frontier DEA by means of the software DEA-solver. Moreover, the innovation efficiency of the high-tech industry in every province is calculated by respectively measuring the industry’s innovation efficiency of each province in the eastern, central, and western regions under the regional Frontier and the common Frontier of China. Table 2 shows the results. At the same time, this study uses ArcGIS software to conduct a spatial visualization analysis of the average innovation efficiency of China’s high-tech industries under the regional Frontier and the common Frontier, as shown in Figure 1.
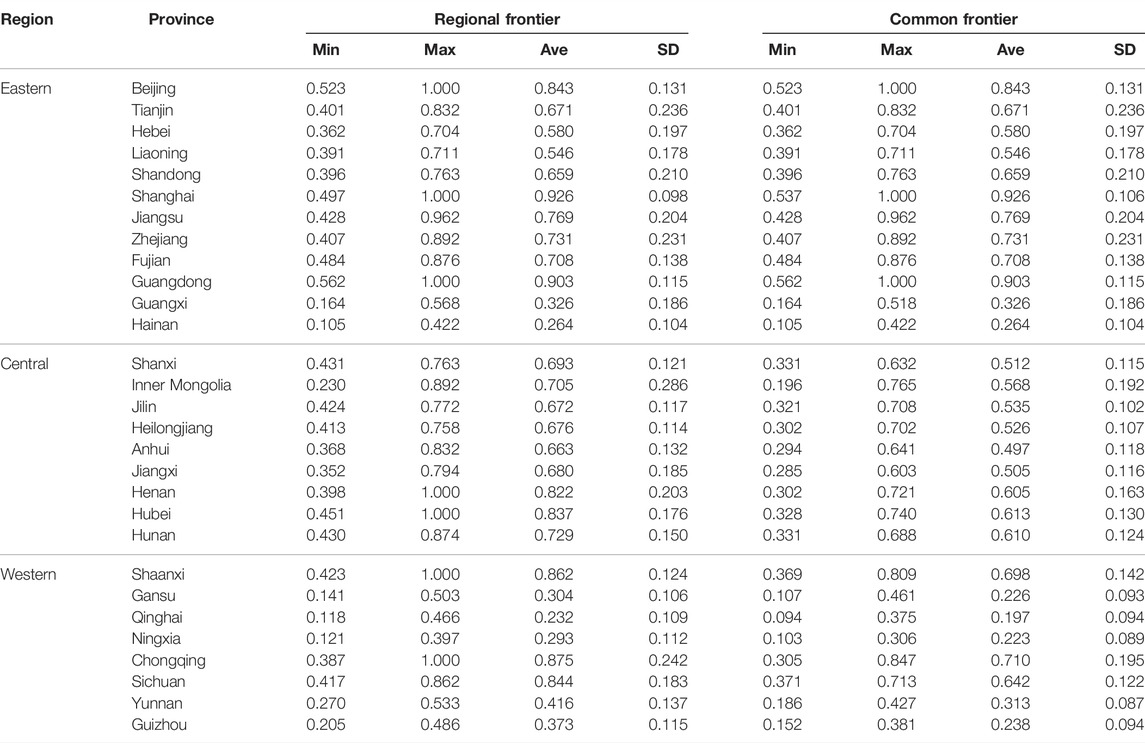
TABLE 2. Innovation efficiency of the high-tech industry under the regional Frontier and the common Frontier in 1999–2018.
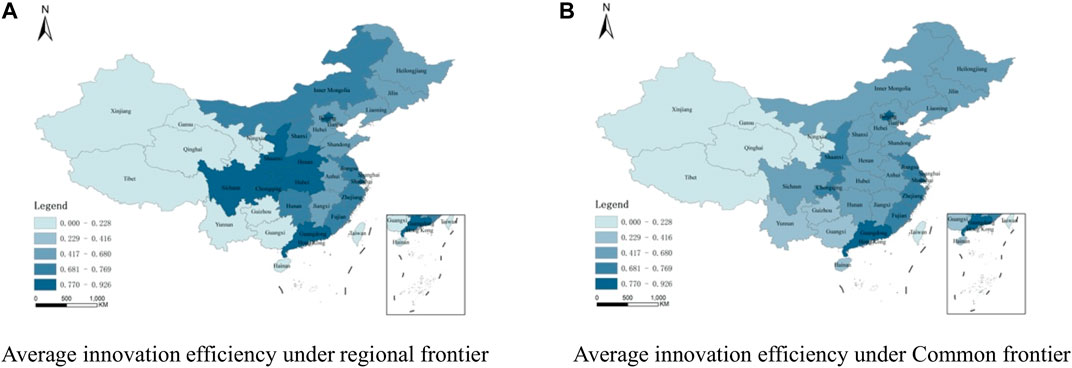
FIGURE 1. Average innovation efficiency of the high-tech industry under the regional Frontier and the common Frontier in 1999–2018.
The left side of Table 2 and Figure 1A present the basic conditions of the innovation efficiency of the high-tech industry under the regional Frontier for the eastern, central, and western regions from 1999 to 2018. In the eastern Frontier, the high-tech industry of the 12 eastern provinces has an average efficiency of 0.661, which indicates that using the potential optimal production technologies there will on the whole improve efficiency by 33.9%. The innovation efficiency of Shanghai ranks first with average efficiency of 0.926, while Hainan ranks last with innovation efficiency of 0.264, showing a huge gap between the two. In the central Frontier, the average efficiency of high-tech industry innovation of the nine central provinces is 0.719 among which Hubei ranks the highest at 0.837, and Anhui is the lowest at 0.663. The gap in the innovation efficiency among the central provinces and the room for optimal efficiency are smaller than that of the eastern region. In the western Frontier, the average high-tech industry innovation efficiency of the eight western provinces is 0.533, in which Chongqing ranks the highest, while those of Qinghai and Ningxia are relatively low.
We see from the comparison of the innovation efficiencies in the high-tech industry under the three regional frontiers that an obvious gap exists among the regions with the largest gap in the western region and the smallest gap in the central region. Compared with the regional potential optimal production technology, the improvement space for the innovation efficiency of the high-tech industry for the eastern, central, and western regions is respectively 33.9, 28.1 and 46.7%.
The right side of Table 2 and Figure 1B list the basic condition of the innovation efficiency of the high-tech industry in every province under the common Frontier of China from 1999 to 2018. We can see that the innovation efficiencies of the central and western provinces are different under the common Frontier and under the regional Frontier. For example, the average efficiency of Henan is 0.822 under the regional Frontier, while under the common Frontier it is 0.605, because the referential technologies are different under the two frontiers. The referential technology of the regional Frontier is the western regional potential optimal production technology, while that of the common Frontier is the potential optimal production technology of China. The eastern region represents the highest level of technology, while the referential technology of the national common Frontier and the regional Frontier is the same. Thus, the innovation efficiency of the eastern provinces under the two frontiers remains the same.
The provinces’ high-tech industry innovation efficiency gap is more obvious under the national common Frontier. The high-tech industry innovation efficiency of Shanghai is high at 0.926, while that of Ningxia is only 0.223. From the average value for the three regions’ high-tech industry innovation efficiency, the eastern region is the most efficient (0.661), followed by the central region (0.546), and then the western region is the lowest (0.406).
The biggest advantage of Meta-Frontier DEA is that the gap in production technology of different areas can be examined by the technology gap ratio.
From Table 3; Figure 2 we see a very obvious technology gap of innovation efficiency in the high-tech industry among China’s three major regions. The eastern region’s TGR is one every year, the country’s highest level, indicating that it has reached 100% of the national potential optimal technology. The eastern region is China’s most economically developed area with a large number of high-end professionals and significant foreign investment. Its overall innovation efficiency of the high-tech industry is higher than that of the western region and central region. The average TGR values of the central region and western region are respectively 0.834 and 0.702, indicating that the room for improvement for the two regions to the national potential optimal technology is 16.6 and 29.8%.
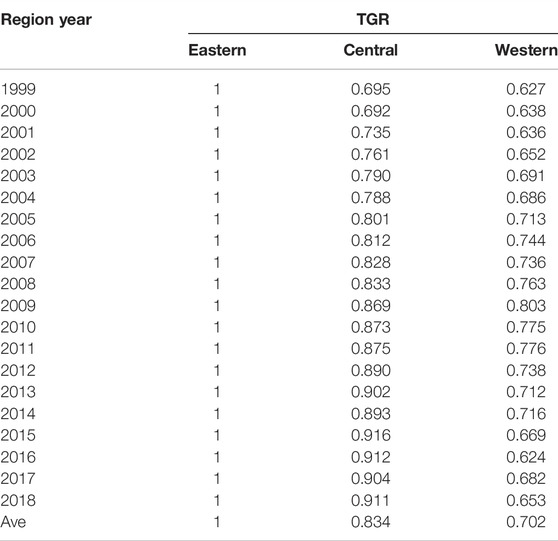
TABLE 3. Analysis of the technology gap ratio (TGR) of innovation efficiency in each region.
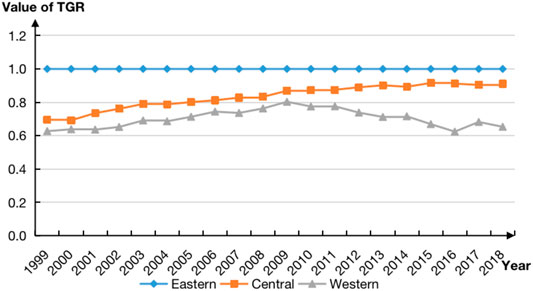
FIGURE 2. Analysis of the technology gap ratio (TGR) of innovation efficiency in each region.
From the variation rule of the gap between the region’s innovation efficiency of the high-tech industry, we note that TGR of the innovation efficiency of the high-tech industry in the central region has gradually increased, indicating that innovation efficiency of this regional high-tech industry is rising, and that the gap between the central region and the eastern region is narrowing. The central region’s TGR at first increases and then becomes smaller, which shows that the gradual improvement mechanism of the innovation efficiency of the high-tech industry has not yet formed in the central region. From the overall trend, the technology gap between the eastern region and the western region has gradually expanded.
The aim of convergence analysis is to study the income gap trends between different economies over time. According to the analysis methods and hypotheses, convergence analysis consists of σ convergence, ß convergence, club convergence, and stochastic convergence. Here, σ convergence means that the gap of per capita income among different economies decreases over time, while ß convergence includes conditional ß convergence and absolute ß convergence. Conditional ß convergence means that different economies respectively converge to a steady-state level of their own, while absolute ß convergence is that all economies converge to the same steady-state level. Club convergence implies that economies with a similar initial level and structural characteristics converge in the long run - namely, they show absolute convergence under the same level of development. Stochastic convergence mainly inspects whether changes in the gap in per capita income among different economies are relatively stable.
Bernard and Durlarf (1996) defined stochastic convergence under the assumption of economic variables’ linear deterministic trend and stochastic trend. For the economic variables of N (N = 1, 2...n) areas, if:
then the economic variables of these N areas could reach stochastic convergence (It is the information set at time t), which means that the gap of economic variables between different regions approaches infinitely close to zero over time. According to Bernard and Durlarf’s definition, the key to analyzing the convergence of regional economic variables lies in ascertaining the co-integration relationship of relevant economic variables in these regions.
Johanson’s maximum likelihood method is commonly used in the co-integration test with the following model:
Here, Yt is a vector including N first-order integrated I (1) time series variables; Δ indicates the first-order difference; Γ1,Γ2,...Γq-1 make up the P×P coefficient matrix; q refers to the lag order; Dt is a deterministic variable; Ut is vector of white noise; and Π is a compression matrix.
According to Johanson’s testing principle, the key to identifying the co-integration relationship among different economic variables is to determine the rank of the compression matrix in Formula 7. The trace test statistic is as follows:
Here, N refers to the number of sequential variables contained in vector Yt; T refers to the sample size; λi is the characteristic root at step i; and r is the number of hypothesized co-integration relationships, ranging from 0 to N-1. The null hypothesis is that the rank of compression matrix Π is r - namely, the number of co-integration relationships in the sequential variables. The alternative hypothesis is that the rank of compression matrix Π is N - namely, Yt is a stationary process. According to Johanson’s test model and trace test statistics formula, if one successively postulates r = 0,1,...,N-1, then we could get the corresponding statistic ηr, and until we get ηr. The first non-significant statistic, r, which is the number of co-integration relationships, can thus be ascertained.
Before conducting the stochastic convergence, we should first use the Augmented Dickey-Fuller (ADF) test to study the stability of the sequences. According to the innovation efficiency of the high-tech industry in China’s provinces calculated on the basis of the common Frontier, the ADF test results for stability in the high-tech industry innovation efficiency sequences can be checked in Table 4.
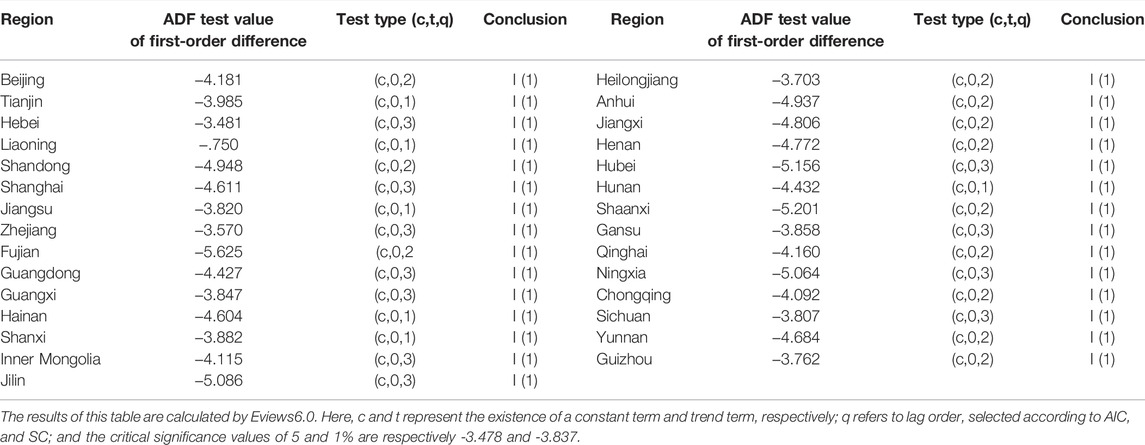
TABLE 4. Stationary test of the innovation efficiency series of the high-tech industry in China’s provinces.
As Table 4 shows, the first-order difference ADF test values for innovation efficiency of the high-tech industry in China’s provinces are more than 5%. Thus, the innovation efficiency sequences of the provinces’ high-tech industry are first-order integration I (1) sequences, whose co-integration relationship can be tested by Johanson’s method to judge the convergence of the gap of innovation efficiency gap among the eastern, central, western and national high-tech industries.
Table 5 shows the results of the co-integration test of the innovation efficiency sequences of the high-tech industry in the eastern, central, and western regions. In the whole country, r is five when the first non-significant trace test statistic appears, which shows that the number of innovation efficiency sequences for the national high-tech industry is 5 (r = 5 < 28–1 = 27). According to Bernard and Durlarf’s theory, innovation efficiency in China’s provinces’ high-tech industry will not converge in the long run. The number of co-integration relationships among innovation efficiency sequences of the high-tech industry in the eastern and western regions is respectively 3 (r < N-1 = 11) and 4 (r < N-1 = 7), and so the innovation efficiency of the high-tech industry in these two regions in the long run will not converge. For the central region, r is eight when the first non-significant trace test statistic appears, which shows that the number of co-integration relationship among the nine provinces there conforms to the formula of r = 9–1 = 8, and so the innovation efficiency of the high-tech industry in the central region will converge in the long run.
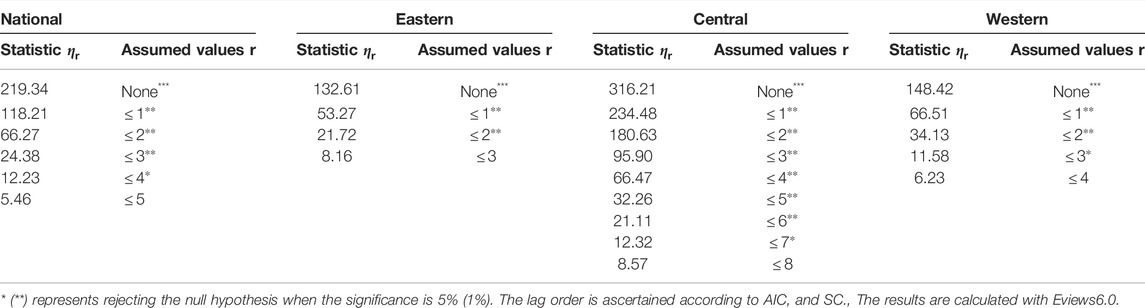
TABLE 5. Stochastic convergence test results of the innovation efficiency series of each region’s high-tech industry.
Existing research results show that the level of regional economic development, industry agglomeration, R and D intensity, government support, and other factors all impact the level of innovation efficiency of the high-tech industry. The difference between the above factors’ results shows up in the difference among the convergence trend of innovation efficiency for the regional high-tech industries. In the central provinces, the resource endowment, industrial structure, and economic development levels are relatively close, and the degree of industrial agglomeration and R and D intensity tend to gradually narrow. In the eastern and western regions, due to differences in geographical location, labor conditions, and resource endowments, the gaps in the levels of economic development, the degree of industrial agglomeration, and R and D intensity expand rather than narrow, resulting in the gap of innovation efficiency for the high-tech industry to further expand.
Scholars at home and abroad have conducted systematic and in-depth studies around the innovation efficiency of high-tech industries. In terms of research methods, most of them adopt data envelopment analysis method to assess the innovation efficiency of high-tech industries. At the level of research content, the macro level is to study the innovation efficiency of high-tech industry from the external environment such as government and market, while the micro level is to explore the innovation efficiency of high-tech industry from the internal factors such as the quality of labor and R and D capital, and then to explore the new impetus for China’s green development. However, there are also some limitations: in terms of research methods, scholars mostly use DEA methods to study the innovation efficiency of high-tech industries, ignoring the influence of environmental constraints and random factors on the results, which leads to a certain error in the result of calculation. In terms of research objects, on the one hand, too much attentions have been paid to the research samples of economically developed regions, neglecting the research samples of western regions, and on the other hand, the heterogeneity of regional development has not been taken into account, ignoring the regional development imbalance of high-tech industries. Therefore, applying Meta-Frontier DEA, this research estimates the innovation efficiencies of the high-tech industries in China’s provinces on the basis of the regional Frontier and common Frontier from 1999 to 2018. We also study the convergence of the innovation efficiency of the high-tech industry in eastern, central, western, and all of China. The conclusions are as follows.
First, under the regional Frontier the gap in innovation efficiency of the provinces’ high-tech industry is quite obvious, among which the western regional gap is the biggest and that in the central region is the smallest. Comparing the potential optimal production technology in the same region, we find that the improvement room for innovation efficiency of the high-tech industry in eastern, central, and western China is respectively 33.9, 28.15, and 46.7%.
Second, under the common Frontier the gap of innovation efficiency of the high-tech industry in the provinces is more obvious. In Shanghai, the innovation efficiency of its high-tech industry reaches 0.926, but Ningxia is only at 0.223. Judging from the average, innovation efficiency is the highest in the eastern region followed by the central region, and the lowest is in the western region. The regional pattern of the innovation efficiency of the high-tech industry is consistent with the pattern of regional economic development within China.
Third, we employ the technology gap ratio to study the innovation efficiency of the high-tech industry in the eastern, central, and western regions of China. Findings show that eastern regional technology hits the potential optimal, while the improvement room for central and western regional technology is respectively 18.6 and 28.8%.
Fourth, we test the trend of innovation efficiency for China’s high-tech industry with stochastic convergence. Results present that the innovation efficiency of the high-tech industry in the central region converges, while the convergence trend has not yet formed in the western and eastern regions.
Based on the research in this paper, scholars should explore the real level of innovation efficiency of China’s high-tech industry from the macro, medium, and micro perspectives combined with the heterogeneity of the regional development of high-tech technology industry, and then provide an optimization path for the new dynamics of China’s green development. The above conclusions have significant meaning for the China government to support the development of its high-tech industry. First, in most of its provinces the innovation efficiency of the high-tech industry still maintains a great gap from the production Frontier namely, there is big room to improve innovation efficiency. Therefore, the government should implement the innovation-driven strategy, continuously increase R&D efforts, and strive to enhance the innovation efficiency and level of high-tech industries. Meanwhile, establish a win-win cooperation mechanism, promote the development of high-tech industries in the western region and foster the spillover of innovation factors and the full emergence of innovation vigor. Second, policies supporting innovation of the high-tech industry should be made on the basis of different regions’ actual conditions, taking into account industrial agglomeration, R&D intensity and other factors. On the premise of combining the heterogeneity of regional development levels, different development policies are formulated according to local conditions for high-tech industries in different regions, mechanisms matching the enhancement of innovation efficiency of high-tech industries are established, a scientific innovation system is set up, financing channels for high-tech industries are broadened through the help government, and a good innovation environment is created for the development of enterprise. Finally, the China government should guide those provinces with high innovation efficiency in the high-tech industry, such as Beijing, Shanghai, and Guangdong, to exert technology superiority and provide R&D spillovers in order to help the surrounding provinces improve their own innovation efficiency, especially to focus on helping the development of high-tech industries in Tibet, Qinghai and other provinces and regions, and the government should encourage the western provinces to entice high-tech enterprises to invest there and to increase R and D intensity, which will promote the improvement of their own internal innovation capacity and then realize the improvement of the overall innovation efficiency of China’s high-tech industry. In addition, it is necessary to improve the management level of enterprises, take management as an important means for the development of high-tech enterprises, and promote the establishment of a perfect modern enterprise system for the high-tech industries in the western region. At the same time, to improve the overall high-tech industry scale effect, the scale should be considered as an important grasp of the cultivation of high-tech industry innovation efficiency improvement.
The original contributions presented in the study are included in the article/Supplementary Material, further inquiries can be directed to the corresponding authors.
WZ and YS contributed equally to this work and should be considered as co-first authors; HC and LZ are co-correspondence authors. Conceptualization, WZ; methodology, YS and LZ; software, HC; validation, WZ; formal analysis and language edit, YS, LZ, and FO; investigation, ZX and HC; resources, YS and LZ; writing—original draft preparation, WZ and YS; writing—review and editing, ZX, FO, and LZ; supervision, FO and WZ; project administration, WZ and LZ; funding acquisition, WZ and FO. All authors have read and agreed to the published version of the manuscript.
This research was funded by National Social Science Fund General Project of China (No. 19BGL092), Innovation Strategy Research Project of Fujian Province (No. 2021R0156), GF Securities Social Welfare Foundation Teaching and Research Fund for National Finance and Mesoeconomics.
The authors declare that the research was conducted in the absence of any commercial or financial relationships that could be construed as a potential conflict of interest.
All claims expressed in this article are solely those of the authors and do not necessarily represent those of their affiliated organizations, or those of the publisher, the editors and the reviewers. Any product that may be evaluated in this article, or claim that may be made by its manufacturer, is not guaranteed or endorsed by the publisher.
The authors are grateful to the editor and the reviewers of this paper.
1According to the Chinese High Technology Industry Yearbook, Chinese high-tech industries include pharmaceuticals, aircraft and spacecraft, electronic and telecommunication equipments, computers and office equipments, medical equipments, and meters.
2Eastern: Beijing, Tianjin, Hebei, Shandong, Shanghai, Jiangsu, Zhejiang, Fujian, Guangdong, Guangxi, and Hainan. Central: Shanxi, Inner Mongolia, Jilin, Heilongjiang, Anhui, Jiangxi, Henan, Hunan, and Hubei. Western: Shaanxi, Gansu, Qinghai, Ningxia, Chongqing, Sichuan, Yunnan, and Guizhou.
Aigner, D., Lovell, C. A. K., and Schmidt, P. (1977). Formulation and Estimation of Stochastic Frontier Production Function Models. J. Econom. 6 (1), 21–37. doi:10.1016/0304-4076(77)90052-5
An, Q., Meng, F., Xiong, B., Wang, Z., and Chen, X. (2018). Assessing the Relative Efficiency of Chinese High-Tech Industries: a Dynamic Network Data Envelopment Analysis Approach. Ann. Oper. Res. 290, 707–729. doi:10.1007/s10479-018-2883-2
Asaftei, G., and Parmeter, C. F. (2010). Market Power, EU Integration and Privatization: The Case of Romania. J. Comp. Econ. 38 (3), 340–356. doi:10.1016/j.jce.2009.12.002
Battese, G. E., and Coelli, T. J. (1995). A Model for Technical Inefficiency Effects in a Stochastic Frontier Production Function for Panel Data. Empirical Econ. 20 (2), 325–332. doi:10.1007/bf01205442
Battese, G. E., Rao, D. S. P., and O’Donnell, C. J. (2004). A Metafrontier Production Function for Estimation of Technical Efficiencies and Technology Gaps for Firms Operating under Different Technologies. J. Productivity Anal. 21 (1), 91–103. doi:10.1023/b:prod.0000012454.06094.29
Battese, G. E., and Rao, D. S. P. (2002). Technology gap, Efficiency, and a Stochastic Metafrontier Function. Int. J. Business Econ. 1, 87–93. http://espace.library.uq.edu.au/view/UQ:170794.
Bernard, A., and Durlarf, N. (1996). Interpreting Tests of the Convergence Hypothesis. J. Econom. (71), 161–173. doi:10.1016/0304-4076(94)01699-2
Cao, S., Feng, F., Chen, W., and Zhou, C. (2019). Does Market Competition Promote Innovation Efficiency in China's High-Tech Industries? Tech. Anal. Strateg. Manage. 32, 429–442. 14. doi:10.1080/09537325.2019.1667971
Charnes, A., Cooper, W. W., and Rhodes, E. (1979). Measuring the Efficiency of Decision-Making Units. Eur. J. Oper. Res. 3 (4), 339. doi:10.1016/0377-2217(79)90229-7
Chen, H., Lin, H., and Zou, W. (2020b2020). Research on the Regional Differences and Influencing Factors of the Innovation Efficiency of China's High-Tech Industries: Based on a Shared Inputs Two-Stage Network DEA. Sustainability 12, 3284. doi:10.3390/su12083284
Chen, H., Zhang, L., Zou, W., Gao, Q., and Zhao, H. (2020a). Regional Differences of Air Pollution in China: Comparison of Clustering Analysis and Systematic Clustering Methods of Panel Data Based on gray Relational Analysis. Air Qual. Atmos. Health 13, 1257–1269. doi:10.1007/s11869-020-00880-0
Chen, K.-H., Huang, Y.-J., and Yang, C.-H. (2009). Analysis of Regional Productivity Growth in China: A Generalized Metafrontier MPI Approach. China Econ. Rev. 20 (4), 777–792. doi:10.1016/j.chieco.2009.05.003
Chen, W., Huang, X., Liu, Y., Luan, X., and Song, Y. (2019). The Impact of High-Tech Industry Agglomeration on Green Economy Efficiency-Evidence from the Yangtze River Economic Belt. Sustainability 11 (19), 5189. doi:10.3390/su11195189
Chiu, Y.-h., Huang, C.-w., and Chen, Y.-C. (2010). The R&D Value-Chain Efficiency Measurement for High-Tech Industries in China. Asia Pac. J. Manag. 29 (4), 989–1006. doi:10.1007/s10490-010-9219-3
Chiu, Y.-H., Lee, J.-H., Lu, C.-C., Shyu, M.-K., and Luo, Z. (2012). The Technology gap and Efficiency Measure in WEC Countries: Application of the Hybrid Meta Frontier Model. Energy Policy 51 (51), 349–357. doi:10.1016/j.enpol.2012.08.026
Cullinane, K., Wang, T.-F., Song, D.-W., and Ji, P. (2006). The Technical Efficiency of Container Ports: Comparing Data Envelopment Analysis and Stochastic Frontier Analysis. Transportation Res. A: Pol. Pract. 40 (4), 354–374. doi:10.1016/j.tra.2005.07.003
Dia, M., Takouda, P. M., and Golmohammadi, A. (2020). Assessing the Performance of Canadian Credit Unions Using a Three-Stage Network Bootstrap DEA. Ann. Oper. Res. doi:10.1007/s10479-020-03612-w
Du, J.-l., Liu, Y., and Diao, W.-x. (2019). Assessing Regional Differences in Green Innovation Efficiency of Industrial Enterprises in China. Ijerph 16 (6), 940. doi:10.3390/ijerph16060940
Feng, Y., Zhang, H., ChiuChang, Y.-h. T., and Chang, T.-H. (20212021). Innovation Efficiency and the Impact of the Institutional Quality: a Cross-Country Analysis Using the Two-Stage Meta-Frontier Dynamic Network DEA Model. Scientometrics 126, 3091–3129. doi:10.1007/s11192-020-03829-3
Gao, Y., Tsai, S.-B., Xue, X., Ren, T., Du, X., Chen, Q., et al. (2018). An Empirical Study on Green Innovation Efficiency in the Green Institutional Environment. Sustainability 10 (3), 724. doi:10.3390/su10030724
Hajihassaniasl, S., and Kök, R. (2016). Scale Effect in Turkish Manufacturing Industry: Stochastic Metafrontier Analysis. Econ. Structures 5 (1). doi:10.1186/s40008-016-0044-9
Han, C., Thomas, S. R., Yang, M., Ieromonachou, P., and Zhang, H. (2017). Evaluating R&D Investment Efficiency in China's High-Tech Industry. J. High Tech. Manage. Res. 28 (1), 93–109. doi:10.1016/j.hitech.2017.04.007
Haschka, R. E., and Herwartz, H. (2020). Innovation Efficiency in European High-Tech Industries: Evidence from a Bayesian Stochastic Frontier Approach. Res. Pol. 49 (8), 104054. doi:10.1016/j.respol.2020.104054
Hayami, Y., and Ruttan, V. (1973). Agricultural Productivity Differences Among Countries. Am. Econ. Rev. 60 (5), 895–911. doi:10.2307/1818289
Hayami, Y. (1969). Sources of Agricultural Productivity Gap Among Selected Countries. Am. J. Agric. Econ. 51 (3), 564–575. doi:10.2307/1237909
Hong, J., Hong, S., Wang, L., Xu, Y., and Zhao, D. (2015). Government grants, Private R&D Funding and Innovation Efficiency in Transition Economy. Tech. Anal. Strateg. Manage. 27 (9), 1068–1096. doi:10.1080/09537325.2015.1060310
Hsieh, H. P., Wu, Y. C., Lu, W. M., and Chen, Y. C. (2020). Assessing and Ranking the Innovation Ability and Business Performance of Global Companies in the Aerospace and Defense Industry. Manage. Decis. Econ. 41, 952–963. doi:10.1002/mde.3150
Li, H.-Z., Kopsakangas-Savolainen, M., Xiao, X.-Z., and Lau, S.-Y. (2017). Have Regulatory Reforms Improved the Efficiency Levels of the Japanese Electricity Distribution Sector? A Cost Metafrontier-Based Analysis. Energy Policy 108, 606–616. doi:10.1016/j.enpol.2017.06.032
Li, L.-B., Liu, B.-l., Liu, W.-l., and Chiu, Y.-H. (2017). Efficiency Evaluation of the Regional High-Tech Industry in China: A New Framework Based on Meta-Frontier Dynamic DEA Analysis. Socio-Economic Plann. Sci. 60, 24–33. doi:10.1016/j.seps.2017.02.001
Li, X. (2009). China's Regional Innovation Capacity in Transition: An Empirical Approach. Res. Pol. 38 (2), 338–357. doi:10.1016/j.respol.2008.12.002
Lin, H., Chen, H., Zhang, L., Luo, Y., Shi, Y., and Zou, W. (2021). Energy Consumption, Air Pollution, and Public Health in China: Based on the Two-Stage Dynamic Undesirable DEA Model. Air Qual. Atmos. Health 14, 1349–1364. doi:10.1007/s11869-021-01025-7
Lin, S., Lin, R., Sun, J., Wang, F., and Wu, W. (2021). Dynamically Evaluating Technological Innovation Efficiency of High-Tech Industry in China: Provincial, Regional and Industrial Perspective. Socio-Economic Plann. Sci. 74, 100939. doi:10.1016/j.seps.2020.100939
Liu, C., Gao, X., Ma, W., and Chen, X. (2020). Research on Regional Differences and Influencing Factors of green Technology Innovation Efficiency of China's High-Tech Industry. J. Comput. Appl. Maths. 369, 112597. doi:10.1016/j.cam.2019.112597
Liu, H., Yang, G.-l., Liu, X.-x., and Song, Y.-y. (2020). R&D Performance Assessment of Industrial Enterprises in China: A Two-Stage DEA Approach. Socio-Economic Plann. Sci. 71, 100753. doi:10.1016/j.seps.2019.100753
Liu, R. (2019). Comparison of Bank Efficiencies between the US and Canada: Evidence Based on SFA and DEA. Joc 11 (2), 113–129. doi:10.7441/joc.2019.02.08
Liu, X., and Huang, J. (2019). China's High‐tech Industry Efficiency Measurement with Virtual Frontier Data Envelopment Analysis and Malmquist Productivity index. Expert Syst. 39. doi:10.1111/exsy.12450
Lu, W., Evans, R. D., Zhang, T., Ni, Z., and Tao, H. (2019). Evaluation of Resource Utilization Efficiency in Obstetrics and Gynecology Units in China: A Three‐stage Data Envelopment Analysis of the Shanxi Province. Int. J. Health Plann. Mgmt 35, 309–317. doi:10.1002/hpm.2908
Ma, J. (2015). A Two-Stage DEA Model Considering Shared Inputs and Free Intermediate Measures. Expert Syst. Appl. 42 (9), 4339–4347. doi:10.1016/j.eswa.2015.01.040
Ma, X., Zhao, X., Zhang, L., Zhou, Y., and Chen, H. (2020). Spatial-temporal Characteristics and Influencing Factors of Atmospheric Environmental Efficiency in China. Environ. Sci. Pollut. Res. 28, 12428–12440. doi:10.1007/s11356-020-11128-w
Ma, Y.-F., and Goo, Y.-J. (2005). Technical Efficiency and Productivity Change in China's High- and New-Technology Industry Development Zones. Asian Bus Manage 4 (3), 331–355. doi:10.1057/palgrave.abm.9200135
Meeusen, W., and van Den Broeck, J. (1977). Efficiency Estimation from Cobb-Douglas Production Functions with Composed Error. Int. Econ. Rev. 18 (2), 435. doi:10.2307/2525757
Moreira, V. H., Bravo-Ureta, B. E., and Boris, E. (2010). Technical Efficiency and Metatechnology Ratios for Dairy Farms in Three Southern Cone Countries: a Stochastic Meta-Frontier Model. J. Prod. Anal. 33 (33), 33–45. doi:10.1007/s11123-009-0144-8
O’Donnell, C. J., Rao, D. S. P., and Battese, G. E. (2008). Meta-frontier Frameworks for the Study of Firm-Level Efficiencies and Technology Ratios. Empirical Econ. (34), 231–255.
Pan, (2022). Carbon Neutrality: Disruptive Technological Innovation and Development Paradigm Shift Required. J. China Three Gorges Univ. 44 (1), 5–11. doi:10.13393/j.cnki.1672-6219.2022.01.002
Raab, R. A., and Kotamraju, P. (2006). The Efficiency of the High-Tech Economy: Conventional Development Indexes versus a Performance Index*. J. Reg. Sci 46 (3), 545–562. doi:10.1111/j.1467-9787.2006.0045210.1111/j.1467-9787.2006.00452.x
Shang, Y., Liu, H., and Lv, Y. (2020). Total Factor Energy Efficiency in Regions of China: An Empirical Analysis on SBM-DEA Model with Undesired Generation. J. King Saud Univ. - Sci. 32, 1925–1931. doi:10.1016/j.jksus.2020.01.033
Shao, Q., Yuan, J., Lin, J., Huang, W., Ma, J., and Ding, H. (2021). A SBM-DEA Based Performance Evaluation and Optimization for Social Organizations Participating in Community and home-based Elderly Care Services. PLOS ONE 16 (3), e0248474. doi:10.1371/journal.pone.0248474
Shi, Z., Huang, H., Chiu, Yh., Zhan, B., and Zhang, C. (2021). Linkage Analysis of Water Resources, Wastewater Pollution, and Health for Regional Sustainable Development—Using Undesirable Three-Stage Dynamic Data Envelopment Analysis. Environ. Sci. Pollut. Res. 28, 19325–19350. doi:10.1007/s11356-020-12067-2
Song, M., Peng, L., Shang, Y., and Zhao, X. (2022). Green Technology Progress and Total Factor Productivity of Resource-Based Enterprises: A Perspective of Technical Compensation of Environmental Regulation. Technol. Forecast. Soc. Change 174, 121276. doi:10.1016/j.techfore.2021.121276
Su, Y., Guo, W., and Yang, Z. (2021). Reverse Knowledge Transfer in Cross-Border Mergers and Acquisitions in the Chinese High-Tech Industry under Government Intervention. Complexity. doi:10.1155/2021/8881989
Sun, C. C. (2012). A Conceptual Framework for R&D Strategic alliance Assessment for Taiwan's Biotechnology Industry. Qual. Quant 48 (1), 259–279. doi:10.1007/s11135-012-9766-4
Sun, H., Edziah, B. K., Sun, C., and Kporsu, A. K. (2021a). Institutional Quality and its Spatial Spillover Effects on Energy Efficiency. Socio-Economic Plann. Sci., 101023. doi:10.1016/j.seps.2021.101023
Sun, H., Edziah, B. K., Kporsu, A. K., Sarkodie, S. A., and Taghizadeh-Hesary, F. (2021b). Energy Efficiency: The Role of Technological Innovation and Knowledge Spillover. Technol. Forecast. Soc. Change 167, 120659. doi:10.1016/j.techfore.2021.120659
Sun, J., Li, G., and Wang, Z. (2019). Technology Heterogeneity and Efficiency of China's Circular Economic Systems: A Game Meta-Frontier DEA Approach. Resour. Conservation Recycling 146, 337–347. doi:10.1016/j.resconrec.2019.03.046
Tian, P., and Lin, B. (2018). Regional Technology gap in Energy Utilization in China's Light Industry Sector: Non-parametric Meta-Frontier and Sequential DEA Methods. J. Clean. Prod. 178, 880–889. doi:10.1016/j.jclepro.2018.01.017
Tone, K. (2001). A Slacks-Based Measure of Efficiency in Data Envelopment Analysis. Eur. J. Oper. Res. 130, 498–509. doi:10.1016/s0377-2217(99)00407-5
Walheer, B. (2018). Aggregation of Metafrontier Technology gap Ratios: the Case of European Sectors in 1995-2015. Eur. J. Oper. Res. 269 (3), 1013–1026. doi:10.1016/j.ejor.2018.02.048
Wang, C., Shi, Y., Zhang, L., Zhao, X., and Chen, H. (2021). The Policy Effects and Influence Mechanism of China's Carbon Emissions Trading Scheme. Air Qual. Atmos. Health 14, 2101–2114. doi:10.1007/s11869-021-01081-z
Wang, Q., Hang, Y., Sun, L., and Zhao, Z. (2016). Two-stage Innovation Efficiency of New Energy Enterprises in China: A Non-radial DEA Approach. Technol. Forecast. Soc. Change 112, 254–261. doi:10.1016/j.techfore.2016.04.019
Wang, Q., Zhao, Z., Zhou, P., and Zhou, D. (2013). Energy Efficiency and Production Technology Heterogeneity in China: A Meta-Frontier DEA Approach. Econ. Model. 35, 283–289. doi:10.1016/j.econmod.2013.07.017
Wang, S., Fan, J., Zhao, D., and Wang, S. (2015). Regional Innovation Environment and Innovation Efficiency: the Chinese Case. Tech. Anal. Strateg. Manage. 28 (4), 396–410. doi:10.1080/09537325.2015.1095291
Wang, Y., Pan, J.-f., Pei, R.-m., Yi, B.-W., and Yang, G.-l. (2020). Assessing the Technological Innovation Efficiency of China's High-Tech Industries with a Two-Stage Network DEA Approach. Socio-Economic Plann. Sci. 71, 100810. doi:10.1016/j.seps.2020.100810
Zhang, B., Luo, Y., and Chiu, Y.-H. (2019). Efficiency Evaluation of China's High-Tech Industry with a Multi-Activity Network Data Envelopment Analysis Approach. Socio-Economic Plann. Sci. 66, 2–9. doi:10.1016/j.seps.2018.07.013
Zhang, J., Liu, Y., Chang, Y., and Zhang, L. (2017). Industrial Eco-Efficiency in China: A Provincial Quantification Using Three-Stage Data Envelopment Analysis. J. Clean. Prod. 143, 238–249. doi:10.1016/j.jclepro.2016.12.123
Zhang, R., Sun, K., Delgado, M. S., and Kumbhakar, S. C. (2012). Productivity in China's High Technology Industry: Regional Heterogeneity and R&D. Technol. Forecast. Soc. Change 79 (1), 127–141. doi:10.1016/j.techfore.2011.08.005
Keywords: meta-frontier DEA, green innovation, high-tech industry, spatial difference, carbon neutrality
Citation: Zou W, Shi Y, Xu Z, Ouyang F, Zhang L and Chen H (2022) The Green Innovative Power of Carbon Neutrality in China: A Perspective of Innovation Efficiency in China’s High-Tech Industry Based on Meta-Frontier DEA. Front. Environ. Sci. 10:857516. doi: 10.3389/fenvs.2022.857516
Received: 18 January 2022; Accepted: 28 February 2022;
Published: 07 April 2022.
Edited by:
Huaping Sun, Jiangsu University, ChinaReviewed by:
Ming Zheng, Shanghai University, ChinaCopyright © 2022 Zou, Shi, Xu, Ouyang, Zhang and Chen. This is an open-access article distributed under the terms of the Creative Commons Attribution License (CC BY). The use, distribution or reproduction in other forums is permitted, provided the original author(s) and the copyright owner(s) are credited and that the original publication in this journal is cited, in accordance with accepted academic practice. No use, distribution or reproduction is permitted which does not comply with these terms.
*Correspondence: Lin Zhang, WmhhbmdsaW5fRGFuaWVsQDE2My5jb20=; Huangxin Chen, cWJ4MjAxODAwMDVAeWpzLmZqbnUuZWR1LmNu
Disclaimer: All claims expressed in this article are solely those of the authors and do not necessarily represent those of their affiliated organizations, or those of the publisher, the editors and the reviewers. Any product that may be evaluated in this article or claim that may be made by its manufacturer is not guaranteed or endorsed by the publisher.
Research integrity at Frontiers
Learn more about the work of our research integrity team to safeguard the quality of each article we publish.