 Ghazala Aziz1*
 Mohd Saeed Khan2
- 1Department of Business Administration, College of Administrative and Financial Sciences, Saudi Electronic University, Jeddah, Saudi Arabia
- 2Finance and Economics Department, College of Business, University of Jeddah, Jeddah, Saudi Arabia
This paper investigates the impact of GDP, renewable energy consumption, patents, and innovation on carbon intensity in Saudi Arabia. For this purpose, we use panel data from 1990 to 2019 and applied pooled OLS with fixed effect and quantile regression techniques to check the long-run association between variables. The results show that GDP is enhancing carbon intensity in Saudi Arabia. However, renewable energy consumption is a significant factor in reducing carbon emission. Further, it is also confirmed that patents and innovation can help reduce carbon intensity in Saudi Arabia. These results are also confirmed through quantile regression analysis. Our results are robust to alternative tests as well. Capital subsidies and feed-in-trade are important policy implications to promote the use of renewable energy.
Introduction
Carbon intensity means the amount of carbon emitted by using per unit of energy. It is a fact that the majority of the carbon in the atmosphere is the result of the high amount of fossil fuel consumption, including oil. However, economies cannot grow without using energy because basic economic sectors, including industries and transportation, are dependent on energy use (Shahzad et al., 2022). Still, some factors can significantly reduce overall carbon intensity without interrupting economic growth and reducing the negative overall environmental impacts of speedy economic growth. Hence, almost all countries are trying to explore and use such factors.
The importance of reduction in carbon intensity is essential. However, for a country like Saudi Arabia, whose economy is heavily deepened on fossil fuels (Tlili, 2015), the significance of low carbon intensity is highlighted. The main reason behind the Saudi economy’s top ranking is that it is the largest producer and exporter of oil and petroleum products (Bradshaw et al., 2019). However, due to the abundance of fossil fuels in the country, its consumption is very high. All sectors of the Saudi economy use oil and petroleum products for energy, making carbon intensity extremely high (Fatima et al., 2021). The annual carbon intensity per kilogram of oil equivalent consumed is shown in Figure 1. It can be seen that significant efforts to reduce carbon intensity has been taken, however, it is still very high. This situation calls for immediate attention to identify ways to reduce carbon intensity.
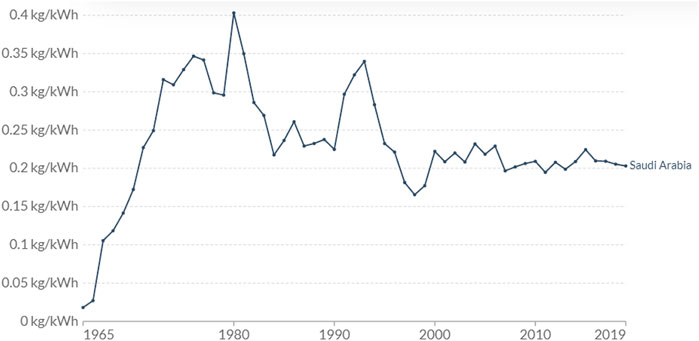
FIGURE 1. Carbon intensity per kilogram of oil equivalent oil consumed (Ritchie and Roser, 2020).
Previously researchers investigated the factors that can help to reduce carbon intensity without affecting economic growth while environmental degradation can be reduced. In this context (Waheed et al., 2018; Farooq et al., 2019; Sarwar, 2019; Li et al., 2021) found that forests can be used to reduce carbon intensity. They assert that forests reduce carbon from the atmosphere and help provide an alternative low carbon-emitting alternative source of energy. According to these studies, forests help reduction of carbon emission in selected countries. Also, enhancement in income level is considered beneficial for reducing carbon intensity (Sarwar, 2019; Sarwar and Alsaggaf, 2019; Hashmi et al., 2020). The positive impact of income on carbon intensity is when people will afford to buy expensive but energy-efficient products. Also, the latest and technically enhanced vehicles would help to reduce carbon emission. Similarly, according to (Sarwar et al., 2019; Sarwar et al., 2021), education can also play a vital role in combating environmental issues. When people get the required knowledge, the awareness regarding the environment will be enhanced. They will try to reduce the negative impacts of their energy use. Besides these factors Suleman Sarwar and Alsaggaf (2021) found that governance can also help to counter the carbon issues, and it can reduce carbon emission.
Previously, researchers have explored different factors that can help to control carbon emission and reduce carbon intensity; however, as mentioned above, the issue of carbon intensity is still at its peak (Adebayo et al., 2021; Adebayo and Kirikkaleli, 2021; Kirikkaleli and Adebayo, 2021; Kirikkaleli et al., 2021; Adebayo et al., 2022; Miao et al., 2022). Hence, the current study is an effort to introduce a few practical solutions. There are three main contributions of this study. The first contribution is to investigation the nexus between economic growth and carbon intensity in Saudi Arabia. It is a fact that countries try to accelerate economic growth, but this cannot be done without using energy. However, using energy sources negatively impact the environment, as fossil fuels are the main energy source. Saudi Arabian economy is highly dependent on energy-intensive sectors (Taylan and Demirbas, 2016), and due to the abundance of oil in the country, it is widely used in all sectors. This huge usage of oil results in a high amount of carbon intensity. Nevertheless, no research directly explored the impact of economic growth on carbon intensity in the Saudi context. This study is an effort to fill this gap.
The second contribution is exploring the impact of renewable energy consumption on carbon intensity in Saudi Arabia. It has been proved that renewable energy can play a significant role in reducing energy-related emissions and can help reduce carbon intensity (Rahman et al., 2022). Instead of non-renewable energy sources, including oil, renewable energy sources emit a very low amount of carbon, and renewable energy’s carbon intensity is significantly low. However, Saudi Araba is neglected in empirical research regarding renewable energy and carbon intensity. The current study uses Saudi Arabian data to put forward some important policy implications. The third contribution is regarding the investigation as to how patents can solve environmental issues by reducing carbon intensity. Patents can play a role in reducing carbon intensity by enhancing energy efficiency (Cheng et al., 2019). Hence, it is important to check whether the positive effects of patents are also valid in Saudi Arabia. The last contribution is the association between innovation and carbon intensity in Saudi Arabia. Innovation can help in controlling carbon intensity because technically enhanced products are proved to be less carbon-intensive. Shaikh et al. (2018) asserts that technical innovations can reduce carbon emission because technically improved products use less amount of energy, and hence these products emit low carbon.
Hence, based on the above discussion, this study has four objectives, including checking the nexus between GDP and carbon intensity in Saudi Arabia. Also, to check the role of renewable energy in mitigating carbon intensity. The last objective of the current study is to investigate the significance of patents and innovation for reducing carbon intensity.
Literature Review
Carbon intensity explains how much carbon is emitted by using one unit of energy. It is a fact that economic growth is dependent on those sectors which are energy-dependent, including industrialization, transportation etc. Hence, it is logical to say that carbon intensity enhances with increased economic growth in terms of gross domestic product (GDP). Previously researchers tried to explore the nexus and found some important insights. In this regard Rahman et al. (2022) explored emerging economies from 1990 to 2018 to investigate if carbon intensity in these countries is related to their rapid growth. Using the Pool Mean Group technique, their analysis suggests that the economic growth sectors in these countries increase carbon intensity. Another study by Cheng et al. (2018) used data from 28 European Union countries to check if economic growth in these countries is related to carbon intensity. By applying the panel quantile regression technique, they found a heterogeneous and asymmetric relationship between economic growth and carbon intensity. Specifically, they noted that in countries where carbon emission is either medium or high, economic growth helps in reduction in carbon intensity. Alongside, Vujović et al. (2018) also concluded that carbon intensity and economic growth are positively related. They used data from European Union countries and asserted that economic growth and carbon intensity are interrelated due to high energy consumption. Li and Lin (2016) used Chinese data to know if rapid economic growth in the country is increasing carbon intensity or not. Their result revealed that although China’s economic growth is higher, it is negatively impacting carbon intensity. They found that negative effects of industrial development and energy intensity are reduced due to high economic growth. Also, it makes unclean energy mix beneficial for carbon intensity, making the overall nexus between economic growth and carbon intensity negative.
Due to the increased amount of carbon intensity, countries are struggling to find solutions, and renewable energy is considered a viable solution. Researchers also tried to check that renewable energy is essential for reducing carbon intensity. Rahman et al. (2022) explored emerging economies to find this nexus. Using data from 1990 to 2018 and the pool means group technique and ARDL method, they found that carbon intensity in these countries is significantly reduced due to increased renewable energy. Similarly, Zhang et al. (2022) used data from nine top carbon-emitting countries to investigate if renewable energy can solve the issue of carbon intensity in these countries. Using modern econometric techniques, they found that carbon intensity is significantly reduced by increased use of renewable energy.
Another study by Cheng and Yao (2021) also checked the same nexus in 30 Chinese provinces. They used data from 2000 to 2015 and found that renewable energy and carbon intensity are significantly and negatively related in the only long run. However, in the short-run renewable energy does not affect carbon intensity. Likewise, Zheng et al. (2021) asserts that a 1% increase can reduce renewable energy influences carbon intensity and almost 0.043% of carbon intensity in renewable energy development. Like this, Yu et al. (2020) also researched the relationship between renewable energy and carbon intensity and found that a 1% increase in renewable energy generation reduces 0.149% carbon intensity. However, they concluded that this effect is more prominent in areas with high or low carbon intensity. Likewise, Shahzad et al. (2018) used data from China and India to know if renewable energy is related to carbon emission intensity in these countries. Using the ARDL method, they found that renewable energy is a major factor in reducing carbon emissions. Waheed et al. (2018) also researched the same nexus in Pakistan, and by ARDL approach, they show that increasing renewable energy use can reduce carbon emission in the long run and short run.
Patents can also play a vital role in reducing carbon intensity as it restricts using energy and other carbon-emitting sources. To check this notion, Huang et al. (2021) used provincial data from China from the year 2000–2016 and through dynamic panel threshold model, they found that carbon intensity can be significantly reduced through patents in terms of output of energy-saving R & D. This means through energy patents, countries can reduce carbon intensity significantly. Another study Cheng et al. (2019) used data from BRICS countries from the year 2000–2013 to know if patents can help reduce carbon intensity in these countries. Through panel OLS and quantile regression, they found that environmental patents accelerates carbon emission and ultimately carbon intensity. Ibrahiem (2020) explored Egyptian data to know if patents help reduce carbon emission and intensity in the country. They used data from 1971 to 2014 and applied ARDL, FMOLS, DOLS, and Toda-Yamamoto techniques. Results revealed a direct relationship between patents and carbon emission in the country, which suggest that instead of decreasing the carbon emission, patents are adding to the carbon emission.
Similarly, Ganda (2019) checked the same nexus in OECD member countries from 2000 to 2014. They applied the Generalized Method of Moments (GMM) technique, and results suggest that triadic patent families and carbon emission are significantly and positively related. Likewise, (Wang et al., 2012), tried to explore how much domestic patents for fossil-fueled technologies are helping in the reduction of carbon emission. They used the STIRPAT method and concluded that domestic patents for fossil-fueled technologies do not impact carbon emission in Beijing.
Innovations can be a tool to reduce carbon intensity, and this nexus is explored by (Ali et al., 2020) in the Malaysian context. They used data from 1985 to 2016 and, through the ARDL technique, found that there is bidirectional causality between technical innovations and carbon emission in the long run. Another study by Dauda et al. (2019) used data from 18 countries from 1990 to 2016 and applied CADF unit root test and FMOLS and DOLS techniques. Their analysis revealed that in G6 countries, there is a significant and negative association between innovation and carbon emission. However, there is a significant and positive association between innovation and carbon emission in MENA and BRICS countries. Töbelmann and Wendler (2020) researched data from EU-27 countries from 1992 to 2014 to investigate if environmental innovations play any role in reducing carbon emission. Through Generalized Methods of Moments, they found that innovation does not play any role in the reduction of carbon emission. Shaikh et al. (2018) used Chinese data from 1980 to 2017 to explore the nexus between technological innovation and carbon emission. They used the ARDL technique, revealing that technological innovation and carbon emission are not related. Additionally, Yu and Du (2019) used provincial data from China from 1997 to 2015 to check if high-speed growth provinces and low-speed growth provinces show the same type of association between technological innovations and carbon emission. Their STIRPAT analysis shows that technological innovations more prominently enhance carbon emission than high-speed growth provinces in low growth provinces.
In view of the above mentiond literature, it is evident that previous studies have less focus on Saudi Arabia. However, to cover the gap, we examine the role of creativity on carbon intensity. For this, we use two proxies, patent and innovation. The findings of current studies will be useful for policy making.
Data and Methodology
Data Sources and Model
This study investigates the impact of economic growth, renewable energy consumption, patents, and innovation on carbon intensity for Saudi Arabia. For analysis purposes, this paper utilizes annual data of Saudi Arabia from 1990 to 2019. Data for all variables is obtained from World Development Indicators. As far as the measurement of variables is concerned, carbon intensity is measured as kg per kg of oil equivalent energy use, GDP represents gross domestic product per capita (constant 2010 dollars), renewable energy is % of total electricity production from renewable sources, patents are measured as patent applications, and innovation is used from innovations index (0–100). The data is collected from the World Development Bank Indicators (WDI), we use the simulation method to fill the missing values.
The basic model of our hypothesis is presented in linear form as following:
whereas,
To avoid the estimation concern, the data of all the variables (except carbon intensity) are transformed into natural logarithms. The empirical models of carbon intensity function with natural logs.
Methodology and Estimation Strategy
We utilized panel data, which might possess the features of unit root issues. Hence, we initially investigated the unit root properties of the variables by applying Levin Lin-Chu (LLC) unit root test introduced by Levin et al. (2002) and Harris-Tzavalis unit root tests. After confirming the integration properties of the variables, we further apply Kao cointegration for examining the long-run relationship between the variables. After confirming no cointegration between variables, the main analysis uses pooled OLS with the fixed effect technique. Additionally, quantile regression analysis is performed to check which quantile provides stronger independent variables’ association with carbon intensity.
Generalized Method of Moments
To examine the panel data regression, Hansen introduced the Generalized method of moments (GMM) in 1982. When number parameters are larger than the number of moments conditions or smaller than moment conditions, HMM is suitable. Suppose it advised that GMM must be used when the equation has endogenous variables. Also, in the case of unobserved heterogeneity, GMM is appropriate. Here, random as well as fixed effect estimators are not consistent. Previously, many researchers proposed the GMM technique to estimate panel data in case of inconsistent estimators across a huge number of cross-sections and infinite periods (Uddin et al., 2017; Ganda, 2019; Muhammad, 2019). Hence, the primary hypothesis of the current study is checked through GMM regression to address the unobserved heterogeneity.
Panel Quantile Regression
Panel quantile regression is utilized in this study to examine the impact of independent variables on the dependent variable. It is important to know the impact of independent variables on carbon intensity at different quantiles. However, traditional conditional mean regression is used in previous studies. However, there are chances of getting biased relevant coefficients. The major advantages of quantile regression are no requirement for the normality of economic sequence required in ordinary least square. Also, the impact of extreme values can be calculated by quantile regression which cannot be done in the ordinary least square method. Quantile regression has the following formula:
Where.
x = Vector of independent variable
y = Explained variable
θ= Quantile point
μ = Random distribution term.
β = Parameter vector through Eq. 9
Besides other advantages, quantile regression makes it possible to understand the relationship between study variables beyond the mean of data. Hence, it makes it possible to understand those outcomes distributed non normally, and there is a nonlinear relationship between outcomes and predictors. Quantile regression allows us to drop the assumption that the relationship between variables operates similarly at the upper tail as at the mean level. Hence, important determinants of carbon intensity for different subgroups of independent variables can be identified. Also, under and over, the depression in the data can be addressed through quantile regression. The robustness of quantile regression motivates us to investigate the determinants of carbon intensity in Saudi Arabia.
Empirical Results and Discussion
Descriptive Statistics
Table 1 illustrates the descriptive statistics of all the variables, which shows the normality of the data. It can be seen that the highest mean value corresponds to carbon intensity, whereas the lowest mean value is for innovation. As far as the volatility is concerned, carbon intensity is the most volatile and economic growth is the least volatile.
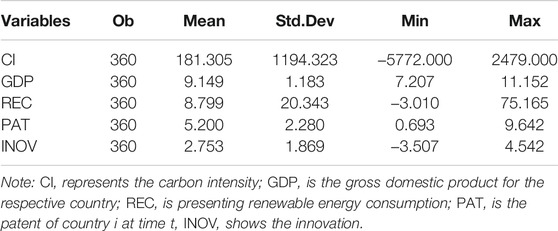
TABLE 1. Descriptive statistics.
Unit Root Test
For proper analysis, the stationarity of the data is necessary. To check this, a unit root test is applied in this study; two types of tests are used, including the LLC unit root test and the Harris-Tzavalis test unit root test. Table 2 shows the results of both tests, and it is evident that in the LLC test, carbon intensity, renewable energy consumption, and patents are stationary at a level, but economic growth and innovation are non-stationary. However, at the first difference, all variables are stationary. The same is the case with the Harris-Tzavalis test unit root test. Only a few variables are stationary at the level, and all variables are stationary at first difference.
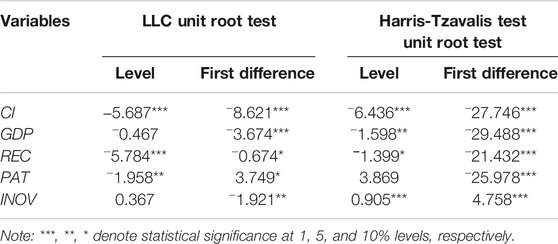
TABLE 2. Panel unit root analysis.
Cointegration Test
Unit root tests confirm that their variables are stationary at the level. Hence, it is necessary to apply cointegration tests to check the integration between variables. For this purpose, five different types of tests are used, and results are reported in Table 3. It can be seen that in all models and all tests, values are significant at a 1% level of significance. This suggests that the null hypothesis of the unit root should be rejected, and the alternative hypothesis should be accepted. Hence, there exists no unit root in the data.
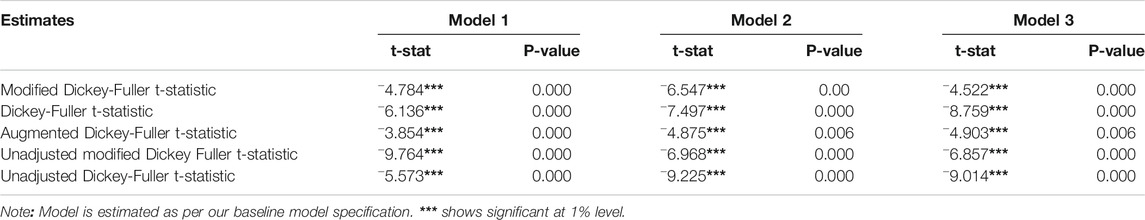
TABLE 3. Panel cointegration analysis.
Long-Run Analysis
Table 4 presents the results of Long-Run Analysis Using Pooled OLS with Fixed Effects for three models. Estimation results for Model 1 show that the coefficient of GDP is positive and significant at a 10% level of significance. The coefficient value is 0.841 suggesting the 1% increase in GDP increases the carbon intensity by 0.841%. This result is aligned with the findings of (Rahman et al., 2022). It is a fact that economic growth is dependent on development in energy-intensive sectors, including industrial and transportation. In Saudi Arabia, these sectors are dependent on fossil fuels to generate electricity to be used as energy. However, higher fossil fuel consumption leads to high carbon emission. The coefficient for renewable energy consumption is negative and significant at a 5% significance level, and the coefficient value is -0.008. This shows that renewable energy consumption helps reduce carbon intensity; if consumption of renewable energy increases by 1%, carbon intensity reduces by 0.008%. Waheed et al. (2018) also found the same type of results. This negative association can be interpreted as the Saudi government trying to diversify the economy from oil to non-oil sector, and the use of renewable energy is also increased. Due to this, consumption of non-renewable energy sources is reduced in the overall energy mix. Hence, this reduces the overall carbon emission from energy consumption. The association between patents and carbon intensity shows that the coefficient is negative and significant at the 10% level. The value of the coefficient is -0.103; hence increase in patents reduces carbon intensity, and 0.103% carbon intensity reduces by a 1% increase in patents. Huang et al. (2021) also suggest that patents help to control carbon emission and hence carbon intensity reduces. In Saudi Arabia, patents application is increased to 9782 in 2020 from 1242 in just 10 years. This improvement enables investors and producers to exploit innovation by getting the required return on investment. This also enables them to invest in technically enhanced methods of production which are less energy-intensive. This reduces the overall carbon emission.
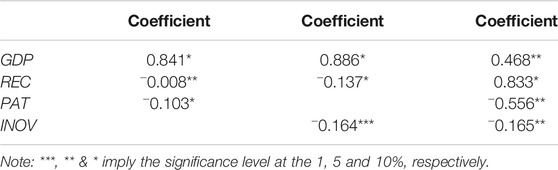
TABLE 4. Long-run analysis using pooled OLS with fixed effects.
Now turning our attention towards Model 2, an extension of Model 1 by adding innovation in the basic model consisting of GDP and renewable energy consumption. In this model, again, the coefficient of GDP is positive and significant at 10% significance, suggesting that the increase in GDP increases carbon emissions. The value of the coefficient is 0.889. Hence, it can be said that a 1% increase in GDP increases carbon intensity by 0.886%. Likewise, the coefficient of renewable energy consumption is again negative and significant at a 10% significance level with a coefficient value of −0.137. This suggests that if renewable energy consumption increases by 1%, carbon intensity reduces by 0.137%. The results regarding the innovation show that there is a significant and negative association between innovation and carbon intensity. The value of the coefficient is −0.164, and the level of significance is 1%. Hence, if innovation increases by 1%, carbon intensity reduces by 0.164%. Previously Dauda et al. (2019) also found a negative relationship between innovation and carbon intensity.
As far as the third model is concerned, which is an extension of Model 1 by adding patents and innovation, the results show that GDP and carbon intensity are negatively and significantly related at a 10% significance level. However, the magnitude of impact is a little low compared to the other two models. The coefficient value is 0.468 showing that a 1% increase in GDP increases carbon intensity by 0.468%. The relationship between renewable energy consumption and carbon intensity is positive in this model, opposite to previous studies. This suggests that a 1% increase in renewable energy consumption increases carbon intensity in the long run. The coefficient for patents is negative and significant at a 5% significance level. The coefficient value is −0.556, which means a 1% increase in patents reduces 0.556% in carbon intensity. The coefficient of innovation is negative and significant at a 5% level of significance. The value of the coefficient is −0.165. Hence, it can be said that if innovation increases by 1%, carbon intensity reduces by 0.165%. Shaikh et al. (2018) also assert that innovation is the key to reducing environmental degradation by reducing carbon intensity.
Quantile Regressions Analysis
In order to provide a more robust estimation, quantile regression is used, and results are reported in Table 5. In Model 1, The coefficient of GDP is positive and significant at a 5% level of significance with a value of 1.574. This suggests that GDP and carbon intensity are positively related, and a 1% increase in GDP increases carbon intensity by 1.574%. However, the coefficient of renewable energy is insignificant, showing that renewable energy consumption is irrelevant to carbon intensity. This result is opposite to many previous studies (Budzianowski, 2012; Zheng et al., 2021; Rahman et al., 2022). One plausible explanation for this insignificant relationship is that oil resources are abundant in the country. Hence, people usually use fossil fuels instead of renewable energy sources. In the case of patents, the coefficient is negative and significant at a 5% level of significance, and the coefficient value is −0.060. Hence, it can be said that a 1% increase in patents helps in the reduction of 0.060% carbon intensity. In Model 2, again, GDP is positively and significantly related to carbon intensity with the coefficient of 0.033. This shows that a 1% increase in GDP increases carbon intensity by 0.033%. Nevertheless, again renewable energy consumption is not related to carbon intensity in this model. In Model 2, innovation is added in the basic model, and results suggest a negative and significant relationship between innovation and carbon intensity at a 1% level of significance.
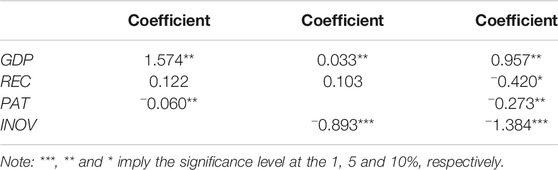
TABLE 5. Quantile regressions analysis with fixed effects.
In the last model, Model 3, all variables are simultaneously added to the equation. Here, GDP and carbon intensity are positively and significantly related at a 5% level of significance, and the coefficient value is 0.957. This shows that a 1% increase in GDP increases carbon intensity by 0.957%. However, in this model, renewable energy consumption shows the impact on carbon intensity, and the coefficient is negative and significant at a 10% level of significance. The coefficient value is −0.420; hence, if renewable energy consumption increases by 1%, carbon intensity reduces by 0.420%. The same is the case for patents, which is also negatively and significantly related to carbon intensity at a 5% significance level. The value of the coefficient is −0.273. This suggests that a 1% increase in patents reduces carbon intensity by 0.273%. Similarly, the innovation results show a negative and significant association between innovation and carbon intensity at a 1% significance level. The coefficient of innovation is −1.384; thus, a 1% increase in innovation reduces 1.384% in carbon intensity.
Table 6 presents the complete results of quantile regression, and it is evident that the impact of GDP on carbon intensity gets significant from the 50th quantile and remains significant in the 75th and 90th quantiles. However, the strongest impact of GDP on carbon intensity is in the 50th quantile, where the value of the coefficient is positive and significant at a 1% significance level. If GDP increases by 1%, carbon intensity increases by 0.802%. The same is true with renewable energy consumption, which is also significantly related to carbon intensity in higher quantiles. However, the magnitude of impact gets higher if we move to upper quantiles and gets highest in the 90th quantile, where a 1% increase in renewable energy consumption reduces carbon intensity by 0.834%. Hence, it can be said that consumption of renewable energy starts impacting carbon intensity after reaching a certain limit. However, the strength of the relationship is low in these quantiles because the level of significance is 10%. Considering the patents, it can be seen that the relationship between patents and carbon intensity is significant in all quantiles. However, the 75th quantile shows the most noticeable impact where a 1% increase in patents reduces carbon intensity by 0.870%. In the case of innovation, only the 10th quantile show insignificant association with carbon intensity and in all other quantiles, innovation is significantly related to carbon intensity.
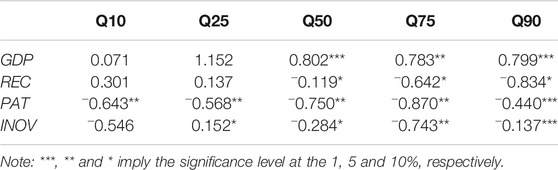
TABLE 6. Quantile regressions at each quantile.
Nevertheless, in the 25th quantile, there is a significant and positive relationship between innovation and carbon intensity. In 50th and above quantiles, innovation is reducing carbon intensity. The highest level of impact is in the 75th quantile, where a 1% increase in innovation reduces carbon intensity by 0.743%. The quantile regression also confirms that although high economic growth increases carbon intensity in Saudi Arabia. Still, carbon intensity can be controlled through the consumption of renewable energy, patents and innovation without interrupting the economy’s growth.
Robustness Tests
We have applied two robustness tests to further confirm our main findings, including Difference GMM (DGMM) and FGLS Estimates. The results of both tests are reported in Table 7. The results of the DGMM test validate the findings of the main analysis. The coefficients of renewable energy consumption, patents, and innovation are negative; however, the coefficient of GDP is positive, according to the expectations. In the case of FGLS estimates, coefficients of GDP and innovation are aligned with the results of OLS estimates; however, the coefficients of renewable energy consumption and patents are opposite. The relationship between renewable energy consumption and carbon intensity is insignificant, but the relationship between patents and carbon intensity is positive. It is also important to mention the null hypothesis of autocorrelation. Hence, it can be said that our models are free from autocorrelation issues. Also, there is no issue of heterogeneity, i.e. AR (2). Hence, instruments and error terms are not correlated.

TABLE 7. Robustness check with difference GMM (DGMM) and FGLS estimates.
Conclusion and Policy Implications
The main aim of the current study is to investigate the relationship of GDP, renewable energy consumption, patents, and innovation with carbon intensity in the Saudi Arabian context. Results of OLS regression suggest that an increase in GDP increases carbon intensity. However, an increase in renewable energy consumption, patents, and innovation helps mitigate carbon intensity. The quantile regression results also suggest that GDP is a significant contributor to carbon intensity, and rapid economic growth creates environmental issues in Saudi Arabia. Also, renewable energy consumption is a good solution because it helps decrease carbon intensity. Together, quantile regression also proved the significance of patents and innovation as a solution for the carbon intensity problem.
Following important policy implications can be established based on these findings.
• The government should encourage the private sector to invest in production and use renewable energy.
• Efforts should be made to modify the overall energy mix.
• Policymakers should encourage and make more strong environmental regulations to introduce more enhanced environment-related patents in the market.
• More resources should be allocated to make different sectors of the economy energy efficient so that sustainable development can be achieved.
• It is noted that in quantile regression, renewable energy is not significantly related to carbon intensity. To improve the impact of renewable energy consumption government should offer capital subsidies on renewable energy so that initial investments can be offset and more firms can try to develop or use renewable energy. (Özcan and Yıldırım, 2018). also, suggest that to enhance the use of renewable energy. Another way is to boost the investment in renewables through Feed-in-tariff. In this way, small producers will be encouraged to produce renewable energy making it less costly and promoting its use. It is also found by (Yang et al., 2021) that FIT is a much better strategy in terms of expected output and lower price.
• The government should encourage and support the use of energy-efficient technologies, which can be done through different policies and programs for public facilities and government operations. For this purpose, energy-related data management is essential. Also, building standards for energy efficiency for public buildings are a good option.
• Government should make sure that enough energy appliances and vehicles are available for public use so that carbon intensity due to the transportation sector can also be reduced.
• At the government level, renewable energy and energy-efficient operations and maintenance activities should be promoted.
• Tax credit for renewable energy production is also a valid option to promote the production of renewable energy from biomass and solid wastes.
Data Availability Statement
The raw data supporting the conclusions of this article will be made available by the authors, without undue reservation.
Author Contributions
MK proposed the idea and collect the data, supervised the process and review. GA did the econometric estimations, helped in writing.
Conflict of Interest
The authors declare that the research was conducted in the absence of any commercial or financial relationships that could be construed as a potential conflict of interest.
Publisher’s Note
All claims expressed in this article are solely those of the authors and do not necessarily represent those of their affiliated organizations, or those of the publisher, the editors and the reviewers. Any product that may be evaluated in this article, or claim that may be made by its manufacturer, is not guaranteed or endorsed by the publisher.
References
Adebayo, T. S., and Kirikkaleli, D. (2021). Impact of Renewable Energy Consumption, Globalization, and Technological Innovation on Environmental Degradation in Japan: Application of Wavelet Tools. Environ. Dev. Sustain. 23 (11), 16057–16082. doi:10.1007/s10668-021-01322-2
Adebayo, T. S., Oladipupo, S. D., Adeshola, I., and Rjoub, H. (2021). Wavelet Analysis of Impact of Renewable Energy Consumption and Technological Innovation on CO2 Emissions: Evidence from Portugal. Environ. Sci. Pollut. Res. doi:10.1007/s11356-021-17708-8
Adebayo, T. S., Oladipupo, S. D., Kirikkaleli, D., and Adeshola, I. (2022). Asymmetric Nexus between Technological Innovation and Environmental Degradation in Sweden: an Aggregated and Disaggregated Analysis. Environ. Sci. Pollut. Res., 1–8. doi:10.1007/s11356-021-17982-6
Ali, W., Rahman, I. U., Zahid, M., Khan, M. A., and Kumail, T. (2020). Do technology and Structural Changes Favour Environment in Malaysia: an ARDL-Based Evidence for Environmental Kuznets Curve. Environ. Dev. Sustain. 22 (8), 7927–7950. doi:10.1007/s10668-019-00554-7
Bradshaw, M., Van de Graaf, T., and Connolly, R. (2019). Preparing for the New Oil Order? Saudi Arabia and Russia. Energ. Strategy Rev. 26, 100374. doi:10.1016/j.esr.2019.100374
Budzianowski, W. M. (2012). Negative Carbon Intensity of Renewable Energy Technologies Involving Biomass or Carbon Dioxide as Inputs. Renew. Sustain. Energ. Rev. 16 (9), 6507–6521. doi:10.1016/J.RSER.2012.08.016
Cheng, Y., and Yao, X. (2021). Carbon Intensity Reduction Assessment of Renewable Energy Technology Innovation in China: A Panel Data Model with Cross-Section Dependence and Slope Heterogeneity. Renew. Sustain. Energ. Rev. 135, 110157. doi:10.1016/J.RSER.2020.110157
Cheng, C., Ren, X., Wang, Z., and Shi, Y. (2018). The Impacts of Non-fossil Energy, Economic Growth, Energy Consumption, and Oil price on Carbon Intensity: Evidence from a Panel Quantile Regression Analysis of EU 28. Sustainability 10 (11), 4067. doi:10.3390/su10114067
Cheng, C., Ren, X., Wang, Z., and Yan, C. (2019). Heterogeneous Impacts of Renewable Energy and Environmental Patents on CO2 Emission - Evidence from the BRIICS. Sci. Total Environ. 668, 1328–1338. doi:10.1016/j.scitotenv.2019.02.063
Dauda, L., Long, X., Mensah, C. N., and Salman, M. (2019). The Effects of Economic Growth and Innovation on CO2 Emissions in Different Regions. Environ. Sci. Pollut. Res. 26 (15), 15028–15038. doi:10.1007/s11356-019-04891-y
Farooq, M. U., Shahzad, U., Sarwar, S., and Zaijun, L. (2019). The Impact of Carbon Emission and forest Activities on Health Outcomes: Empirical Evidence from China. Environ. Sci. Pollut. Res. 26 (13), 12894–12906. doi:10.1007/s11356-019-04779-x
Fatima, T., Shahzad, U., and Cui, L. (2021). Renewable and Nonrenewable Energy Consumption, Trade and CO2 Emissions in High Emitter Countries: Does the Income Level Matter? J. Environ. Plann. Manage. 64 (7), 1227–1251. doi:10.1080/09640568.2020.1816532
Ganda, F. (2019). The Impact of Innovation and Technology Investments on Carbon Emissions in Selected Organisation for Economic Co-Operation and Development Countries. J. Clean. Prod. 217, 469–483. doi:10.1016/J.JCLEPRO.2019.01.235
Hashmi, S. H., Hongzhong, F., Fareed, Z., and Bannya, R. (2020). Testing Non-linear Nexus between Service Sector and CO2 Emissions in Pakistan. Energies 13 (3), 526–529. doi:10.3390/en13030526
Huang, J., Xiang, S., Wang, Y., and Chen, X. (2021). Energy-saving R&D and Carbon Intensity in China. Energ. Econ. 98, 105240. doi:10.1016/j.eneco.2021.105240
Ibrahiem, D. M. (2020). Do Technological Innovations and Financial Development Improve Environmental Quality in Egypt? Environ. Sci. Pollut. Res. 27 (10), 10869–10881. doi:10.1007/s11356-019-07585-7
Kirikkaleli, D., and Adebayo, T. S. (2021). Do renewable Energy Consumption and Financial Development Matter for Environmental Sustainability? New Global Evidence. Sustain. Dev. 29 (4), 583–594. doi:10.1002/sd.2159
Kirikkaleli, D., Güngör, H., and Adebayo, T. S. (2021). Consumption‐based Carbon Emissions, Renewable Energy Consumption, Financial Development and Economic Growth in Chile. Bus Strat. Env. doi:10.1002/bse.2945
Levin, A., Lin, C.-F., and James Chu, C.-S. (2002). Unit Root Tests in Panel Data: Asymptotic and Finite-Sample Properties. J. Econom. 108 (1), 1–24. doi:10.1016/S0304-4076(01)00098-7
Li, K., and Lin, B. (2016). China's Strategy for Carbon Intensity Mitigation Pledge for 2020: Evidence from a Threshold Cointegration Model Combined with Monte-Carlo Simulation Methods. J. Clean. Prod. 118, 37–47. doi:10.1016/J.JCLEPRO.2015.12.093
Li, Z., Mighri, Z., Sarwar, S., and Wei, C. (2021). Effects of Forestry on Carbon Emissions in China: Evidence from a Dynamic Spatial Durbin Model. Front. Environ. Sci. 9, 1–15. doi:10.3389/fenvs.2021.760675
Miao, Y., Razzaq, A., Adebayo, T. S., and Awosusi, A. A. (2022). Do renewable Energy Consumption and Financial Globalisation Contribute to Ecological Sustainability in Newly Industrialized Countries? Renew. Energ. 187, 688–697. doi:10.1016/J.RENENE.2022.01.073
Muhammad, B. (2019). Energy Consumption, CO2 Emissions and Economic Growth in Developed, Emerging and Middle East and North Africa Countries. Energy 179, 232–245. doi:10.1016/j.energy.2019.03.126
Özcan, M., and Yıldırım, M. (2018). The Impact of Capital Subsidy Incentive on Renewable Energy Deployment in Long-Term Power Generation Expansion Planning. Sakarya Univ. J. Comput. Inf. Sci. 1 (3), 1–19. doi:10.35377/saucis.01.03.468380
Rahman, M. M., Sultana, N., and Velayutham, E. (2022). Renewable Energy, Energy Intensity and Carbon Reduction: Experience of Large Emerging Economies. Renew. Energ. 184, 252–265. doi:10.1016/J.RENENE.2021.11.068
Ritchie, H., and Roser, M. (2020). Saudi Arabia: CO2 Country Profile. Our World in Data. Available at: https://ourworldindata.org/co2/country/spain?country=∼ESP (Accessed January 5, 2022).
Sarwar, S., and Alsaggaf, M. I. (2019). Role of Urbanization and Urban Income in Carbon Emissions: Regional Analysis of China. Appl. Ecol. Env. Res. 17 (5), 10303–10311. doi:10.15666/aeer/1705_1030310311
Sarwar, S., and Alsaggaf, M. I. (2021). The Role of Governance Indicators to Minimize the Carbon Emission: a Study of Saudi Arabia. Meq 32 (5), 970–988. doi:10.1108/MEQ-11-2020-0275
Sarwar, S., Alsaggaf, M. I., and Tingqiu, C. (2019). Nexus Among Economic Growth, Education, Health, and Environment: Dynamic Analysis of World-Level Data. Front. Public Health 7, 1–15. doi:10.3389/fpubh.2019.00307
Sarwar, S., Streimikiene, D., Waheed, R., and Mighri, Z. (2021). Revisiting the Empirical Relationship Among the Main Targets of Sustainable Development: Growth, Education, Health and Carbon Emissions. Sustain. Dev. 29 (2), 419–440. doi:10.1002/sd.2156
Sarwar, S. (2019). Role of Urban Income, Industrial Carbon Treatment Plants and Forests to Control the Carbon Emission in China. Environ. Sci. Pollut. Res. 26 (16), 16652–16661. doi:10.1007/s11356-019-04854-3
Shahzad, U., Sarwar, S., and Amin, W. (2018). The Relationships Among Economic Growth, Renewable Energy Consumption, CO2 Emissions and Agriculture Production: Empirical Evidence for China and India. Glob. Local Econ. Rev. 22 (1), 41–68. Available at: http://www.ipcc.ch/report/ar5/wg3/.
Shahzad, U., Ferraz, D., Nguyen, H.-H., and Cui, L. (2022). Investigating the Spill Overs and Connectedness between Financial Globalization, High-Tech Industries and Environmental Footprints: Fresh Evidence in Context of China. Technol. Forecast. Soc. Change 174, 121205. doi:10.1016/J.TECHFORE.2021.121205
Shaikh, S. A., Taiyyeba, Z., and Khan, K. (2018). The Nexus between Technological Innovation and Carbon Dioxide Emissions: Evidence from China. Nrjss 18, 181–193. doi:10.51239/nrjss.v0i0.77
Taylan, O., and Demirbas, A. (2016). Forecasting and Analysis of Energy Consumption for Transportation in the Kingdom of Saudi Arabia. Energ. Sourc. B: Econ. Plann. Pol. 11 (12), 1150–1157. doi:10.1080/15567249.2015.1004383
Tlili, I. (2015). Renewable Energy in Saudi Arabia: Current Status and Future Potentials. Environ. Dev. Sustain. 17 (4), 859–886. doi:10.1007/s10668-014-9579-9
Töbelmann, D., and Wendler, T. (2020). The Impact of Environmental Innovation on Carbon Dioxide Emissions. J. Clean. Prod. 244, 118787. doi:10.1016/J.JCLEPRO.2019.118787
Uddin, M. A., Ali, M. H., and Masih, M. (2017). Political Stability and Growth: An Application of Dynamic GMM and Quantile Regression. Econ. Model. 64, 610–625. doi:10.1016/j.econmod.2017.04.028
Vujović, T., Petković, Z., Pavlović, M., and Jović, S. (2018). Economic Growth Based in Carbon Dioxide Emission Intensity. Physica A: Stat. Mech. Its Appl. 506, 179–185. doi:10.1016/J.PHYSA.2018.04.074
Waheed, R., Chang, D., Sarwar, S., and Chen, W. (2018). Forest, Agriculture, Renewable Energy, and CO2 Emission. J. Clean. Prod. 172, 4231–4238. doi:10.1016/J.JCLEPRO.2017.10.287
Wang, Z., Yin, F., Zhang, Y., and Zhang, X. (2012). An Empirical Research on the Influencing Factors of Regional CO2 Emissions: Evidence from Beijing City, China. Appl. Energ. 100, 277–284. doi:10.1016/J.APENERGY.2012.05.038
Yang, D.-x., Jing, Y.-q., Wang, C., Nie, P.-y., and Sun, P. (2021). Analysis of Renewable Energy Subsidy in China under Uncertainty: Feed-In Tariff vs. Renewable Portfolio Standard. Energ. Strategy Rev. 34, 100628. doi:10.1016/J.ESR.2021.100628
Yu, Y., and Du, Y. (2019). Impact of Technological Innovation on CO2 Emissions and Emissions Trend Prediction on 'New Normal' Economy in China. Atmos. Pollut. Res. 10 (1), 152–161. doi:10.1016/J.APR.2018.07.005
Yu, S., Hu, X., Li, L., and Chen, H. (2020). Does the Development of Renewable Energy Promote Carbon Reduction? Evidence from Chinese Provinces. J. Environ. Manage. 268, 110634. doi:10.1016/J.JENVMAN.2020.110634
Zhang, R., Sharma, R., Tan, Z., and Kautish, P. (2022). Do export Diversification and Stock Market Development Drive Carbon Intensity? the Role of Renewable Energy Solutions in Top Carbon Emitter Countries. Renew. Energ. 185, 1318–1328. doi:10.1016/J.RENENE.2021.12.113
Keywords: carbon intensity, innovations, renewable energy, Saudi Arabia, quantile regression
Citation: Aziz G and Khan MS (2022) Empirical Relationship Between Creativity and Carbon Intensity: A Case of Saudi Arabia. Front. Environ. Sci. 10:856736. doi: 10.3389/fenvs.2022.856736
Received: 17 January 2022; Accepted: 08 February 2022;
Published: 01 March 2022.
Edited by:
Lianbiao Cui, Anhui University of Finance and Economics, ChinaReviewed by:
Tomiwa Sunday Adebayo, Cyprus International University, CyprusAbdul Rauf, Nanjing University of Information Science and Technology, China
Copyright © 2022 Aziz and Khan. This is an open-access article distributed under the terms of the Creative Commons Attribution License (CC BY). The use, distribution or reproduction in other forums is permitted, provided the original author(s) and the copyright owner(s) are credited and that the original publication in this journal is cited, in accordance with accepted academic practice. No use, distribution or reproduction is permitted which does not comply with these terms.
*Correspondence: Ghazala Aziz, Zy5heml6QHNldS5lZHUuc2E=