
95% of researchers rate our articles as excellent or good
Learn more about the work of our research integrity team to safeguard the quality of each article we publish.
Find out more
ORIGINAL RESEARCH article
Front. Environ. Sci. , 31 May 2022
Sec. Biogeochemical Dynamics
Volume 10 - 2022 | https://doi.org/10.3389/fenvs.2022.852344
This article is part of the Research Topic Physical and Biogeochemical Processes Driving Methane Sources, Sinks and Emissions in Aquatic Systems: The Past, Present and Future under Global Change View all 24 articles
 Alistair Grinham1*
 Cathryn O’Sullivan2
 Matthew Dunbabin3
 Katrin Sturm4
 Deborah Gale4
 William Clarke1
 Simon Albert1
Anaerobic methanogenesis is dependent on key macronutrients (carbon, nitrogen and phosphorus) and trace metals (including iron, nickel and cobalt) to drive methane production. Reservoir derived methane emissions have correlated to eutrophication status, with elevated emissions associated with more eutrophic systems. Additionally, sediment organic matter can enhance methane emissions, particularly through the ebullition pathway. As such, it is critical to understand how organic carbon and nutrient inputs into reservoir water columns and sediments drive methanogenesis to improve flooded land greenhouse gas emission estimates. In this study we examine the methane potential of sediments in mesotrophic (Little Nerang Dam) and eutrophic (Lake Wivenhoe) sub-tropical reservoirs under different nutrient and organic carbon availabilities using biological methane potential (BMP) tests. BMP tests were conducted with sediments incubated under anaerobic conditions using replicate controls (reservoir bottom waters) or treatments (excess nutrient and/or organic carbon availability). The results indicated that these systems are carbon limited. The addition of organic carbon significantly increases anaerobic methanogenesis by 20-fold over controls. Analysis of sediment samples from the reservoirs showed that both reservoirs were replete in key macronutrient and trace metal content for methanogenesis. Finally, a comprehensive catchment monitoring program of Little Nerang Dam measuring catchment inflow events, lateral transport of forest litter, and bulk atmospheric deposition showed that catchment inflows and lateral transport of forest litter were strongly linked to rainfall and accounted for more than 99% of the total annual load. This suggests the frequency of rainfall events is a critical driver of organic matter inputs that drive reservoir methane emissions in the humid, sub-tropical region.
Methane is the second most potent greenhouse gas and contributes up to 25% of global warming (Etminan et al., 2016). Aquatic systems account for up to 50% of global methane emissions (Rosentreter et al., 2021) with artificial reservoirs recognised as major contributors to this emissions source (Bastviken et al., 2011; Deemer et al., 2016; Harrison et al., 2021). Reservoir derived methane emissions have repeatedly been shown to be correlated with eutrophication status, with elevated emissions associated with more eutrophic systems (Deemer et al., 2016; DelSontro et al., 2018; Beaulieu et al., 2019). Additionally, sediment organic matter can enhance methane emissions, particularly through the ebullition pathway (Grinham et al., 2018; Berberich et al., 2019). As such, it is crucial to understand how eutrophication status and sediment organic matter in freshwater reservoirs drives methanogenesis to improve flooded land greenhouse gas emission estimates.
Methane production from anaerobic methanogenesis is dependent on key macronutrients including carbon for energy production, nitrogen for protein biosynthesis and phosphorus for nucleic acid synthesis and co-enzyme production (Takashima et al., 1990; Hullebusch et al., 2019). In addition, the enzymatic pathway in methanogenesis is highly metal rich (Zerkle et al., 2005) and all methanogens require iron, nickel and cobalt (Jarrell and Kalmokoff, 1988; Wang et al., 2019) with iron involved in virtually all metalloenzymes (Glass and Orphan, 2012). Eutrophication will increase nitrogen and phosphorus inputs to reservoir sediments whereas organic matter loading will increase carbon availability to reservoir sediments. However, a key area of uncertainty lies in how these sediment methanogenic communities respond to these competing drivers and which of these nutrients is limiting methane production. Reservoir sediments are highly reducing environments (Brannon et al., 1985) generally dominated by metal-rich silt or clay particles (Morris and Fan, 1998; van Rijn, 2012) and there is an extensive body of literature examining metal cycling in freshwater sediments (Boudreau, 1999; Ehrlich et al., 2015; Bianchi, 2021). However, there is a second area of uncertainty as there are few studies that examine the availability of these key trace metals for microbial uptake in sub-tropical reservoir sediments.
A third area of uncertainty in sub-tropical reservoirs lies in the loading of key macronutrients (including carbon, nitrogen and phosphorus) to the sediment zone. These depositional environments can receive macronutrient loading through multiple pathways including: catchment inflow events (Burford et al., 2012; Michalak, 2016); lateral transport of forest litter to stream networks or reservoir shoreline (Tonin et al., 2017); and atmospheric deposition directly into the reservoir surface waters (Tipping et al., 2014; Kanakidou et al., 2016). However, there are limited studies that have examined the relative contribution of all three pathways to reservoir macronutrient loading.
To address these three areas of uncertainty the objectives of this study are as follows: 1) examine the methane potential of sediments in sub-tropical reservoirs under different nutrient and organic carbon availabilities; 2) characterise reservoir sediments in terms of key macronutrient and trace metal availability for anaerobic methanogenesis; and 3) quantify key macronutrient loading to reservoirs from multiple pathways across the annual cycle.
Lake Wivenhoe and Little Nerang Dam are located in South East Queensland, Australia and the primary use for both reservoirs is urban water supply (Figures 1A,B). Lake Wivenhoe is located on the Brisbane River system and is the largest reservoir in the region with construction completed in 1985 (Figure 1C). Reservoir surface area at full supply level (FSL) is 10,750 ha with a storage capacity of 1.17 × 10⁹ m3. The catchment area is 7,020 km2 and is a relatively degraded catchment with more than 50% modified from natural condition (Gale, 2016). Construction of Little Nerang Dam was completed in 1961 and is located on the Nerang River system (Figure 1D). Reservoir surface area at full supply level (FSL) is 49 ha with a storage capacity of 6.71 × 10⁶ m3. The catchment area is 35 km2 and is a relatively unmodified catchment with only 17% modified from natural condition (Gale, 2016). The natural condition of both catchments was dominated by dry and wet sclerophyll forest consisting typically of mixed eucalypt, casuarina, and wattle forest (Hubble et al., 2010; Kemp et al., 2019). Catchment modification of both reservoirs is primarily for agriculture and is dominated by grazing land use (QLUMP, 2018) and reservoir water quality in this region is strongly correlated with their catchment land use (Burford et al., 2007). The highly modified catchment of Lake Wivenhoe has resulted in it being characterised as eutrophic whilst the relatively unmodified catchment of Little Nerang Dam has resulted in this reservoir being characterised as mesotrophic (Rigosi et al., 2015).
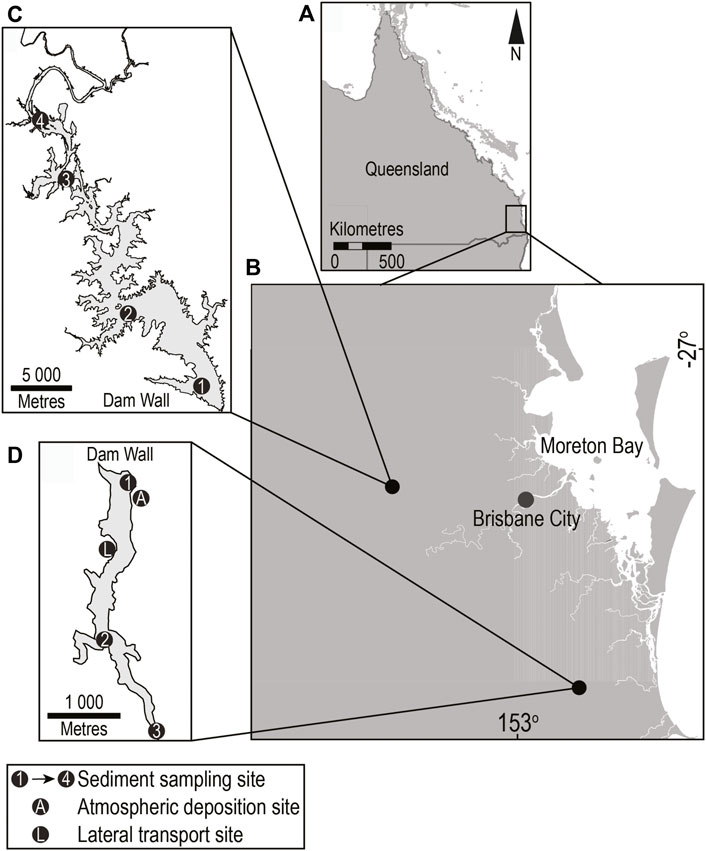
FIGURE 1. Study area relative to (A) Queensland, Australia and (B) South East Queensland showing location of sampling sites on (C) Lake Wivenhoe and (D) Little Nerang Dam.
To address study objective 1, a series of biological methane potential (BMP) tests on sediments from the eutrophic reservoir, Lake Wivenhoe, and the mesotrophic reservoir, Little Nerang Dam, were conducted:
1) to investigate whether reservoir sediments can act as an inoculum to initiate methane production;
2) to assess the impact of adding nutrients and organic carbon, in the form of cellulose, on the sediment methane generation rate.
Sediments were sampled from four sites in Lake Wivenhoe (Figure 1C) and three sites in Little Nerang Dam (Figure 1D) covering riverine (inflow), transition and lacustrine zones in January and February 2009 (Supplementary Figure S3). Sediment samples for BMP tests were collected from each reservoir sampling site using a 250 cm2 Van Veen sediment grab (K.C Denmark A/S, Silkeborg, Denmark) and transferred to ziplock bags. As much as possible, air was excluded from the bags and they were stored on ice for transport back to the laboratory. Sediments were divided into two subsamples; one for analysis and another for use as inoculum for biological methane tests described below. Samples were stored at 4°C for a maximum of 24 h prior to processing. Sediment samples from all sites were subjected to moisture content, volatile solids analysis and particle size analysis. Total solids and moisture content were determined gravimetrically after drying to constant weight at 110°C. While volatile solids (VS.) were determined by combusting the dried samples at 550°C for 2 h (APHA, 2005). Particle size distribution was analysed using the laser diffraction method (Malvern Mastersizer 2000E, Malvern Instruments Ltd., UK) where samples were sonicated for 1 min prior to analysis to ensure true particle size was measured (Sperazza et al., 2004). Percent sand (2 mm–63 μm fraction), silt (63–2 μm fraction) and clay (<2 μm fraction) were then derived for each sample and classified following Folk (1974). Sediment characterisation data from BMP sampling sites is presented in Supplementary Table S1.
The methane producing potential of the sediments was measured under ideal conditions according to the method of Owen et al. (1979). Three treatments were conducted on sediments from each sample site with a minimum of five replicates per site. In each replicate treatment 10 g of sediment was place in a 160 ml Wheaton serum bottle. This served as both substrate and inoculum for the BMP tests. For the baseline treatment (Sediments), 100 ml of reservoir bottom water and 0.1 ml of the redox indicator, Rezasurin, were added to the serum bottle. In the second treatment (Sediments + Nutrients), the impact of the addition of excess nutrients (including ammonia, phosphate, cobalt, iron and nickel) was tested by replacing the lake water with 100 ml of BMP media (Owen et al., 1979). In the third treatment (Sediments + Nutrients + Cellulose), the impact of the addition of labile carbon and nutrients was tested by adding 1 g of 50 µm microcrystalline cellulose (Sigma-Aldrich Pty Ltd., North Ryde, NSW, Australia) along with 100 ml of BMP media.
Preparation of the BMP nutrient solution is a complex, multistep process designed to ensure the final solution and headspace are free from dissolved and gaseous oxygen. Full details of how to prepare the solution can be found in Owen et al. (1979). The final solution concentrations used in the sediment + nutrient and sediment + nutrient + cellulose treatments are described in Table 1.
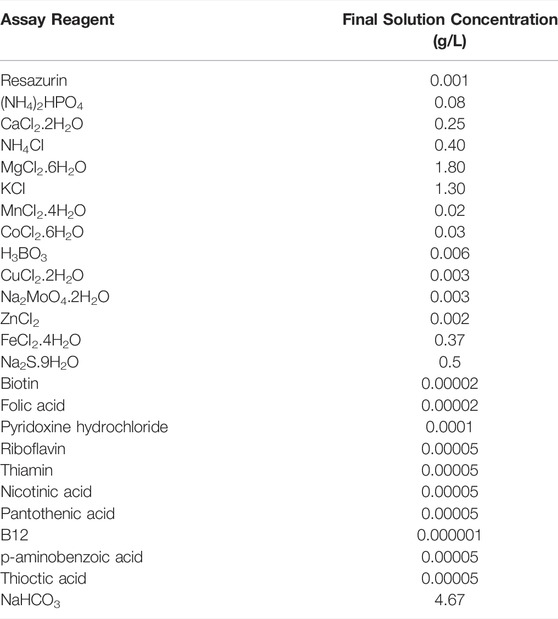
TABLE 1. Nutrient concentration in biological methane potential (BMP) test solution prepared according to Owen et al. (1979).
All bottles were sealed with butyl rubber stoppers and aluminium crimp seals after purging with nitrogen gas to create an anaerobic head space. The bottles were incubated at 38°C. It is acknowledged that this temperature is significantly higher than ambient temperatures experienced reservoir bottom waters, however, this was chosen to assess the maximal rates of methane generation from the sediments. The vast majority of research using BMP tests comes from experiments assessing the degradability of organic materials for anaerobic digestion. These tests are generally conducted at mesophilic temperatures (30–38°C) because this temperature range is sufficient to support significant microbial activity (Raposo et al., 2012). Psychrophilic temperatures (<20°C) generally result in a decrease in microbial activity. While thermophilic temperatures (45–60°C) may further increase methane generation rates the improvements are not large enough to justify their use. The rates of methane generation recorded in the BMP tests are unlikely to occur at the temperatures observed in the reservoir bottom waters (14–21°C, Supplementary Figure S3), but the impact of the addition of carbon and nutrients on the volume of methane produced is likely to be similar regardless of temperature.
The bottles were sampled weekly for gas volume by connection to a water filled manometer for a minimum of 7 weeks. At each sampling event, a 10 ml sample of the head space gas was collected for analysis of methane content by gas chromatography (GC). The methane content of the gas samples (v/v%) was measured using a Perkin Elmer Autosystem GC as described previously (APHA, 2005; O'Sullivan et al., 2005).
To address study objective 2, undisturbed sediment cores for macronutrient and metal content analysis were collected from each BMP sampling site using a gravity corer (Envco Environmental Equipment Suppliers, Australia) and acrylic liners (69 mm inner diameter, 500 mm long). Sediment porewaters were extracted in the field directly from the cores using 0.2 μm sippers (Rhizon CSS samplers, Rhizosphere Research Products B.V., Netherlands) positioned laterally through pre-drilled holes into the acrylic liner. Porewaters were passively drawn out of the sediments using evacuated 12 ml exetainers (Lab Co., Ceredigion, UK) with samples then stored on ice for transport to the laboratory. Porewater samples were analysed for macronutrient and trace metal content and were assumed to represent the dissolved fraction. Sediment samples for the total fraction were manually collected directly into sterile 250 ml glass jars from the upper 10 cm of each sediment core. Samples were placed on ice in the dark for transport to the laboratory. Analysis of key macronutrient (TOC, TN and TP) and metal content was undertaken at the National Association of Testing Authorities (NATA) accredited laboratory, Environmental Analysis Laboratory (EAL), Southern Cross University, Lismore, Australia and followed the methodology of Rayment and Lyons (2010). Sediment TOC and TN analysis was undertaken using a CNS-2000 Combustion Analyzer (LECO Corporation, United States) and TP and metal content (Method APHA 3125; APHA, 2005) was analysed by inductively coupled plasma mass spectrometry (ICP-MS). Porewater dissolved organic carbon (DOC) was analysed using a LECO CNS-2000 Combustion Analyzer (Method APHA 5310-B; APHA, 2005), ammonia and phosphate were analysed using flow-injection analysis (FIA) colorimetry (Lachat QuikChem 8,000) (Method APHA 4500; APHA, 2005) and trace metals were analysed using ICP-MS (Method APHA 3125; APHA, 2005).
To address study objective 3, a series of field campaigns were undertaken to monitor each of the reservoir loading pathways as previously described in the Introduction section. Macronutrient loading due to lateral transport of forest litter and from bulk atmospheric deposition were both monitored over the 2010 annual cycle. Loading due catchment inflows was monitored over a 5 year period from 2009 to 2013 (Supplementary Figure S6). It should be noted that sampling events for the lateral transport, catchment inflow and atmospheric deposition were somewhat infrequent and therefore these data are subject to considerable uncertainty, both spatially and temporally. They do, however, provide an estimate of the magnitude of the different input pathways relative to each other. Detailed methodology for each pathway is provided in the sections below.
Lateral transport of forest litter (expressed as g m−1 shoreline d−1 rather than lateral transport velocity) was monitored at a single site located on the western shoreline of Little Nerang Dam approximately 2 m above reservoir full supply level (Figure 1D). Lateral traps were constructed from stainless wire frames (250 by 250 mm) with a nylon mesh (10 mm pore size) bag on the downhill side. Traps were deployed parallel to the shoreline and spaced approximately 5 m apart. Each trap sampled a ground length of 0.25 m and samples were collected at approximately monthly intervals. Trap contents were transferred to sealed bags, transported to the laboratory and then dried to a constant weight at 60°C. Dry weights (g) were normalised to the ground sampling length (m) and deployment time (d) with rates expressed as (g m−1 d−1). In addition, litter samples from February, March and October were analysed for key macronutrient (TOC, TN and TP) and metal content using at the NATA accredited EAL, Southern Cross University, Lismore, Australia. TOC and TN analysis was undertaken using a CNS-2000 Combustion Analyzer (LECO Corporation, United States) following In-house method S4a (NATA, 2021). TP and metal content was analysed by inductively coupled plasma optical emission spectrometry (ICP-OES) following Method APHA 3125 (APHA, 2005).
Additional details of the catchment are provided in Supplementary Material. To further understand forest litter transport, a permanent transect was established in western catchment area of Little Nerang Dam starting immediately upslope of the lateral transport monitoring site. Three additional monitoring sites were located along an altitudinal gradient (400 m—high; 300 m—mid; and 200 m—low) as shown in Supplementary Figure S2. At each site vegetation surveys, vertical forest litter fall rates monitoring and soil characterisation were undertaken with detailed methodology described in Supplementary Material Sections S1.2 to S1.4 and findings presented in Supplementary Material Sections S2.2 to S2.4 and S2.6.
The study region is in the humid sub-tropics where the majority of rainfall occurs during summer months (December to February) and more than 50% of the total annual rainfall occurs through heavy rainfall days (Supplementary Figure S1) due to localised storm activity or major rainfall events such as east coast lows (Dowdy et al., 2013). In addition, daily rainfall totals in excess of 100 mm are observed several times across the annual cycle in the Little Nerang Dam catchment (Supplementary Figure S1). These major rainfall events, in combination with the steep catchment (Supplementary Figure S2), results in high energy inflows to the reservoir capable of transporting large quantities of dissolved and particulate matter. Access to reservoir inflow points during high flows is limited by health and safety risks and, therefore, only a single inflow was sampled during the 2010 monitoring period. However, five additional event sampling campaigns were undertaken over a 5 year period from 2009 to 2013 (Supplementary Figure S6). For each campaign, sampling was undertaken on the reservoir as close as possible to catchment inflow points. Samples were collected approximately 30 cm below the water surface using MilliQ water washed high density polyethylene (HDPE) sample containers following state sampling guidelines (DES, 2018). Sub-surface sampling minimised the likelihood of sampling large (<10 mm) particulate organic matter from lateral litter transport in the upper catchment regions. Samples were placed on ice for transport to the laboratory and macronutrient analyses were conducted by the NATA accredited EAL, Southern Cross University, Lismore, Australia. TOC was analysed using a CNS-2000 Combustion Analyzer (Method APHA 5310-B; APHA, 2005) and TN and TP were analysed using flow-injection analysis (FIA) colorimetry (In-house method W4; NATA, 2021).
Bulk deposition of the macronutrients TOC, TN and TP was monitored at a single site located in a forest clearing near the wall of Little Nerang Dam following the methodology detailed in Huston et al. (2009). Samplers were constructed of polyvinyl chloride (PVC) funnels (110 mm diameter, surface area = 0.0095 m2) inserted into a 2 L HDPE plastic bottle wrapped in aluminium foil to exclude light. Funnels and bottles were washed using Milli-Q water prior to deployment. Samplers were housed in PVC pipes (90 mm diameter, 300 mm length), mounted 2 m above the ground level and a minimum of 50 m from surround forest. Three replicate samples were collected on a weekly to monthly frequency over a 10 month period (Feb–December 2010). Field and rinsate blanks were used for quality control (DES, 2018). Sealed sample bottles with 100 ml Milli-Q water were deployed alongside field samplers for each deployment. In addition, a new sampler was processed alongside the deployed samplers during field collection. All samples were placed on ice for transport directly to the laboratory with all macronutrient analyses conducted by the NATA accredited Queensland Health, Forensic and Scientific Services (QHFSS), Brisbane, Australia. TOC was analysed using a Shimadzu TOC-L carbon analyser and TN and TP were analysed using flow-injection analysis (FIA) colorimetry (APHA, 2005). Bulk atmospheric deposition rates of individual macronutrients (mg m−2 d−1) were calculated using the mass of TOC, TN or TP (mg) deposited over the deployment time (d) and normalised to the funnel surface area (m2).
Annual loading rates of total organic carbon, total nitrogen and total phosphorus were estimated for three loading pathways: catchment inflow, later litterfall transport and atmospheric deposition using the following approaches:
Annual catchment inflow loading was calculated using the 2010 inflows (Figure 4A) and the median concentration of TOC, TN and TP from event monitoring campaigns (Figure 5). Loading was expressed as tonnes per year (t y−1) and the uncertainty range was generated using the interquartile range in inflow macronutrient concentrations (Figure 5).
Annual loading due to lateral transport of leaf litter was calculated from the median transport rates (Figure 4B) and the forest litter macronutrient content (Table 3) to generate annual transport rates of TOC, TN and TP per metre. These per metre rates were then scaled to the catchment by the combined lengths of the reservoir shoreline and the higher order stream network (34.2 km total). Loading was expressed as tonnes per year (t y−1) and the uncertainty range was generated using the interquartile range in lateral transport rate (Figure 4B) and the upper and lower litter macronutrient content (Table 3).
Annual loading due to atmospheric deposition was calculated using the annual median bulk deposition rates of TOC, TN and TP (Figure 6) and the annual average reservoir surface area for 2010. Loading was expressed as tonnes per year (t y−1) and the uncertainty range was generated using the interquartile range in macronutrient bulk deposition rate (Figure 6).
As noted above, these estimates are based on data collected at discrete sampling points spread out in both time and space. They are not intended to provide a precise nutrient budget of the reservoirs. Rather, they have been conducted to provide an estimate of the difference in magnitude between the three different input pathways.
Statistical analyses of sediment BMP tests and forest litter lateral transport rates using factorial or one-way analysis of variances (ANOVAs) were performed using the software program Statistica 13 (Dell Inc., 2016). Raw sediment BMP normalised methane production rate data was first classified into individual reservoirs (Little Nerang Dam; Lake Wivenhoe) and treatment (sediment; sediment and nutrients; sediment, sediment, nutrients and cellulose) and these categories were used as the categorical predictors with sediment BMP normalised gas production rates as the continuous variable. A factorial ANOVA was used to examine differences between reservoirs and/or treatment, however, no significant interaction was found between sediment BMP tests at the reservoir level (F(1, 128) = 1.27, p = 0.261) and differences were examined at the treatment level. In addition, no significant interaction was observed between sites within each reservoir for individual treatments with the exception of the nutrient treatments in Little Nerang Dam and a one-way ANOVA was used to examine site differences. To examine the effect of precipitation on forest litter lateral transport rates, raw data was first pooled into two categories (runoff or no runoff) depending if catchment runoff occurred in the deployment period. A one-way ANOVA was used to examine differences in forest litter lateral transport rates and these categories were used as the categorical predictors. Post hoc tests were performed using Fisher’s least significant difference (LSD) test (Zar, 1984). The non-parametric Kruskal–Wallis (KW) test was used as the continuous data failed to satisfy the assumptions of normality or homogeneity of variance even after transformation.
Reservoir sediments incubated with both organic carbon and nutrient rich media had significant higher methane generation rates (F(2, 128) = 100.50, p < 0.001) compared with sediment incubated in bottom water and only nutrient rich media (Figure 2). The median methane generation rate from sediments incubated with organic carbon was 6.2 (IQR: 3.5–9.5) ml g VS−1 d−1 (mL of methane produced per Gram of volatile solids added to the incubation per day, where volatile solids represents the degradable organic material and is measured by combustion at 550°C) with a maximum rate of 25.8 ml g VS−1 d−1. Median methane generation rates from sediments incubated without organic carbon were an order of magnitude lower (Figure 2). The median methane generation rate from sediments incubated in bottom waters was 0.29 (IQR: 0.02–0.71) ml g VS−1 d−1 with a maximum rate of 1.7 ml g VS−1 d−1. The median methane generation rate from sediments incubated in nutrient media only was 0.52 (IQR: 0.28–1.01) ml g VS−1 d−1 with a maximum rate of 5.1 ml g VS−1 d−1. Whilst the addition of nutrient rich media led to a small increase in the methane generation compared to sediments incubated in bottom waters, however, this increase is not statistically significant (Figure 2).
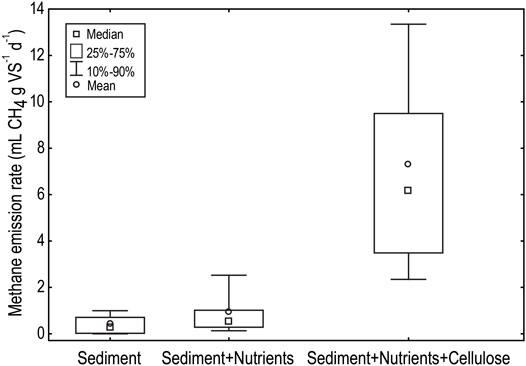
FIGURE 2. Biological methane potential of sediments from Little Nerang Dam and Lake Wivenhoe when incubated in reservoir bottom waters (Sediment), BMP media (Sediment + Nutrients) or BMP media supplemented with the organic carbon, cellulose (Sediment + Nutrients + Cellulose).
The high level of variability in methane generation rates observed in sediments from Little Nerang Dam under the nutrients treatment (Figure 3) is primarily due to different responses from the sediments from the headwaters of the dam (Site 3 Figure 1D). The addition of nutrients to sediments from the two sites closer to the dam wall (Site 1 and 2 Figure 1D) had little impact on methane generation whilst the addition of nutrients to the sediments from the headwaters led to a significant, order of magnitude, increase (F(2, 15) = 10.90, p < 0.005) in the methane generation rate (Figure 3).
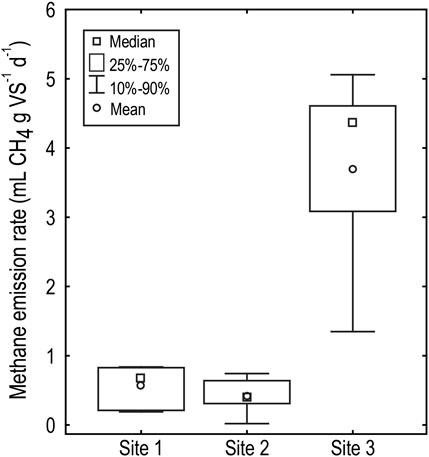
FIGURE 3. Biological methane potential (mL g VS-1 d-1, mL of methane produced per gram of volatile solids added to the incubation per day, where volatile solids represents the degradable organic material and is measured by combustion at 550°C) of sediments from three sampling sites in Little Nerang Dam when incubated with nutrient media. Site locations are shown in Figure 1D.
Total and dissolved fractions of key macronutrients and trace metals were detected in all reservoir sediments sampled (Table 2). Macronutrients and trace metals in the total sediment fraction were similar for all parameters between Lake Wivenhoe and Little Nerang Dam with the exception of organic carbon and carbon to nitrogen ratio (C:N). Average organic carbon content and C:N were one order of magnitude lower in Lake Wivenhoe compared to Little Nerang Dam (Table 2). Dissolved fractions of sediment macronutrients and trace metals were similar across all parameters between the reservoirs and average ammonia and iron concentrations exceeded 39 and 20 mg L−1, respectively (Table 2).
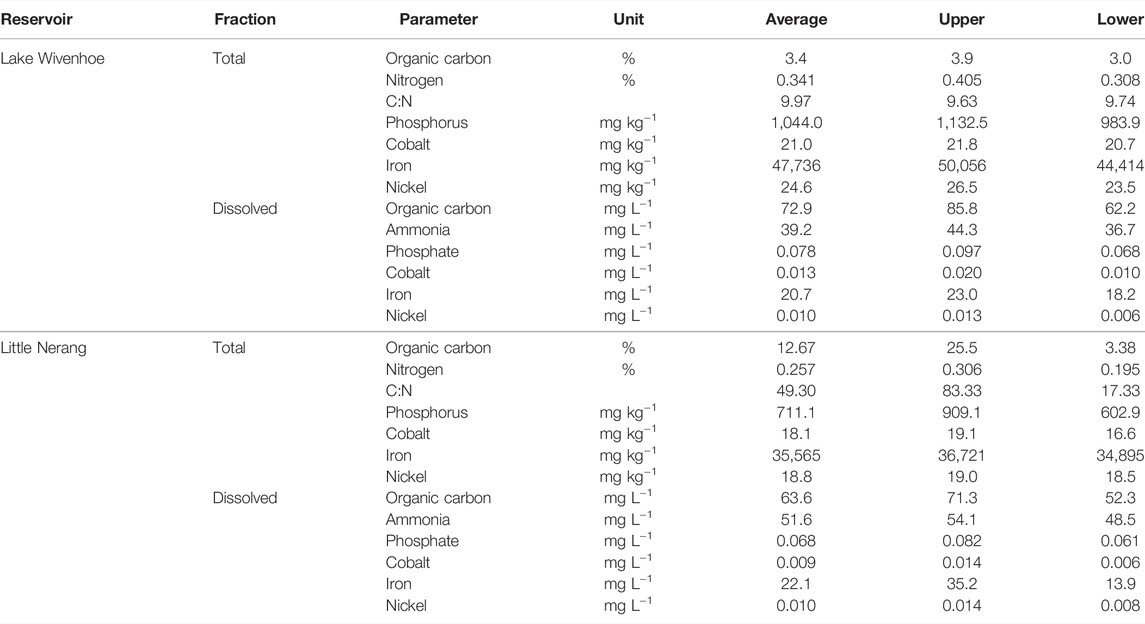
TABLE 2. Total and dissolved fractions of selected key sediment macronutrient and trace metals from Lake Wivenhoe and Little Nerang Dam.
Monitoring of forest litter lateral transport rates over the annual cycle included five separate inflows events closely associated with major catchment rainfall (Figure 4A). Elevated rates of lateral transport were observed following each catchment runoff event with the exception of the May event (Figure 4B). Significantly higher rates (KW H(1,32) = 14.7, p < 0.001) of forest litter lateral transport were observed following runoff events as opposed to no runoff events (Supplementary Figure S10) where median lateral transport rates (4.7 g m−1 d−1) following catchment runoff were over one order of magnitude higher than rates where no runoff occurred (0.4 g m−1 d−1). It is assumed the lateral transport rates observed at the shoreline site are representative of the catchment given the relatively constant hillslope (Supplementary Figure S7) and similar rates of vertical forest litterfall across the altitudinal gradient (Supplementary Figure S8).
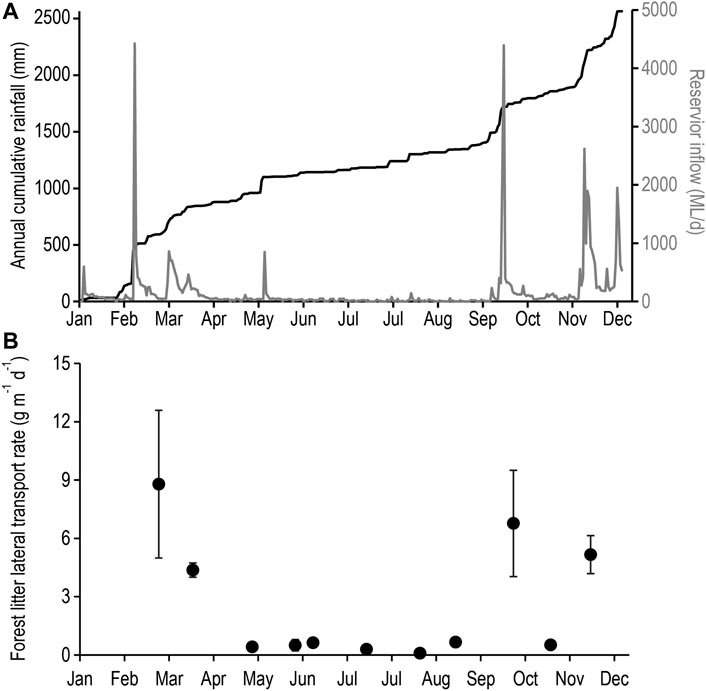
FIGURE 4. (A) Cumulative rainfall (black line) and catchment inflow (grey line); and (B) forest litter lateral transport rate per unit shoreline (g m-1 shoreline d-1) from Little Nerang Dam across the 2010 annual cycle.
Analysis of forest litter macronutrient content indicated this to be a major source of organic carbon to reservoir sediments. Total organic carbon content were two to three orders of magnitude higher than total nitrogen and total phosphorus, respectively (Table 3). Average nitrogen content was 0.8%, phosphorus was 0.04% and organic carbon was over 50%. The elevated carbon contents and high carbon to nitrogen ratios suggest that this material is relatively degradable. In addition, forest litter was found to contain detectable quantities of the key trace metals, with iron content two orders of magnitude higher than and cobalt (Table 3). Forest litter collected in lateral traps consisted almost exclusively of eucalypt leaves and eucalypts were the dominant canopy trees at all sites surveyed (Supplementary Table S4).
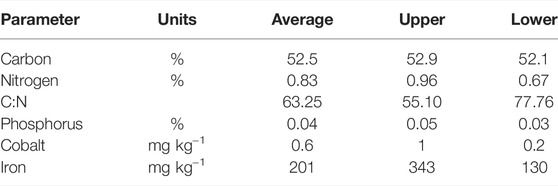
TABLE 3. Forest litter macronutrient and mineral content from thee sampling events during lateral transport monitoring at Little Nerang Dam.
Monitoring of catchment inflow events over six separate inflows events across a 5 year monitoring period revealed a consistent pattern with total phosphorus concentrations and order of magnitude lower than total nitrogen and two orders of magnitude below total organic carbon concentrations (Figure 5). Median TP, TN and TOC concentrations of inflows were 0.180 (IQR: 0.110–0.200), 0.995 (IQR: 0.787–1.135) and 10.5 (IQR: 9.0–11.3) mg L−1, respectively (Figure 5).
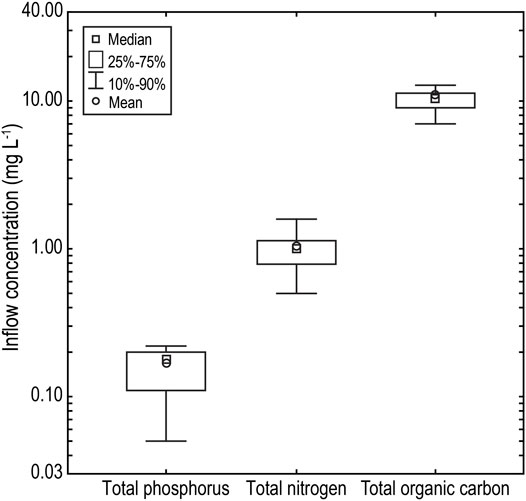
FIGURE 5. Macronutrient (TP, TN and TOC) concentration of catchment inflow waters to Little Nerang Dam over a 5 year monitoring period from 2009 to 2013.
Bulk atmospheric deposition rates of macronutrients across the annual cycle revealed a consistent pattern with TP rates an order of magnitude lower than TN and TOC rates (Figure 6). Median daily rates of TP, TN and TOC bulk deposition were 0.152 (IQR: 0.073–0.240), 1.658 (IQR: 1.082–2.093) and 4.296 (IQR: 3.183–5.650) mg m−2 d−1, respectively (Figure 6).
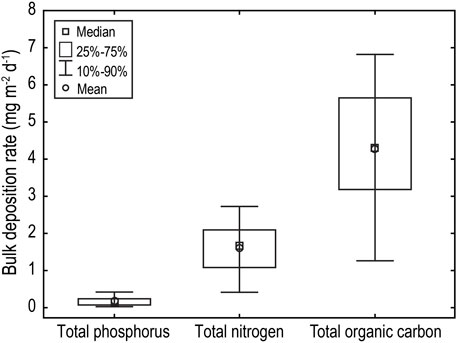
FIGURE 6. Average daily bulk atmospheric deposition of macronutrients (TP, TN and TOC) to Little Nerang Dam over a 10 month monitoring period from Febuary to December 2010.
Annual scaling of macronutrient loading to Little Nerang Dam across all three pathways was dominated by catchment inflows following major rainfall events. These inflows accounted for 57% of TOC annual loading, 88% of TN annual loading and 96% of TP annual loading (Table 4). Lateral litter transport accounted for 42% of TOC annual loading, 11% of TN annual loading and 3% of TP annual loading (Table 4). Atmospheric deposition was a relatively minor pathway and accounted for less than 1% of TOC, TN, and TP annual loading (Table 4). Estimated annual loading for TOC was highly variable with the interquartile range almost three times the median rate whereas the interquartile range was less than the median rate for both TN and TP (Table 4).

TABLE 4. Annual macronutrient loading to Little Nerang Dam reservoir from three pathways: catchment inflow; lateral litter transport; and atmospheric deposition.
Understanding how sediment methanogenic communities respond to nutrient and organic carbon loading is essential to refine global methane budgets and manage emissions from flooded lands. This study demonstrated that all reservoir sediments tested contain native, hydrolytic, acidogenic and methanogenic microbial communities capable of degrading the organic carbon present in the sediments and generating methane. In addition, the laboratory tests demonstrated organic carbon is a key limiting macronutrient to methanogenic communities in the sediments of both the eutrophic and mesotrophic reservoirs. In all cases, adding a readily degradable form of organic carbon led to a significant increase in methane generation, directly supporting the findings of Grasset et al. (2018) who demonstrated the addition of fresh organic carbon greatly stimulated methane production in freshwater anoxic sediments. Given all reservoir sediments sampled in this study were replete in key macronutrient and trace metal content for methanogenesis (Table 2), organic carbon loading to the sediment zone will, therefore, likely stimulate in situ methanogenic communities. This is supported by Boon and Mitchell (1995) who demonstrated a 400%–500% increase in methanogenesis rates when freshwater sediments from southeast Australia were incubated with eucalypt leaves under ambient temperatures. Together, these findings suggest organic carbon loading is an important driver of anaerobic methanogenesis in mesotrophic and eutrophic sub-tropical reservoirs. This has been demonstrated in temperate freshwater lakes, impoundments, reservoirs and coastal sediments (Kelly and Chynoweth, 1981; Maeck et al., 2013; Tittel et al., 2019; Jilbert et al., 2021).
The significant response in BMP tests between sites observed in the nutrient treatment from Little Nerang Dam is a key finding. Sediments from sites further from the dam wall had elevated volatile solids contents (Supplementary Table S1) and displayed increased methane generation rate upon addition of nutrient solution without cellulose addition (Figures 2, 3). Similar spatial heterogeneity in methane ebullition has been reported by DelSontro et al. (2011) in tropical reservoir, Lake Kariba.
This is likely due to the proximity of these sediments to catchment inflow points which are rich in organic carbon in the form of forest litter (Supplementary Table S1). These sediments are, therefore, more nutrient limited (and less carbon limited) than the sediments closer to the dam wall which contain lower organic matter content and are, potentially, carbon limited (Supplementary Table S1). This nutrient limitation in sediments adjacent catchment inflows has important implications for reservoir emissions as these are major ebullition zones (Grinham et al., 2018) accounting for over 90% of total reservoir emissions (Grinham et al., 2011). Any increase in reservoir nutrient loading, in areas where organic carbon is not limiting, would likely stimulate in situ sediment methanogenesis as well as total reservoir emissions. This provides one potential mechanism as to how eutrophication will exacerbate inland water methane emissions and supports the findings of regional and global correlation studies (Bastviken et al., 2004; Deemer et al., 2016; DelSontro et al., 2016; West et al., 2016; Beaulieu et al., 2019). An additional observation in terms of macronutrient limitation lies in the ratio of available nitrogen (ammonia) to phosphorus (phosphate) observed in the reservoir sediment porewaters. The N:P ratio ranged from 503 in Lake Wivenhoe to 759 in Little Nerang Dam (Table 2) and is one to two orders of magnitude higher than N:P ratio from cellular elemental stoichiometry for methanogens which ranges between 5 and 19 (Takashima et al., 1990). This suggests relative phosphorus limitation occurs in sediment porewaters and is a potential contributing factor to the strong relationship found between TP and methane emissions globally (Deemer et al., 2016; DelSontro et al., 2016; Beaulieu et al., 2019).
Scaling of annual macronutrient loading to Little Nerang Dam highlighted the importance of lateral transport of forest litter as an organic carbon loading pathway contributing almost 50% of the total annual load (Table 4). The high carbon content and C:N ratio of the organic material entering Little Nerang Dam via lateral transport suggests that this material is relatively fresh and highly degradable. Therefore, this loading pathway of organic carbon to reservoirs is an important consideration to improve understanding of reservoir methane generation and emissions (Tittel et al., 2019). The significantly higher forest litter lateral transport rates observed following runoff events supports the finding that precipitation is the major control of plant litter dynamics in tropical biomes (Tonin et al., 2017). From the data collected in this study it is not possible to comment on whether methane emission event corresponded with rainfall events because there was no coordinated schedule of methane sampling following rainfall events. It is highly likely that there will be a delay between organic matter deposition due to rainfall events and methane emission events. Organic matter inflows can be expected to be highly sporadic and coincide with high rainfall events, but the microbial processing of organic matter that is deposited in bottom waters and sediments involves several steps (solubilisation, acidification and methanogenesis) which are influenced by factors other than rainfall inflows. The degradation of highly lignified material is likely to be slow, particularly under anaerobic conditions, and therefore methane emissions are likely to occur over longer timescales and may not be correlated with inflow events (Xu et al., 2019).
Bulk atmospheric deposition was a minor macronutrient loading pathway to Little Nerang Dam reservoir (Table 4). This is supported by Adams et al. (2014) who found atmospheric deposition to be an insignificant loading pathway in a southeast Australian agricultural catchment. However, the ubiquitous nature of atmospheric deposition across the catchment will likely increase productivity of the forest and contribute to reservoir loading via litterfall. The contribution of atmospheric deposition to productivity has been observed in the tropical forests of French Guinea (van Langenhove et al., 2020). Catchment inflow was the major loading pathway to Little Nerang Dam for all macronutrients monitored (Table 4). The importance of this pathway for loading of organic carbon, nitrogen and phosphorus to stream networks and reservoirs is well established (Burford et al., 2007; O'Brien et al., 2016; Johnson et al., 2018). Catchment inflows and later transport of forest littler accounted for more than 99% of the total TOC, TN and TP annual load to Little Nerang Dam (Table 4). It is, therefore, important that future evaluations of macronutrient loading to reservoirs, particularly in the sub-tropics and tropical regions, consider both loading pathways in their assessments. This is of critical importance given the projected increase in global reservoirs (Günther et al., 2015), with over 3,700 future hydropower dams either planned or under construction (Zarfl et al., 2015), and the increase in rainfall driven eutrophication over the 21st century (Sinha et al., 2017).
In conclusion, this study demonstrated the importance of understanding the complex interplay between eutrophication and organic carbon loading in driving methane emissions from reservoir sediments. All sediments tested from these sub-tropical reservoirs were capable of methanogenesis and this was primarily limited by organic carbon. In sediments with elevated organic carbon content, nutrient limitation was observed, and this provides a potential mechanism for past studies that have demonstrated strong, positive relationships between eutrophication and methane emissions. Sediments from mesotrophic and eutrophic reservoirs were replete in key macronutrients (TOC, TN and TP) and trace metals (Fe, Ni and Co.) required for anaerobic methanogenesis. Finally, annual loading of macronutrients to the Little Nerang Dam reservoir was dominated by catchment inflows and lateral transport of forest litter. Based on these findings we suggest methane emission modelling and importantly mitigation from flooded lands takes into account the role of organic carbon as a driver of emissions alongside eutrophication.
The original contributions presented in the study are included in the article/Supplementary Material, further inquiries can be directed to the corresponding author.
All authors contributed to the conceptualization of the study. AG coordinated the study, conducted field sampling and analysed samples. MD contributed to the field sampling events. CS conducted biological methane potential tests and analysed laboratory samples. KS and DG contributed to the field sampling events and chemical analysis. All authors contributed to the interpretation of the results. AG produced the draft manuscript and all authors contributed to the editing of the draft.
Field monitoring campaigns, laboratory studies and sample analysis undertaken in this study were funded by Queensland Bulk Water Supply Authority, trading as Seqwater.
Authors KS and DG were employed by Seqwater.
The remaining authors declare that the research was conducted in the absence of any commercial or financial relationships that could be construed as a potential conflict of interest.
All claims expressed in this article are solely those of the authors and do not necessarily represent those of their affiliated organizations, or those of the publisher, the editors and the reviewers. Any product that may be evaluated in this article, or claim that may be made by its manufacturer, is not guaranteed or endorsed by the publisher.
The authors would like to acknowledge the financial and logistical support provided by Queensland Bulk Water Supply Authority, trading as Seqwater. Field and laboratory assistance was provided by N. Cutts, B. Knowles and P. Maxwell. Floristic surveys were undertaken by D. Jinks (Gold Coast Botany).
The Supplementary Material for this article can be found online at: https://www.frontiersin.org/articles/10.3389/fenvs.2022.852344/full#supplementary-material
Adams, R., Arafat, Y., Eate, V., Grace, M. R., Saffarpour, S., Weatherley, A. J., et al. (2014). A Catchment Study of Sources and Sinks of Nutrients and Sediments in South-East Australia. J. Hydrol. 515, 166–179. doi:10.1016/j.jhydrol.2014.04.034
APHA (2005). Standard Methods for the Examination of Water and Wastewater. 21st ed. Washington, DC: American Public Health Association (APHA), American Water Works Association (AWWA) and Water Environment Federation-WEF.
Bastviken, D., Cole, J., and PaceTranvik, M. L. (2004). Methane Emissions from Lakes: Dependence of Lake Characteristics, Two Regional Assessments, and a Global Estimate. Glob. Biogeochem. Cycles 18, GB4009. doi:10.1029/2004gb002238
Bastviken, D., Tranvik, L. J., Downing, J. A., Crill, P. M., and Enrich-Prast, A. (2011). Freshwater Methane Emissions Offset the Continental Carbon Sink. Science 331, 50. doi:10.1126/science.1196808
Beaulieu, J. J., DelSontro, T., and Downing, J. A. (2019). Eutrophication Will Increase Methane Emissions from Lakes and Impoundments During the 21st Century. Nat. Commun. 10, 1375. doi:10.1038/s41467-019-09100-5
Berberich, M. E., Beaulieu, J. J., Hamilton, T. L., Waldo, S., and Buffam, I. (2019). Spatial Variability of Sediment Methane Production and Methanogen Communities within a Eutrophic Reservoir: Importance of Organic Matter Source and Quantity. Limnol. Oceanogr. 65, 1–23. doi:10.1002/lno.11392
Bianchi, T. S. (2021). The Evolution of Biogeochemistry: Revisited. Biogeochemistry 154, 141–181. doi:10.1007/s10533-020-00708-0
Boon, P. I., and Mitchell, A. (1995). Methanogenesis in the Sediments of an Australian Freshwater Wetland: Comparison with Aerobic Decay, and Factors Controlling Methanogenesis. FEMS Microbiol. Ecol. 18 (3), 175–190. doi:10.1111/j.1574-6941.1995.tb00175.x
Boudreau, B. P. (1999). Metals and Models: Diagenic Modelling in Freshwater Lacustrine Sediments. J. Paleolimnol. 22, 227–251. doi:10.1023/a:1008144029134
Brannon, J. M., Chen, R. L., and Gunnison, D. (1985). “Sediment-Water Interactions and Mineral Cycling in Reservoirs,” in Microbial Processes in Reservoirs. Editor D. Gunnison (Dordrecht: Springer Netherlands), 121–134. doi:10.1007/978-94-009-5514-1_7
Burford, M. A., Johnson, S. A., Cook, A. J., Packer, T. V., Taylor, B. M., and Townsley, E. R. (2007). Correlations Between Watershed and Reservoir Characteristics, and Algal Blooms in Subtropical Reservoirs. Water Res. 41, 4105–4114. doi:10.1016/j.watres.2007.05.053
Burford, M. A., Green, S. A., Cook, A. J., Johnson, S. A., Kerr, J. G., and O’Brien, K. R. (2012). Sources and Fate of Nutrients in a Subtropical Reservoir. Aquat. Sci. 74, 179–190. doi:10.1007/s00027-011-0209-4
Deemer, B. R., Harrison, J. A., Li, S., Beaulieu, J. J., DelSontro, T., Barros, N., et al. (2016). Greenhouse Gas Emissions from Reservoir Water Surfaces: A New Global Synthesis. BioScience 66, 949–964. doi:10.1093/biosci/biw117
DelSontro, T., Kunz, M. J., Kempter, T., Wüest, A., Wehrli, B., and Senn, D. B. (2011). Spatial Heterogeneity of Methane Ebullition in a Large Tropical Reservoir. Environ. Sci. Technol. 45, 9866–9873. doi:10.1021/es2005545
DelSontro, T., Boutet, L., St-Pierre, A., del Giorgio, P. A., and Prairie, Y. T. (2016). Methane Ebullition and Diffusion from Northern Ponds and Lakes Regulated by the Interaction Between Temperature and System Productivity. Limnol. Oceanogr. 61, S62–S77. doi:10.1002/lno.10335
DelSontro, T., Beaulieu, J. J., and Downing, J. A. (2018). Greenhouse Gas Emissions from Lakes and Impoundments: Upscaling in the Face of Global Change. Limnol. Oceanogr. Lett. 3, 64–75. doi:10.1002/lol2.10073
DES (2018). Monitoring and Sampling Manual: Environmental Protection (Water) Policy. Brisbane, Australia: Queensland Department of Environment and Science.
Dowdy, A. J., Mills, G. A., Timbal, B., and Wang, Y. (2013). Changes in the Risk of Extratropical Cyclones in Eastern Australia. J. Clim. 26 (4), 1403–1417. doi:10.1175/jcli-d-12-00192.1
Ehrlich, H. L., Newman, D. K., and Kappler, A. (Editors) (2015). Ehrlich's Geomicrobiology. 6th ed. (Boca Raton: CRC Press). doi:10.1201/b19121
Etminan, M., Myhre, G., Highwood, E. J., and Shine, K. (2016). Radiative Forcing of Carbon Dioxide, Methane, and Nitrous Oxide: A Significant Revision of the Methane Radiative Forcing. Geophys. Res. Lett. 43, 12614–12623. doi:10.1002/2016gl071930
Gale, D. (2016). Diatoms as Indicators of Ecological Change in Freshwater Reservoirs of South East Queensland. PhD Thesis. Brisbane: School of Civil Engineering, The University of Queensland. doi:10.14264/uql.2016.64
Glass, J. B., and Orphan, V. J. (2012). Trace Metal Requirements for Microbial Enzymes Involved in the Production and Consumption of Methane and Nitrous Oxide. Front. Microbio. 3, 61. doi:10.3389/fmicb.2012.00061
Grasset, C., Mendonça, R., Villamor Saucedo, G., Bastviken, D., Roland, F., and Sobek, S. (2018). Large but Variable Methane Production in Anoxic Freshwater Sediment Upon Addition of Allochthonous and Autochthonous Organic Matter. Limnol. Oceanogr. 63, 1488–1501. doi:10.1002/lno.10786
Grinham, A., Dunbabin, M., Gale, D., and Udy, J. (2011). Quantification of Ebullitive and Diffusive Methane Release to Atmosphere From a Water Storage. Atmos. Environ. 45 (39), 7166–7173. doi:10.1016/j.atmosenv.2011.09.011
Grinham, A., Dunbabin, M., and Albert, S. (2018). Importance of Sediment Organic Matter to Methane Ebullition in a Sub-Tropical Freshwater Reservoir. Sci. Total Environ. 621, 1199–1207. doi:10.1016/j.scitotenv.2017.10.108
Günther, G., Lehner, B., Lumsdon, A. E., MacDonald, G. K., Zarfl, C., and Liermann, C. R. (2015). An Index-Based Framework for Assessing Patterns and Trends in River Fragmentation and Flow Regulation by Global Dams at Multiple Scales. Environ. Res. Lett. 10, 015001. doi:10.1088/1748-9326/10/1/015001
Harrison, J. A., Prairie, Y. T., Mercier-Blais, S., and Soued, C. (2021). Year-2020 Global Distribution and Pathways of Reservoir Methane and Carbon Dioxide Emissions According to the Greenhouse Gas from Reservoirs (G-Res) Model. Glob. Biogeochem. Cycles 35, e2020GB006888. doi:10.1029/2020gb006888
Hubble, T. C. T., Docker, B. B., and Rutherfurd, I. D. (2010). The Role of Riparian Trees in Maintaining Riverbank Stability: A Review of Australian Experience and Practice. Ecol. Eng. 36, 292–304. doi:10.1016/j.ecoleng.2009.04.006
Hullebusch, E. D. V., Yekta, S. S., Calli, B., and Fermoso, F. G. (2019). “Biogeochemistry of Major Elements in Anaerobic Digesters: Carbon, Nitrogen, Phosphorus, Sulfur and Iron,” in Trace Elements in Anaerobic Biotechnologies. Editors F. G. Fermoso, E. D. V. Hullebusch, G. Collins, J. Roussel, A. P. Mucha, and G. Esposito (London, UK: IWA Publishing). doi:10.2166/9781789060225
Huston, R., Chan, Y. C., Gardner, T., Shaw, G., and Chapman, H. (2009). Characterisation of Atmospheric Deposition as a Source of Contaminants in Urban Rainwater Tanks. Water Res. 43, 1630–1640. doi:10.1016/j.watres.2008.12.045
Jarrell, K. F., and Kalmokoff, M. L. (1988). Nutritional Requirements of the Methanogenic Archaebacteria. Can. J. Microbiol. 34 (5), 557–576. doi:10.1139/m88-095
Jilbert, T., Cowie, G., Lintumäki, L., Jokinen, S., Asmala, E., Sun, X., et al. (2021). Anthropogenic Inputs of Terrestrial Organic Matter Influence Carbon Loading and Methanogenesis in Coastal Baltic Sea Sediments. Front. Earth Sci. 9, 716416. doi:10.3389/feart.2021.716416
Johnson, E. R., Inamdar, S., Kan, J., and Vargas, R. (2018). Particulate Organic Matter Composition in Stream Runoff Following Large Storms: Role of POM Sources, Particle Size, and Event Characteristics. J. Geophys. Res. Biogeosci. 123, 660–675. doi:10.1002/2017jg004249
Kanakidou, M., Myriokefalitakis, S., Daskalakis, N., Fanourgakis, G., Nenes, A., Baker, A. R., et al. (2016). Past, Present, and Future Atmospheric Nitrogen Deposition. J. Atmos. Sci. 73 (5), 2039–2047. doi:10.1175/jas-d-15-0278.1
Kelly, C. A., and Chynoweth, D. P. (1981). The Contributions of Temperature and of the Input of Organic Matter in Controlling Rates of Sediment Methanogenesis. Limnol. Oceanogr. 26, 891–897. doi:10.4319/lo.1981.26.5.0891
Kemp, J., Olley, J., and Capon, S. (2019). “An Environmental History of Moreton Bay Hinterlands,” in Moreton Bay Quandamooka & Catchment: Past, Present, and Future. Editors I. R. Tibbetts, P. C. Rothlisberg, D. T. Neil, T. A. Homburg, D. T. Brewer, and A. H. Arthington (Brisbane, Australia: The Moreton Bay Foundation).
Maeck, A., DelSontro, T., McGinnis, D. F., Fischer, H., Flury, S., Schmidt, M., et al. (2013). Sediment Trapping by Dams Creates Methane Emission Hot Spots. Environ. Sci. Technol. 47 (15), 8130–8137. doi:10.1021/es4003907
Michalak, A. M. (2016). Study Role of Climate Change in Extreme Threats to Water Quality. Nature 535, 349–350. doi:10.1038/535349a
Morris, G., and Fan, J. (1998). Reservoir Sedimentation Handbook: Design and Management of Dams, Reservoirs and Watersheds for Sustainable Use. London, UK: McGraw-Hill.
NATA (2021). Environmental Analysis Laboratory - Office of Research. Southern Cross University Accreditation Number 14960. Available at: https://nata.com.au/find-organisation/ (Accessed December, 2021).
O'Brien, K. R., Weber, T. R., Leigh, C., and Burford, M. A. (2016). Sediment and Nutrient Budgets Are Inherently Dynamic: Evidence from a Long-Term Study of Two Subtropical Reservoirs. Hydrol. Earth Syst. Sci. 20, 4881–4894. doi:10.5194/hess-20-4881-2016
O'Sullivan, C. A., Burrell, P. C., Clarke, W. P., and Blackall, L. L. (2005). Structure of a Cellulose Degrading Bacterial Community During Anaerobic Digestion. Biotechnol. Bioeng. 92 (7), 871–878. doi:10.1002/bit.20669
Owen, W. F., Stuckey, D. C., Healy, J. B., Young, L. Y., and McCarty, P. L. (1979). Bioassay for Monitoring Biochemical Methane Potential and Anaerobic Toxicity. Water Res. 13 (6), 485–492. doi:10.1016/0043-1354(79)90043-5
QLUMP (2018). Queensland Land Use Mapping Program (QLUMP) of the Department of Science, Information Technology and Innovation (DSITI). Available at: https://www.qld.gov.au/environment/land/vegetation/mapping/qlump (Accessed October, 2021).
Raposo, F., De la Rubia, M. A., Fernández-Cegrí, V., and Borja, R. (2012). Anaerobic Digestion of Solid Organic Substrates in Batch Mode: An Overview Relating to Methane Yields and Experimental Procedures. Renew. Sustain. Energy Rev. 16 (1), 861–877. doi:10.1016/j.rser.2011.09.008
Rayment, G. E., and Lyons, D. J. (2010). Soil Chemical Methods - Australasia. Melbourne, Australia: CSIRO Publishing.
Rigosi, A., Hanson, P., Hamilton, D. P., Hipsey, M., Rusak, J. A., Bois, J., et al. (2015). Determining the Probability of Cyanobacterial Blooms: The Application of Bayesian Networks in Multiple Lake Systems. Ecol. Appl. 25, 186–199. doi:10.1890/13-1677.1
Rosentreter, J. A., Borges, A. V., Deemer, B. R., Holgerson, M. A., Liu, S., Song, C., et al. (2021). Half of Global Methane Emissions Come From Highly Variable Aquatic Ecosystem Sources. Nat. Geosci. 14, 225–230. doi:10.1038/s41561-021-00715-2
Sinha, E., Michalak, A. M., and Balaji, V. (2017). Eutrophication Will Increase During the 21st Century as a Result of Precipitation Changes. Science 357 (6349), 405–408. doi:10.1126/science.aan2409
Sperazza, M., Moore, J. N., and Hendrix, M. S. (2004). High-Resolution Particle Size Analysis of Naturally Occurring Very Fine-Grained Sediment Through Laser Diffractometry. J. Sediment. Res. 74, 736–743. doi:10.1306/031104740736
Takashima, M., Speece, R. E., and Parkin, G. F. (1990). Mineral Requirements for Methane Fermentation. Crit. Rev. Environ. Control 19 (5), 465–479. doi:10.1080/10643389009388378
Tipping, E., Benham, S., Boyle, J. F., Crow, P., Davies, J., Fischer, U., et al. (2014). Atmospheric Deposition of Phosphorus to Land and Freshwater. Environ. Sci. Process. Impacts 16, 1608–1617. doi:10.1039/c3em00641g
Tittel, J., Hüls, M., and Koschorreck, M. (2019). Terrestrial Vegetation Drives Methane Production in the Sediments of Two German Reservoirs. Sci. Rep. 9, 15944. doi:10.1038/s41598-019-52288-1
Tonin, A. M., Gonçalves, J. F., Bambi, P., Couceiro, S. R. M., Feitoza, L. A. M., Fontana, L. E., et al. (2017). Plant Litter Dynamics in the Forest-Stream Interface: Precipitation Is a Major Control Across Tropical Biomes. Sci. Rep. 7, 10799. doi:10.1038/s41598-017-10576-8
van Langenhove, L., Verryckt, L. T., Bréchet, L., Courtois, E. A., Stahl, C., Hofhansl, F., et al. (2020). Atmospheric Deposition of Elements and its Relevance for Nutrient Budgets of Tropical Forests. Biogeochemistry 149, 175–193. doi:10.1007/s10533-020-00673-8
van Rijn, L. C. (2012). Principles of Sedimentation and Erosion Engineering in Rivers, Estuaries and Coastal Seas. Netherlands: Aqua Publications.
Wang, T., Li, Z., Chen, X., and Long, X.-E. (2019). Effects of Nickel and Cobalt on Methane Production and Methanogen Abundance and Diversity in Paddy Soil. PeerJ 7, e6274. doi:10.7717/peerj.6274
West, W. E., Creamer, K. P., and Jones, S. E. (2016). Productivity and Depth Regulate Lake Contributions to Atmospheric Methane. Limnol. Oceanogr. 61, S51–S61. doi:10.1002/lno.10247
Xu, N., Liu, S., Xin, F., Zhou, J., Jia, H., Xu, J., et al. (2019). Biomethane Production from Lignocellulose: Biomass Recalcitrance and Its Impacts on Anaerobic Digestion. Front. Bioeng. Biotechnol. 7, 191. doi:10.3389/fbioe.2019.00191
Zarfl, C., Lumsdon, A. E., Berlekamp, J., Tydecks, L., and Tockner, K. (2015). A Global Boom in Hydropower Dam Construction. Aquat. Sci. 77, 161–170. doi:10.1007/s00027-014-0377-0
Keywords: catchment loading, lateral litter inputs, atmospheric deposition, methanogenesis drivers, reservoir sediments
Citation: Grinham A, O’Sullivan C, Dunbabin M, Sturm K, Gale D, Clarke W and Albert S (2022) Drivers of Anaerobic Methanogenesis in Sub-Tropical Reservoir Sediments. Front. Environ. Sci. 10:852344. doi: 10.3389/fenvs.2022.852344
Received: 11 January 2022; Accepted: 20 April 2022;
Published: 31 May 2022.
Edited by:
Daniel F. McGinnis, Université de Genève, SwitzerlandReviewed by:
Guangchao Zhuang, Ocean University of China, ChinaCopyright © 2022 Grinham, O’Sullivan, Dunbabin, Sturm, Gale, Clarke and Albert. This is an open-access article distributed under the terms of the Creative Commons Attribution License (CC BY). The use, distribution or reproduction in other forums is permitted, provided the original author(s) and the copyright owner(s) are credited and that the original publication in this journal is cited, in accordance with accepted academic practice. No use, distribution or reproduction is permitted which does not comply with these terms.
*Correspondence: Alistair Grinham, YS5ncmluaGFtQHVxLmVkdS5hdQ==
Disclaimer: All claims expressed in this article are solely those of the authors and do not necessarily represent those of their affiliated organizations, or those of the publisher, the editors and the reviewers. Any product that may be evaluated in this article or claim that may be made by its manufacturer is not guaranteed or endorsed by the publisher.
Research integrity at Frontiers

Learn more about the work of our research integrity team to safeguard the quality of each article we publish.