 Majid Mahmoodi
 Nazar Dahmardeh
94% of researchers rate our articles as excellent or good
Learn more about the work of our research integrity team to safeguard the quality of each article we publish.
Find out more
BRIEF RESEARCH REPORT article
Front. Environ. Sci. , 22 March 2022
Sec. Environmental Economics and Management
Volume 10 - 2022 | https://doi.org/10.3389/fenvs.2022.849676
Improving the environmental quality and economic growth simultaneously, and examining the variables affecting this nexus, has been one of the most important issues for researchers and policymakers in recent years, especially following the United Nations 2030 Agenda Sustainable Development Goals. The aim of this study is to investigate the nexus among the ecological footprint as a multi-aspect indicator of environmental degradation, economic growth, renewable and non-renewable energies, and governance quality within the Environmental Kuznets Curve (EKC) hypothesis framework for two panels of European and Asian emerging countries during 1996–2017. For this purpose, we employ second-generation panel techniques that consider cross-sectional dependency in panel data. Augmented Mean Group estimation results indicate an inverted U-shape nexus among the economic growth and ecological footprint, which implies validation of the EKC hypothesis in all two panels of countries. The findings indicate the positive impact of non-renewable energy and the negative influence of governance quality on the ecological footprint in all two panels. At the same time, there is evidence of the negative impact of renewable energy on ecological footprint only in European emerging countries. In summary, the findings recommend that governments and policymakers pay closer attention to implementing non-renewable energy restrictive policies and renewable energy incentive policies. Furthermore, this is important to plan for improving various dimensions of governance quality to achieve better adoption and implementation of environmental policies, especially in the Asian emerging countries where it can lead to a more positive impact on environmental quality according to the results of estimated coefficients.
JEL Codes: C33, Q01, Q20, Q50
Economic growth has always been one of the most significant topics among researchers and policymakers. Since the Industrial Revolution, energy consumption has increased significantly, and energy has become very important as one of the major drivers of economic growth and development. However, economic, technical, and environmental concerns related to energy have spread, especially in the recent decade. The use of traditional energy sources and fossil fuels has been questioned for various reasons, including greenhouse gas emissions, global warming, and their limited and finite nature. Consequently, what is currently being considered is sustainable development. According to the 1987 report of the Brundtland Commission entitled “Our Common Future,” sustainable development refers to a development that considers the right of future generations, decreases environmental degradation, and satisfies the needs of present generations (WCED, 1987). Environmental degradation negatively impacts different macroeconomic indicators such as labor productivity and sustainable growth. Due to this feedback relationship between environmental degradation and economic indicators, it is essential to reduce environmental problems as much as possible and to ensure sustainable development (Yilanci and Pata, 2020). At the UN Conference on Sustainable Development 2012 (UNCSD), members decided to set up Sustainable Development Goals (SDGs), and 17 goals were set in 2015 to be achieved by 2030, which is called the “2030 agenda.” Various countries and international agencies are trying their best to mitigate environmental degradation, but environmental pollution is still rising. Therefore, several studies in recent years have attempted to explore different variables that can affect greenhouse gas emissions and environmental quality (Yang et al., 2020), for instance, Danish et al. (2019), Alola et al. (2019), Destek and Sinha (2020), Kayani et al. (2020), Yang et al. (2021a), and Jahanger (2021).
In this regard and given the importance of this issue, several studies in recent decades have examined the nexus among economic growth, energy consumption, and quality of the environment by examining the Environmental Kuznets Curve (EKC) hypothesis. The EKC hypothesis examines an inverted U-shape nexus between environmental degradation and economic growth. Grossman and Krueger (1991) first pioneered this inverted U-shape relation, while the term “Environmental Kuznets Curve” was coined by Panayotou (1993). According to this hypothesis, environmental degradation rises during the first steps of economic growth. This is because, in the first steps of economic growth, environmental awareness is low, funding allocated for environmental protection is insufficient, advanced technologies to prevent environmental pollution are not available, etc. However, in the following steps of economic growth and beyond a specified amount of GDP and income per capita, for various reasons, environmental degradation declines, and environmental quality starts to improve at the same time as economic growth (Kijima et al., 2010; Pata, 2018b), for instance, increasing environmental awareness, improving production technologies and moving toward environmentally friendly technologies, setting and enforcing environmental protection laws and regulations, or as Roca (2003) points out, increasing the willingness to pay for environmental improvements, etc. In the related literature, different studies have considered different variables as control variables to examine the validity of the EKC hypothesis, for example, financial development, urbanization, globalization, human capital, political variables, foreign direct investments, trade openness, and tourism (Pata and Caglar, 2021).
The seventh goal of the SDGs is to make sure that reliable, cost-effective, sustainable, clean, and modern energy is accessible to everyone (United Nations, 2015). Paying attention to renewable and clean energy is a substantial factor in decreasing greenhouse gas, protecting environmental quality, achieving sustainable energy sources, and thus moving toward sustainable development. According to the Sustainable Development Goals Report 2021, the percentage of renewable energy from total energy consumption raised from 16.4% in 2010 to 17.1% in 2018. However, achieving long-run climate goals needed significantly faster growth.
Although several studies in the existing literature have investigated the EKC hypothesis, there is no consensus among the related literature, which may be due to the different methods, variables, databases, etc. Therefore, study on this issue can still be significant. Moreover, in previous studies, carbon dioxide (CO2) emissions have often been used to measure environmental quality, while CO2 emissions cannot comprehensively represent the various aspects of environmental quality. The present study used ecological footprint (hereafter, EFP) instead of carbon emissions to cover this deficiency. The EFP was first developed by Rees (1992) and Wackernagel and Rees (1996), and it is a measure of human influence on the quality of the environment. According to the Global Footprint Network, EFP counts up all the productive zones for which a population, a person, or a product competes. It calculates the ecological assets that a given population or product needs to produce the natural resources it consumes (containing livestock and fish products, plant-based food and fiber products, forest products, space for urban infrastructure) and to absorb its waste, especially CO2 emissions. EFP considers the use of productive zones, including grazing areas, croplands, forest areas, fishing areas, built-up lands, and carbon footprint. By merging these six subcomponents, EFP can comprehensively represent environmental degradation. EFP can measure the ecological cost of goods and services offered to humans by land and the maximum population carrying capacity of a given area (Yilanci and Pata, 2020). However, few recent studies have considered the EFP to explore the nexus between economic growth and quality of the environment (e.g., Alola et al., 2019; Altıntaş and Kassouri, 2020; Destek and Sinha, 2020; Pata et al., 2021; Usman and Jahanger, 2021; Cui et al., 2022).
Furthermore, only a limited number of recent studies have considered the influence of governance quality on the nexus among energy, economic growth, and quality of the environment. In the worldwide governance indicators (WGI) project by Kaufmann et al. (1999, 2010), the World Bank defines governance based on six indicators, including political stability, voice and accountability, quality of regulation, effectiveness of government, rule of law, and corruption control. Any dimension of governance can impact environmental quality, directly or indirectly. For example, in societies with better voice and accountability, there is an opportunity to develop different ideas and create parties and groups with different views, such as parties with environmentally friendly policies, which can improve the environmental quality (Tarverdi, 2018). Also, in such societies, environmentalists can track the environmental violations of individuals and businesses and publish them for public awareness. The theoretical model of Fredriksson and Svensson proposed the interaction of two indicators of political stability and corruption control on environmental regulations and policies. The impact of political instability on the strictness of environmental regulations depends on the corruption degree. When corruption is low, political instability negatively impacts the environmental regulations and thus the quality of the environment. In contrast, when corruption is high, it has a positive impact because it reduces the negative effect of corruption. The reason is that when political instability increases, the incentive to offer bribes for the producer lobby decreases because it is unclear how long the current government will remain in office (Fredriksson and Svensson, 2003). Moreover, improving the quality of regulation, the rule of law in society, and effectiveness of the governments can lead to better environmental regulations and policies setup. Some studies discussed the impact of democracy on the environment. Environmental degradation might have more effect under political systems, especially in developing countries. Some scholars argued that democracy improves environmental quality through the effective and satisfactory implementation of government rules and regulations, while another group argued that democracy leads to environmental degradation because democracy has a positive impact on real income, and income increase also adversely impacts the environmental quality (Jahanger et al., 2021).
This study contributes to the existing literature as follows: first, utilizing EFP as a more comprehensive indicator of environmental degradation, unlike most previous studies that used CO2 emission or greenhouse gas emission. Second, given that the quality of governance has been less considered in the related literature, to cover this shortcoming, the present study considers the governance quality as an important variable that affects environmental quality and the nexus between environment and economic growth. Third, focus on European and Asian Emerging countries. Fourth, to the best of our knowledge, the present study is the first to consider the EFP and simultaneously impact of governance quality for examining the EKC hypothesis. Fifth, we employ second-generation panel techniques that consider cross-sectional dependency and heterogeneity in panel data. In summary, the purpose of the present study is to examine the nexus among the EFP, economic growth, renewable and non-renewable energies, and governance quality within the EKC hypothesis framework for two panels of emerging economies, including 9 European emerging countries and 21 Asian emerging countries during 1996–2017.
The remainder of the study is arranged as follows: literature review is presented in the second section; the model and data are provided in the third section; methodology and empirical results are reported in the fourth section. Finally, Section 5 provides the discussion and conclusion.
Several studies have examined the nexus among energy, economic growth, and quality of the environment. Existing literature can be classified into three groups. Following the pioneering work of Kraft and Kraft (1978), the first group analyzes the causality nexus between these variables (e.g., Apergis et al., 2010; Ozturk and Uddin, 2012; Omri et al., 2015; Magazzino, 2016; Mutascu, 2016; Mahmoodi and Mahmoodi 2018; Tuna and Tuna, 2019; Banday and Aneja, 2020). The second group examines the EKC hypothesis following the pioneering study of Grossman and Krueger (1991). Some studies found the existence of EKC (e.g., Apergis and Ozturk, 2015; Bilgili et al., 2016; Pata, 2018a; Danish et al., 2019; Magazzino et al., 2020; Usman and Jahanger, 2021), while the results of some studies do not support the validity of EKC hypothesis (e.g., Huang et al., 2008; Liu et al., 2017; Sirag et al., 2018; Destek and Sinha, 2020; Pata and Aydin, 2020). Although most studies have empirically examined the EKC hypothesis, some studies proposed theoretical models for EKC. Lieb (2002) proposed a static theoretical model of EKC in a representative consumer model. Kijima et al. (2010) proposed several static and dynamic models, and Bertinelli et al. (2012) provided a theoretical model through a vintage capital model. Finally, the third group employed different estimation methods to estimate the linear regression equation and infer the long-term relations among the variables (e.g., Shafiei and Salim, 2014; Güney, 2019; Nguyen and Kakinaka, 2019; Usman et al., 2022).
As mentioned before, governance quality can affect the environmental quality through various channels. Recently, limited numbers of studies attempted to explore the rule of governance quality on the environment. For this purpose, different studies have considered various indicators. Some studies utilized a composite index of six WGI governance indicators. Danish et al. (2019) focused on five BRICS countries during 1996–2017. They found the negative impact of the composite index of governance quality on carbon emissions, which means that governance quality improves leads to environmental quality improvement. The findings also support the presence of the EKC in BRICS. Khan et al. (2022) indicated that governance quality, renewable energy, and exports negatively impacted CO2 emissions in the G-7 countries during 1990–2018. Another part of the existing studies evaluated the impact of each dimension of WGI governance quality on the environment separately. For instance, Simionescu et al. (2021) for 10 Central and Eastern European (CEE) panels during 2006–2019 indicate that government effectiveness negatively affects greenhouse gas emissions in the short and long term. At the same time, the higher degree of the rule of law and corruption control leads to a better quality of environment only in the long term. They found an inverted U-shaped relation between real GDP and greenhouse gas emission in the short run while this relation might become unstable in the long run. Furthermore, results indicate that renewable energy negatively affects greenhouse gas emissions. Nguyen and Dinh Su (2021) studied 134 countries from 2002 to 2015 and concluded that quality of regulation, government effectiveness, the rule of law, and corruption control support environmental sustainability. Halkos and Tzeremes (2013) investigated several groups of countries and found that different numbers of governance quality indicators are important in each group of countries and may affect CO2 emission.
On the other hand, some studies have considered only a few dimensions of governance indicators. Muhammad and Long (2021) considered three governance indicators: political stability, the rule of law, and control of corruption. They found that these indicators negatively impact carbon emissions. Zhang et al. (2016) explored the relationship between corruption and carbon emission for Asia-Pacific Economic Cooperation (APEC) countries. They found heterogeneity regarding the effect of corruption on CO2 emissions among countries with different degrees of carbon emissions. However, the aggregate impact of corruption on carbon emission is positive in all sample countries. Moreover, they found evidence of EKC between carbon emissions and GDP. Also, Wang et al. (2018) explored a sample of BRICS countries during 1996–2015 and found that corruption control decreases carbon emissions.
Moreover, some researchers have investigated other variables and indicators related to governance, such as democracy, institutional quality, political institutional quality. Jahanger et al. (2021) investigated a panel of 74 developing countries during 1990–2016. The result indicates that autocracy leads to an increase in CO2 emission, while democracy reduces carbon emissions. In another study, Usman and Jahanger (2021) considered institutional quality and investigated a panel of 93 countries from 1990 to 2016. The findings of panel quantile regression indicate the positive impact of institutional quality on EFP at 5th to 80th quantiles. At the 90th and 95th quantiles, the coefficient of institutional quality is negative but insignificant. Also, the results support the existence of EKC. Hassan et al. (2020) examined the role of institutional quality in Pakistan from 1984 to 2016. Similar to Usman and Jahanger (2021), they found that institutional quality positively impacts CO2 emissions. Sarkodie and Adams (2018) found that political institutional quality caused a reduction in CO2 emissions in South Africa during 1971–2017. Also, they found evidence of the validity of EKC.
As mentioned before, the EFP is a more complete and comprehensive measure for the environmental quality against the single aspect variables such as CO2 emissions. However, only a few existing studies were used EFP. For example, Alola et al. (2019) for a panel of 16 European countries during 1997–2014 reveals the positive influence of the GDP on the EFP in the short and long term. Also, the rise in non-renewable and traditional energy leads to environmental degradation in the long-run. Although renewable energy improves environmental quality in the short-run, the unexpected result of Alola et al. (2019) is the long-term positive influence of renewable energy on the EFP. The findings of Usman et al. (2021) for a panel of 15 highest emitting countries indicate the positive impact of non-renewable energy and negative impact of renewable energy on EFP during 1990–2017. Cui et al. (2022) focused on leading 10 economic complex and leading 10 renewable energy consumer countries during 1980–2017. They found that economic complexity, economic development, and urbanization have positive impacts on EFP. Also, the negative impacts of human capital on EFP in all two panels. The results reveal that renewable energy negatively impacts EFP in the leading 10 renewable energy consumer countries.
Also, some studies considered EFP within the context of the EKC hypothesis. Destek and Sarkodie (2019) explored the EKC hypothesis by considering the EFP in a group of 11 newly industrialized economies during 1977–2013 and found mixed results of validity of the EKC in the studied countries. Altıntaş and Kassouri (2020) analyzed the EKC hypothesis for 14 advanced European countries during 1990–2014. The result supported the presence of the EKC when the EFP was used as a measure of environmental quality. In contrast, the EKC hypothesis was not held when the CO2 emissions were used to measure environmental quality. Also, the result implies that the increase of renewable energy conducts to a decrease in EFP and achieves better environmental quality. Wang et al. (2020) indicated the validity of the EKC hypothesis in the G7 countries during 1980–2016. Moreover, the results of dynamic seemingly unrelated regression revealed that biomass energy production positively impacts EFP. However, the following researchers could not find evidence to validate the EKC hypothesis. Destek and Sinha (2020) considered EFP to explore the EKC for 24 OECD countries over 1980–2014. The findings reveal that the EKC hypothesis was not confirmed. In addition, the positive result of non-renewable energy and the negative result of renewable energy on EFP were founded by them. Pata and Aydin (2020) explored the top six hydropower-consuming countries from 1965 to 2016 by using the Fourier bootstrap ARDL method. They conclude that the EKC hypothesis was not confirmed in Brazil, China, Canada, Norway, and the USA. In another study, Pata et al. (2021) utilized the human development index instead of GDP to explore the EKC hypothesis in the top 10 countries with the largest EFP during 1992–2016. They could not find the validity of the human capital Kuznets curve hypothesis in the sample countries. Moreover, the results indicate the negative impact of human development and renewable energy consumption on the EFP.
However, as noted before, there are limited studies in the existing literature that considered the impact of governance quality, especially all dimensions of WGI governance indicators. Moreover, most of these studies examined the impact of governance on CO2 and greenhouse gas emissions, not on EFP. Therefore, there is a shortcoming in the existing research, especially in the case of European and Asian emerging countries. The present study attempts to fill this gap. This is the first study to consider the EFP and impacts of governance quality within the EKC framework.
Consistent with the existing related literature (Bilgili et al., 2016; Altıntaş and Kassouri, 2020; etc.), this study considered a quadratic model to illustrate the EKC hypothesis:
where EQ denotes environmental quality indicator, Y is real gross domestic product (GDP) per capita, Y2 is square of real GDP per capita, and Z is control variables that may affect environmental quality. Unlike most previous studies, we use EFP as a more comprehensive measure of environmental degradation instead of CO2 or other greenhouse gas emissions. Also, we use renewable energy, non-renewable energy, and governance quality as control variables. Therefore, the present study examines the following EKC model:
where i and t subscripts denote cross-sections and years, respectively, and Uit is the error term. Except for the governance quality, all data are used in logarithmic form in the model. When α1 is statistically significant and positive, and α2 is statistically significant and negative, it indicates an inverted U-shape nexus among the EFP and GDP as a standard measure of economic growth, which means the EKC hypothesis has been confirmed. α1 > 0 and α2 = 0 indicate a monotonically increasing relationship between EFP and GDP; conversely, α1 < 0 and α2 = 0 reveal a monotonically decreasing relationship. α1 < 0 and α2 > 0 indicate a U-shaped relationship between EFP and GDP. However, when α1 = α2 = 0, there is no relationship between EFP and GDP (see Kijima et al., 2010 and Usman and Jahanger, 2021 for more details). EFP refers to the per capita ecological footprint calculated in global hectares (gha) per capita that was obtained from Global Footprint Network. Y is real GDP per capita measured in constant 2015 USD was derived from World Development Indicators (WDI) of the World Bank. NRE and RE are non-renewable and renewable electricity calculated in billion kilowatt-hours as a proxy for non-renewable and renewable energy, taken from the United States Energy Information Administration (EIA). GQ refers to the governance quality index.
EFP considered all productive zones, including grazing areas, croplands, fishing areas, forest areas, built-up lands, and carbon footprint. National Footprint Accounts estimates the EFP of consumption for each country by the following model:
EFPC is the EFP of consumption, EFPP is the EFP of production, and EFPI and EFPE are EFP embodied in imports and exports, respectively. For each country, the EFPP of a single footprint subcomponent is computed by summing all products of that subcomponent (such as footprint of marine and inland water areas embodied in fish and other aquatic products as well as in food aid and fishmeal for fishing areas subcomponent). The total EFPP of a country is the aggregate of the EFP of all productive areas (see Lin et al., 2018 and Lazarus et al., 2014 for more details).
GQ denotes a composite index of quality of governance, which was obtained by utilizing the principal component analysis (PCA) technique from the six World Bank multidimensional indicators in the WGI dataset, including political stability, voice and accountability, quality of regulation, the effectiveness of government, rule of law, and corruption control. In summary, political stability and voice and accountability indicate the process by which governments are selected, monitored, and replaced; quality of regulation and the effectiveness of government reveal the ability of the government to formulate and implement sound policies effectively; the rule of law and corruption control indicates the respect of citizens and the state for the institutions that govern economic and social interactions among them (see Kaufmann et al., 2010 for more details). The PCA method is a statistical technique for reducing a large number of correlated variables or dimensionality of big datasets to a small number of variables or datasets. It makes it easier and better to interpret a large number of variables and datasets without losing information (Jolliffe and Cadima, 2016; Kassi et al., 2020).
This study used annual panel data of interested variables from 1996 to 2017 for two panels of emerging economies, categorized by the World Economic Outlook (WEO) of the International Monetary Fund (IMF), including 9 European emerging countries and 21 Asian emerging countries (see Appendix). The choice of countries and time-period are based on data availability. The period 1996 to 2017 is the longest available dataset concerning interested variables of this study. The World Bank governance indicator data have been available on WGI since 1996, and EFP data are also available on the Global Footprint Network until 2017.
In most of the previous related literature, cross-sectional dependence (CSD) has not been considered. Ignoring CSD can lead to biased estimates and unreliable inference of relationships among variables. Therefore, to determine the appropriate method for estimating panel data, it is essential to check the CSD first. If there is evidence of CSD, second-generation panel techniques should be used (Yang et al., 2021a; Pata et al., 2021). The present study performs the following steps to examine the nexus among variables and analyze the EKC hypothesis. 1) Testing the existence of CSD and slope homogeneity. 2) Examining stationary properties of the variables by employing the panel unit root test. 3) Using panel cointegration test to explore the cointegration relationship among the variables. 4) Estimating Eq. 2 by employing Augmented Mean Group (AMG) estimator.
As the first step, it is important to examine the existence of the CSD in the panels. The present study utilizes Breusch–Pagan LM test proposed by Breusch and Pagan (1980), and Pesaran scaled LM and Pesaran CD test developed by Pesaran (2004). Also, we use slope homogeneity test of Pesaran and Yamagata (2008) to determine the homogeneity or heterogeneity of panels. The results of examining the null hypothesis of no CSD are reported in Table 1 and indicate the existence of CSD in all two panels. Moreover, the finding reveals the null hypotheses of homogeneity are rejected in European and Asian emerging countries. Therefore, the second-generation panel techniques should be used to analyze data.
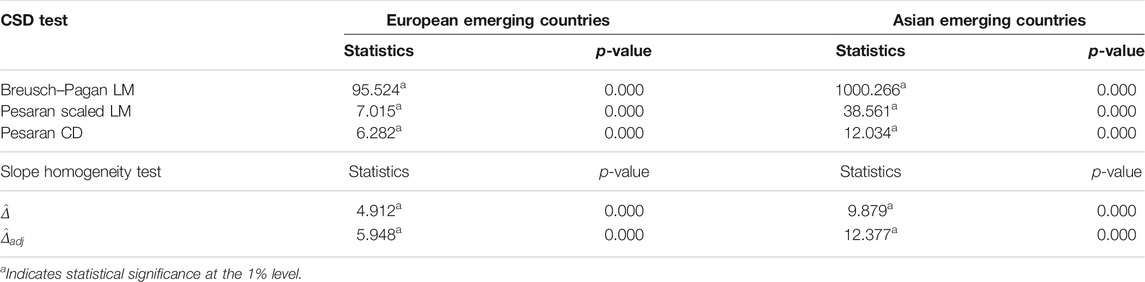
TABLE 1. CSD and slope homogeneity test results
In this step, we employ the second-generation panel unit root test developed by Pesaran (2007) known as the cross-sectional augmented IPS (CIPS) test to explore the stationary properties of the variables and specify the integration degree of the variables. Pesaran (2007) supplements the ADF regressions with mean of the cross-section at a level and their first integrated order I(1) of each cross-section to solve the CSD problem (Yang et al., 2021b). Table 2 reports the result of null hypothesis of unit root and indicates that all variables have unit root at the level in both Asian and European panels. However, they have become stationary after the first differences, implying that variables are integrated of order one I (1).
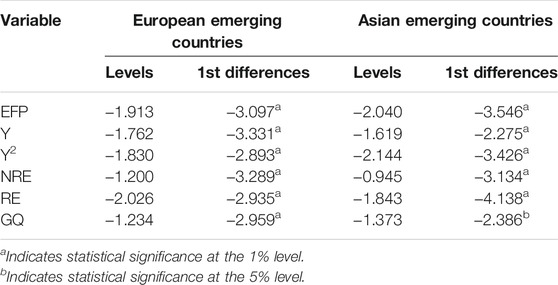
TABLE 2. CIPS panel unit root test results
In the presence of CSD, we must use the Westerlund second-generation panel cointegration test proposed by Westerlund (2007) to investigate the long-run linkage among the variables. This test is an error correction–based cointegration test. Westerlund (2007) panel cointegration test is the basis of panel cointegration tests developed by McCoskey and Kao (1998) and Westerlund (2005). Westerlund (2007) introduced four statistics. Two of them are established on pooling the error correction information along the panel’s cross-sectional dimension, which are referred to as panel statistics and indicated by
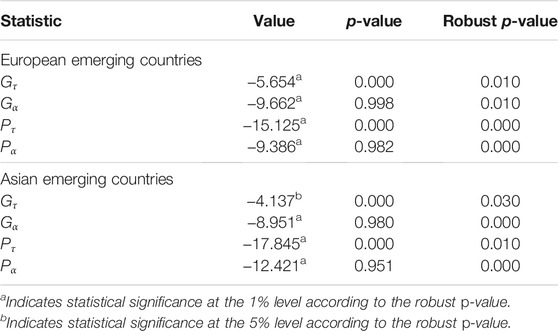
TABLE 3. Westerlund panel cointegration test results
Since the interested variables of the study are cointegrated, the last step is estimating the long-run coefficients of Eq. 2. For this purpose, the present study utilizes the Augmented Mean Group (AMG) estimator proposed by Eberhardt and Teal (2010). The advantage of the AGM estimator is that it considers the CSD and heterogeneity within the panel data and provides more reliable results than first-generation estimators in such situations. The AMG estimator proceeded in two stages. The first stage is a pooled regression model augmented with year dummies estimated by first difference OLS:
The second stage of AMG is expressed as
where Δ is the first difference operator, D is the time dummies and ct is the coefficient of it, and
The results of the AMG estimation of Eq. 2 are illustrated in Table 4 for European and Asian panels. The finding reveals that GDP per capita positively impacts EFP and the square of GDP per capita negatively impacts EFP, which means that the economic growth (GDP) has an inverted U-shape nexus with environmental degradation. Therefore, the result implies the validity of the EKC hypothesis in all two panels of European and Asian emerging countries. This result is consistent with the conclusions of Danish et al. (2019) that considered governance quality within the EKC framework for BRICS countries and found the existence of the EKC. Also, it is similar to the results of Usman and Jahanger (2021) that evaluated the EKC framework by considering institutional quality for a panel of 93 countries and validated the existence of EKC hypothesis. Likewise, it is also similar to the results of Ibrahim and Law (2014) for a group of 69 developing and developed nations, and Altıntaş and Kassouri (2020) for a panel of 14 advanced European countries.

TABLE 4. AMG long-run estimation results
The estimated coefficient of non-renewable energy is statistically significant in all two panels and indicates that a 1% increase in non-renewable energy causes an increase of 0.376% and 0.359% in EFP in European emerging countries and Asian emerging countries, respectively. This result is in accordance with Alola et al. (2019) for 16 European countries, Usman et al. (2021) for a panel of 15 highest emitting countries, Farhani and Shahbaz (2014) for 10 Middle East and North African countries. According to the AMG results, the coefficient of renewable energy is statistically significant only in the European emerging panel. It reveals that a 1% increase in renewable energy leads to a 0.305% decrease in EFP. The favorable effect of renewable energy on improving environmental quality in European emerging panel is in line with the findings of Altıntaş and Kassouri (2020), Simionescu et al. (2021), Pata and Caglar, (2021), Usman et al. (2021), Cui et al. (2022), and Khan et al. (2022); these researchers founded favorable effect of renewable energy in different regions. Also, it is in contrast to the results of Alola et al. (2019) that found the positive impact of renewable energy on the EFP for 16 advanced European countries. In addition, the finding indicates that the coefficient of renewable energy is not significant in Asian emerging panel. It is similar to the findings of Pata (2018a) for Turkey, Pata and Caglar (2021) for China and Brazil, and Nathaniel and Khan (2020) for ASEAN countries, which concluded that the coefficient of renewable energy is statistically insignificant.
Moreover, the results indicate that a 1% increase in governance quality leads to a decrease of 0.084% and 0.197% in EFP in European and Asian emerging panels, respectively. This result confirms the importance of governance quality on environmental quality. This finding is similar to the results of Danish et al. (2019) for BRICS countries, Simionescu et al. (2021) for 10 CEE countries, and Khan et al. (2022) for G-7 countries, which indicated the negative impact of governance quality on CO2 and greenhouse gas emissions.
With respect to the importance of economic growth and how it affects the environment, the present study investigated the relationship between the EFP as an indicator of environmental degradation and economic growth within the EKC hypothesis framework by considering renewable and non-renewable energies and governance quality for two panels of European and Asian emerging countries from 1996 to 2017. Countries and time-period were selected on data availability. This study contributed to the related literature by examining the validity of the EKC hypothesis with consideration of the EFP as a multi-aspect indicator of environmental quality at the same time with considering the impact of governance quality. Also, we used second-generation panel techniques that provide more reliable results in the presence of CSD and heterogeneity.
The findings of the Westerlund panel cointegration test implied the long-run nexus among the variables in all two panels of countries. According to the results of AMG estimation, we found an inverted U-shape nexus between economic growth and EFP in European and Asian emerging countries. It means that the EKC hypothesis has been confirmed in the studied countries. This finding is in line with the results of Zhang et al. (2016), Sarkodie and Adams (2018), Danish et al. (2019), and Usman and Jahanger (2021), and differ from Wang et al. (2013), Destek and Sinha (2020), Pata and Aydin (2020), and Pata et al. (2021) that could not support EKC.
Moreover, the finding reveals that non-renewable energy positively impacts the EFP in all two panels. Considering this result, it is recommended that the governments of studied countries implement policies to reduce the adverse effects of non-renewable energy, for example, restricting the consumption of fossil fuels and non-renewable energy resources, encouraging and supporting industries to increase energy efficiency by inventing and using advanced technologies, and investing to achieve energy-efficient transport systems. Moreover, consistent with the 2030 Agenda and SDGs goals, it is recommended to replace non-renewable energy with renewable energy to mitigate adverse effects of non-renewable and traditional energy for moving toward sustainable development. It is more important especially in the European emerging countries, due to the statistically significant and negative impact of renewable energy on EFP in the European panel. In this regard, governments should consider various policies to restrict non-renewable energy and encourage renewable energy. Governments and policymakers should implement policies such as carbon taxes, green taxes, feed-in tariffs, investment grants, net metering, renewable portfolio standards, and renewable energy system installation discounts (REN21, 2020). Furthermore, providing financial and technical support for research and development on renewable energy technologies, as well as environmental friendly production technologies, must be taken into account by governments. Also, one of the essential policies that should be considered is to increase public awareness of the need for environmental protection; this is more important especially in that country of our studied panels with a lower degree of development.
In addition, the results indicate the negative impact of governance quality on EFP in all two panels, which means the improvement of governance quality indicators leads to environmental quality improvement. This result is similar to the findings of Danish et al. (2019), Simionescu et al. (2021), and Khan et al. (2022). This finding suggests the importance of planning to move toward good governance. As mentioned before, each dimension of governance indicators affects environmental quality through various channels. Improving the quality of governance indicators and approaching good governance cause to better adopting and implementing energy policies and environmental policies. For example, the regulation of carbon taxes, green taxes, etc., can be influenced by the government effectiveness and quality of regulation. Also, political stability, the rule of law in society, control of corruption, and a high degree of voice and accountability can lead to the proper implementation of these regulations and policies. Since the intensity of the estimated coefficient of governance quality in Asian emerging panel is higher than European emerging panel, the latest suggestion is more important in Asian emerging panel and can cause a more beneficial effect on environmental quality in this panel.
Finally, this is suggested to future research to consider the role of governance quality on environmental quality, especially within the EKC framework in other panels of countries. Also, future studies can examine the impact of each dimension of WGI governance quality separately. In addition, it is recommended for future studies to consider disaggregated types of renewable energy resources (e.g., solar energy, wind energy, etc.) separately to investigate the nexus among the environmental quality, energy, economic growth, and governance variables. On the other hand, future studies can use other control variables such as globalization, urbanization, financial development, trade openness, etc.
Publicly available datasets were analyzed in this study. This data can be found here: https://info.worldbank.org/governance/wgi/ https://data.worldbank.org/indicator/NY.GDP.PCAP.KD https://www.eia.gov/opendata/qb.php?category=2134384 https://data.footprintnetwork.org/.
MM: conceptualization; data curation; formal analysis; methodology; writing—original draft. ND: conceptualization; formal analysis; supervision, validation; writing—review and editing. MM is a PhD candidate at the Economics Department of the University of Sistan and Baluchestan, Zahedan, Iran. ND is a Professor of Economics at the Economics Department of the University of Sistan and Baluchestan, Zahedan, Iran.
The authors declare that the research was conducted in the absence of any commercial or financial relationships that could be construed as a potential conflict of interest.
All claims expressed in this article are solely those of the authors and do not necessarily represent those of their affiliated organizations, or those of the publisher, the editors, and the reviewers. Any product that may be evaluated in this article, or claim that may be made by its manufacturer, is not guaranteed or endorsed by the publisher.
Alola, A. A., Bekun, F. V., and Sarkodie, S. A. (2019). Dynamic Impact of Trade Policy, Economic Growth, Fertility Rate, Renewable and Non-renewable Energy Consumption on Ecological Footprint in Europe. Sci. Total Environ. 685, 702–709. doi:10.1016/j.scitotenv.2019.05.139
Altıntaş, H., and Kassouri, Y. (2020). Is the Environmental Kuznets Curve in Europe Related to the Per-Capita Ecological Footprint or CO2 Emissions? Ecol. Indicators 113, 106187. doi:10.1016/j.ecolind.2020.106187
Apergis, N., and Ozturk, I. (2015). Testing Environmental Kuznets Curve Hypothesis in Asian Countries. Ecol. Indicators 52, 16–22. doi:10.1016/j.ecolind.2014.11.026
Apergis, N., Payne, J. E., Menyah, K., and Wolde-Rufael, Y. (2010). On the Causal Dynamics between Emissions, Nuclear Energy, Renewable Energy, and Economic Growth. Ecol. Econ. 69 (11), 2255–2260. doi:10.1016/j.ecolecon.2010.06.014
Banday, U. J., and Aneja, R. (2020). Renewable and Non-renewable Energy Consumption, Economic Growth and Carbon Emission in BRICS. Ijesm 14 (1), 248–260. doi:10.1108/IJESM-02-2019-0007
Bertinelli, L., Strobl, E., and Zou, B. (2012). Sustainable Economic Development and the Environment: Theory and Evidence. Energ. Econ. 34 (4), 1105–1114. doi:10.1016/j.eneco.2011.09.007
Bilgili, F., Koçak, E., and Bulut, Ü. (2016). The Dynamic Impact of Renewable Energy Consumption on CO 2 Emissions: A Revisited Environmental Kuznets Curve Approach. Renew. Sust. Energ. Rev. 54, 838–845. doi:10.1016/j.rser.2015.10.080
Breusch, T. S., and Pagan, A. R. (1980). The Lagrange Multiplier Test and its Applications to Model Specification in Econometrics. Rev. Econ. Stud. 47 (1), 239–253. doi:10.2307/2297111
Cui, L., Weng, S., Nadeem, A. M., Rafique, M. Z., and Shahzad, U. (2022). Exploring the Role of Renewable Energy, Urbanization and Structural Change for Environmental Sustainability: Comparative Analysis for Practical Implications. Renew. Energ. 184, 215–224. doi:10.1016/j.renene.2021.11.075
Danish, , , Baloch, M. A., and Wang, B. (2019). Analyzing the Role of Governance in CO2 Emissions Mitigation: The BRICS Experience. Struct. Change Econ. Dyn. 51, 119–125. doi:10.1016/j.strueco.2019.08.007
Destek, M. A., and Sarkodie, S. A. (2019). Investigation of Environmental Kuznets Curve for Ecological Footprint: The Role of Energy and Financial Development. Sci. Total Environ. 650, 2483–2489. doi:10.1016/j.scitotenv.2018.10.017
Destek, M. A., and Sinha, A. (2020). Renewable, Non-renewable Energy Consumption, Economic Growth, Trade Openness and Ecological Footprint: Evidence from Organisation for Economic Co-operation and Development Countries. J. Clean. Prod. 242, 118537. doi:10.1016/j.jclepro.2019.118537
Eberhardt, M., and Teal, F. (2010). Productivity Analysis in Global Manufacturing Production, 515. Available at: https://ora.ox.ac.uk/objects/uuid:ea831625-9014-40ec-abc5-516ecfbd2118.
Farhani, S., and Shahbaz, M. (2014). What Role of Renewable and Non-renewable Electricity Consumption and Output Is Needed to Initially Mitigate CO2 Emissions in MENA Region? Renew. Sust. Energ. Rev. 40, 80–90. doi:10.1016/j.rser.2014.07.170
Fredriksson, P. G., and Svensson, J. (2003). Political Instability, Corruption and Policy Formation: The Case of Environmental Policy. J. Public Econ. 87 (7), 1383–1405. doi:10.1016/S0047-2727(02)00036-1
Grossman, G., and Krueger, A. (1991). Environmental Impacts of a North American Free Trade Agreement. NBER Working Paper No. 3914). Cambridge, MA: National Bureau of Economic Research, Inc. Available at: https://econpapers.repec.org/paper/nbrnberwo/3914.htm.
Güney, T. (2019). Renewable Energy, Non-renewable Energy and Sustainable Development. Int. J. Sust. Dev. World Ecol. 26 (5), 389–397. doi:10.1080/13504509.2019.1595214
Halkos, G. E., and Tzeremes, N. G. (2013). Carbon Dioxide Emissions and Governance: A Nonparametric Analysis for the G-20. Energ. Econ. 40, 110–118. doi:10.1016/j.eneco.2013.06.010
Hashem Pesaran, M., and Yamagata, T. (2008). Testing Slope Homogeneity in Large Panels. J. Econom. 142 (1), 50–93. doi:10.1016/j.jeconom.2007.05.010
Hassan, S. T., Danish, , , Khan, S. U.-D., Xia, E., and Fatima, H. (2020). Role of Institutions in Correcting Environmental Pollution: An Empirical Investigation. Sust. Cities Soc. 53, 101901. doi:10.1016/j.scs.2019.101901
Huang, W. M., Lee, G. W. M., and Wu, C. C. (2008). GHG Emissions, GDP Growth and the Kyoto Protocol: A Revisit of Environmental Kuznets Curve Hypothesis. Energy Policy 36 (1), 239–247. doi:10.1016/j.enpol.2007.08.035
Ibrahim, M. H., and Law, S. H. (2014). Social Capital and CO2 Emission-Output Relations: A Panel Analysis. Renew. Sust. Energ. Rev. 29, 528–534. doi:10.1016/j.rser.2013.08.076
Jahanger, A. (2021). Impact of Globalization on CO2 Emissions Based on EKC Hypothesis in Developing World: The Moderating Role of Human Capital. Environ. Sci. Pollut. Res. doi:10.1007/s11356-021-17062-9
Jahanger, A., Usman, M., and Balsalobre‐Lorente, D. (2021). Autocracy, Democracy, Globalization, and Environmental Pollution in Developing World: Fresh Evidence from STIRPAT Model. J. Public Aff. (n/a), e2753. doi:10.1002/pa.2753
Jolliffe, I. T., and Cadima, J. (2016). Principal Component Analysis: A Review and Recent Developments. Phil. Trans. R. Soc. A. 374 (2065), 20150202. doi:10.1098/rsta.2015.0202
Kassi, D. F., Sun, G., and Ding, N. (2020). Does Governance Quality Moderate the Finance-Renewable Energy-Growth Nexus? Evidence from Five Major Regions in the World. Environ. Sci. Pollut. Res. 27 (11), 12152–12180. doi:10.1007/s11356-020-07716-5
Kaufmann, D., Kraay, A., and Mastruzzi, M. (2010). The Worldwide Governance Indicators: Methodology and Analytical Issues (SSRN Scholarly Paper ID 1682130). Social Science Research Network. Available at: https://papers.ssrn.com/abstract=1682130.
Kaufmann, D., Kraay, A., and Zoido, P. (1999). Governance Matters (SSRN Scholarly Paper ID 188568). Social Science Research Network. Availble at: https://papers.ssrn.com/abstract=188568.
Kayani, G. M., Ashfaq, S., and Siddique, A. (2020). Assessment of Financial Development on Environmental Effect: Implications for Sustainable Development. J. Clean. Prod. 261, 120984. doi:10.1016/j.jclepro.2020.120984
Khan, A. A., Khan, S. U., Ali, M. A. S., Safi, A., Gao, Y., Ali, M., et al. (2022). Role of Institutional Quality and Renewable Energy Consumption in Achieving Carbon Neutrality: Case Study of G-7 Economies. Sci. Total Environ. 814, 152797. doi:10.1016/j.scitotenv.2021.152797
Kijima, M., Nishide, K., and Ohyama, A. (2010). Economic Models for the Environmental Kuznets Curve: A Survey. J. Econ. Dyn. Control. 34 (7), 1187–1201. doi:10.1016/j.jedc.2010.03.010
Kraft, J., and Kraft, A. (1978). On the Relationship between Energy and GNP. J. Energ. Dev. 3 (2), 401–403.
Lazarus, E., Zokai, G., Borucke, M., Iha, K., Morales, J. C., Wackernagel, M., et al. (2014). Working Guidebook to the National Footprint Accounts.
Lieb, C. M. (2002). The Environmental Kuznets Curve and Satiation: A Simple Static Model. Envir. Dev. Econ. 7 (3), 429–448. doi:10.1017/S1355770X02000268
Lin, D., Hanscom, L., Murthy, A., Galli, A., Evans, M., Neill, E., et al. (2018). Ecological Footprint Accounting for Countries: Updates and Results of the National Footprint Accounts, 2012-2018. Resources 7 (3), 58. doi:10.3390/resources7030058
Liu, X., Zhang, S., and Bae, J. (2017). The Impact of Renewable Energy and Agriculture on Carbon Dioxide Emissions: Investigating the Environmental Kuznets Curve in Four Selected ASEAN Countries. J. Clean. Prod. 164, 1239–1247. doi:10.1016/j.jclepro.2017.07.086
Magazzino, C., Bekun, F. V., Etokakpan, M. U., and Uzuner, G. (2020). Modeling the Dynamic Nexus Among Coal Consumption, Pollutant Emissions and Real Income: Empirical Evidence from South Africa. Environ. Sci. Pollut. Res. 27 (8), 8772–8782. doi:10.1007/s11356-019-07345-7
Magazzino, C. (2016). The Relationship Among Real Gross Domestic Product, CO2 Emissions, and Energy Use in South Caucasus and Turkey. Int. J. Energ. Econ. Pol. 6 (4), 672–683.
Mahmoodi, M., and Mahmoodi, E. (2018). Environmental Quality, Renewable Energy, Trade Openness and Economic Growth: Evidence from Two Groups of Developing Countries. Ajw 15 (2), 177–185. doi:10.3233/AJW-180030
McCoskey, S., and Kao, C. (1998). A Residual-Based Test of the Null of Cointegration in Panel Data. Econometric Rev. 17 (1), 57–84. doi:10.1080/07474939808800403
Muhammad, S., and Long, X. (2021). Rule of Law and CO2 Emissions: A Comparative Analysis across 65 belt and Road Initiative(BRI) Countries. J. Clean. Prod. 279, 123539. doi:10.1016/j.jclepro.2020.123539
Mutascu, M. (2016). A Bootstrap Panel Granger Causality Analysis of Energy Consumption and Economic Growth in the G7 Countries. Renew. Sust. Energ. Rev. 63, 166–171. doi:10.1016/j.rser.2016.05.055
Nathaniel, S., and Khan, S. A. R. (2020). The Nexus between Urbanization, Renewable Energy, Trade, and Ecological Footprint in ASEAN Countries. J. Clean. Prod. 272, 122709. doi:10.1016/j.jclepro.2020.122709
Nguyen, C. P., and Dinh Su, T. (2021). Tourism, Institutional Quality, and Environmental Sustainability. Sustainable Prod. Consumption 28, 786–801. doi:10.1016/j.spc.2021.07.005
Nguyen, K. H., and Kakinaka, M. (2019). Renewable Energy Consumption, Carbon Emissions, and Development Stages: Some Evidence from Panel Cointegration Analysis. Renew. Energ. 132, 1049–1057. doi:10.1016/j.renene.2018.08.069
Omri, A., Ben Mabrouk, N., and Sassi-Tmar, A. (2015). Modeling the Causal Linkages between Nuclear Energy, Renewable Energy and Economic Growth in Developed and Developing Countries. Renew. Sust. Energ. Rev. 42, 1012–1022. doi:10.1016/j.rser.2014.10.046
Ozturk, I., and Uddin, G. S. (2012). Causality Among Carbon Emissions, Energy Consumption and Growth In India. Econ. Research-Ekonomska Istraživanja 25 (3), 752–775. doi:10.1080/1331677X.2012.11517532
Panayotou, T. (1993). Empirical Tests and Policy Analysis of Environmental Degradation at Different Stages of Economic Development. [ILO Working Paper]. Geneva, Switzerland: International Labour Organization. Availble at: https://econpapers.repec.org/paper/iloilowps/992927783402676.htm.
Pata, U. K., Aydin, M., and Haouas, I. (2021). Are Natural Resources Abundance and Human Development a Solution for Environmental Pressure? Evidence from Top Ten Countries with the Largest Ecological Footprint. Resour. Pol. 70, 101923. doi:10.1016/j.resourpol.2020.101923
Pata, U. K., and Aydin, M. (2020). Testing the EKC Hypothesis for the Top Six Hydropower Energy-Consuming Countries: Evidence from Fourier Bootstrap ARDL Procedure. J. Clean. Prod. 264, 121699. doi:10.1016/j.jclepro.2020.121699
Pata, U. K., and Caglar, A. E. (2021). Investigating the EKC Hypothesis with Renewable Energy Consumption, Human Capital, Globalization and Trade Openness for China: Evidence from Augmented ARDL Approach with a Structural Break. Energy 216, 119220. doi:10.1016/j.energy.2020.119220
Pata, U. K. (2018a). Renewable Energy Consumption, Urbanization, Financial Development, Income and CO2 Emissions in Turkey: Testing EKC Hypothesis with Structural Breaks. J. Clean. Prod. 187, 770–779. doi:10.1016/j.jclepro.2018.03.236
Pata, U. K. (2018b). The Influence of Coal and Noncarbohydrate Energy Consumption on CO2 Emissions: Revisiting the Environmental Kuznets Curve Hypothesis for Turkey. Energy 160, 1115–1123. doi:10.1016/j.energy.2018.07.095
Pesaran, M. H. (2007). A Simple Panel Unit Root Test in the Presence of Cross-Section Dependence. J. Appl. Econ. 22 (2), 265–312. doi:10.1002/jae.951
Pesaran, M. H. (2004). General Diagnostic Tests For Cross Section Dependence In Panels [Working Paper]. Cambridge, United Kingdom: Faculty of Economics. doi:10.17863/CAM.5113
Rees, W. E. (1992). Ecological Footprints and Appropriated Carrying Capacity: What Urban Economics Leaves Out. Environ. Urbanization 4 (2), 121–130. doi:10.1177/095624789200400212
Roca, J. (2003). Do individual Preferences Explain the Environmental Kuznets Curve? Ecol. Econ. 45 (1), 3–10. doi:10.1016/S0921-8009(02)00263-X
Sarkodie, S. A., and Adams, S. (2018). Renewable Energy, Nuclear Energy, and Environmental Pollution: Accounting for Political Institutional Quality in South Africa. Sci. Total Environ. 643, 1590–1601. doi:10.1016/j.scitotenv.2018.06.320
Shafiei, S., and Salim, R. A. (2014). Non-renewable and Renewable Energy Consumption and CO2 Emissions in OECD Countries: A Comparative Analysis. Energy Policy 66, 547–556. doi:10.1016/j.enpol.2013.10.064
Simionescu, M., Szeles, M. R., Gavurova, B., and Mentel, U. (2021). The Impact of Quality of Governance, Renewable Energy and Foreign Direct Investment on Sustainable Development in Cee Countries. Front. Environ. Sci. 9, 425. doi:10.3389/fenvs.2021.765927
Sirag, A., Matemilola, B. T., Law, S. H., and Bany-Ariffin, A. N. (2018). Does Environmental Kuznets Curve Hypothesis Exist? Evidence from Dynamic Panel Threshold. J. Environ. Econ. Pol. 7 (2), 145–165. doi:10.1080/21606544.2017.1382395
Tarverdi, Y. (2018). Aspects of Governance and $$\hbox {CO}_2$$ CO 2 Emissions: A Non-linear Panel Data Analysis. Environ. Resource Econ. 69 (1), 167–194. doi:10.1007/s10640-016-0071-x
Tuna, G., and Tuna, V. E. (2019). The Asymmetric Causal Relationship between Renewable and NON-RENEWABLE Energy Consumption and Economic Growth in the ASEAN-5 Countries. Resour. Pol. 62, 114–124. doi:10.1016/j.resourpol.2019.03.010
UNCSD (2012). Report of the United Nations Conference on Sustainable Development, 216/16. Rio de Janeiro, Brazil, A/CONF.
United Nations Department of Economic and Social Affairs (2021). The Sustainable Development Goals Report 2021. New York, United States: United Nations. doi:10.18356/9789210056083
United Nations (2015). Transforming Our World: The 2030 Agenda for Sustainable development. UN General Assembly, A/RES/70/1.
Usman, M., and Jahanger, A. (2021). Heterogeneous Effects of Remittances and Institutional Quality in Reducing Environmental Deficit in the Presence of EKC Hypothesis: A Global Study with the Application of Panel Quantile Regression. Environ. Sci. Pollut. Res. 28 (28), 37292–37310. doi:10.1007/s11356-021-13216-x
Usman, M., Jahanger, A., Makhdum, M. S. A., Balsalobre-Lorente, D., and Bashir, A. (2022). How Do Financial Development, Energy Consumption, Natural Resources, and Globalization Affect Arctic Countries' Economic Growth and Environmental Quality? an Advanced Panel Data Simulation. Energy 241, 122515. doi:10.1016/j.energy.2021.122515
Usman, M., Makhdum, M. S. A., and Kousar, R. (2021). Does Financial Inclusion, Renewable and Non-renewable Energy Utilization Accelerate Ecological Footprints and Economic Growth? Fresh Evidence from 15 Highest Emitting Countries. Sust. Cities Soc. 65, 102590. doi:10.1016/j.scs.2020.102590
Wackernagel, M., and Rees, W. (1996). Our Ecological Footprint: Reducing Human Impact on the Earth. Gabriola, BC: New Society Publishers.
Wang, Y., Kang, L., Wu, X., and Xiao, Y. (2013). Estimating the Environmental Kuznets Curve for Ecological Footprint at the Global Level: A Spatial Econometric Approach. Ecol. Indicators 34, 15–21. doi:10.1016/j.ecolind.2013.03.021
Wang, Z., Bui, Q., Zhang, B., and Pham, T. L. H. (2020). Biomass Energy Production and its Impacts on the Ecological Footprint: An Investigation of the G7 Countries. Sci. Total Environ. 743, 140741. doi:10.1016/j.scitotenv.2020.140741
Wang, Z., DanishZhang, B., Zhang, B., and Wang, B. (2018). The Moderating Role of Corruption between Economic Growth and CO2 Emissions: Evidence from BRICS Economies. Energy 148, 506–513. doi:10.1016/j.energy.2018.01.167
Westerlund, J. (2005). A Panel CUSUM Test of the Null of Cointegration*. Oxford Bull. Econ. Stats 67 (2), 231–262. doi:10.1111/j.1468-0084.2004.00118.x
Westerlund, J. (2007). Testing for Error Correction in Panel Data. Oxford Bull. Econ. Stats 69 (6), 709–748. doi:10.1111/j.1468-0084.2007.00477.x
Yang, B., Jahanger, A., and Khan, M. A. (2020). Does the Inflow of Remittances and Energy Consumption Increase CO2 Emissions in the Era of Globalization? A Global Perspective. Air Qual. Atmos. Health 13 (11), 1313–1328. doi:10.1007/s11869-020-00885-9
Yang, B., Jahanger, A., Usman, M., and Khan, M. A. (2021a). The Dynamic Linkage between Globalization, Financial Development, Energy Utilization, and Environmental Sustainability in GCC Countries. Environ. Sci. Pollut. Res. 28 (13), 16568–16588. doi:10.1007/s11356-020-11576-4
Yang, B., Usman, M., and jahanger, A. (2021b). Do industrialization, Economic Growth and Globalization Processes Influence the Ecological Footprint and Healthcare Expenditures? Fresh Insights Based on the STIRPAT Model for Countries with the Highest Healthcare Expenditures. Sust. Prod. Consumption 28, 893–910. doi:10.1016/j.spc.2021.07.020
Yilanci, V., and Korkut Pata, U. (2020). Convergence of Per Capita Ecological Footprint Among the ASEAN-5 Countries: Evidence from a Non-linear Panel Unit Root Test. Ecol. Indicators 113, 106178. doi:10.1016/j.ecolind.2020.106178
Zhang, Y.-J., Jin, Y.-L., Chevallier, J., and Shen, B. (2016). The Effect of Corruption on Carbon Dioxide Emissions in APEC Countries: A Panel Quantile Regression Analysis. Technol. Forecast. Soc. Change 112, 220–227. doi:10.1016/j.techfore.2016.05.027

Keywords: EKC hypothesis, ecological footprint, economic growth, renewable energy, governance quality
Citation: Mahmoodi M and Dahmardeh N (2022) Environmental Kuznets Curve Hypothesis With Considering Ecological Footprint and Governance Quality: Evidence From Emerging Countries. Front. Environ. Sci. 10:849676. doi: 10.3389/fenvs.2022.849676
Received: 06 January 2022; Accepted: 01 February 2022;
Published: 22 March 2022.
Edited by:
Cosimo Magazzino, Roma Tre University, ItalyReviewed by:
Atif Jahanger, Hainan University, ChinaCopyright © 2022 Mahmoodi and Dahmardeh. This is an open-access article distributed under the terms of the Creative Commons Attribution License (CC BY). The use, distribution or reproduction in other forums is permitted, provided the original author(s) and the copyright owner(s) are credited and that the original publication in this journal is cited, in accordance with accepted academic practice. No use, distribution or reproduction is permitted which does not comply with these terms.
*Correspondence: Nazar Dahmardeh, bmF6YXJkYWhtYXJkZUBnbWFpbC5jb20=, bmF6YXJAaGFtb29uLnVzYi5hYy5pcg==
Disclaimer: All claims expressed in this article are solely those of the authors and do not necessarily represent those of their affiliated organizations, or those of the publisher, the editors and the reviewers. Any product that may be evaluated in this article or claim that may be made by its manufacturer is not guaranteed or endorsed by the publisher.
Research integrity at Frontiers
Learn more about the work of our research integrity team to safeguard the quality of each article we publish.