 Xueyuan Ren
 Qiang Zhang
 Ping Yue1,2*
 Xinyang Yan
94% of researchers rate our articles as excellent or good
Learn more about the work of our research integrity team to safeguard the quality of each article we publish.
Find out more
ORIGINAL RESEARCH article
Front. Environ. Sci., 29 March 2022
Sec. Atmosphere and Climate
Volume 10 - 2022 | https://doi.org/10.3389/fenvs.2022.847725
The summer monsoon transitional zone is a typical transitional ecosystem that is, also ecologically fragile. It is critical to explore the land surface energy balance and the water and heat transfer processes in this region for water resource management. However, the processes of surface water and heat transfer throughout the transition zone and the effects of environmental factors on energy distribution are understudied. Therefore, we analyzed the surface energy distribution and the environmental factors influencing it in the eastern and western transition zone from July to September, and compared the differing effects of meteorological factors and vegetation on the energy distribution between the two regions. The results show that the main consumption item of the available energy in the west of the transition zone is the latent heat flux. The same is true in the eastern region from July to August, but it changes to sensible heat flux in September. The factors influencing the Bowen ratio in the two regions were ground temperature difference, vapor pressure deficit, shallow soil water content, and drought stress index. Nevertheless, the Bowen ratio in the western region was more sensitive to water factors, whereas that in the eastern region was more sensitive to energy factors. The relationship between the Bowen ratio and the normalized difference vegetation index in the eastern region was more regular. This study provides a scientific basis for reasonably guiding agricultural production in the transition area.
Surface energy balance is a crucial constraint for energy exchange between the surface and the atmosphere, as well as the interactions between ecosystems, human activities, and climate change. It is also the basis for the turbulent flux parameterization scheme in the land surface model (Li et al., 2017). The surface energy distribution results from the interaction of vegetation, climate, and other environmental factors. The study of energy, especially the distribution of turbulent flux and its influencing factors, is vital to regional water resource management and is also critical for scientifically guiding agricultural production.
The eddy covariance system is currently the most widely used model for measuring energy flux, but many studies (Mauder et al., 2007; Chen et al., 2009; Foken et al., 2010; Franssen et al., 2010; Barr et al., 2012; Du et al., 2014; Hu et al., 2018) indicate that the available energy (difference between surface net radiation flux and soil heat flux) measured by the observation system is greater than the turbulent flux (sum of latent heat flux and sensible heat flux), indicating a surface energy imbalance. The energy closure state can be used to evaluate the observation data of an eddy-correlation system. Based on the same observation instruments and data processing methods, the energy closure and distribution characteristics vary regionally. Homogeneous underlying surface tend to have better surface energy closure (Heusinkveld et al., 2004; Liu et al., 2011). However, due to the influence of thermal and dynamic factors on the inhomogeneous underlying surface, the ratio of turbulent flux to net radiation is different (Gu et al., 2006; Li et al., 2006; Yue et al., 2011b; Majozi et al., 2017). The distribution of energy largely depends on surface water and thermal conditions; therefore, meteorological factors related to the moisture and temperature conditions of the underlying surface will affect the energy distribution (Hua and Chen, 2011; Huizhi and Jianwu, 2012; Majozi et al., 2017; Li et al., 2018; Yue et al., 2019).
China is one of the most active summer monsoon regions in the world. The north–south movement of the northern margin of the Asian summer monsoon creates the “summer monsoon transition zone” (Zhang et al., 2017). This area is a long geographical belt that runs from southwest to northeast in northern China, and is highly coincident with an agro-pastoral ecotone, a meteorological disaster-prone area, and a semi-arid, ecologically fragile zone (Zhang et al., 2017). Due to the large east–west span of the transitional zone, the climatic backgrounds and hydro-thermal coupling processes differ among geographical locations, resulting in great differences in the interactions between regional climate and land–air energy exchange (Zeng et al., 2016; Li et al., 2021). Moreover, influenced by the monsoon intensity, the water vapor and precipitation brought by the summer monsoon from July to September each year affects the water, thermal, and solar radiative forcing characteristics of the underlying surfaces (Zhang et al., 2012), altering the surface moisture and energy processes. These changes, as well as vegetation during the growing period, further complicate the factors affecting the surface energy distribution (Zeng et al., 2016; Li et al., 2017; Ping et al., 2018).
Previous studies have considered the north–south gradient of meteorological elements and energy components in the transition zone (Zeng et al., 2016; Zhang et al., 2017), as well as the interannual variability in surface energy (Li et al., 2020; Li et al., 2021). Few studies have paid attention to the differences in energy balance, energy distribution and their influencing factors among regions in the monsoon transition zone on a seasonal scale. Therefore, based on the eddy correlation, surface radiation, and micrometeorological data from different stations of the “Experimental Observation Coordination and Integration Research in Arid and Semi-Arid Regions of China” network and the agricultural meteorological experimental stations on the Loess Plateau from July to September, this study analyzed the surface energy closure states in different regions of the summer monsoon transition zone and the distribution and characteristics of land surface energy. Additionally, the relationships between land surface energy closure and the meteorological elements and vegetation indices are discussed and compared. The results provide a scientific basis for water resource management and guidance for agricultural production in the region.
The yellow and blue lines in Figure 1 divide China into three parts in the north–south direction, with the summer monsoon transition zone between them. Administrative divisions include Gansu, Shaanxi, Ningxia, Inner Mongolia, Shanxi, Hebei, Beijing, Jilin, Heilongjiang, and other provinces, municipalities, and autonomous regions (Zhang et al., 2017). There are significant differences in the spatial and temporal distribution of turbulent energy between the two sides of a specific longitude (113°E) and the Hailar-Harbin line (Li et al., 2021). Based on the spatial distribution of the different modes of the turbulent fluxes (Li et al., 2021), the transition zone was divided into three parts. Hereafter, the area west of 113°E is the western region of the transition zone, the area north of the Hailar-Harbin line is the northern region, and the area between these two lines is the eastern region. Considering the availability of site data, this study only examined the eastern and western areas of the transition zone.
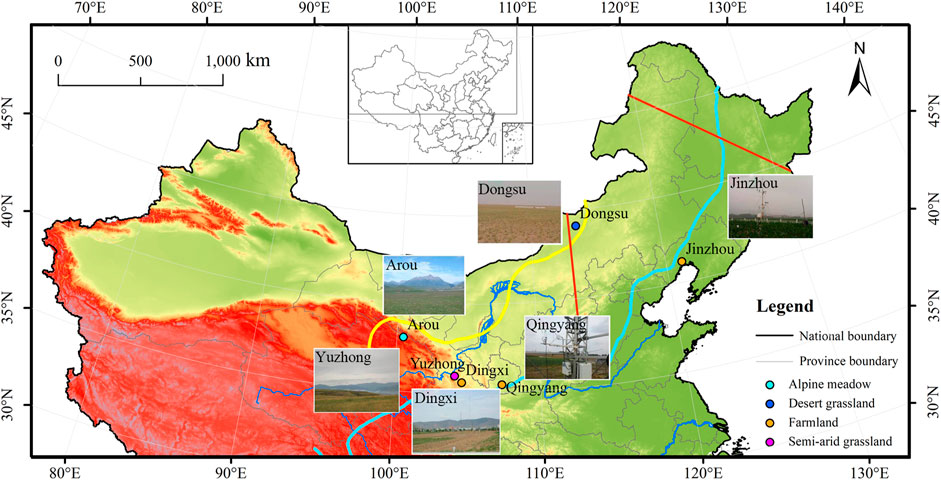
FIGURE 1. Geographical location of the study area. The dots show the observation stations. The regions separated by the red lines, from right to left, are the northern region, the eastern region, and the western region.
The eddy data used in this study were provided by the Key Laboratory of Regional Climate-Environment for Temperate East Asia, the Chinese Academy of Sciences, and the agrometeorological experimental stations on the Loess Plateau. The location of these stations is shown in Figure 1.
The western area of the transition zone includes four stations: Arou, Yuzhong, Dingxi, and Qingyang. Arou Station (100.46°E, 38.04°N) is in the upper reaches of the Heihe River. The area around Arou Station is relatively flat and wide, with an altitude of 3,033 m. The underlying surface is an alpine meadow, and the soil has a large proportion of silt and organic matter. Yuzhong Station (104.13°E, 35.95°N) is located on an open and smooth hillside at an altitude of 1966 m. The underlying surface is covered with low grass vegetation and yellow soil. Dingxi Station (35.58°N, 104.62°E) is on an elevated extension of the Loess Plateau, at an altitude of 1896.7 m. The mean annual temperature and precipitation are 6.7°C and 386 mm, respectively, and the principal crops are potatoes and spring wheat. Qingyang Station (35.44°N, 107.38°E) is in Dongzhiyuan on the Long-dong Loess Plateau, at an altitude of 1,421 m, and has an average annual temperature and precipitation of 8.8°C and 562 mm, respectively. The average annual water surface evaporation is 1,470 mm. The principal crops in Qingyang are winter wheat and summer corn. Table 1 lists the regions and basic climatic elements for the above sites.
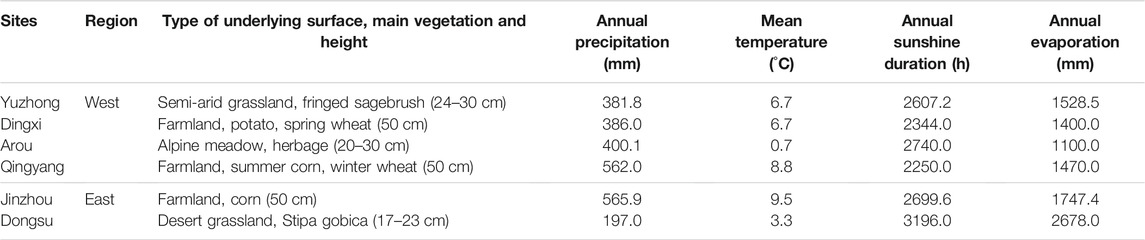
TABLE 1. Climate and vegetation types in each region.
Jinzhou and Dongsu stations are in the eastern region of the transition zone. Dongsu Station (113.57°E, 44.09°N) is in the southeastern Mongolian Plateau at an altitude of 3,033 m. Its underlying surface is mainly desert grassland with small needlegrass, and the soil is mainly light chestnut and brown soil. Jinzhou Station (121.20°E, 41.15°N) is a field observation station located in the eastern Liaoning Corridor, at an altitude of 22.3 m. The underlying surface mainly consists of corn and brown earth.
The selected stations can observe many data types, including weather (ground pressure and precipitation), micro-meteorological (wind speed, temperature, and humidity near the ground), surface energy, and soil (soil temperature and humidity) data. This study used wind speed, air temperature, net atmospheric radiation, surface long-wave radiation, atmospheric long-wave radiation, soil temperature, soil heat flux, and eddy covariance data.
Observation instruments at all stations were of the same model, had high accuracy, and were uniformly calibrated and standardized before the measurements. Please refer to Zhang et al. (2012) for details on the models, measurement ranges, and accuracies of the instruments, as well as other information. Observation data underwent unified quality control; during the collection process, the data quality was controlled by remote monitoring and regular on-site inspection. Additionally, the eddy covariance flux data was processed using the EdiRe software (Robert Clement, University of Edinburgh, UK) developed by the University of Edinburgh, which includes wild point removal, rotating coordinates, turbulence stability calculation, and H2O and CO2 lag correction. Finally, all data underwent further quality control to output more realistic data (Zeng and Zhang, 2012).
The 30-min average of the observation data from each station from July to September 2008 was used, excluding abnormal and default values. Data from rainy days were also eliminated, considering the impact of precipitation on the surface and radiation. Missing observation data of less than 3 h were linearly interpolated based on adjacent measurements. Missing data of more than 12 h were eliminated and replaced by interpolating data corresponding to the observation times on adjacent days. Beijing time was selected for each observation station to facilitate comparative analysis. After data quality control, the data available in the east and west regions accounted for 90.72% and 90.38% of the total data, respectively. In addition, turbulent flux is greatly affected at night (Lavigne et al., 1997; Aubinet et al., 1999; Mahrt, 1999; Law et al., 2001), and using midday data (10:00–16:00) can make the calculation results more reliable (Wilson et al., 2002; McGloin et al., 2019).
Due to the lack of station vegetation index observation data, the normalized difference vegetation index (NDVI) retrieved from the Aqua Moderate Resolution Imaging Spectroradiometer Data was used, with a temporal resolution of 16 days and a spatial resolution of 250 m (https://ladsweb.modaps.eosdis.nasa.gov/search/). The NDVI of each experimental site was obtained from the average values of the four nearest grid points.
The ideal surface energy balance equation is as follows:
in which Rn is the net radiation (
When the available energy is equal to the turbulent flux, the surface energy is in equilibrium. However, observational data show that this equality only exists in an ideal state. In actual observations, this inequality is called “energy unclosed.” This study evaluated this using the Energy Balance Ratio (EBR) and Ordinary Least Squares (OLS).
EBR is the ratio of turbulent flux to available energy, as follows:
EBR can comprehensively assess the surface energy state on a larger time scale by averaging 30 min of measurements (Liu and Feng, 2012). The ideal closed state is when EBR equals 1. This article discusses the energy closure state of different regions on a seasonal scale.
The OLS method is a simple regression model based on the principle of the least square method and is widely used in parameter estimation. When the sum of the squares between the estimated value of the model and the experimental observation is at a minimum, the model is considered the optimal fitting model that can best describe the relationship between the turbulent flux and available energy. The slope of the regression model reflects the degree of surface energy closure (Feng et al., 2017; Wang et al., 2020). When the intercept of the regression curve is 0 and the slope is 1, the surface energy is in the ideal closed state.
The soil heat flux was obtained from heat flux plates buried several centimeters under the ground. When using the surface energy balance equation to analyze energy closure, the soil heat flux G in the equation should theoretically be the surface soil heat flux. Thus, it is necessary to consider the energy storage between the installation depth of the plate and the ground surface. This study used observations from soil heat flow plate of the soil temperature at 0, 2, and 5 cm depths to calculate the heat storage by applying the integral temperature method (Yue et al., 2011a).
in which Gs is the soil heat flux stored from the ground surface to 5 cm deep (
The soil temperature at 2 and 5 cm came from observations, and the following formula was used to calculate the soil temperature at 0 cm:
where
Therefore, the corrected soil heat flux can be expressed as
where G is the surface soil heat flux (
The turbulent flux and its ratio can be used to calculate the Bowen ratio. Bowen ratio is the ratio of sensible heat flux to latent heat flux on a particular interface and can also be expressed as a function of the temperature gradient and humidity gradient in the vertical direction, as follows:
This physical quantity comprehensively describes the climatic characteristics of the land surface process to a certain extent (Zhang et al., 2012) and is an essential variable in estimating turbulent heat and water vapor fluxes in the Bowen ratio energy balance method.
The soil drought stress index (DSI) was employed as an indicator of drought severity and is expressed as follows (Yue et al., 2020):
DSI depends on the water demand of the ecosystem and has a value between 0 and 1. For a DSI value close to 0, the ecosystem is not restricted by water conditions, whereas for a DSI value close to 1, the ecosystem is in a state of water stress. In the above formula, RWC is the physical quantity used to evaluate the soil moisture state and is calculated from the soil moisture content at a depth of 5 cm, as follows:
where SWC is the soil water content at the time of measurement (
Figure 2 shows the diurnal variation in the environmental factors in the western and eastern summer monsoon transition region. During the study period, precipitation in both regions decreased continuously. Moreover, the decrease was greater in the eastern region, and the average precipitation ratio between the two regions was approximately 1:8 in September (Table 2). Additionally, the time distribution of the precipitation was more uniform in the west, whereas the frequency of short-term heavy precipitation was higher in the east (Figure 2). Thus, less continuous rainy weather resulted in sunny conditions in the east. The total sunshine duration in this region was above 240 h from July to September (Table 2). Precipitation in the western region decreased by half in August compared to July, which may have contributed to the increase in sunshine duration. In addition, the average air temperature (Ta) and surface temperature (Ts) in the east were higher than those in the west, influencing water stress. The monthly mean temperature difference between the two regions was above 6°C, and the maximum land surface temperature difference was 5°C (Table 2).
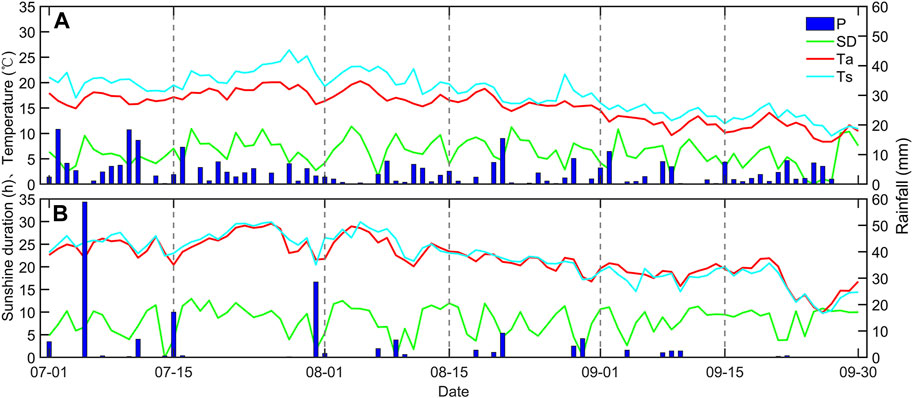
FIGURE 2. Diurnal variations in meteorological factors in the (A) western and (B) eastern summer monsoon transition region. P represents monthly precipitation, SD is the sunshine duration, Ta is the daily mean temperature, and Ts is the average surface temperature.

TABLE 2. Climatic factors in each region. P represents monthly precipitation, SD is the sunshine duration, Ta is the daily mean temperature, and Ts is the average surface temperature.
Figure 3 illustrates the effect of clouds on net radiation. The number of cloudy days in the eastern region is relatively small, accounting for only 37.8% of the study period, while the proportion of cloudy days in the western region is 54.7%. However, when there are clouds, the average net radiation in the eastern region is 6.44

FIGURE 3. Impact of clouds on net radiation in the western and eastern.
Ideally, the surface energy inputs would balance with the energy expenditure, but unbalance occurs in most eddy-correlation system observations. By analyzing the energy closure status, we can evaluate the data quality of the observations and provide verification for later analysis of the energy distribution characteristics and environmental impact factors for each underlying surface. The energy balance analysis for the underlying surfaces from July to September (Figure 4) shows that the determination coefficient of EBR in both areas was above 0.70, with an intercept between −43.61 and 59.89
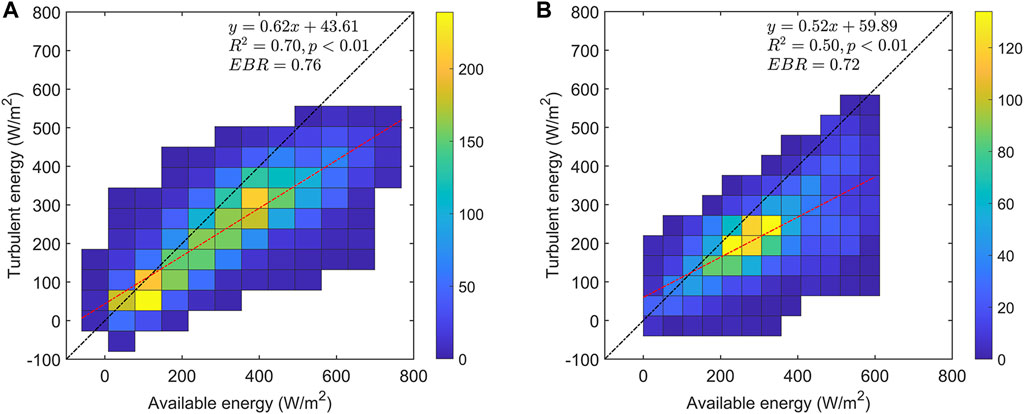
FIGURE 4. Results of energy balance analysis in the (A) west and (B) east. The black dot line is the ideal closure condition, and the red dot line is the energy closure degree obtained by OLS. The color bars represent the count of EBR value.
Both EBR and OLS can evaluate the degree of closure for surface energy. However, the former is a simplified processing method based on the assumption of “no random error,” whereas the latter can balance the influence of error on energy closure. Many studies have shown that the energy closure calculated by EBR is generally higher than that calculated by OLS. Table 3 summarizes the energy closure in various regions. Sánchez et al. (2010) estimated EBR at approximately 0.7 in the Sodankylä forest in northern Finland. Kim et al. (2014) obtained a surface energy closure of 58% and 46% for rice farmland and industrial areas, respectively, near the Nakdong River in South Korea. Rahman et al. (2019) concluded that the energy closure in corn farmland in northwestern Hebei Province, China, is 67%. The energy closure of the research site in this study was slightly higher than that of these studies, which shows that the observed data in this paper are reliable for studying of water and heat exchange in different regions.
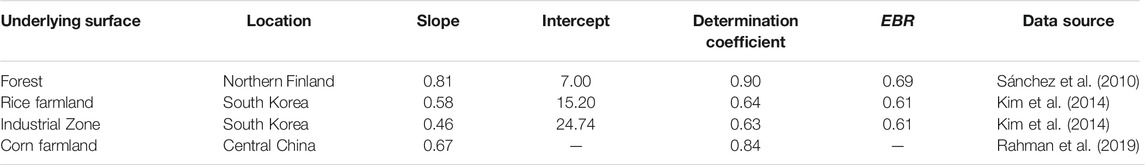
TABLE 3. Energy closure of different underlying surfaces. EBR is the energy balance ratio, and “—” indicates that no specific value was given in the original text.
The near-surface ecosystem exchanges energy and material with the atmosphere through turbulent transport. The differences in climate and surface vegetation cause different surface energy transmissions. The average diurnal variation in energy components in both regions from July to September (Figure 5) shows that the balance components have a unimodal distribution, with prominent diurnal characteristics.
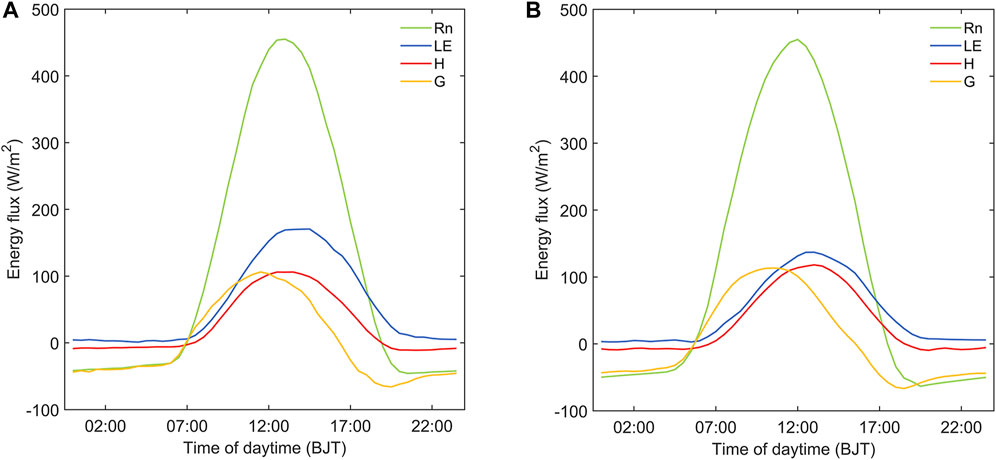
FIGURE 5. Average diurnal variation in main energy components in the (A) western and (B) eastern regions of the transition zone from July to September. Rn is the net radiation, LE is the latent heat flux, H is the sensible heat flux, and G is the soil heat flux. Times are in Beijing Time Research on the impact of vegetation change on land-atmosphere coupling strength in northwest China (BJT).
The average maximum daily net radiation for each area appeared at 11:30–13:00 (Beijing time, the same hereafter). The net radiation in the western region changed from negative to positive during 06:30–07:00, indicating income from surface energy. With solar radiation heating, the net radiation increased, reaching a maximum of 455.01
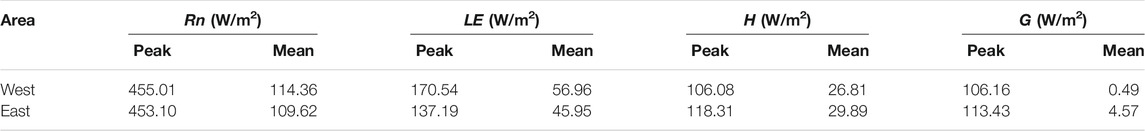
TABLE 4. Annual average daily peak values and average daily values of the energy components. Rn is the net radiation, LE is the latent heat flux, H is the sensible heat flux, and G is the soil heat flux.
The peak latent heat flux in the western region occurred approximately 2 h later than that in the eastern region; the values were 170.54
The daily variation in soil heat flux was a bell-shaped trend, with a peak that occurred 1.5–2.0 h earlier than the net radiation peak. This change is mainly caused by the phase difference between surface soil heat flux and net radiation, which can be supported by the actual observation of Horton and Wierenga. (1983) and the theoretical derivation of Gao et al. (2010). Similar conclusions have been obtained on the Loess Plateau (Yue et al., 2011a). The peak values in the two regions were similar, and the difference was only 7.27
Turbulent flux and surface soil heat flux are the main consumers of net radiation. Their proportion to net radiation can reflect the moisture conditions of the underlying surface (Yue et al., 2015). Overall, all the energy components in the western region increased and then decreased, while those in the east predominantly decreased (Figure 6). The monthly mean value of each energy component in the western region was 1.38–5.26 times that in the eastern region. The smallest difference between the two was in the latent heat flux in July, with a difference of only 43.88
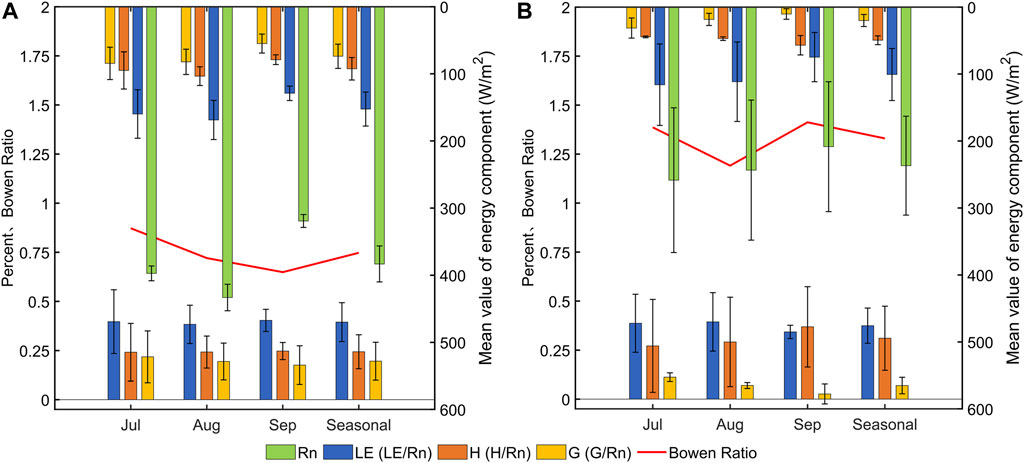
FIGURE 6. Monthly and seasonal averages of the energy components, ratios to net radiation, and Bowen ratios in the (A) western and (B) eastern regions. Rn is the net radiation, LE is the latent heat flux, H is the sensible heat flux, and G is the soil heat flux.
From July to September, the western surface energy mainly heated the atmosphere in the form of latent heat, accounting for 38%–40% of the net radiation, and the percentage of sensible heat flux was essentially stable at 24%. It indicates that the latent heat flux has dominated the distribution of surface energy in this region during the study period. While for the eastern region, after rising from 38.7% in July to 39.4% in August, the percentage of latent heat flux decreased to 34.3% in September, while the sensible heat flux increased monthly from 27.1% in July to 36.9% in September. Contrast that with western region, there is a change in the distribution of surface energy in the eastern region, which further reflects the complexity of the land surface characteristics in the eastern region. The ratio of soil heat flux to net radiation decreased in both regions, but it was higher in the west (8%–22%) than in the east (2.6%–11.2%). The error ratio was also negative (−0.05). From the seasonal average ratio, the proportion of the latent heat flux to the net radiation was 1.62 times that of the sensible heat flux in the western region, while the latent heat flux was only slightly higher than the sensible heat flux in the eastern region. This is consistent with the energy distribution of the two regions mentioned earlier. During the study period, the Bowen ratio decreased in the west and showed a “V”-shaped trend in the east, which matches the changes in turbulent fluxes in the two regions. Comparing the regions, the Bowen ratio in the east was approximately 1.6 times that in the west from July to August, which then increased abruptly to 2.2 times in September. The seasonal average Bowen ratio in the west was approximately 1/2 of that in the east.
The Bowen ratio was primarily affected by the Ts-Ta, vapor pressure deficit, soil water content, and DSI. Figure 7 shows the relationship between the Bowen ratio and these environmental factors on a half-monthly scale. The results show a positive correlation between the Bowen ratio and Ts-Ta. The goodness of fit in both regions was more than 80%, but the regularity of the eastern region was higher (
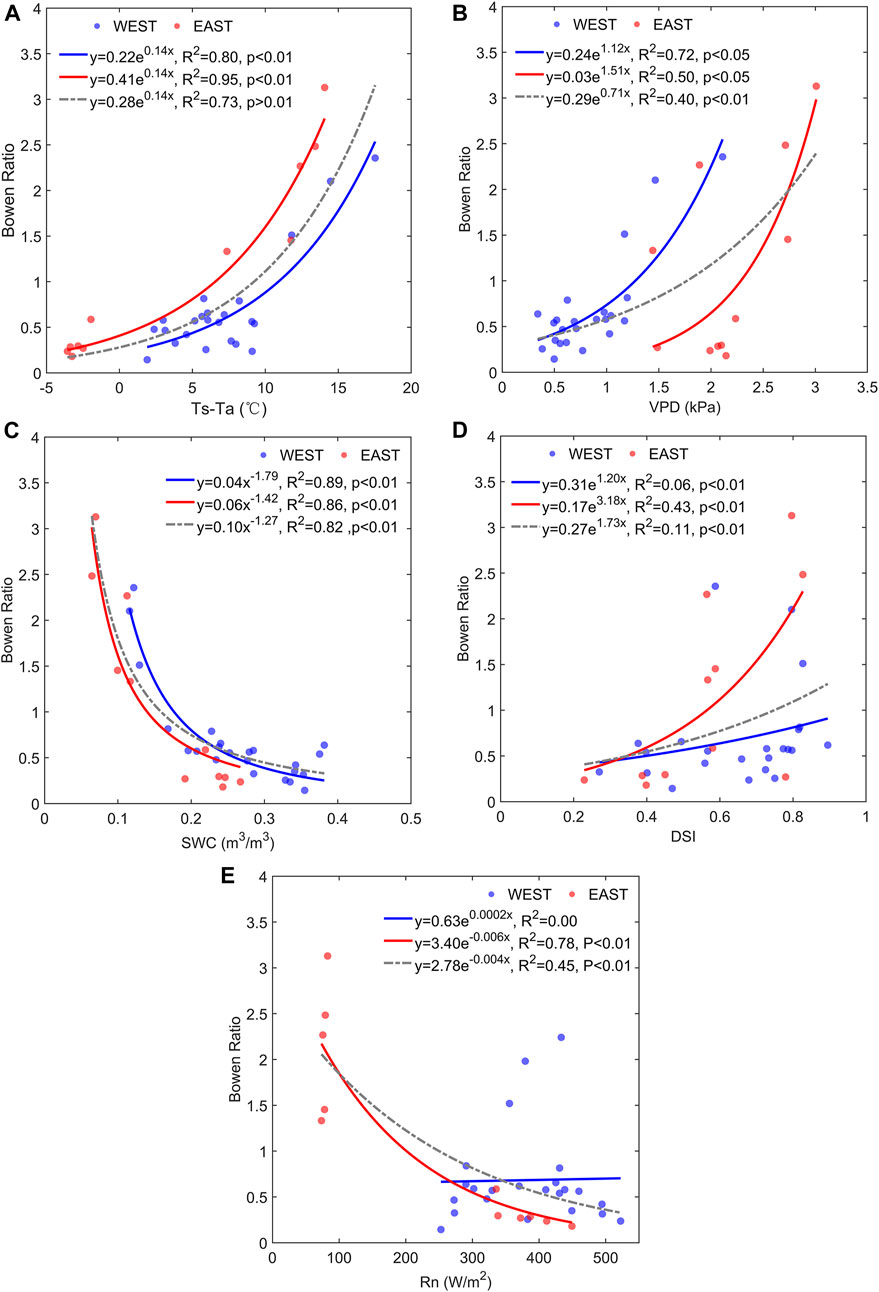
FIGURE 7. Relationships between environmental factors and the Bowen ratio in the western and eastern regions. The blue (western) and red (eastern) solid lines shows the relationships between the Bowen ratio and (A) soil temperature minus air temperature (Ts-Ta), (B) vapor pressure deficit (VPD), (C) soil water content (SWC), (D) drought stress index (DSI), (E) net radiation (Rn). The gray dotted lines represent the overall trends in the above relationships.
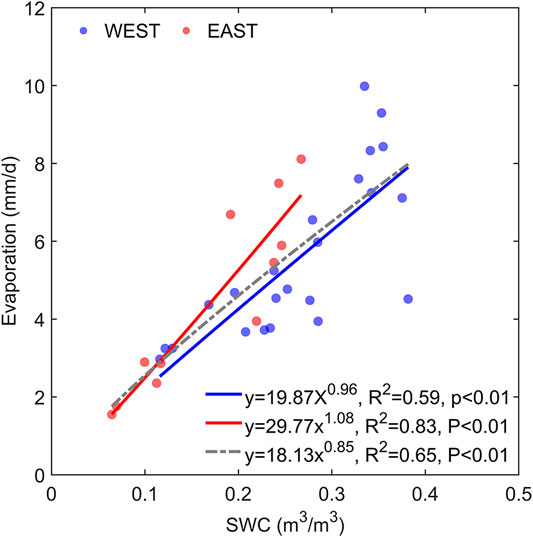
FIGURE 8. Relationship between soil water content and evapotranspiration.
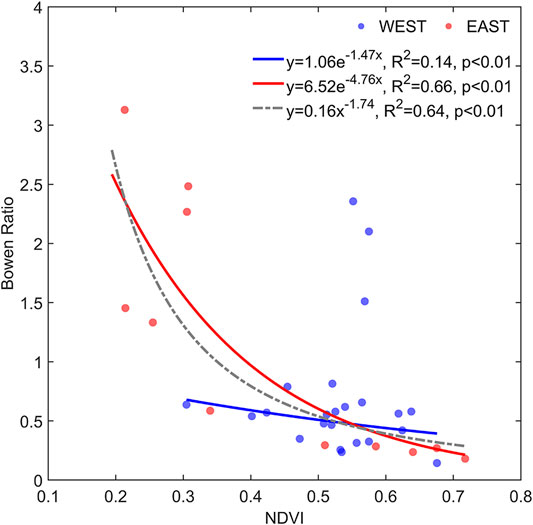
FIGURE 9. Relationship between the normalized difference vegetation index (NDVI) and the Bowen ratio in the transition zone. The solid blue and red lines represent the western and eastern regions, respectively. The gray dotted line in the figure represents the overall trend of the above relationship.
The summer monsoon transition zone is a unique region and ecosystem in China. Its ranges from southwest to northeast across the Chinese mainland (Qian et al., 2009). The eastern and western regions of this area have semi-arid climates. However, the monsoon influences on their climatic conditions differ, which results in a different distribution of surface energy. The eastern region is limited by higher latitudes, and the solar radiation received by the surface is less than that in the western region (Figure 6). In August, the monthly mean net radiation and turbulent flux reached the maximum for the study period, but the proportion of turbulent flux to net radiation was similar to that of the previous month. As shown in Figure 2, the precipitation in the western region decreased by 50% from July to August, but the total sunshine hours increased, resulting in increased solar radiation received by the surface. This increased the energy available for water and heat transfer between the earth and the atmosphere, and improved the efficiency of surface energy distribution in this area (Figure 6). In September, the sensible and latent heat fluxes decreased differently in the west with the decrease of net radiation. However, the ratio of the two to the net radiation showed that the latent heat flux played a predominant role in the energy distribution in this region. In the eastern region, the decrease in latent heat flux in August was less than that of net radiation, and the sensible heat flux increased, which resulted in an increase in the proportion of turbulent flux to net radiation. The change in the ratio of turbulent flux to net radiation showed that the distribution of surface energy was changing in the eastern region. In September, the ratio of sensible heat flux to latent heat flux was higher and became the main consumer of available energy, altering the dominant surface energy factor. With the decrease in precipitation, the sensible heat flux in the eastern region increased continuously, and the Bowen ratio also reached a maximum value in study period.
The soil heat flux in both regions decreased monthly (Figure 6), and although the amount of heat stored in the western region was significantly higher than that in the eastern region, the soil in the two regions converted from heat sinks to heat sources. During the study period, the net radiation and precipitation in the two regions gradually decreased, and the soil water content also decreased further. Surface water conditions actually experienced a transition from wet to dry. When the surface is wet, the heat of deep soil is higher than that of shallow soil; while when the surface is dry, the heat of deep soil is lower than that of shallow soil (Yue et al., 2015). When G <0, it means that the soil starts to heat the atmosphere as a heat source. The change is particularly evident in the east. The magnitude of the soil heat flux in September indicated that the eastern region would complete this conversion earlier. Nevertheless, the Bowen ratios in the western region from July to September were all less than 1, and the seasonal mean was only 0.75. The Bowen ratios in the eastern region were all greater than 1, with a seasonal mean of 1.32. This not only explains the difference in energy distribution characteristics between the two regions, but also reflects the complexity of land surface characteristics in the east and west regions of the transition zone.
Solar radiation (Yang et al., 2019), rainfall dynamics, and irrigation (Ozdogan et al., 2010) affect the water potential gradient and surface resistance and change the soil moisture. These factors directly affect the surface evaporation and regulate the water vapor transport between the earth and the atmosphere, thus affecting the Bowen ratio (Chen et al., 2009; Ozdogan et al., 2010). Bowen ratio in the eastern region was higher than that in the western region (Figure 6). The difference between soil and air temperature was the main contributor to surface sensible heat, and there was a positive correlation between them (Yue et al., 2012). Therefore, the sensible heat flux in the eastern region was lower than that in the western region, which is consistent with Figure 5. In addition, in the western region, the response of Bowen ratio to soil water content and vapor pressure deficit is more rapid (Figures 6B,C), which further indicates that although both areas were semi-arid, the climate in the west was wetter and less subject to water stress (Figure 6D), due to non-uniform temporal and spatial distribution of the monsoon precipitation. The precipitation in both regions decreased from July to September. Comparing the regions, the temporal distribution of precipitation was more uniform in the western region, but short-term heavy precipitation was more frequent in the eastern region. Hence, the water content in the soil was higher in the western region.
In fact, the influence of environmental factors on energy distribution is realized through the regulation of surface evapotranspiration. Surface evapotranspiration depends on the availability of soil moisture as well as surface net radiation. Net radiation directly affects temperature, and increases in temperature increase potential evapotranspiration. An increase in evapotranspiration will lead to a decrease in soil moisture, which limits vegetation growth, resulting in a decrease in surface evapotranspiration and ultimately a decrease in latent heat flux (Zhang et al., 2019). The western region had a high frequency of precipitation and high soil moisture. Net radiation affected potential evapotranspiration through the regulation of temperature. The increase of temperature would enhance the surface evapotranspiration and promoted the transport of water vapor between the earth and the atmosphere. The eastern region had more short-term heavy precipitation. Within a few days after the precipitation event, the mechanism affecting surface evapotranspiration was the same as that in the western region. It may even temporarily appear that the soil water content was close to saturation because the soil infiltration intensity was less than the rain intensity (Guidelines for Analysis and Evaluation of Mountain Flood Disasters, 2015). However, after the end of the precipitation event, the soil was short of water and the growth of vegetation was affected, which means that evapotranspiration was limited. Due to soil water stress, the increase of temperature would weaken the surface evapotranspiration and further reduce the latent heat flux. Same result has been reported by Koster et al. (2004). Therefore, in this study, the energy distribution in the two regions is very sensitive to the moisture factor, but the eastern region is also restricted by the energy factor.
The differences in sensible heat and latent heat among underlying surfaces with different vegetation types result from the combined effects of precipitation, radiation, ground temperature difference, wind speed, and other factors; the Bowen ratio comprises these factors. The NDVI can compare various vegetation types and indicate the correlation between the energy distribution difference and the underlying surface type. Most of the underlying vegetation in the eastern region is desert grassland, while that in the western region was mostly semi-arid grassland and farmland. Due to the difference in vegetation coverage between the two regions, the NDVI in the western region was significantly higher than that in the eastern region (Figure 9). In different types of ecosystems, vegetation can affect the hydrological/energy balance of the land-atmosphere system by changing surface biophysical characteristics (Burakowski et al., 2018). Hence, the main vegetation types also magnified the water difference between the two regions. It is dominated by sandy loam soil in the east and black loam soil in the west. Under the same vegetation coverage, the water storage capacity of the two is different. The western region is relatively humid and the vegetation transpiration is strong, which further increases the evapotranspiration, while the eastern region is just the opposite. Meteorological factors will have a macro impact on the growth of vegetation, which affects leaf transpiration and evaporation and changes the surface albedo and roughness to indirectly affect energy distribution (Zhao and Liu, 2015). The higher the vegetation growth status and coverage, the more significant the latent heat flux role in energy distribution (Wen et al., 2014). Alternatively, When the surface is dry, due to the low soil water content, the vegetation coverage is low, and the surface albedo is low. when the surface is wet, the opposite is true. This difference in surface albedo will significantly affect the efficiency of converting shortwave radiation into net radiation, thus affecting the process of water and heat transfer between the surface and the atmosphere (Zhang et al., 2012; Yue et al., 2015).
By using observational data from experimental stations in the transitional zone of the summer monsoon, this study analyzed the characteristics of surface energy distribution and the diurnal variation in its energy components in the eastern and western regions of the zone from July to September. The surface energy components in both regions showed a single-peak trend with diurnal variations. The maximum latent heat fluxes in the eastern and western regions were 137.19
The differences in meteorological factors and vegetation index involved in the process of energy distribution in these two regions were also examined. The factors influencing the Bowen ratio were the difference between surface and air temperature, vapor pressure deficit, soil water content, and DSI. The goodness of fit between the Bowen ratio and temperature difference in both regions was greater than 80%, but the regularity was higher in the eastern region (
The special location of the summer monsoon transition zone increases the complexity of the spatial distribution and temporal variation of the physical quantities on the surface. Due to the non-uniform distribution of observation stations, this study only considered the energy closure and energy distribution characteristics in the eastern and western regions of the transition zone in China. There are currently no comparisons between the above two regions and the northern region in the process of water and heat transfer. Additionally, for these two regions, this study did not consider the energy closure caused by the loss of energy flux, heat storage in the vegetation canopy and air, measurement errors, and other issues. Furthermore, this study only considered the energy distribution characteristics under clear weather conditions in summer; however, an analysis of energy balance during other weather conditions and seasons or for longer time scales is lacking in these regions. Therefore, the heat and water transfer in the transitional zone of the summer monsoon needs further study.
The raw data supporting the conclusion of this article will be made available by the authors, without undue reservation.
Conceptualization, QZ and PY; methodology, XR; validation, PY; formal analysis, XR; data curation, XR and XY; writing—original draft preparation, XR; writing—review and editing, XR and YY. All authors have read and agreed to the published version of the manuscript.
This research was funded by the National Natural Science Foundation of China under grant Nos. U2142208, 41975016, 41705075, and the Basic Science Fund for Creative Research Groups of Gansu Province, grant number 20JR5RA121).
The authors declare that the research was conducted in the absence of any commercial or financial relationships that could be construed as a potential conflict of interest.
All claims expressed in this article are solely those of the authors and do not necessarily represent those of their affiliated organizations, or those of the publisher, the editors and the reviewers. Any product that may be evaluated in this article, or claim that may be made by its manufacturer, is not guaranteed or endorsed by the publisher.
We are grateful to the NASA Goddard Space Center for providing remote sensing data for this study.
Aubinet, M., Grelle, A., Ibrom, A., Rannik, Ü., Moncrieff, J., Foken, T., et al. (1999). Estimates of the Annual Net Carbon and Water Exchange of Forests: The EUROFLUX Methodology. Adv. Ecol. Res. 30, 114–175. doi:10.1016/S0065-2504(08)60018-5
Barr, A. G., van der Kamp, G., Black, T. A., McCaughey, J. H., and Nesic, Z. (2012). Energy Balance Closure at the BERMS Flux Towers in Relation to the Water Balance of the White Gull Creek Watershed 1999-2009. Agric. For. Meteorol. 153, 3–13. doi:10.1016/j.agrformet.2011.05.017
Burakowski, E., Tawfik, A., Ouimette, A., Lepine, L., Novick, K., Ollinger, S., et al. (2018). The Role of Surface Roughness, Albedo, and Bowen Ratio on Ecosystem Energy Balance in the Eastern United States. Agric. For. Meteorol. 249, 367376. doi:10.1016/j.agrformet.2017.11.030
Chen, S., Chen, J., Lin, G., Zhang, W., Miao, H., Wei, L., et al. (2009). Energy Balance and Partition in Inner Mongolia Steppe Ecosystems with Different Land Use Types. Agric. For. Meteorol. 149, 1800–1809. doi:10.1016/j.agrformet.2009.06.009
Du, Q., Liu, H., Feng, J., and Wang, L. (2014). Effects of Different gap Filling Methods and Land Surface Energy Balance Closure on Annual Net Ecosystem Exchange in a Semiarid Area of China. Sci. China Earth Sci. 57, 1340–1351. doi:10.1007/s11430-013-4756-5
Feng, Y., Gong, D., Mei, X., Hao, W., Tang, D., and Cui, N. (2017). Energy Balance and Partitioning in Partial Plastic Mulched and Non-mulched maize fields on the Loess Plateau of China. Agric. Water Manage. 191, 193–206. doi:10.1016/j.agwat.2017.06.009
Foken, T., Mauder, M., Liebethal, C., Wimmer, F., Beyrich, F., Leps, J.-P., et al. (2010). Energy Balance Closure for the LITFASS-2003 experiment. Theor. Appl. Climatol. 101, 149–160. doi:10.1007/s00704-009-0216-8
Franssen, H. J. H., Stöckli, R., Lehner, I., Rotenberg, E., and Seneviratne, S. I. (2010). Energy Balance Closure of Eddy-Covariance Data: A Multisite Analysis for European FLUXNET Stations. Agric. For. Meteorol. 150, 1553–1567. doi:10.1016/j.agrformet.2010.08.005
Gao, Z., Horton, R., and Liu, H. P. (2010). Impact of Wave Phase Difference between Soil Surface Heat Flux and Soil Surface Temperature on Soil Surface Energy Balance Closure. J. Geophys. Res. 115, D16112. doi:10.1029/2009JD013278
Gu, L., Meyers, T., Pallardy, S. G., Hanson, P. J., Yang, B., Heuer, M., et al. (2006). Direct and Indirect Effects of Atmospheric Conditions and Soil Moisture on Surface Energy Partitioning Revealed by a Prolonged Drought at a Temperate forest Site. J. Geophys. Res. 111, D16102. doi:10.1029/2006JD007161
Guidelines for Analysis and Evaluation of Mountain Flood Disasters (2015). in Chienes in Research Center of Flood Control and Drought Relief Engineering Technology, Ministry of Water Resources of China. Available at: http://www.qgshzh.com/show/587abf48-0bdd-4f34-96f3-8f94a5b9dfe3 (Accessed February 19, 2022).
Heusinkveld, B. G., Jacobs, A. F. G., Holtslag, A. A. M., and Berkowicz, S. M. (2004). Surface Energy Balance Closure in an Arid Region: Role of Soil Heat Flux. Agric. For. Meteorol. 122, 21–37. doi:10.1016/j.agrformet.2003.09.005
Horton, R., and Wierenga, P. J. (1983). Estimating the Soil Heat Flux from Observations of Soil Temperature Near the Surface. Soil Sci. Soc. Am. J. 47 (1), 14–20. doi:10.2136/sssaj1983.03615995004700010003x
Hu, Y., Zhong, L., Ma, Y., Zou, M., Huang, Z., Xu, K., et al. (2018). Model Estimation and Validation of the Surface Energy Fluxes at Typical Underlying Surfaces over the Qinghai-Tibetan Plateau. Plateau Meteorol. 37, 1499–1510. doi:10.7522/j.issn.1000-0534.2018.00045
Hua, W., and Chen, H. (2011). Response of Land Surface Processes to Global Warming and its Possible Mechanism Based on CMIP3 Multi-Model Ensembles. Chin. J. Atmos. Sci. 35, 121–133. doi:10.3878/j.issn.1006-9895.2011.01.10
Huizhi, L., and Jianwu, F. (2012). Seasonal and Interannual Variations of Evapotranspiration and Energy Exchange over Different Land Surfaces in a Semiarid Area of China. J. Appl. Meteorol. Climatol. 51 (10), 1875–1888. doi:10.1175/JAMC-D-11-0229.1
Kim, S., Lee, Y.-H., Kim, K. R., and Park, Y.-S. (2014). Analysis of Surface Energy Balance Closure over Heterogeneous Surfaces. Asia-pacific J. Atmos. Sci. 50, 553–565. doi:10.1007/s13143-014-0045-2
Koster, R. D., Dirmeyer, P. A., Guo, Z., Bonan, G., Chan, E., Cox, P., et al. (2004). Regions of strong Coupling between Soil Moisture and Precipitation. Science 305 (5687), 1138–1140. doi:10.1126/science.1100217
Lavigne, M. B., Ryan, M. G., Anderson, D. E., Baldocchi, D. D., Crill, P. M., Fitzjarrald, D. R., et al. (1997). Comparing Nocturnal Eddy Covariance Measurements to Estimates of Ecosystem Respiration Made by Scaling Chamber Measurements at Six Coniferous Boreal Sites. J. Geophys. Res. 102, 28977–28985. doi:10.1029/97JD01173
Law, B. E., Goldstein, A. H., Anthoni, P. M., Unsworth, M. H., Panek, J. A., Bauer, M. R., et al. (2001). Carbon Dioxide and Water Vapor Exchange by Young and Old Ponderosa pine Ecosystems during a Dry Summer. Tree Physiol. 21, 299–308. doi:10.1093/treephys/21.5.299
Li, S.-G., Eugster, W., Asanuma, J., Kotani, A., Davaa, G., Oyunbaatar, D., et al. (2006). Energy Partitioning and its Biophysical Controls above a Grazing Steppe in central Mongolia. Agric. For. Meteorol. 137, 89–106. doi:10.1016/j.agrformet.2006.03.010
Li, H., Fu, C., and Guo, W. (2017). An Integrated Evaluation of Land Surface Energy Fluxes over China in Seven Reanalysis/modeling Products. J. Geophys. Res. Atmos. 122, 8543–8566. doi:10.1002/2016JD026166
Li, H., Xiao, Z., and Zhu, Y. (2018). Variation Characteristics of the Surface Turbulent Flux and the Components of Radiation Balance over the Grassland in the southeastern Tibetan Plateau. Plateau Meteorol. 37, 923–935. (in Chinese). doi:10.7522/j.issn.1000-0534.2017.00097
Li, H., Zhang, Q., Wang, C., Ma, G., Jing, Y., Yue, P., et al. (2020). New Dataset Based on Multi-Source Land Surface Flux Data and its Application in the East Asian Summer Monsoon Boundary Area. Chin. J. Atmos. Sci. (In Chinese) 44 (6), 1224–1242. doi:10.3878/j.issn.1006-9895.2005.19192
Li, H., Zhang, Q., Yue, P., Zhang, L., Niu, X., Zhang, H., et al. (2021). Temporal Duration of the East Asian Summer Monsoon Substantially Affects Surface Energy Exchange over the Summer Monsoon Transition Zone of China. J. Clim. 34, 1–52. doi:10.1175/jcli-d-20-0102.1
Liu, H. Z., and Feng, J. W. (2012). Seasonal and Interannual Variations of Evapotranspiration and Energy Exchange over Different Land Surfaces in a Semiarid Area of China. J. Appl. Meteorol. Climatol. 51 (10), 1875–1888. doi:10.1175/JAMC-D-11-0229.1
Liu, S. M., Xu, Z. W., Wang, W. Z., Jia, Z. Z., Zhu, M. J., Bai, J., et al. (2011). A Comparison of Eddy-Covariance and Large Aperture Scintillometer Measurements with Respect to the Energy Balance Closure Problem. Hydrol. Earth Syst. Sci. 15, 1291–1306. doi:10.5194/hess-15-1291-2011
Mahrt, L. (1999). Stratified Atmospheric Boundary Layers. Boundary-Layer Meteorol. 90, 375–396. doi:10.1023/A:1001765727956
Majozi, N. P., Mannaerts, C. M., Ramoelo, A., Mathieu, R., Nickless, A., and Verhoef, W. (2017). Analysing Surface Energy Balance Closure and Partitioning over a Semi-arid savanna FLUXNET Site in Skukuza, Kruger National Park, South Africa. Hydrol. Earth Syst. Sci. 21, 3401–3415. doi:10.5194/hess-21-3401-2017
Mauder, M., Jegede, O. O., Okogbue, E. C., Wimmer, F., and Foken, T. (2007). Surface Energy Balance Measurements at a Tropical Site in West Africa during the Transition from Dry to Wet Season. Theor. Appl. Climatol. 89, 171–183. doi:10.1007/s00704-006-0252-6
McGloin, R., Šigut, L., Fischer, M., Foltýnová, L., Chawla, S., Trnka, M., et al. (2019). Available Energy Partitioning during Drought at Two Norway spruce Forests and a European Beech forest in Central Europe. J. Geophys. Res. Atmos. 124 (7), 3726–3742. doi:10.1029/2018JD029490
Ozdogan, M., Rodell, M., Beaudoing, H. K., and Toll, D. L. (2010). Simulating the Effects of Irrigation over the United States in a Land Surface Model Based on Satellite-Derived Agricultural Data. J. Hydrometeorol. 11, 171–184. doi:10.1175/2009jhm1116.1
Ping, Y., Qiang, Z., Yang, Y., Zhang, L., Zhang, H., Hao, X., et al. (2018). Seasonal and Inter-annual Variability of the Bowen Smith Ratio over a Semi-arid Grassland in the Chinese Loess Plateau. Agric. For. Meteorol. 252, 99–108. doi:10.1016/j.agrformet.2018.01.006
Qian, W., Ding, T., Hu, H., Lin, X., and Qin, A. (2009). An Overview of Dry-Wet Climate Variability Among Monsoon-westerly Regions and the Monsoon Northernmost Marginal Active Zone in China. Adv. Atmos. Sci. 26, 630–641. doi:10.1007/s00376-009-8213-5
Rahman, M. M., Zhang, W., and Wang, K. (2019). Assessment on Surface Energy Imbalance and Energy Partitioning Using Ground and Satellite Data over a Semi-arid Agricultural Region in north China. Agric. Water Manage. 213, 245–259. doi:10.1016/j.agwat.2018.10.032
Sánchez, J. M., Caselles, V., and Rubio, E. M. (2010). Analysis of the Energy Balance Closure over a FLUXNET Boreal forest in Finland. Hydrol. Earth Syst. Sci. Discuss. 7, 2683–2707. doi:10.5194/hessd-7-2683-2010
Wang, X., Huo, Z., Shukla, M. K., Wang, X., Guo, P., Xu, X., et al. (2020). Energy Fluxes and Evapotranspiration over Irrigated maize Field in an Arid Area with Shallow Groundwater. Agric. Water Manage. 228, 105922. doi:10.1016/j.agwat.2019.105922
Wen, X., Liao, X., Yuan, W., Yan, X., Wei, Z., Liu, H., et al. (2014). Numerical Simulation and Data Assimilation of the Water-Energy Cycle over Semiarid Northeastern China. Sci. China Earth Sci. 57, 2340–2356. doi:10.1007/s11430-014-4914-4
Wilson, K. B., Baldocchi, D. D., Aubinet, M., Berbigier, P., Bernhofer, C., Dolman, H., et al. (2002). Energy Partitioning between Latent and Sensible Heat Flux during the Warm Season at FLUXNET Sites. Water Resour. Res. 38 (12), 30–31. doi:10.1029/2001WR000989
Yang, Z., Zhang, Q., Hao, X., and Yue, P. (2019). Changes in Evapotranspiration over Global Semiarid Regions 1984-2013. J. Geophys. Res. Atmos. 124, 2946–2963. doi:10.1029/2018jd029533
Yue, P., Zhang, Q., Niu, S., Cheng, H., and Wang, X. (2011a). Effects of the Soil Heat Flux Estimates on Surface Energy Balance Closure over a Semi-arid Grassland. Acta Meteorol. Sin 25 (6), 774–782. doi:10.1007/s13351-011-0608-4
Yue, P., Zhang, Q., Yang, J., Li, H., Sun, X., Yang, Q., et al. (2011b). Surface Heat Flux and Energy Budget for Semi-arid Grassland on the Loess Plateau. Acta Ecol. Sin (In Chinese) 31 (22), 6866–6876.
Yue, P., Li, Y., Zhang, Q., and Zhang, L. (2012). Surface Energy-Balance Closure in a Gully Region of the Loess Plateau at SACOL on Eastern Edge of Tibetan Plateau. J. Meteorol. Soc. Jpn. 90C, 173–184. doi:10.2151/jmsj.2012-C12
Yue, P., Zhang, Q., Zhao, W., Wang, R., Zhang, L., Wang, W., et al. (2015). Influence of Environmental Factors on Land-Surface Water and Heat Exchange during Dry and Wet Periods in the Growing Season of Semiarid Grassland on the Loess Plateau. Sci. China Earth Sci. 58 (11), 2002–2014. doi:10.1007/S11430-015-5133-3
Yue, P., Zhang, Q., Zhang, L., Li, H., Yang, Y., Zeng, J., et al. (2019). Long-term Variations in Energy Partitioning and Evapotranspiration in a Semiarid Grassland in the Loess Plateau of China. Agric. For. Meteorol. 278, 107671. doi:10.1016/j.agrformet.2019.107671
Yue, P., Zhang, Q., Zhang, L., Yang, Y., Wei, W., Yang, Z., et al. (2020). Biometeorological Effects on Carbon Dioxide and Water-Use Efficiency within a Semiarid Grassland in the Chinese Loess Plateau. J. Hydrol. 590, 125520. doi:10.1016/j.jhydrol.2020.125520
Zeng, J., and Zhang, Q. (2012). Mean Characteristics of Land Surface Key Parameters in Semi-arid and Arid Regions of China in Summer of 2008. Plateau Meteorol. 31, 1539–1550. (In Chinese).
Zeng, J., Zhang, Q., and Wang, C. L. (2016). Spatial-temporal Pattern of Surface Energy Fluxes over the East Asian Summer Monsoon Edge Area in China and its Relationship with Climate. Acta Meteorol. Sin. 74, 876–888. (In Chinese). doi:10.11676/qxxb2016.064
Zhang, Q., Zeng, J., and Zhang, L. (2012). Characteristics of Land Surface thermal-hydrologic Processes for Different Regions over North China during Prevailing Summer Monsoon Period. Sci. China Earth Sci. 55, 1872–1880. doi:10.1007/s11430-012-4373-8
Zhang, Q., Zhang, H. L., Zhang, L., and Yue, P. (2017). Study on Summer Monsoon Transition Zone and its Land–Air Interaction (In Chinese). Adv. Earth Sci. 32, 1009–1019. doi:10.11867/j.issn.1001-8166.2017.10.1009
Zhang, Q., Yang, Z., Hao, X., and Yue, P. (2019). Conversion Features of Evapotranspiration Responding to Climate Warming in Transitional Climate Regions in Northern China. Clim. Dyn. 52 (7), 3891–3903. doi:10.1007/s00382-018-4364-3
Zhang, J., Zhang, Q., and Tang, C. (2013). Temporal Variety of Boundary Layer Height over Deep Arid Region and the Relations with Energy Balance. Acta Eco Sin 33, 2545–2555. doi:10.5846/stxb201201090046
Keywords: energy balance, turbulent flux, environmental factors, summer monsoon transition zone, water stress
Citation: Ren X, Zhang Q, Yue P, Yan X and Yang Y (2022) Energy Distribution Characteristics and Environmental Impact Factors in Different Regions of the Summer Monsoon Transition Zone. Front. Environ. Sci. 10:847725. doi: 10.3389/fenvs.2022.847725
Received: 03 January 2022; Accepted: 15 March 2022;
Published: 29 March 2022.
Edited by:
Suvarna Sanjeev Fadnavis, Indian Institute of Tropical Meteorology (IITM), IndiaReviewed by:
Pyarimohan Maharana, Nalanda University, IndiaCopyright © 2022 Ren, Zhang, Yue, Yan and Yang. This is an open-access article distributed under the terms of the Creative Commons Attribution License (CC BY). The use, distribution or reproduction in other forums is permitted, provided the original author(s) and the copyright owner(s) are credited and that the original publication in this journal is cited, in accordance with accepted academic practice. No use, distribution or reproduction is permitted which does not comply with these terms.
*Correspondence: Ping Yue, anF5dWVwaW5nQDEyNi5jb20=
Disclaimer: All claims expressed in this article are solely those of the authors and do not necessarily represent those of their affiliated organizations, or those of the publisher, the editors and the reviewers. Any product that may be evaluated in this article or claim that may be made by its manufacturer is not guaranteed or endorsed by the publisher.
Research integrity at Frontiers
Learn more about the work of our research integrity team to safeguard the quality of each article we publish.