 Jin Luo
 Yuan Wang
 Lin Zhu4
- 1Institute of Geography, Fujian Normal University, Fuzhou, China
- 2Key Laboratory for Humid Subtropical Eco-geographical Processes of the Ministry of Education, School of Geographical Sciences, Fujian Normal University, Fuzhou, China
- 3State Key Laboratory of Pollution Control and Resource Reuse, School of Environment, Nanjing University, Nanjing, China
- 4Nanjing Institute of Environmental Sciences, Ministry of Ecology and Environment, Nanjing, China
- 5Faculty of Economics, Otemon Gakuin University, Osaka, Japan
With growing concerns about the allocation inequality of environmental benefits and pollution, it is crucial to investigate whether a special characteristic of China’s environmental inequality has emerged. The present study aims to elucidate the regional spatial features of industrial pollution inequality (IPI) (waste gas, wastewater, and solid waste measured by the Theil index separately) and their relevance to national territorial space planning strategies. Furthermore, we make a novel attempt to develop an integrated framework that employs a developed-Kaya identity with the Logarithmic Mean Divisia Index method to uncover the driving force of IPI disparities. We make use of the data published recently by the provincial panel of China, during the period 2000–2015. Based on this information, we found notable spatial-temporal heterogeneity in China’s IPI, highly correlated to China’s core national territorial space planning strategy, the “T-shaped” spatial development strategy. The empirical results support the “structural features” hypothesis in IPI for China. In particular, the Coastal Region has a great edge in industrial pollution equality. In most provinces in the Inland Corridor along the Yangtze River, the trend of IPI has been alleviated to some extent. However, provinces further inland that are off-side the two axes of “T-shaped” spatial development strategy have to respond to the two-fold challenge of the exacerbated trend in IPI both within and between the regions. Our findings also indicate that the effect of technological inequality is the main driving force for IPI in the earlier stage of development. However, effects of economic inequality together with that of economic structure inequality manifest in the middle or transition period and the economic inequality effect is the determinant in the later stage of development. Additionally, contributions of size effect and inequality effect are changeable over development process, economic inequality effect outweighs the economic size effect for IPI in more developed districts or districts in higher developing phases. These findings may help the government incorporate environmental equality goals into regional policies and contribute to the emerging literature on environmental inequality.
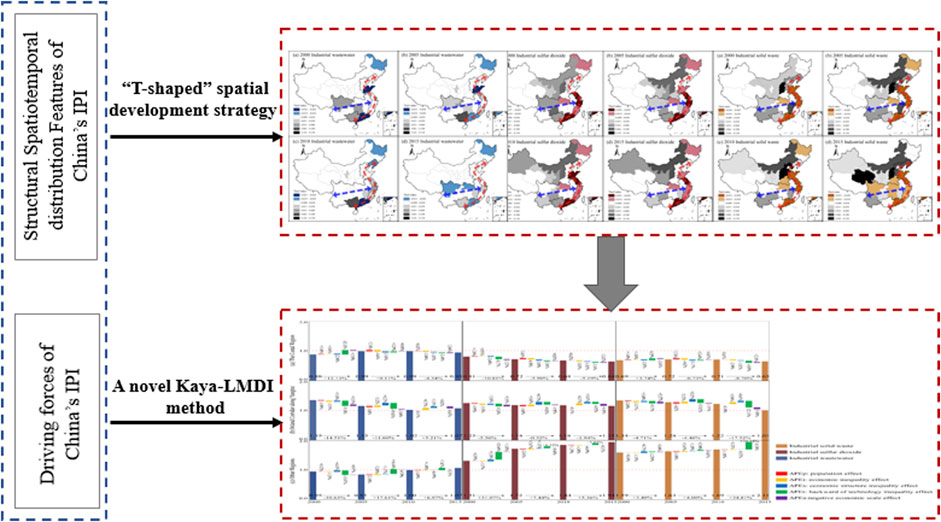
GRAPHICAL ABSTRACT
Introduction
Inequality impedes long-term social and economic development (Rashid et al., 2019). In the wake of the COVID-19 pandemic, existing inequalities had been deepened (FAO, 2020), which significantly undermine the overall implementation of the 2030 Agenda for Sustainable Development (UNDP, 2019). In addition to economic inequality, environmental inequality is usually concealed and overlooked under economic development (Sovacool et al., 2016; Jenkins et al., 2017; UNDP, 2019). Regarded as “slow violence” (Nixon, 2011), environmental degradation significantly affects the wellbeing of the poor more than that of the rich. That is, some groups consume far more of our environmental resources and have more access to information and technology than others, while some groups suffer from more serious environmental pollution and have less access to information and technology than others (Clayton, 2000). Meanwhile, low-income and poor social capital populations incline to live in polluted areas where the rent is relatively low (Temper et al., 2018) because of lack of choice due to economic constraints (Flanquart et al., 2013), thus, further exacerbating the inequality. It is noteworthy that the environmental crisis can aggravate social inequality by placing environmental inequality over economic inequality and may induce an inequality Matthew effect (Yang and Yang, 2020). Conversely, reduction in inequality may also improve environmental performance (Rao and Min, 2018).
The inequality in China has been a hot issue of international concerns and disputes as it is one of the fastest-growing economies (Xie and Zhou, 2014; Wu et al., 2017). As China is stepping toward a new era, the Chinese government clarifies that Chinese society’s principal contradiction lies in the unbalanced and inadequate development and people’s calling for a better life (Xi, 2018). Unlike the racial or ethnic factors that are mainly responsible for western developed countries’ environmental inequality (Tessum et al., 2019; Nijman and Wei, 2020), previous studies found that the economic factors and industrial development factors are more accountable for environmental inequalities in China. Inequality in the industry sector is significantly higher than in the service sector (Xiao et al., 2019). Rapid industrialization is the engine for China’s economic growth and the source of environmental burdens and conflicts. However, these benefits and burdens are allocated disproportionately among regions. The periphery may faces more negative impacts than the center (Althouse et al., 2020), in China, less-developed inland regions gain less economic benefits and emit more industrial pollutants than more-developed coastal regions (Ma, 2010; Mi et al., 2020; Yang et al., 2020). The coastal regions emits considerably lower air emissions pollutants than the average level of the country (Gu et al., 2013; Liang et al., 2016; Zhao et al., 2019). The annual population-weighted-average values of SO2, PM10, PM2.5, CO, NO, and O3 in northern China are about 96.7%, 58.9%. 40.4%. 38.1, 24.6, and 5.9% higher than in southern China during the period 2014–2016, respectively (Song et al., 2017). Furthermore, less-developed regions in the middle-western area of China have lower reduction potential and deal with higher unit abatement costs with their limited budgets. Even though many excellent case studies have been done, many of them have focused on the inequality of CO2 (Chen et al., 2016; Chen et al., 2017; Fang et al., 2018; Cheng et al., 2021). On the one hand, most of the limited discussions of industrial pollutant inequality have been conducted separately for the single categories of industrial waste gas (Dong et al., 2015; Zhang et al., 2018c; Azimi et al., 2019; Cao et al., 2019; Guan et al., 2019; Zhao et al., 2019), industrial wastewater or water resources (Zhang and Anadon, 2014; Yao et al., 2018), and industrial solid waste (Ma et al., 2016). The only two comprehensive discussions of IPI have conducted the analysis over a very short period of time. One study was conducted for 2012 (Zhang et al., 2018b), while the other study was conducted for 2005 and 2006 (Ma et al., 2016). Thus, it is difficult to compare the differences and commonalities in the changes of inequalities in different categories of IPI on temporal and spatial scales. On the other hand, there has been little discussion of the relationship between structural forces (e.g., national strategies) and environmental inequality in China. Former spatial variations analyses have generally depended on the geographic orientation of China, which conventionally divides the study area into three parts: northern region, central region, and southern region (Gu et al., 2013; Liang et al., 2016). Some studies divided it more specifically into seven regions: northeast, north, northwest, east, central, southwest, and south regions (Song et al., 2017; Guan et al., 2019; Zhao et al., 2019). However, over the past 40-odd years, China’s development strategy has been continually adjusted and optimized, especially the Yangtze River economic belt’s rapid development. Previous ways of spatial division fall short of considering the substantial influence of the national strategy force in China and may no longer be suitable to cope with current problems. The traditional way of dividing regions may mask the structural features of the spatial distribution of China’s IPI.
In light of the remarkable economic inequality, Xie (2010) and Feng (2008) have proposed a hypothesis that structural forces attributable to the Chinese political system rather than individual forces originating from family structure and race/ethnicity play a dominant role in China’s income inequality. We assume that there exists a similar “structural forces-driven” hypothesis for environmental inequality in China, thus resulting in a special spatial-temporal distribution features of IPI. Our study attempts to test the “structural spatial-temporal distribution features” of IPI associates with the national territorial space planning strategy in China. As an important theoretical reference for the national territorial space planning strategy in China, the “T-shaped” spatial strategy (Lu, 2001) considers the Yangtze River corridor and coastal region as the axes of national economic development, which developed upon the point-axis system theory first proposed by Lu Dadao in the year of 1984. Actually, the coastal region has benefited from the strategy and led China’s development since the reform and opening up of the economy in the past 4 decades. The Chinese government made it a national strategy to further develop the Yangtze River economic belt and took the concept of eco-priority as a guiding principle for development in 2014 (The State Council of the People’s Republic of China, 2014). By 2015, the GDP and population in these two regions accounted for 81.6% and 76.3% of the whole country, respectively (National Bureau of Statistics of China, 2000–2015a). Thus, examining whether the spatial-temporal distribution of China’s IPI is highly correlated to the “T-shaped” spatial development strategy give a clue to understand the correlations between “structural force” and IPI. In line with this, all provinces in our study are divided into three parts: the Coastal Region (CR), Inland Corridor along Yangtze River (ICYR), and Other Regions (OR), the first two of which correspond to the two axes of the “T-shaped” spatial development strategy. From the spatial perspective, we test the heterogeneity in IPI among regions under districts with different policies. From the temporal perspective, we check the coherence between IPI and the application of corresponding policies in different regions over different periods. The incorporation of the “T-shaped” spatial development strategy permits us to investigate the new incarnation of Chinese environmental inequality and test the correlation between environmental inequality and the “structural force” of these new changes and strategies.
The analysis of inequality has been developed for a long time, and there are several commonly used analytic approaches to measure it, such as the Gini coefficient (Gini, 1912), the Theil index (Theil, 1967), the Atkinson index (Atkinson, 1970), and the Variation coefficient. All these indices are closely related to the Lorenz curve; however, they present different properties of particular sensitivity and show different results regarding inequality changes according to how these differences are aggregated (Duro, 2012). Among them, the Gini index is more sensitive to the mean, while Atkinson or Theil index has more sensitivity to the changes in the lower ranks of the distribution. Thus, in the case of environmental inequality, Atkinson or Theil family of indexes would more attractive than the Gini index because of their ability to bring out differences in regions with lower levels of pollution (Heil and Wodon, 1997; Duro, 2012). Furthermore, with the capability to analyze the allocation of within-regional and between-regional environmental burden (Duro and Padilla, 2008), the Theil index is an appropriate inequality measurement that meets our research needs. Adopting the most recent provincial panel data from 2000 to 2015, we attempt to quantify the regional spatial features of China’s industrial emissions (wastewater, waste gas, and solid waste) using the Theil index approach.
To further investigate what forces have driven the “structural features” of IPI in China and to what extent, there is a need to analyze the contributions of these multiple factors. IPAT (environmental impact, population, affluence, and technology) identity is a traditionally analysis framework to study factors impact on the environment (Ehrlich and Holdren, 1971). However, the IPAT identity has a drawback that it considers only size effect and it is short of analyzing structural effect. This problem is solved by the Kaya identity (Kaya, 1990), for it is a ratio multiplication equation that could consider the structural effect as a ratio of two factors. In view of the fact that firms and individuals have different production and consumption behavior patterns, scholars have paid attention to the relationship between environmental inequality and population structure, such as age structure (Zagheni, 2011); and/or economic structure, such as industrial structure (Remuzgo and Sarabia, 2015). To analyze the contributions of factors causing environmental inequality, a number of decomposition methodology have been proposed and developed. Heil and Wodon (1997) applied the decomposition of the Gini index, which is proposed by Yitzhaki and Lerman (1991), to analyze the inequality in CO2 emissions, and then, they further investigated the impact of the Kyoto Protocol on the future CO2 emissions inequality in 2010 by the same approach (Heil and Wodon, 2000). After that, Mussini and Grossi (2015) and Chen et al. (2016) further developed the decomposition methodology of the Gini index. Alcántara and Duro (2004) used the Theil index to indicate energy inequality in OECD countries. Then, Duro and Padilla (2006) extended the Theil index with Kaya factors to decompose inequality in per-capita CO2 emissions across countries. In light of the former case studies, Remuzgo and Sarabia (2015) developed a factorial decomposition of the Theil index based on Kaya factors to study international inequality in CO2 emissions. By integrating Theil index with Kaya factors, it opens a path toward analyzing structural inequality effect on environmental inequality. However, this approach can not compare the contributions of size effect, structural effect, and inequality effect on environmental inequality simultaneously, which to some extent covers up important information. This paper attempts to fill the gap by devising a developed-Kaya identity, which based on the pollution economy inequality index (PE index), to decompose environmental inequality changes into economic size effect, economic inequality effect, economic structure inequality effect, technology inequality effect, and population size effect. After that, we integrate the Kaya identity with the Logarithmic Mean Divisia Index method (LMDI) to analyze contributions of each driving factor on the increment of IPI. To the best of our knowledge, this is the first time a study has aimed to associate China’s environmental inequality issue with the T-shaped spatial development strategy and explain the impact of economic size, economic inequality, and economic structural inequality on environmental inequality simultaneously.
It should be noted that inequalities are natural results of progress (Deaton, 2013). For development-induced gaps, it is not about restricting the progress of those taking the lead but about accelerating the progress of those catching up. We argue that inequality does not always have to be addressed. It depends on the phases of development and the speed of catching up. Slowly catching up or even no catching up may cause unfairness. It is the unfairness that should be addressed. The crucial part is to investigate the degree of IPI in China and trace whether it is narrowing or widening during the “new normal” phase. Regarding the aforementioned perspectives, we aim to discuss the following three questions in our present study. Is there a unique characteristic of inequality distribution of China’s industrial pollution, which is highly correlated to “T-shaped” spatial development strategy in China? How does economic growth impact the speed of the “catching up” in environmental inequality? What are the driving factors and the extent of their contributions? Our findings could give a new perspective on environmental inequality research in China, and also help policymakers identify the inequality of industrial pollution and its potential determinants. It would be a vital step to foster justice and maintain sustainable and inclusive growth in the future in China.
The rest of the paper is organized as follows. The methodology and data applied in this study are presented in Data and Methodology. Results and Discussion displays the results associated with the spatiotemporal variation patterns of China’s IPI and their determinants. Finally, Conclusion and Policy Implication presents the conclusions and recommendations for future research.
Data and Methodology
Data
The panel data for a set of 31 provinces and municipalities (the megacities and province have the identical administrative power in China) covering the period from 2000 to 2015 were gathered (National Bureau of Statistics of China, 2000–2015a; National Bureau of Statistics of China, 2000–2015b). We excluded Taiwan, Hong Kong, and Macau, owing to the unavailability of data. The whole country was divided into three areas according to the “T-shaped” spatial development strategy: CR, ICYR, and OR, as shown in Figure 1. The CR covers 12 provinces and municipalities: Beijing, Tianjin, Hebei, Liaoning, Shanghai, Jiangsu, Zhejiang, Fujian, Shandong, Guangdong, Guangxi, and Hainan; the ICYR covers 8 provinces and municipalities: Anhui, Jiangxi, Hubei, Hunan, Chongqing, Sichuan, Guizhou, and Yunnan; and the OR covers 11 provinces: Shanxi, Inner Mongolia, Jilin, Heilongjiang, Henan, Tibet, Shaanxi, Gansu, Qinghai, Ningxia, and Xinjiang.
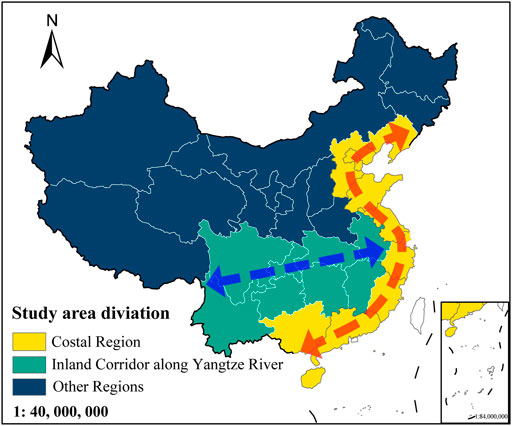
FIGURE 1. Schematic diagram of research areas.
Data on discharges of industrial wastewater (IWW), sulfur dioxide (IWGSO2), and solid waste (ISW) were derived from China Statistical Yearbook and China Statistical Yearbook on Environment (National Bureau of Statistics of China, 2000–2015a; National Bureau of Statistics of China, 2000–2015b). Population, GDP, Gross Industrial Production, and other socioeconomic factors are collected from the China Statistical Yearbook (National Bureau of Statistics of China, 2000-2015a). All economic data in this study were converted using constant prices of the year 2000 to eliminate the impact of inflation.
Methods for Measuring Inequality—Theil Index
Proposed by Theil (1967) to study the income gap between countries, the Theil index is a log-likelihood ratio statistic that is based on the concept of entropy (Kullback, 1959). Its general expression is:
where
In our study, TICYR, TCR, and TOR represent the Theil index of environmental inequality in the CR, ICYR, and OR, respectively, based on Eqs. 2–4:
The Theil index between regions is:
And the Theil index within regions is:
Thus, the total Theil index can be expressed as:
Among them, T is the total Theil index. A larger Theil index indicates a greater departure from equality.
Methods for Analysis of the Driving Factors of Environmental Inequity—Kaya-LMDI
Inherited from the IPAT model, the Index Decomposition Analysis (IDA) is based on the index number theory for decomposition analysis. It is a simple and flexible method that needs less data and can be used to interpret spatial and temporal data. As one of the IDA approaches, the LMDI was created by Ang (2005) and is widely used to calculate contributions of relative factors to the changes in emissions because of its advantage of perfect decomposition without an unexplained residual term. In our study, we develop a simple and systematic analytical framework, within which the developed-Kaya-LMDI is combined with the environmental inequality index to investigate the factors impacting the changes of environmental inequality. Considering that the disparity of the Theil index of the regions is too little to be decomposed, the PE index is selected as a proxy variable of environmental inequality, which has a strong correlation with the Theil index (shown in Driving Forces of Pollution Economy Inequality).
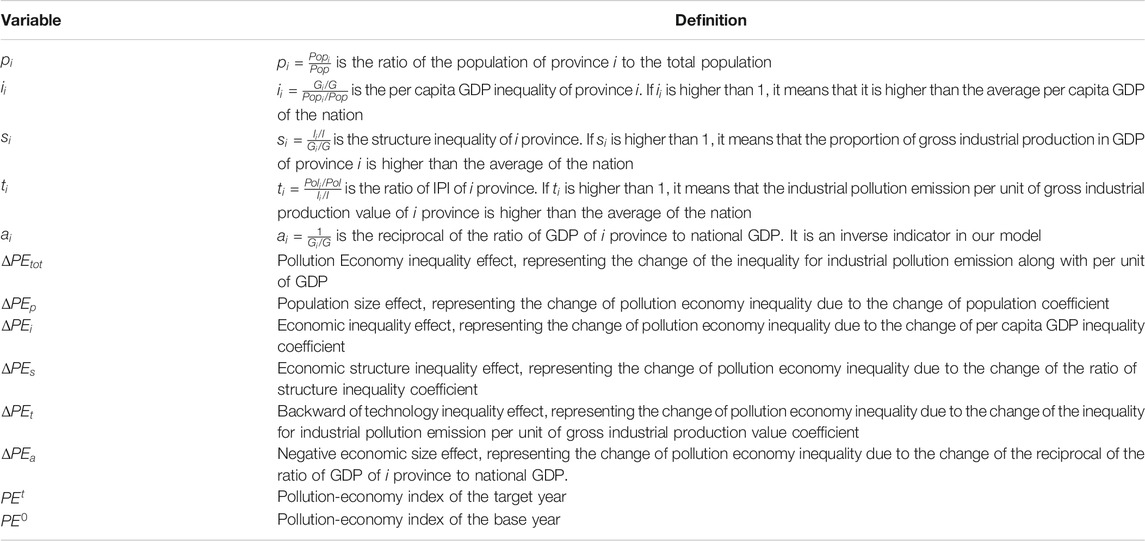
This study decomposed IPI into five factors: population size effect, economic inequality effect, economic structure inequality effect, backward of technology inequality effect, and negative economic size effect, the identity of which is given as in Eq. 14.
In the scheme of additive decomposition, the difference of the PE index could be decomposed into the above-mentioned five effects. The calculation of each effect is represented by the following equations:
where
Results and Discussion
Trends in Industrial Pollution Emissions
To understand the trends observed in industrial pollution emissions, Figure 2 shows the development trends of total emissions of IWW, IWGSO2, and ISW from 2000 to 2015. The results demonstrate that China’s IWW and IWGSO2 have both experienced a significant initial increase and a later decrease. The two lines on the graph also manifest the turning points in 2006 and 2007, respectively. However, ISW had a consistent increase from 2000 to 2011 and stabilized after that.
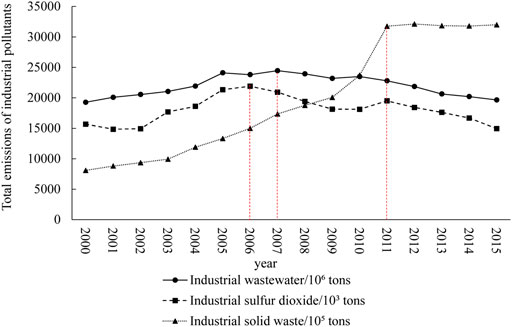
FIGURE 2. Total emissions of three types of pollutants in China [data from the China Statistical Yearbook and China Statistical Yearbook on Environment (National Bureau of Statistics of China, 2000–2015a; National Bureau of Statistics of China, 2000–2015b)].
To identify how these pollution burdens have been allocated in regions, industrial pollution emissions based on the population and gross industrial production value are divided into CR, ICYR, and OR, as shown in Figure 3. We find slight differences in the ranks of regions regarding economy and population. For IWW, CR had the highest per capita IWW (see Figure 3 (a1)), while ICYR had the highest IWW emission intensity (the ratio of IWW and gross industrial production). It was also found that there was a downturn trend between 2000 and 2015, for 0.97*104/person reduction (5.10%) in CR and 66.32*104/yuan reduction (87.93%) in ICYR. Emissions of IWGSO2 and ISW in OR are the highest among the three regions, regardless of emissions per capita or per unit industrial output. It is notable that the gap between CR and ICYR is shrinking, while it is widening between OR and the former two regions.
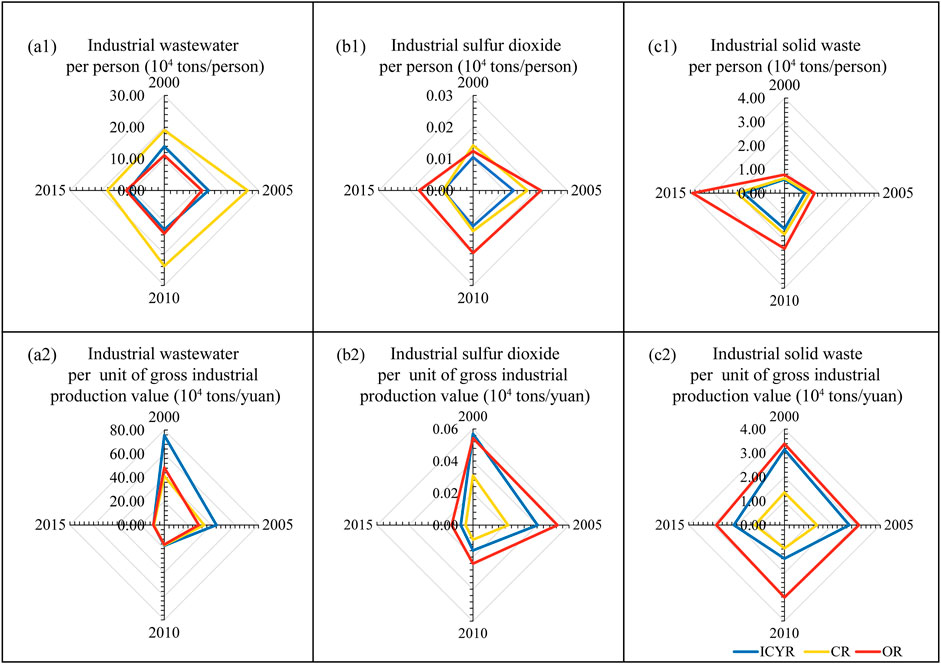
FIGURE 3. Ratio of industrial pollution emissions to population/gross industrial production value in the Coastal Region (CR), Inland Corridor along Yangtze River (ICYR), and Other Regions (OR). (a1) Industial wastewater per person (104tons/person), (a2) Industial wastewater per unit of gross industrial production value (104tons/yuan), (b1) Industial sulfur dioxide per person (104tons/person), (b2) Industial sulfur dioxide per unit of gross industrial production value (104tons/yuan), (c1) Industial solid waste per person (104tons/person), and (c2) Industial solid waste per unit of gross industrial production value (104tons/yuan).
Consequently, the questions are whether these gaps arise from inequality within or between the regions, and whether the results vary in terms of different types of industrial pollutants.
Theil Index of Industrial Pollution Emissions
As mentioned previously, there are many indicators to measure IPI. In this study, we select the Theil index to conduct the analysis because of its decomposability regarding the between and within components. As can be observed in Figure 4A, the inequality of ISW stands out as the pollutant with the highest Theil index, implying that it is still a challenging task for China to reduce solid waste pollution during the industrialization process. In contrast, the lowest Theil index over the period can be found for IWW. This could be partially explained by the fact that the water pollution-intensive industry is more sensitive to legal policy instruments than the rest of the industries (Zheng and Shi, 2017).
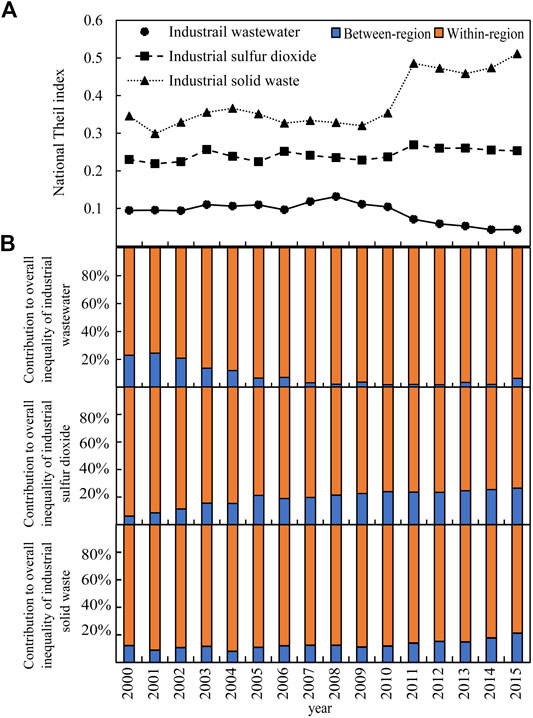
FIGURE 4. Overall inequality of industrial pollution emissions in China and contributions of the between and within components. (A) the Theil index of the whole nation. (B) inequalities within the regions and inequalities between regions as a percentage of the overall Theil index for industrial wastewater, sulfur dioxide and solid waste respectively.
Further decomposition of the Theil index of China’s industrial pollution suggests that the overall inequalities of IWW, IWGSO2, and ISW are predominantly contributed by inequalities within the regions (Figure 4B). Inequalities within the regions contribute an average of 91.33% to IWW, 78.51% to IWGSO2, and 70.20% to ISW from 2000 to 2015. This indicate that inequality of industrial wastewater has relatively small differences between regions, while the differences between regions contribute more to industrial sulfur dioxide inequality and industrial solid waste inequality. The difference is due to the production characteristics of different types of industrial pollutants. Although inequalities between regions have accounted to a lower extent for the overall inequalities, this does not lessen the significance of discussing them because inequalities between regions tend to reflect the changes and levels of the overall inequality (Galbraith and Choi, 2020). Thus, we further analyze the between and within components of Theil indexes in CR, ICYR, and OR to obtain a precise understanding of regional inequality performance.
In Figure 5, the Theil index between regions (TB) illustrates the advantaged or disadvantaged situation of a region as compared to the national average level (that approaches 0). The Theil index within regions (TW) indicates the inequality degree among provinces within the region itself. As we can see, the yellow symbols (representing the CR) show lower TB, with an average of −0.026 for IWW (Figure 5 (a1)), −0.152 for IWGSO2 (Figure 5 (b1)), and −0.155 for ISW (Figure 5 (c1)), whereas higher TW, with an average of 0.058 for IWW (Figure 5 (a2)), 0.046 for IWGSO2 (Figure 5 (b2)), and 0.143 for ISW (Figure 5 (c2)). Inequality is indeed a natural result of economic and social progress. However, it will not reduce or disappear by itself due to development. In the case of CR, even if the region’s inequality is diminishing as a whole, sub-level inequalities are quite severe within the region. It is crucial for the government to address inequalities both between and within regions if necessary. As expected, this contradiction is solvable. In the present study, we find that the inequality within CR has generally decreased in the later period (from 0.104 in 2008 to 0.019 in 2015 for IWW, 0.048 in 2007 to 0.036 in 2015 for IWGSO2, and 0.186 in 2011 to 0.165 in 2015 for ISW).
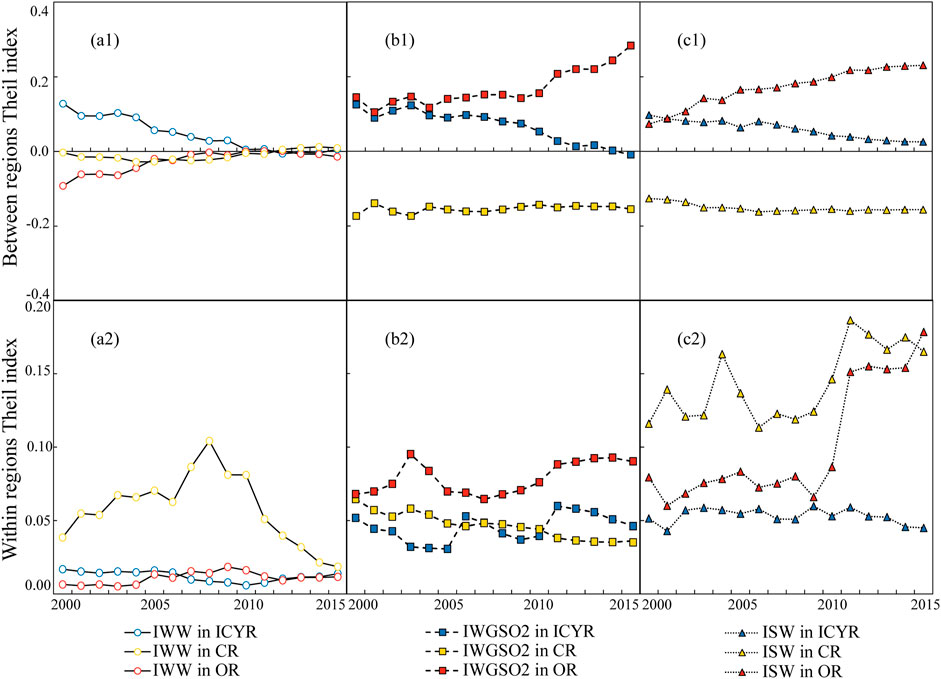
FIGURE 5. The between and within components of the Theil index for three types of industrial pollution in the Coastal Region (CR), Inland Corridor along Yangtze River (ICYR), and Other Regions (OR). [The (a1) and (b1) represent Theil index of industrial wastewater (IWW) between regions and within regions, respectively; the (a2) and (b2) represent Theil index of industrial sulfur dioxide (IWGSO2) between regions and within regions, respectively; and the (a3) and (b3) represent Theil index of industrial solid waste (ISW) between regions and within regions, respectively].
The phase characterized by low inequality between regions and high inequality within the region is not a necessary developing phase. In the case of ICYR, we see a downward trend in inequality between regions and equality on average within regions, for all types of industrial pollution. Even though, as a representative of the drainage economy, the ICYR showed a disadvantage regarding IWW emissions compared to the rest of the regions (Figure 5 (a1)) in the early stage (0.128 of TB in 2000), the trend converged to the national average level afterward (0.006 of TB in 2015). ICYR’s performance displays the potential to balance environmental outcomes with economic outcomes and achieve better equality due to the advantage of late-development.
This disadvantaged situation is especially detrimental for regions that lack both development opportunities (or capacity) and government assistance. As shown in Figure 5, inequalities are increasing in the OR, both between and within regions. Furthermore, the two-fold disadvantages are exacerbating the situation. By 2015, the TB increased to 0.012, 0.157, and 0.138 for IWW, IWGSO2, and ISW, respectively. Simultaneously, the TW increased to 0.005, 0.022, and 0.099 for IWW, IWGSO2, and ISW, respectively.
The findings in Figure 5 show that there is significant heterogeneity in the regional differences and development trends of different types of industrial pollutants. Due to the significant differences in the production processes and end-of-pipe treatment methods of IWW, IWGSO2, and ISW, there will be time sequential differences in the time required for the promotion of different categories of pollutant treatment technologies and the emergence of related environmental treatment effectiveness. It is important to note that in the process of rapid development, if pollution control technologies are not effectively upgraded in a timely manner, it will lead to the accumulation of industrial pollutants in the natural environment, which may exceed environmental capacity and then lead to serious environmental pollution incidents. China needs to pay particular attention to the potential environmental risks associated with ISW generation and disposal in OR.
The results above tell us that IPI plays out differently among different regions. We assume that “structural force,” which is one of the efficient means of the visible hand of government, is a predominant driver that impacts the geographic allocation of economic benefit and environmental burden. Accordingly, we verify it from the spatial and temporal perspectives.
Spatiotemporal Distribution of IPI
To test our assumption, we depict the spatiotemporal distributions of IPI based on the magnitude of the Theil index (see Figures 6–8). The darker gray zone represents the provinces with relatively worse environmental-economic performance. The darker blue, red, and brown colors represent the provinces that are relatively better off and the white color signifies that the performance converges to the national average.
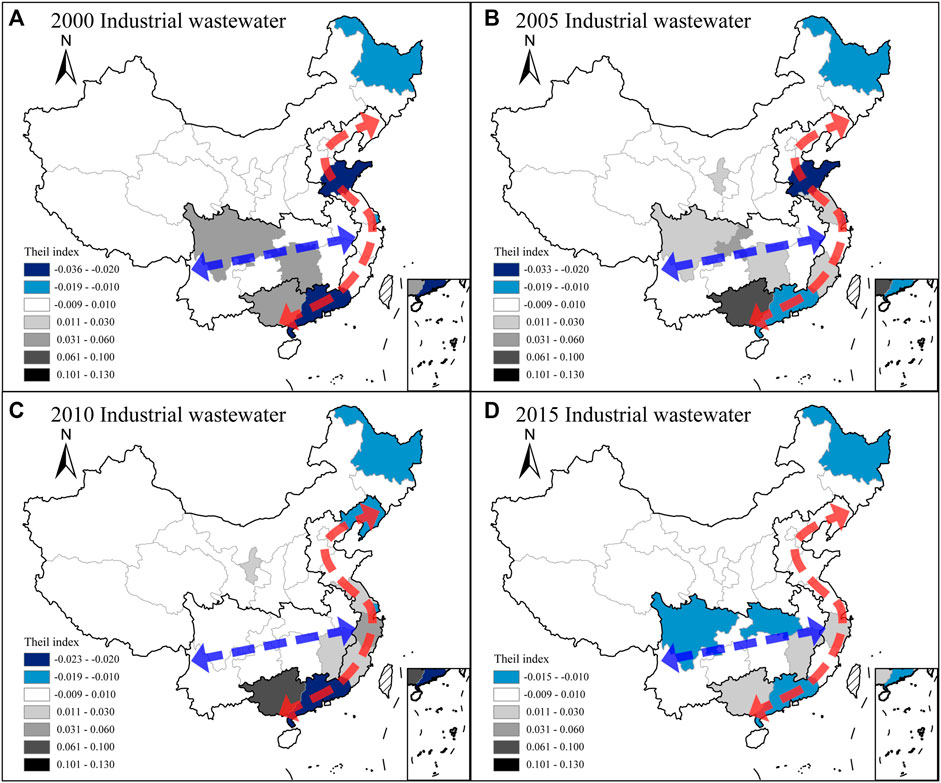
FIGURE 6. Spatiotemporal distribution of Theil index of industrial wastewater in 31 Chinese provinces [the red dotted line depicts the Coastal Region (CR) and the blue dotted line indicate the Inland Corridor along Yangtze River (ICYR)]. (A) 2000 industrial wastewater, (B) 2005 industrial wastewater, (C) 2010 industrial wastewater, and (D) 2015 industrial wastewater.
The spatial and temporal distribution of environmental equality varies across industrial pollutant emissions. The Theil index measured for IWW in most provinces converges to −0.009–0.010 (white patch area in Figure 6) in 2015, which indicates that the influence of advantages and weaknesses between provinces is fading gradually and the equality has begun to exhibit an upward trend. In contrast, provincial gaps are widening in terms of IWGSO2 (Figure 7) and ISW (Figure 8). Water pollution-intensive industry is probably more sensitive to legal policy instruments than the rest of the industries (Zheng and Shi, 2017); meanwhile, Chinese government has made a great effort to promote the nationwide battle to prevent and control pollution (The CPC Central Committee and the State Council, 2021). In particular, these gaps are generated by the slow pace of those catching up rather than those taking the lead at a fast pace. Specifically, the lowest Theil index of IWGSO2 and ISW have been steady from 2000 to 2015. The Theil index of IWGSO2 of Guangdong province is constantly the lowest in the whole of China and was −0.037 in 2000 and −0.035 in 2015. The lowest value of the Theil index of ISW appears in Jiangsu province, whose value was −0.036 in 2000 and −0.035 in 2015, whereas, Shanxi province showed the highest Theil index of IWGSO2, which was 0.066 in 2000 and which rose to 0.081 in 2015, with a growth rate of 23%. Simultaneously, Shanxi province also has the highest Theil index of ISW that rose from 0.157 in 2000 to 0.187 in 2015.
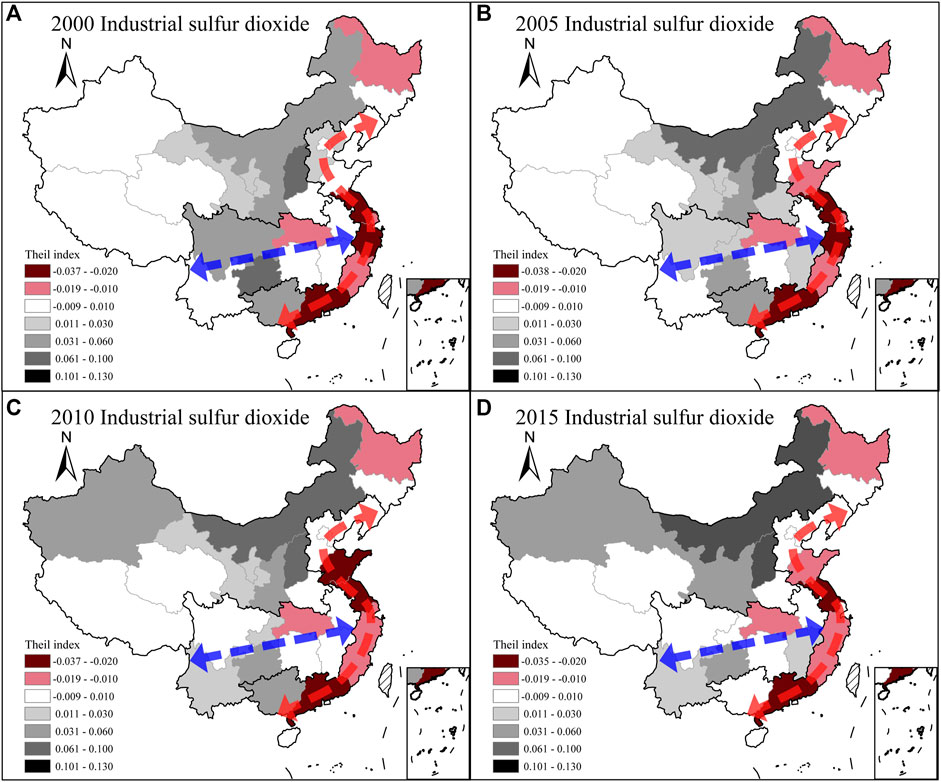
FIGURE 7. Spatiotemporal distribution of Theil index of industrial sulfur dioxide in 31 Chinese provinces [the red dotted line depicts the Coastal Region (CR) and the blue dotted line indicate the Inland Corridor along Yangtze River (ICYR)]. (A) 2000 industrial sulfur dioxide, (B) 2005 industrial sulfur dioxide, (C) 2010 industrial sulfur dioxide, and (D) 2015 industrial sulfur dioxide.
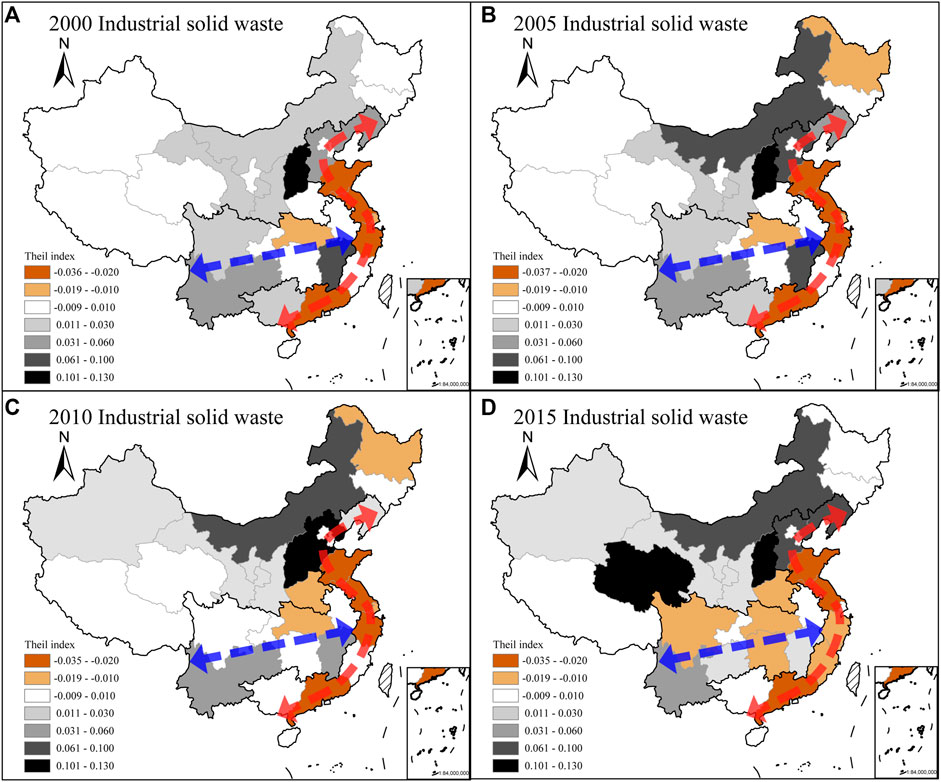
FIGURE 8. Spatiotemporal distribution of Theil index of industrial solid waste in 31 Chinese provinces [the red dotted line depicts the Coastal Region (CR) and the blue dotted line indicate the Inland Corridor along Yangtze River (ICYR)]. (A) 2000 industrial solid waste, (B) 2005 industrial solid waste, (C) 2010 industrial solid waste, and (D) 2015 industrial solid waste.
The “structural features” hypothesis for China is verified in our study. The “T-shaped” spatial development strategy strongly affected the performance of IPI. Indeed, a similar “T-shaped” geographic distribution of CO2 emissions and industrial pollution emissions can be found in previous studies (Wang and Liu, 2017; Zhang et al., 2018b; Guan et al., 2019; Liu et al., 2020). Our study highlights the inequality degree of industrial pollution and the “T-shaped” geographic distribution characteristic becomes more evident. As can be seen, from the spatial perspective, the CR axis of the “T-shaped” strategy, which is the first developed region in China after the reform and opening up of the economy, accounts for the majority of colored patches in Figures 6–8. The provinces situated in this region have had a significant advantage of industrial pollutant reduction and economic development over the rest of China. From the temporal perspective, the ICYR axis of the “T-shaped” strategy is the only region that has shown a consistent growth of equality for all industrial pollution types from 2000 to 2015 (fewer black patches over time). Moreover, a notable upward trend (more colored patches) is observed during the 12th Five-Year Plan Period (2011–2015). It is exactly in this period that China enforced a national strategy to develop the Yangtze River economic belt, which was followed by a remarkable outburst of economic development and sterner pollution restrictions.
However, in the provinces located in regions that are not supported by the national territorial space planning strategy (OR), industrial pollution inequalities are deteriorating, especially regarding the IWGSO2 and ISW. Thus, in Figures 6–8, more provinces in the OR have been observed to be gray and dark gray over time.
We argue that the development-induced gaps between provinces are inevitable. Nevertheless, more provinces are catching up with regards to progress, especially those provinces located in the ICYR. However, it should be noted that less-developed provinces in the OR have been struggling in a disadvantageous position and the gap is still widening. Consequently, these provinces will be incapable of catching up with their counterparts without the counter-measures that arise from “structural forces.”
Earlier studies have shown similar results. Berthe and Elie (2015) argued that government interventions are a prerequisite for addressing inequality issues in environmental problems. Wang et al. (2018) suggested that the improvement of industrial structure to reduce pollution emissions could only be achieved by a unified and strict legal market environment in China. Zhang et al. (2018a) proposed that stricter environmental regulations should be implemented to induce a structural break in the industry and curb the associated emissions. We have confirmed these arguments through our study of China’s IPI. Attention should be paid to remedying the weakness of less-developed regions and empowering them to achieve green development by taking advantage of the latecomers, as in the case of ICYR.
Driving Forces of Pollution Economy Inequality
To go deeper into the impact on “structural spatial-temporal distribution features” of China’s IPI, we decomposed the inequality into five effects: population size (
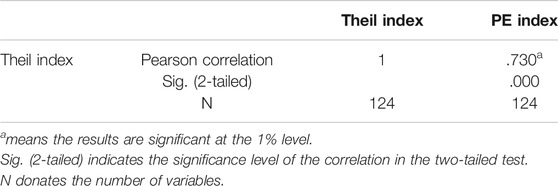
TABLE 2. Results of Pearson correlations test.
The weights of each factors’ effect are shown in Figure 9. The pollution economy efficiency in CR is generally higher than the national average (with PE index lower than 1), implying that CR has a great edge in environmental equality.
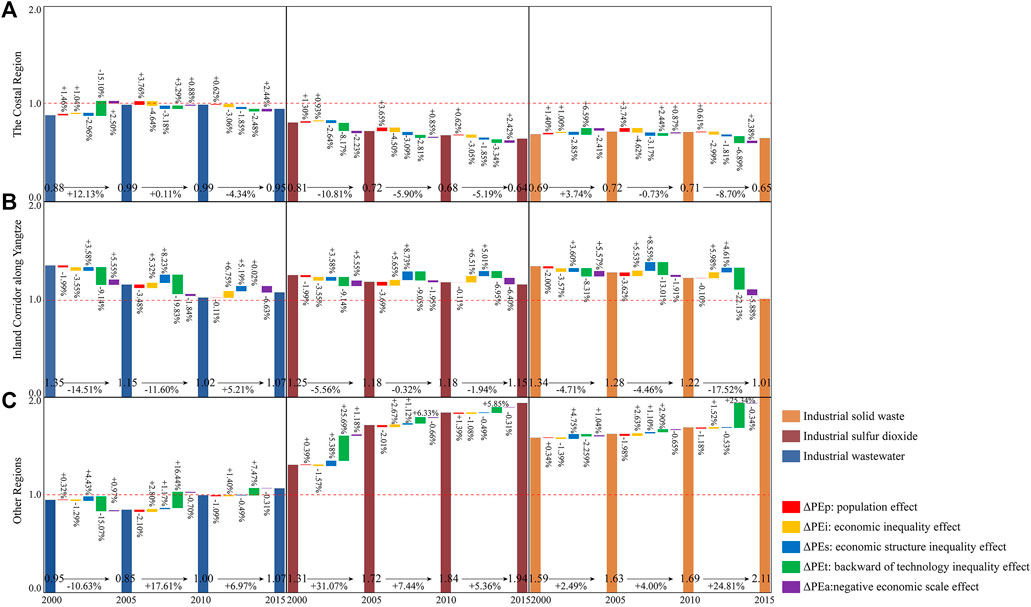
FIGURE 9. Weights of driving factors’ effect of industrial pollution inequality in China. (A) The costal region, (B) Inland corridor along Yangtze, and (C) Other regions.
The technological inequality effect contributes most to the PE changes in 2000–2005 for all pollutants: 15.10% for IWW, 8.17% for IWGSO2, and 6.59% for ISW. However, the economic inequality effect plays a more critical role in the changes of inequality in CR in the later periods, except for ISW in the period 2005–2010.
From Figure 9, a clear downward trend in inequality in ICYR can be observed for industrial pollutants from 2000 to 2015, except for IWW in the period 2010–2015. The PE index for all types of industrial pollution is converging to 1. This implies that ICYR is catching up in the progress of economic-environmental balance and reaching the national average after years of effort. The predominant contributors vary in terms of different types of industrial pollutants and different periods. For IWW, the
In the case of the OR, remarkable disadvantages in environmental inequality are observed regarding IWGSO2 and ISW. Moreover, both show increasing divergences from the national average over time. Further, we can observe that the technological inequality effect has always been the main contributor to the increments of IWGSO2 and ISW over the study period.
The findings above show that the technological inequality effect is more likely to determine the performance of environmental inequality in pre-development phases or less-developed regions. Improvement of technology is the key strategy to reduce industrial pollution emissions, especially for the regions’ initial developing stages. Furthermore, it is interesting to find that when technologies are markedly promoted, the economic structure inequality factor, together with the economic inequality factor, rises and principally drives environmental inequality changes in the transition period. Following this, economic inequality effect will probably determine the performance of environmental inequality. For instance, in Figure 9, effects of
Finally, economic inequality appears to be a better indicator to interpret the changes in environmental inequality in relatively developed phases. The economic size is the better indicator to construe the evolution of environmental inequality in pre-development phases. Figure 9 proves this as the
Conclusion and Policy Implication
In this study, features of IPI in China were studied from several perspectives, such as, the degree of inequality, the spatial variation, and the determining drivers.
First, as indicated by the Theil index, the burden of IWW is the most equally shared, while ISW showed the highest inequality. We then found that the differences within the region itself have caused inequality in all three types of industrial pollutants. In addition, heterogeneity exists due to geographic development zoning. Specifically, the speedy development in CR is accompanied by low inequality between regions but high inequality within the region. ICYR manifests the advantage of late-development to balance environmental outcomes with economic outcomes. Conversely, OR could be “pollution havens” for resource-intensive and/or pollution-intensive industries, which further aggravates the disadvantage regarding catching up to the progress of its counterparts.
Second, our study has confirmed that a “structural features” hypothesis exists in environmental inequality in China. The national territorial space planning strategy plays a significant role in the allocation of economic benefit and industrial pollution burden in the Chinese context. Inequalities in the two axes of “T-shaped” spatial development strategy—CR and ICYR—have congruously performed well with the implementation of corresponding policies in different periods. The gap between the ICYR and CR is narrowing, whereas an even greater inequality in the OR is being observed.
Third, we go deeper into the impact of driving factors on the evolution of inequality by integrating the inequality index with the LMDI method. Through this novel technique, noteworthy findings were discovered in this study. The first is that the technological effect may determine the performance of environmental inequality decisively in a less-developed phase or a less-developed region, and the economic inequality effect together with the economic structural inequality effect would be the main determinant in the middle or transition period. Economic inequality effect would be the determinant afterward. The second is that economic inequality could be a better decomposing factor to environmental inequality in more developed districts or districts in higher developing phases, whereas the economic size is a better indicator to interpret the changes in environmental inequality in pre-development phases.
We should point out that for progress regarding environmental inequality, the suffering of provinces in OR is a necessary development stage. Still, we need to raise our guard, for the gap has widened in recent years. Based on our findings, we derived two main policy implications.
1) Leveraging the important role of national territorial space planning strategy in mitigating industrial pollution inequality
Based on the normative principle that everyone should share more fully and fairly the benefits of social development (The State Council Information Office of the PRC, 2019), China has implemented large-scale national programs to meet the inequality challenges, such as the Battle Against Poverty, Development of the West Regions Strategy, and so on. Among them, the launch of the national strategy “ecological conservation and high-quality development of the Yellow River Basin” in 2019, which covers 7 provinces of the OR in our study, would be a huge support in developing the OR provinces. The experiences of provinces in the OR and ICYR have verified the possibility of balancing economic development and environmental protection. Latecomers could learn from these experiences and make an effort to catch up. Our findings show that national territorial space planning strategy plays a crucial role in the allocation of economic benefits and environmental benefits. Thus, the government should take up the responsibility to help the OR catch up and reallocate environmental-economic wellbeing more fairly to promote the nation’s coordinated development. In the process of strategy implementation, stricter environmental regulation and green technologies are extremely pivotal to achieving win-win outcomes regarding environmental protection and economic growth.
2) Strengthen the communication, cooperation, and assistance in green technologies between developed and less developed regions
The key to reducing IPI between regions is to lower pollution emission intensity, and the root lies in the promotion of green technology. In China, with the advantage of coordinating all efforts to complete key national undertakings, green technology barriers should be broken through a comprehensive arrangement and mutual assistance. At the national level, incentives and subsidies can be used to give more financial support to OR to promote green technologies and develop green industries. At the regional level, the CR and the ICYR should take the initiative to share green technologies with OR. Together, they can help the less developed regions to give better play to their late-development advantages.
However, some scholars contend that inequalities are related to gaps in the relative size of the regions (Bruner, 2017). To prove this, further evidence is required for a more precise conclusion. A major limitation of this study is that we did not calculate hidden industrial pollution’s unequal exchange along with inter-provincial trade. Undeveloped areas may face worsening inequality of industrial pollutant emissions if the virtual emissions are accounted for. In the future, scholars could research IPI generated by trading and whether similar structural features exist within the transition of inequality in China. In addition, we have proposed a sample developed-Kaya-LMDI method, which allows us to compare the size effect, inequality effect, and structural inequality effect of economy on IPI. Along the same lines, the developed-Kaya-LMDI could be constructed to compare size effect, inequality effect, and structural inequality effect of population or other socioeconomic factors that meets other research needs.
Data Availability Statement
The raw data supporting the conclusion of this article will be made available by the authors, without undue reservation.
Author Contributions
JL: Conceptualization, Methodology, Writing-Original draft preparation, Data curation, Formal analysis, and Visualization. YW: Supervision, Conceptualization, and Writing-Review and Editing. LZ: Writing-Review and Editing. P-PJ: Writing-Review and Editing. Y-MH: Writing-Review and Editing. T-TH: Writing-Review and Editing.
Funding
This work was funded by the Key Research Funds for Fujian Province Public-interest Scientific Institution, Grant 2019R1002-7, Social Science Planning Funds of Fujian Province, China (FJ2021B042); Key Project of Natural Science Foundation of Fujian Province, China (2021J02030).
Conflict of Interest
The authors declare that the research was conducted in the absence of any commercial or financial relationships that could be construed as a potential conflict of interest.
Publisher’s Note
All claims expressed in this article are solely those of the authors and do not necessarily represent those of their affiliated organizations, or those of the publisher, the editors and the reviewers. Any product that may be evaluated in this article, or claim that may be made by its manufacturer, is not guaranteed or endorsed by the publisher.
Abbreviations
CO, carbon monoxide; CO2, carbon dioxide; CR, the coastal region; GDP, gross domestic product; ICYR, inland corridor along yangtze river; IDA, index decomposition analysis; IPAT, environmental impact, population, affluence, and technology; IPI, industrial pollution inequality; ISW, industrial solid waste; IWGSO2, industrial sulfur dioxide; IWW, industrial wastewater; LMDI, logarithmic mean divisia index; NO2, nitrogen dioxide; O3, ozone; OR, other regions; PM2.5, PM10, particulate matter smaller than 2.5 mm, 10 mm; SO2, sulfur dioxide.
References
Alcántara, V., and Duro, J. A. (2004). Inequality of Energy Intensities across OECD Countries: A Note. Energy Policy 32, 1257–1260. doi:10.1016/s0301-4215(03)00095-8
Althouse, J., Guarini, G., and Gabriel Porcile, J. (2020). Ecological Macroeconomics in the Open Economy: Sustainability, Unequal Exchange and Policy Coordination in a center-periphery Model. Ecol. Econ. 172, 106628. doi:10.1016/j.ecolecon.2020.106628
Ang, B. W. (2005). The LMDI Approach to Decomposition Analysis: a Practical Guide. Energy Policy 33, 867–871. doi:10.1016/j.enpol.2003.10.010
Atkinson, A. B. (1970). On the Measurement of Inequality. J. Econ. Theor. 2, 244–263. doi:10.1016/0022-0531(70)90039-6
Azimi, M., Feng, F., and Zhou, C. (2019). Air Pollution Inequality and Health Inequality in China: An Empirical Study. Environ. Sci. Pollut. Res. 26, 11962–11974. doi:10.1007/s11356-019-04599-z
Berthe, A., and Elie, L. (2015). Mechanisms Explaining the Impact of Economic Inequality on Environmental Deterioration. Ecol. Econ. 116, 191–200. doi:10.1016/j.ecolecon.2015.04.026
Bruner, J. P. (2017). Minority (Dis)advantage in Population Games. Synthese 196, 413–427. doi:10.1007/s11229-017-1487-8
Cao, K., Zhang, W., Liu, S., Huang, B., and Huang, W. (2019). Pareto Law-Based Regional Inequality Analysis of PM2.5 Air Pollution and Economic Development in China. J. Environ. Manage. 252, 109635. doi:10.1016/j.jenvman.2019.109635
Chen, J., Cheng, S., and Song, M. (2017). Decomposing Inequality in Energy-Related CO 2 Emissions by Source and Source Increment: The Roles of Production and Residential Consumption. Energy Policy 107, 698–710. doi:10.1016/j.enpol.2017.05.003
Chen, J., Cheng, S., Song, M., and Wang, J. (2016). Interregional Differences of Coal Carbon Dioxide Emissions in China. Energy Policy 96, 1–13. doi:10.1016/j.enpol.2016.05.015
Cheng, S., Fan, W., Zhang, J., Wang, N., Meng, F., and Liu, G. (2021). Multi-sectoral Determinants of Carbon Emission Inequality in Chinese Clustering Cities. Energy 214, 118944. doi:10.1016/j.energy.2020.118944
Clayton, S., 2000. New Ways of Thinking about Environmentalism: Models of Justice in the Environmental Debate. J. Soc. Issues 56:459. doi:10.1111/0022-4537.00178
Deaton, A. (2013). The Great Escape: Health, Wealth, and the Origins of Inequality. New Jersey: Princeton University Press.
Dong, L., Dong, H., Fujita, T., Geng, Y., and Fujii, M. (2015). Cost-effectiveness Analysis of China's Sulfur Dioxide Control Strategy at the Regional Level: Regional Disparity, Inequity and Future Challenges. J. Clean. Prod. 90, 345–359. doi:10.1016/j.jclepro.2014.10.101
Duro, J. A. (2012). On the Automatic Application of Inequality Indexes in the Analysis of the International Distribution of Environmental Indicators. Ecol. Econ. 76, 1–7. doi:10.1016/j.ecolecon.2011.12.019
Duro, J. A., and Padilla, E. (2008). Analysis of the International Distribution of Per Capita CO2 Emissions Using the Polarization Concept. Energy Policy 36, 456–466. doi:10.1016/j.enpol.2007.10.002
Duro, J. A., and Padilla, E. (2006). International Inequalities in Per Capita CO2 Emissions: A Decomposition Methodology by Kaya Factors. Energ. Econ. 28, 170–187. doi:10.1016/j.eneco.2005.12.004
Ehrlich, P. R., and Holdren, J. P. (1971). Impact of Population Growth. Science 171, 1212–1217. doi:10.1126/science.171.3977.1212
Fang, G., Liu, M., Tian, L., Fu, M., and Zhang, Y. (2018). Optimization Analysis of Carbon Emission Rights Allocation Based on Energy justice-The Case of China. J. Clean. Prod. 202, 748–758. doi:10.1016/j.jclepro.2018.08.187
Feng, W. (2008). Boundaries and Categories: Rising Inequality in Post-Socialist Urban China. Stanford: Stanford University Press.
Flanquart, H., Hellequin, A.-P., and Vallet, P. (2013). Living Alongside Hazardous Factories: Risk, Choice and Necessity. Health Risk Soc. 15, 663–680. doi:10.1080/13698575.2013.855714
Galbraith, J., and Choi, J. (2020). The Consequences of Economic Inequality for Presidential Elections in the United States. Struct. Change Econ. Dyn. 53, 86–98. doi:10.1016/j.strueco.2020.01.009
Gini, C. (1912). Variabilita e mutabilita contributo allo studio delle distribuzioni e delle relazioni statistiche. Bologna, Italy: Tipografia di Paolo Cuppini. (In Italian).
Gu, D., Wang, Y., Smeltzer, C., and Liu, Z. (2013). Reduction in NOx Emission Trends over China: Regional and Seasonal Variations. Environ. Sci. Technol. 47, 12912–12919. doi:10.1021/es401727e
Guan, Y., Huang, G., Liu, L., Zhai, M., and Xu, X. (2019). Measurement of Air-Pollution Inequality through a Three-Perspective Accounting Model. Sci. Total Environ. 696, 133937. doi:10.1016/j.scitotenv.2019.133937
Heil, M. T., and Wodon, Q. T. (2000). Future Inequality in CO2 Emissions and the Impact of Abatement Proposals Proposals 17, 163–181. doi:10.1023/a:1008326515058
Heil, M. T., and Wodon, Q. T. (1997). Inequality in CO2 Emissions between Poor and Rich Countries. J. Environ. Dev. 6, 426–452. doi:10.1177/107049659700600404
Jenkins, K., McCauley, D., and Forman, A. (2017). Energy justice: A Policy Approach. Energy Policy 105, 631–634. doi:10.1016/j.enpol.2017.01.052
Kaya, Y. (1990). Impact of Carbon Dioxide Emission Control on GNP Growth: Interpretation of Proposed Scenarios. Paris: IPCC Energy and Industry Subgroup, Response Strategies Working Group.
Liang, H., Dong, L., Luo, X., Ren, J., Zhang, N., Gao, Z., et al. (2016). Balancing Regional Industrial Development: Analysis on Regional Disparity of China's Industrial Emissions and Policy Implications. J. Clean. Prod. 126, 223–235. doi:10.1016/j.jclepro.2016.02.145
Liu, Y., Wang, M., and Feng, C. (2020). Inequalities of China's Regional Low-Carbon Development. J. Environ. Manage. 274, 111042. doi:10.1016/j.jenvman.2020.111042
Lu, D. (2001). An Analysis of Spatial Structure and Optimal Regional Development. Acta Geographica Sinica ( Chinese) 65, 127–135.
Ma, C. (2010). Who Bears the Environmental burden in China-An Analysis of the Distribution of Industrial Pollution Sources? Ecol. Econ. 69, 1869–1876. doi:10.1016/j.ecolecon.2010.05.005
Ma, J., Mitchell, G., Dong, G., and Zhang, W. (2016). Inequality in Beijing: A Spatial Multilevel Analysis of Perceived Environmental Hazard and Self-Rated Health. Ann. Am. Assoc. Geogr. 107, 109–129. doi:10.1080/24694452.2016.1224636
Mi, Z., Zheng, J., Meng, J., Ou, J., Hubacek, K., Liu, Z., et al. ., 2020. Economic Development and Converging Household Carbon Footprints in China. Nat. Sustainability.3:529. doi:10.1038/s41893-020-0504-y
Mussini, M., and Grossi, L. (2015). Decomposing Changes in CO 2 Emission Inequality over Time: The Roles of Re-ranking and Changes in Per Capita CO 2 Emission Disparities. Energ. Econ. 49, 274–281. doi:10.1016/j.eneco.2015.02.012
National Bureau of Statistics of China (2000-2015a). China Statistical Yearbook. Beijing: China Statistics Press.
National Bureau of Statistics of China (2000-2015b). China Statistical Yearbook on Environment. Beijing: China Statistics Press.
Nijman, J., and Wei, Y. D. (2020). Urban Inequalities in the 21st century Economy. Appl. Geogr. 117, 102188. doi:10.1016/j.apgeog.2020.102188
Nixon, R. (2011). Slow Violence and the Environmentalism of the Poor. Cambridge: Harvard University Press.
The State Council Information Office of the PRC (2019). Seeking Happiness for People: 70 Years of Progress on Human Rights in China. Beijing, China: People's Publishing House.
Rao, N. D., and Min, J. (2018). Less Global Inequality Can Improve Climate Outcomes. Wiley Interdiscip. Rev. Clim. Change 9, e513. doi:10.1002/wcc.513
Rashid, H., Cheng, H. W., Hunt, N., Islam, S. N., and Scelta, G. (2019). Sustainable Development Outlook 2019: Gathering Storms and Silver Linings, an Overview of SDG Challenges. New York, NY: Department of Economic and Social Affairs of United Nations.
Remuzgo, L., and Sarabia, J. M. (2015). International Inequality in CO2 Emissions: A New Factorial Decomposition Based on Kaya Factors. Environ. Sci. Pol. 54, 15–24. doi:10.1016/j.envsci.2015.05.020
Song, C., Wu, L., Xie, Y., He, J., Chen, X., Wang, T., et al. (2017). Air Pollution in China: Status and Spatiotemporal Variations. Environ. Pollut. 227, 334–347. doi:10.1016/j.envpol.2017.04.075
Sovacool, B. K., Heffron, R. J., McCauley, D., and Goldthau, A. (2016). Energy Decisions Reframed as justice and Ethical Concerns. Nat. Energ. 1, 24. doi:10.1038/nenergy.2016.24
The CPC Central Committee and the State Council (2021). in The CPC Central Committee and the State Council on the Deepening of the Battle of Pollution Prevention and Control. Beijing, China: The Communist Party of China (CPC) Central Committee and the State Council.
Temper, L., Demaria, F., Scheidel, A., Del Bene, D., and Martinez-Alier, J. (2018). The Global Environmental Justice Atlas (EJAtlas): Ecological Distribution Conflicts as Forces for Sustainability. Sustain. Sci. 13, 573–584. doi:10.1007/s11625-018-0563-4
Tessum, C. W., Apte, J. S., Goodkind, A. L., Muller, N. Z., Mullins, K. A., Paolella, D. A., et al. (2019). Inequity in Consumption of Goods and Services Adds to Racial-Ethnic Disparities in Air Pollution Exposure. Proc. Natl. Acad. Sci. USA 116, 6001–6006. doi:10.1073/pnas.1818859116
The State Council of the People’s Republic of China, 2014. The State Council’s Advisory Recommendations on Promoting the Yangtze River Economic Belt Development Based on the Golden Watercourse. Beijing, China: The State Council of the PRC.
Wang, S., and Liu, X. (2017). China's City-Level Energy-Related CO 2 Emissions: Spatiotemporal Patterns and Driving Forces. Appl. Energ. 200, 204–214. doi:10.1016/j.apenergy.2017.05.085
Wang, Z., Jia, H., Xu, T., and Xu, C. (2018). Manufacturing Industrial Structure and Pollutant Emission: An Empirical Study of China. J. Clean. Prod. 197, 462–471. doi:10.1016/j.jclepro.2018.06.092
Wu, S., Zheng, X., and Wei, C. (2017). Measurement of Inequality Using Household Energy Consumption Data in Rural China. Nat. Energ. 2, 795–803. doi:10.1038/s41560-017-0003-1
Xi, J. (2018). Secure a Decisive Victory in Building a Moderately Prosperous Society in All Respects and Strive for the Great Success of Socialism with Chinese Characteristics for a New Era Delivered at the 19th National Congress of the Communist Party of China. Editor. J. Qiushi. (English edition) 1 (1). Available at http://www.chinadaily.com.cn/pdf/2021/report20210202.pdf.
Xiao, H., Shan, Y., Zhang, N., Zhou, Y., Wang, D., and Duan, Z. (2019). Comparisons of CO2 Emission Performance between Secondary and Service Industries in Yangtze River Delta Cities. J. Environ. Manage. 252, 109667. doi:10.1016/j.jenvman.2019.109667
Xie, Y. (2010). Understanding Inequality in China. Society (in Chinese) 30, 1–20. doi:10.1177/2057150X16654059
Xie, Y., and Zhou, X. (2014). Income Inequality in Today's China. Proc. Natl. Acad. Sci. 111, 6928–6933. doi:10.1073/pnas.1403158111
Yang, F., Zhang, S., and Sun, C. (2020). Energy Infrastructure Investment and Regional Inequality: Evidence from China's Power Grid. Sci. Total Environ. 749, 142384. doi:10.1016/j.scitotenv.2020.142384
Yang, Y., and Yang, S. (2020). Are Industrial Carbon Emissions Allocations in Developing Regions Equitable? A Case Study of the Northwestern Provinces in China. J. Environ. Manage. 265, 110518. doi:10.1016/j.jenvman.2020.110518
Yao, X., Feng, W., Zhang, X., Wang, W., Zhang, C., and You, S. (2018). Measurement and Decomposition of Industrial green Total Factor Water Efficiency in China. J. Clean. Prod. 198, 1144–1156. doi:10.1016/j.jclepro.2018.07.138
Yitzhaki, S., and Lerman, R. I. (1991). INCOME STRATIFICATION AND INCOME INEQUALITY. Rev. Income Wealth 37, 313–329. doi:10.1111/j.1475-4991.1991.tb00374.x
Zagheni, E. (2011). The Leverage of Demographic Dynamics on Carbon Dioxide Emissions: Does Age Structure Matter? Demography 48, 371–399. doi:10.1007/s13524-010-0004-1
Zhang, C., and Anadon, L. D. (2014). A Multi-Regional Input-Output Analysis of Domestic Virtual Water Trade and Provincial Water Footprint in China. Ecol. Econ. 100, 159–172. doi:10.1016/j.ecolecon.2014.02.006
Zhang, L., Adom, P. K., and An, Y. (2018a). Regulation-induced Structural Break and the Long-Run Drivers of Industrial Pollution Intensity in China. J. Clean. Prod. 198, 121–132. doi:10.1016/j.jclepro.2018.07.008
Zhang, W., Liu, Y., Feng, K., Hubacek, K., Wang, J., Liu, M., et al. (2018b). Revealing Environmental Inequality Hidden in China's Inter-regional Trade. Environ. Sci. Technol. 52, 7171–7181. doi:10.1021/acs.est.8b00009
Zhang, W., Wang, F., Hubacek, K., Liu, Y., Wang, J., Feng, K., et al. (2018c). Unequal Exchange of Air Pollution and Economic Benefits Embodied in China's Exports. Environ. Sci. Technol. 52, 3888–3898. doi:10.1021/acs.est.7b05651
Zhao, H., Geng, G., Zhang, Q., Davis, S. J., Li, X., Liu, Y., et al. (2019). Inequality of Household Consumption and Air Pollution-Related Deaths in China. Nat. Commun. 10, 4337. doi:10.1038/s41467-019-12254-x
Keywords: industrial pollution, spatial-temporal distribution, environmental inequality, T- shaped spatial development strategy, China
Citation: Luo J, Wang Y, Zhu L, Jiang P-P, He Y-M and Hao T-T (2022) Structural Features of China's Industrial Pollution Inequality: A Spatial-Temporal Distribution Perspective. Front. Environ. Sci. 10:846787. doi: 10.3389/fenvs.2022.846787
Received: 31 December 2021; Accepted: 07 February 2022;
Published: 02 March 2022.
Edited by:
Guo Wei, University of North Carolina at Pembroke, United StatesReviewed by:
Rafael Alvarado, National University of Loja, EcuadorToyohisa Fujita, Guangxi University, China
Copyright © 2022 Luo, Wang, Zhu, Jiang, He and Hao. This is an open-access article distributed under the terms of the Creative Commons Attribution License (CC BY). The use, distribution or reproduction in other forums is permitted, provided the original author(s) and the copyright owner(s) are credited and that the original publication in this journal is cited, in accordance with accepted academic practice. No use, distribution or reproduction is permitted which does not comply with these terms.
*Correspondence: Yuan Wang, eS53YW5nQGZqbnUuZWR1LmNu, eXdhbmdAbmp1LmVkdS5jbg==
†These authors share first authorship