 Chang-Qing Guo
 Xin Wang
 Dan-Dan Cao
 Yong-Guang Hou
- School of Economics and Management, Lanzhou University of Technology, Lanzhou, China
Carbon emission reduction is critical to realizing China’s “Carbon Peak” and “Carbon Neutrality” goals. Green finance plays an essential role in accomplishing carbon emission reduction. Given the importance, this study builds and tests a causal model that specifies the direct and indirect interconnection of green finance and carbon emission reduction of the Yangtze River Economic Belt in China from 2006 to 2019. The received data reports are from national and local statistical offices. The unit root test and multicollinearity test proves the data are stationary and free from multicollinearity, which builds a foundation for constructing a regression model. The Hausman test provides the evidence for the selection of time and individuals double fixed effects. The stepwise regression model explains the mediation role of technological innovation in the green finance and carbon emission relationship which confirms the rationality of the theoretical assumptions. The spatial Durbin model (SDM) is applied using Stata version 16 for analysis purposes to measure the strength of the relationships which exist among the studied variables. Through the endogeneity test, the reliability of the model results has been demonstrated. The empirical outcomes indicate that it is the Yangtze River Economic Belt that has existed a significant spatial effect of reducing carbon emission, and the various provinces have shown mutual restraint effects of carbon emission. The findings show that green finance has a prominent adverse direct impact on carbon emission, but the spillover effect of green finance on neighboring provinces are seemingly insignificant. A green finance development alliance, green financial reform, and innovation pilot zone should be promoted. The generalizability of the study offers valuable insights for imminent researchers. The research findings could be beneficial for policymakers.
Introduction
With the rapid development of global industrialization, the environmental problems brought by fossil energy consumption have gradually threatened the sustainable development of human society. In the recent past, global carbon dioxide emissions have far exceeded the self-purification capacity of the earth. A series of abnormal climate change phenomenon caused by global warming has had a far-reaching impact on the steady progression of human society as the financial sector ignores the ecosystem (Saeed Meo and Karim, 2022). Whereas due to the importance of carbon dioxide emissions on sustainable development, it is imperative to create policies to reduce carbon emissions and discourage energy consumption from sources with high carbon emissions to ensure the carbon dioxide emission is reduced to the possible level (Abbasi et al., 2021a). UNEP has been working with countries, financial regulators, and the finance sector to align financial systems to the 2030 sustainable development agenda—to direct financial flows to support the delivery of the sustainable development goals (UNEP, 2015). Enabling bold action to reduce carbon emissions and build resilience against the impacts of climate change will require mobilizing and aligning finance at scale. The UK launched the green finance strategy on 2 July 2019 (HM Treasury and Department for Business and Energy and Industrial Strategy, 2019). The strategy supports the UK’s domestic and international commitments on climate change, the environment and sustainable development. President Biden’s executive order on tackling the climate crisis at home and abroad (E.O. 14008, signed 27 January 2021) called for the preparation of a Climate Finance Plan (herein “Plan”). This Plan—the first of its kind in the U.S. government—focuses specifically on international climate finance (THE WHITE HOUSE, 2021).
What is Green Finance? The American Heritage Dictionary (Houghton Mifflin Company, 2012) defines green finance as an activity that uses a variety of financial instruments for financing to protect the ecological environment and achieve sustainable development. An (An, 2008) has designated green finance as business operations in which the financial sector promotes environmental resource protection and coordinates economic growth. The “Guiding Opinions on Building a Green Financial System” (herein “Opinions”) (People’s Bank of China, 2016) issued by Chinese officials have emphasized that green finance is an economic activity that supports environmental improvement, and addresses climate change and resource conservation. It is an institutional arrangement to use financial derivatives such as green credit and green bonds to help transform the economy to green. The above three viewpoints illustrate the essence of green finance from different perspectives. Adapting the above report, this article describes the primary connotation of green finance is to take Xi Jinping’s ecological civilization thought and new development concept as a guide to realizing the “dual carbon” vision. It needs to follow the laws of the market economy and use green credit, green securities, and other financial derivatives to support economic activities for environmental improvement, climate change, and resource allocation.
Unlike traditional financial activities, green finance is the expansion and extension of energy conservation and emission reduction on the basis of traditional finance. It is the future development trend of the financial industry and an inevitable choice to realize China’s “dual carbon” vision. In essence, green finance is no different from traditional finance. Both are a form of financing which relies on market mechanisms to allocate funds reasonably to where they are needed. The most significant difference between them is that traditional finance is based on the assumption of rational economical people. It pursues the maximization of interests and puts benefits and risks first in the decision-making process. Resource and environmental issues are less considered. Green finance takes energy conservation and environmental protection as its basic requirements. Besides considering benefits and risk factors in the decision-making process, it also entirely feels environmental issues and seeks to balance the three. The aim is to achieve sustainable development between the financial industry and the social economy.
In China, the carbon dioxide emissions account for one-third of the world’s carbon dioxide emissions and have created a severe ecological crisis. Promoting the reduction of greenhouse gas emissions, mainly carbon dioxide, has gradually become the core point of China’s green development. In China’s “14th Five-Year Plan,” green and low-carbon growth has been listed as a long-term development goal. However, there is a mismatch between China’s existing financial system and low-carbon development. Since the financial crisis, the capital of the Chinese government’s 4 trillion investment flowed to housing and infrastructure construction has reached 3.25 trillion yuan, accounting for 81%, and 70% of the funds have come from bank loans (Development Research Center of the State Council and World Wide Fund for Nature or World Wildlife Fund, 2011). A lot of steel, cement, and coal need to be consumed. Based on the high income and low-risk, steel and other industries have become high-quality customers of financial institutions such as banks (Chen, 2020). Due to the profit-seeking nature of capital, the current financial system has severely squeezed the clean industry’s financing needs and industrial development. As a new development model that resolves the contradiction between economic growth and carbon emissions, green finance has gradually been received more and more attention. In 2016, seven departments of China, including the People’s Bank of China, have jointly issued the “Guiding Opinions on Building a Green Financial System” (People’s Bank of China, 2016). The “Opinions” has become a programmatic document to guide the development of green finance. The report of the 19th session of the national congress of the communist party of China has identified green finance as an essential starting point for implementing the strategic layout of ecological civilization construction and realizing the concept of green development. Until June 2020, the green credit balance has reached 11 trillion yuan, and the stock of green bonds is 1.2 trillion yuan in China, ranking first and second in the world in scale (Yi, 2020). The development of green finance has made significant progress.
The reasons for choosing the Yangtze River Economic Belt as the research object are as follows: first, many studies revealed green finance’s impact on carbon emissions (Li et al., 2017; Chen, 2019; Ding, 2019; Xie and Liu, 2019; Jiang et al., 2020; Niu et al., 2020). After various literature reviews, we have found the importance of green finance, which is ignored in the case of the Yangtze River Economic Belt. Second, as one of the three major support belts for China’s economic development, the Yangtze River Economic Belt is the vanguard of China’s economic development. However, the carbon emissions caused by economic growth are severe. In 2019, its total GDP has accounted for about 46% of China’s total economic output, while its energy consumption and carbon emissions have accounted for about 57% and 56% of China’s totals (Zhang, 2021). Third, realizing goals of green finance to promote carbon emission reduction in the Yangtze River Economic Belt will play a significant role in promoting the realization of China’s “dual carbon” vision. In addition, it will play an essential role in demonstrating green development and carbon emission reduction in other provinces. So, we include the green finance variable to differentiate our study endeavors to fulfil the gap according to a meaningful way.
Green finance is a new trend in China’s future financial development, which has far-reaching significance for carbon emission. So what and how green finance impacts on carbon emissions reduction is a valuable research question. The current study empirically examines the mechanism, explores the intermediary effect, and analyzes the spillover effect of green finance on carbon dioxide emission in the provinces along the Yangtze River Economic Belt. This research investigates the multiple factors which are meaningful that helps policymakers for making decisions regarding sustainable policy. Our research has many decent inferences, both theoretically and practically.
The description of the study is patterned as follows. Literature Review Section deals with the literature review related to connotation of green finance and the influencing factors of carbon emissions reduction. Theoretical and Mechanism Analysis Section provides an analysis of theoretical and mechanism. Research Method Section illustrates the methodology employed in this study. Research Method Section provides the empirical results, and Empirical Results and Discussion Section presents the conclusion and recommendation.
Literature Review
Research on Green Finance in China
Green finance is no doubt the focus of most countries, including China. Presently, green finance is a well-established and recognized field of study. It is worthy to note that academic research on green finance has gradually deepened. In the earlier studies, the functional effects of green finance (Su et al., 2019), the mechanism of action (Cao and Chen, 2018), and development path (An et al., 2017) have aroused general interest. The research level mainly focuses on the national perspective (Zeng et al., 2014; Fang and Lin, 2019), the regional perspective (Yang and Wang, 2017) and, the perspective of the “Belt and Road” (Zhao and Liu, 2020; Qiao et al., 2021). Also, limited by the availability of green finance data, most empirical studies on green finance just show solicitude for green credit. From the macro level, the research explores the implementation path of green credit (Chen et al., 2016) and the obstacles to implementation (Zuo et al., 2017); from the micro-level, the study mainly identifies the impact of green credit on the business performance of commercial banks (Liao et al., 2019). Regarding the measurement of the development level of green finance, the previous literature can be roughly divided into two categories. The first is to measure the development level of green finance from the perspective of capital investment entities. Li and Xia (Li and Xia, 2014) analyzed five aspects, including green credit, green securities, green insurance, green investment, carbon finance, to build an indicator system for green finance, which has been recognized and applied by scholars (Shao and Fang, 2021). The second is to measure the development level of green finance from the perspective of fund recipients. Zhang (Zhang et al., 2018) uses the operation data of listed companies to measure the development level of green finance.
The Linkage Between Green Finance and Carbon Emission in China
The relevant scholars conducts most of the studies to examine the impact of carbon emissions, taking into account the views of economic growth (Xu and Song, 2011), technological innovation (Sun et al., 2020), urbanization rate (Yuan et al., 2015; Wang et al., 2019a), industrial structure (Yang and Yang, 2018; Li et al., 2019), financial development (Katircioğlu and Taşpinar, 2017), etc. However, The outcomes of the current literature about the impact of financial development on carbon emissions are inconclusive, ranging from positive to negative. In view of Shahbazet (Shahbaz et al., 2013), “financial development could effectively promote technological innovation and raise environmental protection awareness to reduce carbon emissions significantly.” Numerous studies have conducted empirical studies on different countries through different methods, all of which have confirmed that financial development can curb carbon emissions (Jalil and Feridun, 2011; Gu and He, 2012). However, some scholars (Charfeddine and Ben Khediri, 2016; Hu and Wang, 2018) hold different opinions. They have opined that financial development can rapidly promote economic growth, which consumes a large amount of fossil energy that is a pivotal factor to increase carbon emissions. Wu (Wu, 2018) has recorded in their research work that bank credit has an effect on the scale and technological aspect of carbon emissions, affecting carbon emissions by acting on economic growth and technological progress. A study has conducted by Yan (Yan et al., 2016) narrates that both the credit scale and the FDI scale shows a “U”-shaped relationship with carbon dioxide intensity. The scale of financing, financial industry competition, and credit fund allocation have a significant inhibitory effect on carbon emission intensity.
The link between green finance and carbon emission reduction cannot be overemphasized. Li (Li et al., 2017) has constructed a financial CGE model and found that green finance policies can effectively inhibit the investment behavior of intensive industries that is a vital role in achieving carbon emission reduction. Chen (Chen, 2019) has used the double-difference model to provide evidence that green financial policies hurt the investment and financing of high-polluting enterprises, mainly in the aspects of financing punishment and investment inhibition. Further research (Ding, 2019) has specified that when heavily polluting enterprises face the constraints of green credit financing, their response to capital allocation adjustment is insufficient, and total factor productivity tends to decline. Niu (Niu et al., 2020) has stated that green financial policies positively impact green enterprise, mainly in terms of improving financing convenience and enhancing the credit support. However, the impact of the green credit policy on the financing cost has not yet fully manifested, indicating that the differentiated green finance policy should be carried out between green enterprises and “two high” enterprises. Jiang (Jiang et al., 2020) has shown that green credit has a significant carbon emission reduction effect. Funds should be guided to flow into the green finance sector. In terms of transmission mechanism, scholars (Xie and Liu, 2019) have found that green credit promotes green growth mainly by improving technological progress.
It is limited that the research emphasized on the relationships between carbon emission and green finance in the Yangtze River Economic Belt. Existing research mainly address green finance efficiency and the relationship between green finance and ecological environment. Zeng (Zeng et al., 2021) has researched the efficiency of green finance in the Yangtze River Economic Belt using the Malmquist index model, from the perspectives of technical efficiency, technological progress, pure technical efficiency, scale efficiency, and total factor production change index. Zhou (Zhou and Zhu, 2018) has investigated the relationship between financial development and green total factor productivity growth in the Yangtze River Economic Belt from the financial depth and financial efficiency based on the directional distance function and the Global-Malmquist-Luenberger exponent. Qian (Qian and Lű, 2020) has studied the coordinated development of green finance, economy, society, and ecological environment in the Yangtze River Economic Belt based on the coupling effect theory. Finally, According to Qu (Qu et al., 2019), green credit has a significant role in promoting green economic growth in the Yangtze River Economic Belt based on a differential GMM model. Green credit policies should be continuously implemented to build a multi-level green financial system.
To the best of our understanding, it can be observed that there are no corresponding empirical studies that address the extent to which green finance impacts on carbon emissions, particularly in the Yangtze River Economic Belt. Additionally, there is a lack of literature on the empirical analysis of the spatial spillover effects of green finance on carbon emissions from a spatial perspective. Therefore, this paper selects the Yangtze River Economic Belt, a central national strategic development area, as the research object. This forms the major contribution of the present study to the existing body of knowledge as it attempts to fill this gap in the study of the spatial autocorrelation characteristics of carbon emission and spillover effects of green finance on carbon emissions.
Theoretical and Mechanism Analysis
Spatial Theoretical Analysis
According to the literature review, green finance uses financial instruments to control carbon emissions by rationally deploying resources. Green finance can directly and indirectly affect carbon emissions. First, It can promote the environmental protection industries development and the transformation and upgrading of traditional industries through transmission. The direct impact of green finance on carbon emission reduction is reflected in the different treatment of financing constraints on environmental protection companies and high-carbon companies. The development of enterprises requires financial support. Green finance strictly controls the flow of credit funds to high-carbon industries through banks, other financial intermediaries, and various financial markets. Green finance forces high-carbon enterprises to transform the existing extensive development model and develop in the direction of resource conservation and green and low-carbon. Lin et al. (Lin et al., 2018) have considered that green finance provides financial support to environmental protection companies and related companies, which is essential for improving the improvement of ecological environment quality. Green finance supports the flow of credit funds to the environmental protection industry and environmentally- friendly industries, broadens the financing channels of the environmental protection industry, and removes obstacles to the development of the environmental protection industry, thereby directly affecting carbon dioxide emissions. Wang et al. (Wang et al., 2019b) have believed that the development of green finance can intensify the financing constraints of environmental pollution-related enterprises. It has a significant inhibitory effect on the progress and development of ecological pollution-related enterprises.
H1: Green finance has a direct role in reducing carbon dioxide emissions.
Due to financing restrictions, high-carbon industries must seek ways to transform the path of development. Technological innovation has become a driving force leading the transformation and development of enterprises supported by the theory of endogenous growth. First, high-carbon enterprises apply the technological innovation to treat pollutants discharged into the atmosphere, such as (carbon decomposition, carbon capture). Then, clean industry can develop through technical cooperation to achieve the goal of reducing carbon dioxide emissions. Sun et al. (Sun et al., 2020) have carried out a systematic or formal inquiry to discover that green technological innovation is the fundamental driving force for energy conservation, emission reduction, and green development.
H2: Green finance can affect the level of technological innovation to reduce carbon emissions.
Space Mechanism Analysis
In China, policies among different regions are not individually formulated and acted. Spillover effects of policy formulation and implementation are gradually emerging in geographic space. In addition to providing substantial support to local green enterprises, green financial policies will also have a certain degree of influence on adjacent areas. Green finance maintains the development momentum of green resources in high-value agglomerated provinces. It promotes the spread of financial capital to neighboring low-value resource provinces to obtain comprehensive and systematic development. With the help of a big data platform, a financial service system has been built, which can lead neighbors to develop green finance jointly. But at the same time, the strict implementation of the green finance policy has suppressed the development of high-carbon companies. High-carbon companies may move to neighboring provinces with a looser approach, which will also aggravate the carbon dioxide emission of neighboring regions to a certain extent.
This article believes that while the development of green finance in this region promotes local carbon dioxide emissions reduction, it may reduce carbon dioxide emissions in neighboring regions through a policy attraction mechanism. But it also may cause carbon dioxide production in the neighboring areas due to the transfer of local heavily polluting companies. Therefore, a more reasonable explanation is that the development of green finance in local regions may have both a positive boost and a harmful restraint on the carbon dioxide emission of neighboring areas. But which effect is more effective that requires further testing through empirical testing analysis.
Research Material
Proposed Research Study
The study scrutinizes the relationship between green finance and carbon emissions from the perspective of mediation and spillover effects. Technological innovation is identified as a mediating variable. Besides, the control variables of the industrial structure, urbanization rate, the opening up level are also taken into account. Considering the availability of data, this paper takes 11 provinces or cities in the Yangtze River Economic Belt as the research object. Multivariate annual time series data spanning from 2006 to 2019 is employed in the current study. The annual data has the advantage that it eliminates seasonal variability.
Sample and Data Collection
The required sample data are sourced from the China Statistical Yearbook (2007–2020) (National Bureau of Statis, 2007-2020) and the Statistical Yearbooks of various provinces and cities. Especially, the data about independent variables selected in this paper come from the database of CSMAR. As the social responsibility report of the five state-owned banks in China only discloses the total amount of green credit in the country, the green credit data of the five central banks in the 11 provinces or cities of the Yangtze River Economic Belt do not have accurate statistical calibers and statistical data. The ratio of the credit line of 11 provinces or cities to the total credit of the five major banks in the country is applied to calculate green credit data. Furthermore, the article eliminates the first-level indicators of carbon finance for research owing to unavailable data. The missing values involved in the sample data are filled with mean value interpolation.
Variable Measurement
Dependent Variable
The intention of the carbon emission reduction target is to pursue the coordinated development of the environment and the economy. Compared to a single indicator of carbon dioxide emissions, both economic and environmental benefits is considered to measure carbon emission effect best, which GDP emphasizes economic benefits and carbon dioxide emission relates to the environmental condition. The ratio of them is carbon intensity (CI). Among them, the calculation method of carbon dioxide emissions adopts the second method announced by the IPCC, which calculates the amount of carbon dioxide released by the consumption of seven energy sources such as coal. The calculation formula is shown in Eq. 1:
In the formula, the characters of
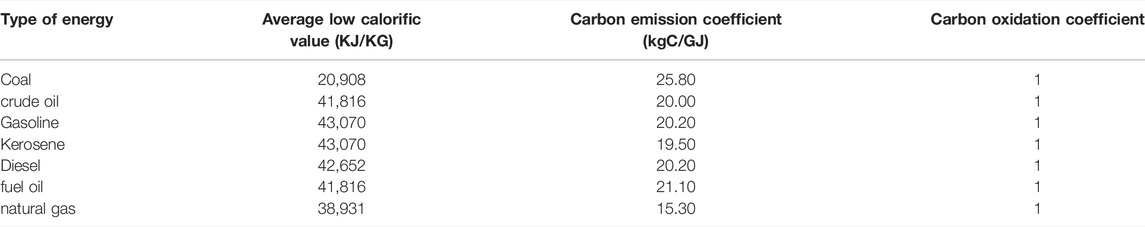
TABLE 1. Carbon emission calculation factor.
Independent Variable
According to the research topic, green finance is selected as the primary independent variable. Scholars critically measure the performance of green finance, but previous studies have found no evidence of any inimitable methods to evaluate green finance output. Studies have predominantly employed existing tools, such as DEA and entropy weight method. This article measures green finance index construct with five item developed by Li (Li and Xia, 2014), Yin (Yin et al., 2021), and He (He et al., 2019). The indicator system from the perspective of five green financial products uses the entropy method to measure the green finance composite index to illustrate the development level of green finance. The index is shown in columns of Table 2.
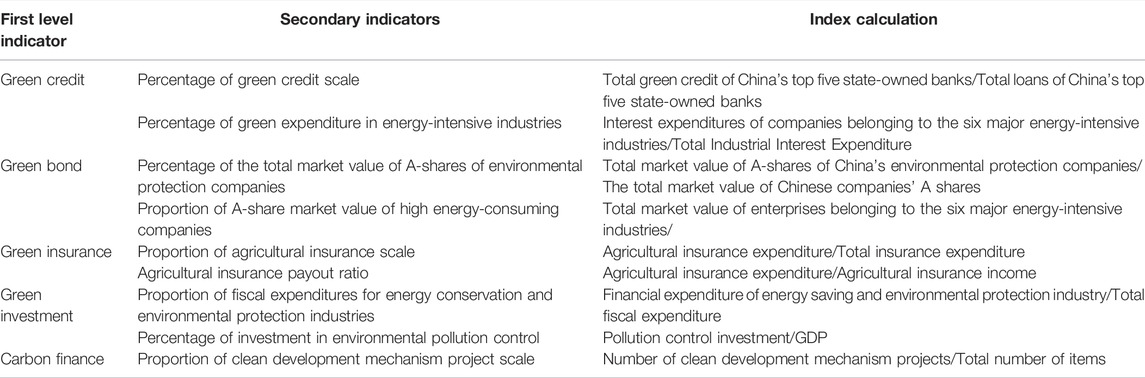
TABLE 2. Green finance index system.
Intermediary Variable
In view of theoretical assumptions, this paper selects technological innovation as an intermediary variable to examine the mediating role in the association between green finance and carbon emission. The earlier studies use one-sided indicators to indicate the level of development of technological innovation, such as the number of invention patents granted (Xu and Zhang, 2021). Still, the index ignores the consideration of the application stage of technological innovation. This article refers to the research results of scholars such as Huang (Huang et al., 2019), establishes a scientific, technical innovation index system from four dimensions of scientific and technological innovation environment, scientific and technological innovation input, scientific and technological innovation output, and scientific and technological innovation diffusion. The index is shown in columns of Table 3.
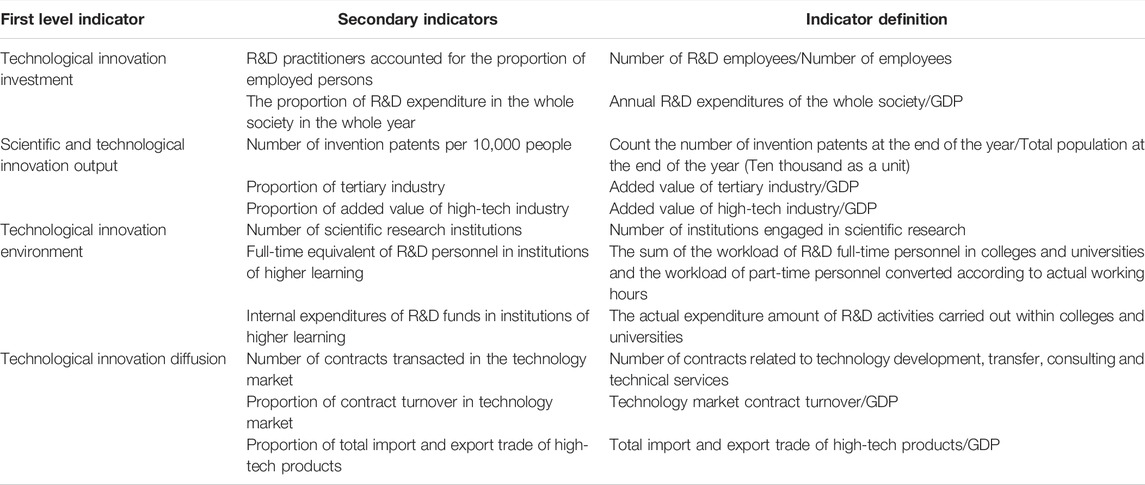
TABLE 3. Scientific and technological innovation index system.
Control Variables
As known from the literature review, a vast amount of research (Zhao and Liu, 2020; Yin et al., 2021) consists of industrial structure, urbanization rate, and the level of opening up as control variables. This article selects the variables mentioned from previous studies as control variables to demonstrate the effect on carbon emissions drawing on existing research results. The industrial structure can change the industrial development model and energy consumption to reduce carbon emissions (Yang and Yang, 2018; Li et al., 2019). Furthermore, the urbanization rate is reflected in the role of changing people’s living standards which causes changes in consumer demand and behavior (Yuan et al., 2015; Wang et al., 2019a). Finally, the level of the opening up can impact on carbon emissions through cooperation and exchanges with developed countries.
For the control variables, the research results of Zhao (Zhao and Liu, 2020) and Chen (Chen et al., 2018) are worth referring to in this article to measure the variables. The indexes of industrial structure, the urbanization rate, and the opening up level are calculated, separately, by the proportion of the added value of the secondary industry in the national accounts, the ratio of urban population to permanent population, the balance of imports and exports in GDP. The variable names and metrics are shown in Table 4.
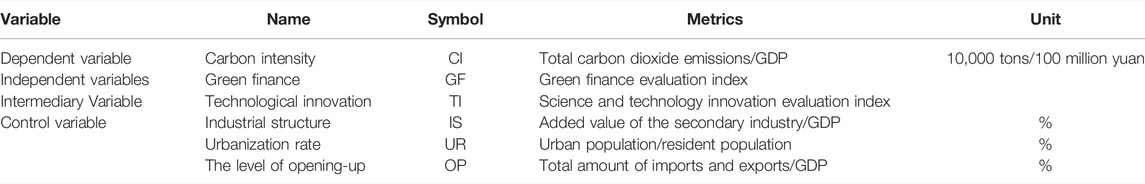
TABLE 4. Variable names and metrics.
Research Method
Considering the mediating mechanisms of technological innovation and the spillover effect of green finance on the knowledge and skills of surrounding areas, the mediation effect model is applied to explain how green finance influences carbon emission through technological innovation. Moreover, the spatial correlation between decision-making units is added in the model to avoid empirical bias caused by not considering spatial connections. We therefore incorporate a panel dataset to examine the strength of the spacing relationships between green finance and carbon emission by the spatial Durbin model.
Unit Root Test
The unit root test is a test of the stationarity of the series. Using OLS directly without checking the stationarity of the series will easily lead to spurious regression. Unit root tests are the primary step to move into regression models. The study adopts two following tests that widely used Augmented Dickey-Fuller (ADF) and Phillips-Perron (PP) to detect the stationarity of an entire series, which is specified in Eq. 2:
Where
Multicollinearity Test
The model estimates are distorted or difficult to estimate accurately due to the existence of precise or highly correlated relationships between explanatory variables. For regression models, one of the basic assumptions is that there is no strict linear relationship between the independent variables. Otherwise, it will have a serious impact on the regression parameter estimation. With a high degree of multicollinearity, the OLS estimator still has good statistical properties such as linearity. However, the OLS method cannot give really useful information in statistical inference. In general, VIF(Variance Inflation Factor) is used to test for multicollinearity. The larger the value, the stronger the collinearity.
Model
Mediation Effect Model
Based on the theory of endogenous growth, technological innovation has become a driving force leading the transformation and development of enterprises. That is, this variable may play an intermediary role in the process of green finance affecting carbon emission. According to Jaffar Abbas (Abbas et al., 2019; Abbas et al., 2020) to test whether the mediation effect exists, this paper uses the mediation effect test method proposed by Hayes (Hayes, 2009) to construct a panel mediation effect model.
Equation 3 shows the direct relationship of green finance and carbon emission achievement; here, CI shows carbon emission achievement. If the parameter
The current research empirically scrutinizes the multivariate time series approach. The data of independent variables are converted into a natural logarithmic form to eliminate the heteroscedasticity problem and make the model have a better fitting effect. By drawing a scatter plot between each dependent variable and the independent variable, it is found that industrial structure and carbon intensity present an inverted U-shaped distribution feature, and the first and second terms of the logarithmic value of the industrial structure are introduced into the model.
Spatial Durbin Model
The first laws of geography developed by Waldo Tobler (Tobler, 1970) clarify that everything in the world is related to geographical space. The closer the distance is, the stronger the connection is. It is essential to consider two-way spatial relations when analyzing statistical data relating to regions. The main reasons are: 1) If the spatial correlation is present, several OLS assumptions might not be satisfied. 2) Spatial dependencies in a dependent variable which is a weighted spatial average, can make OLS biased and inconsistent. 3) Spatial dependencies in the error term, a weighted spatial average yield inefficient regression coefficients by OLS. The spatial Durbin model (SDM) extends traditional the linear regression model by adding both spatially endogenous interactions and spatial interactions in the error term as well as exogenous interactions. Compared to SAR or SEM model, the advantage of SDM is that its spillover effects are flexible (Baumont et al., 2004). In this paper, an SDM model is established as shown in the Eq. 6:
In the model,
Empirical Approach
Spatial Weight Matrix
The introduction of the spatial weight matrix quantifies the geographical laws between spatial entities and spatial entities with numerical values. More importantly, it builds a bridge for related research based on geographic space by integrating the spatial weight matrix into the measurement model. The critical element of constructing the spatial econometric model is to select the appropriate spatial weight matrix (LeSage and Pace, 2009). At present, spatial adjacency weight matrix, spatial geographic distance weight matrix, and spatial economic distance weight matrix are widely used. Given the nature of carbon emission reduction, this article applies the adjacency weight matrix and the inverse distance weight matrix in the model. Given the following spatial weight matrix,
Spatial Autocorrelation
In general, it can infer regional structural dependencies from observing a correlation between data points and if this correlation follows a specific spatial pattern (Anselin et al., 2008). The development of an object can be influenced by the events in all other objects of the same total space. The statistical concept for measuring spatial autocorrelation has widely used the global Moran index (Moran, 1948). The article also uses this method to measure the spatial correlation of the research object. The specific expression is shown in the Eq. 8:
The value of the global Moran index is distributed between -1 and 1. The positive and negative values represent the distribution of spatial autocorrelation respectively. If the value tends to zero, the spatial correlation is weaker, and there is no spatial autocorrelation.
Direct, Indirect and Total Effect
Direct, indirect, and total effects express spatial correlation from different perspectives. The direct effects effectively explain the influence of the independent variables on the dependent variable in the local space. Indirect effects illustrate the spillover effects of independent variables on dependent variables of individuals with geographic proximity areas. That is the degree of mutual influence between neighboring spatial individuals. Finally, the total effects show the complete result of the independent variables on the dependent variable in internal and external.
Empirical Results and Discussion
Table 5 reveals the descriptive statistics of the data with a total of 154 observations. Statistical techniques are processes used to describe the features of determinants. Table 5 shows the mean, standard deviation, minimum, maximum, sum, and count values for the variables chosen. The average value of carbon intensity is 1.6287, with a standard deviation value of 0.774. Green finance and technological innovation have average values of 19.25 and 994.87.
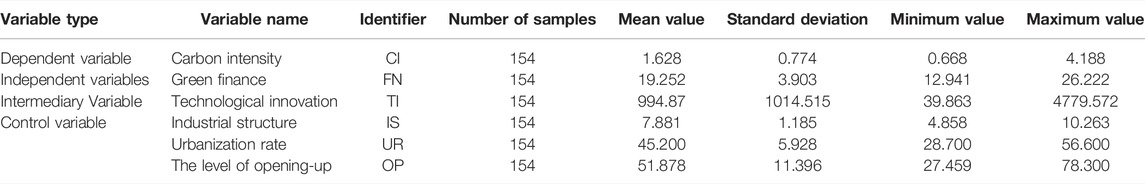
TABLE 5. Descriptive statistics of the main variables.
Results of the Unit Root Test and Multicollinearity Test
Table 6 demonstrates the results of the unit root test and multicollinearity test. In panel A, ADF and PP are used to verify the stationarity of the series. The
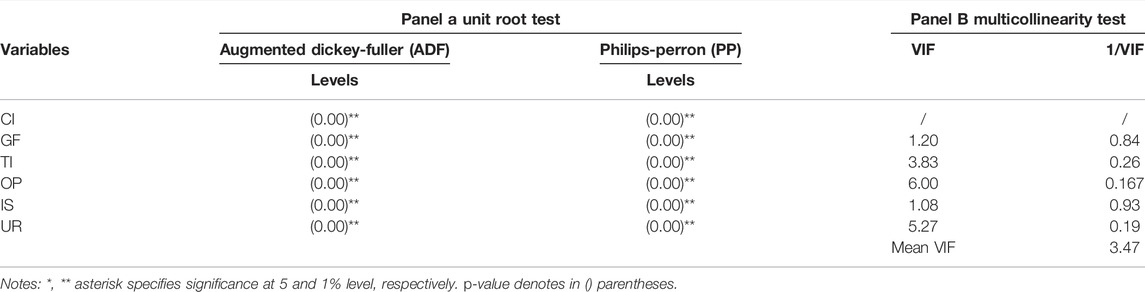
TABLE 6. Results of unit root test and multicollinearity test.
Results of the Hausman Test
Previous studies have specified that these endogeneity problems typically exist in panel datasets and produce biased and unreliable results (Tien et al., 2013). According to econometrics, if a variable has endogenous issues in the proposed model, scholars will suggest helpful ways to deal with them (Javeed et al., 2020; Mubeen et al., 2021). Several econometric procedures are available to manage endogeneity issues-for instance, fixed-effect models, instrumental and lagged dependent variables. We use the Hausman test to provide criteria for selecting random effects and fixed effects, according to Chen (Chen, 2014). The test results confirm the rationality of the fixed effects, which is significant at the test level of 1%. The spatial measurement model involves two dimensions of time and individuals. Significantly, the fixed effects test determines whether different time points and individuals in different spaces affect the model’s intercept. The test results show that the individuals and time fixed effect are significant at the 1% test level. They indicate that different time points and spatial individuals will cause differences in the model intercept shown in Table 7.
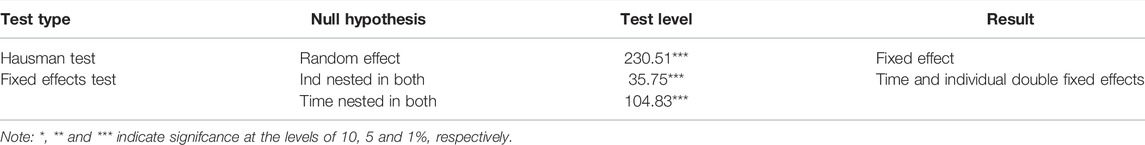
TABLE 7. The results of the Hausman test.
Besides, taking into account the value of Sigma2_e, log-likelihood, and R2 shown in Table 8, the time and individuals double fixed effects is the most minor and most significant at the 1% test level, and the value of log-likelihood is the largest. So the double fixed effects at time and individuals are used.

TABLE 8. The results of the fixed effects test.
Results of LM, Wald and LR Test
Before applying the spatial Durbin model, Table 9 shows some tests to check the model to determine whether they are suitable for analysis. We apply the Lagrange Multiplier test (LM), Wald test, and LR test to verify model selection from different perspectives refers to Anselin (Anselin, 1988; Anselin and Bera, 1998). The former is used to confirm whether the spatial lag term and the spatial error term can be included in the spatial measurement model. On the contrary, the latter is be manipulated to verify whether the spatial Durbin model (SDM) can be simplified into SAR and SEM models. The test results are both significant at the test level of 5%. This provide statistical evidence that choosing the spatial Durbin model (SDM) is scientific.
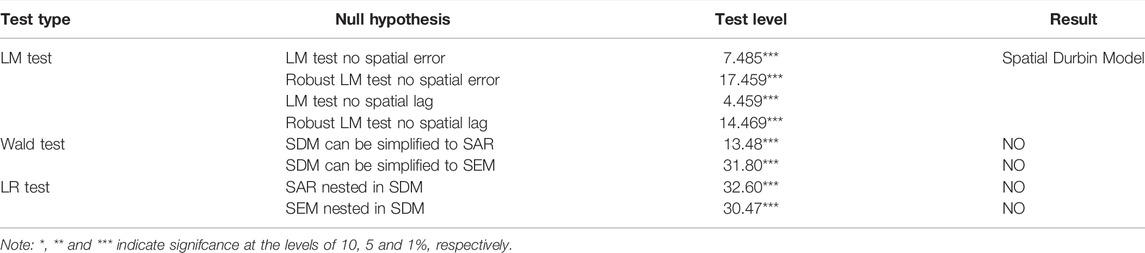
TABLE 9. The results of the test.
Analysis of Hypothesis 1
To determine how green finance influences carbon emission through technological innovation, we use the stepwise regression model with double fixed effects at time and individuals. Table 10 indicates the results related to the stated hypotheses (H1 and H2) of this study and the coefficient estimates of variables to explore the direct relationship between green finance and carbon emission with the moderating role of technological innovation in this relationship. Models 1 and 2 examine the impact of green finance on carbon emission. Model 1 shows that the green finance impact is negative on carbon emission at a significance level of 1% and a coefficient value of−0.889 without control variables. Model 2 also shows a negative coefficient value of green finance (−0.497) for the carbon emission added control variables. Therefore, Hypothesis 1 is accepted according to the results no matter whether the control variable is added or not. This arrives at the same conclusion reached previously by Xie et al. (Xie and Liu, 2019). Furthermore, green finance can intensify the financing constraints of the progress and development of ecological pollution-related enterprises.
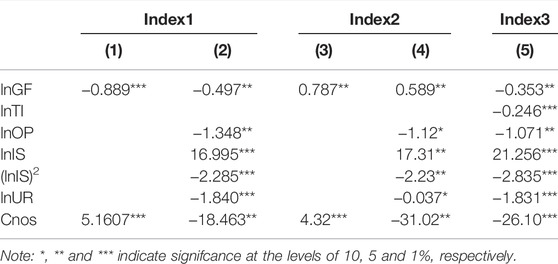
TABLE 10. The regression results of mediation model.
Analysis of Hypothesis 2
Models 3, 4, and 5 explain the mediation role of technological innovation in the green finance and carbon emission relationship. In order to test the mediation hypothesis, we first regressed the green finance on carbon emission for the mediation effect in models 3 and 4. The green finance coefficient in Model 3 was highly significant and positive (1% level) without control variables. Model 4 also shows a positive coefficient value of green finance (0.589) for the technological innovation with added control variables. The regression results show that green finance can significantly promote technological innovation, and the influence effect remains significant after adding control variables. Second, we develop Model 5 to investigate the technological innovation-mediating effect on the relationship between green finance and carbon. In Model 5, we regress green finance, technological innovation, and carbon emission together to investigate the mediating role in the relationship between green finance and carbon emission. The coefficient of green finance in both models is negative and highly significant at 1% when we regress green finance, technological innovation, and carbon emission together. The green finance coefficient indicates that leverage negatively mediates this relationship, which supports Hypothesis 2. The same conclusion exists in Qi et al. (Qi et al., 2015). In line with previous findings, we provide the support that the mediating effect of technological innovation on the green finance and carbon emission relationship is negative. Overall, the analysis confirms the mediating effect of technological innovation exists. This verifies the validity of Hypothesis 2 to some extent.
Spatial Autocorrelation Analysis
Table 11 displays the autocorrelation results, the calculation result shows a positive spatial autocorrelation between the carbon emission reduction of the 11 provinces or cities in the Yangtze River Economic Belt. At the same time, the global Moran index values calculated by the two spatial weight matrices are all positive and significant at the 10% inspection level. From the time dimension, it becomes a critical year for dividing the development trend of carbon emission in 2009, when the value of the Moran index reaches the highest point. After 2009, its value changes alternately in each year. Numerically, the global Moran index calculated by the inverse distance weight matrix floats around 0.1, while the global Moran index calculated by the adjacency weight matrix floats around 0.3. Therefore, the adjacent weights matrix can help carry out research.
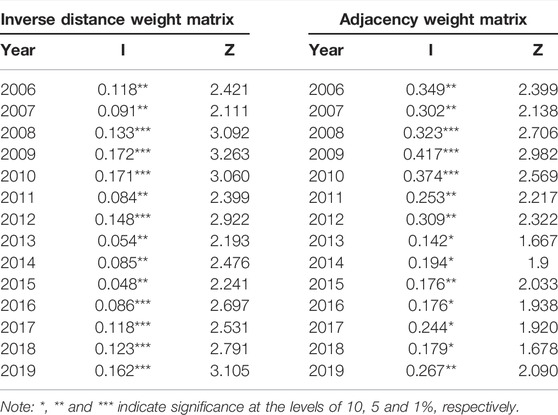
TABLE 11. The calculation results of the global Moran index.
For the convenience of display, the article adopts the natural breakpoint method to draw a map of the spatial distribution of carbon emission in each province in the Yangtze River Economic Belt in 2006 and 2019 through ArcGIS software. The geographical location of the Yangtze River Economic Belt in China can be seen in Figure 1A. From Figure 1B (2006), it can find that Shanghai has the lowest carbon intensity, neighboring provinces involving Zhejiang, Jiangsu, and Anhui are in the middle. In contrast, Guizhou and Yunnan have the highest carbon intensity. Compared to 2006, Figure 1C (2019) shows that Shanghai has the lowest carbon intensity. This is mainly attributable to developed finance and trade. The carbon emission reduction of Chongqing has declined. This can originate from its extensive economic development model. Although Guizhou’s carbon emission reduction effect has improved, there is still a gap between cities with better development. The main reason is a relatively high proportion of “three high” industries. On the whole, there is a positive spatial autocorrelation of carbon intensity, and the provinces and cities in the Yangtze River Economic Belt show high-high accumulation and low-low accumulation.
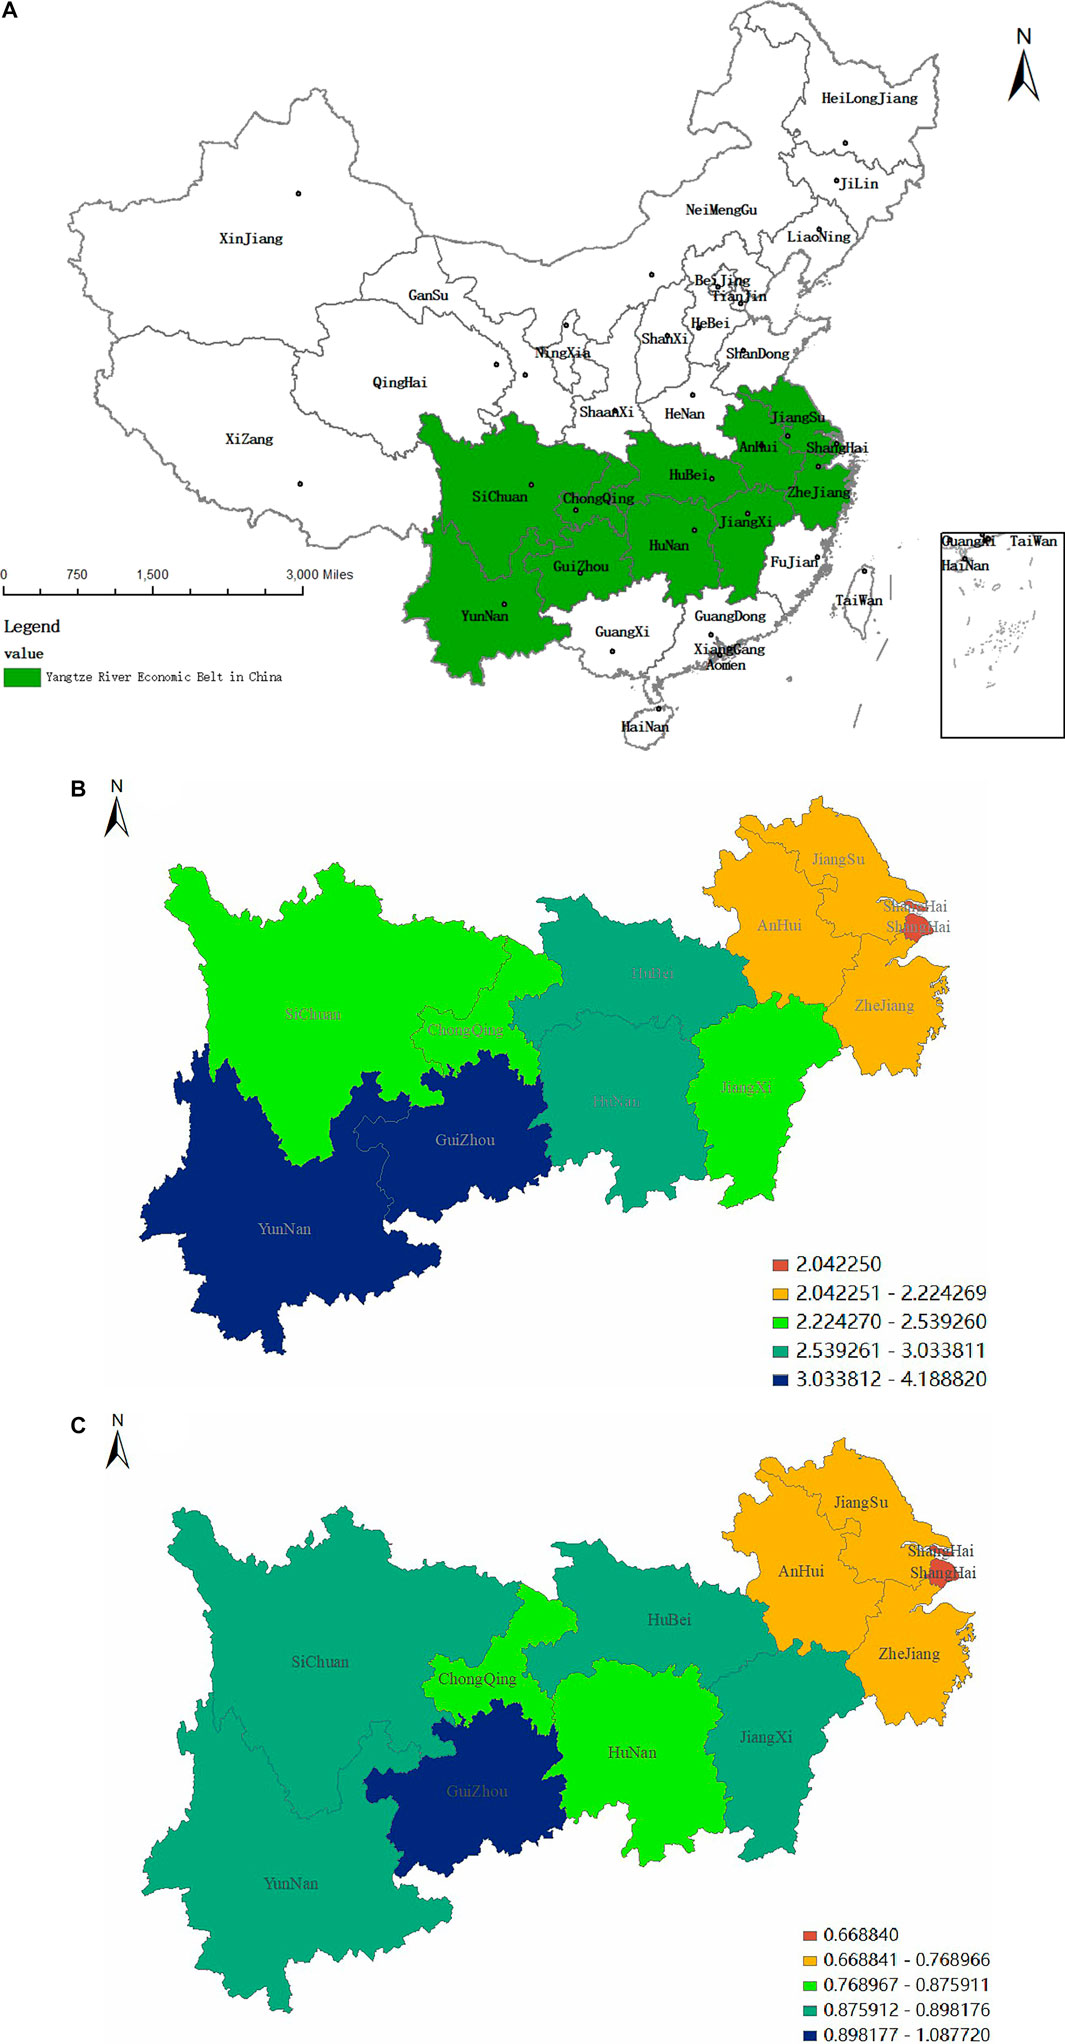
FIGURE 1. (A) Geographical location of the Yangtze River Economic Belt in China. (B) (2006) Carbon intensity spatial correlation. (C) (2019) Carbon intensity spatial correlation.
Spatial Effect Analysis
Since the spatial Durbin model contains the spatial lag term of independent variable and dependent variable, the spatial lag term of the independent variable will have an impact on the feedback effect. Therefore, the parameter estimates of each spatial lag term in the model cannot accurately reflect the influence of the independent variable on the dependent variable, and the direct and indirect effects need to be measured by means of partial differential methods due to spatial dependence. The results of the spatial effect are shown in Table 12.
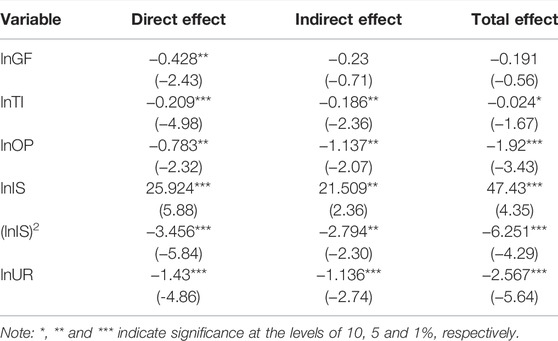
TABLE 12. The results of the spatial effect.
The decomposition results of the model show that, except for green finance, the total effects of other influencing factors on carbon emission are significant at the 10% test level, and the direct effects of all factors on carbon emission are significant at the 5% test level. The indirect effects of green finance are not effective.
1) The direct effect of green finance on carbon emission is significantly negative at the 5% test level, indicating that green finance has an inhibitory effect on carbon emission. We have the same conclusion as He (He et al., 2019) and Chen (Chen and Chen, 2021). The main reason is as follows: on the one hand, guided by the “outline of the development plan for the Yangtze River Economic Belt,” many provinces have successively issued green finance development plans, such as Chongqing. On the other hand, the China development bank and agricultural development bank have provided green credit, sustainable development thematic green financial bonds, and PSL funds in the field of ecological and environmental protection to support the green development of the Yangtze River Economic Belt. In summary, the effect of green finance development has been highlighted, and the impact of curbing carbon emissions has initially appeared. However, the indirect effect and the total effect coefficient are negative but not significant. It shows that the improvement of the level of green finance in the local region has a noticeable limiting effect on carbon intensity. Still, the spillover effect on neighboring areas is not apparent. The main reason is that the green financial system is fragmented. Each province still formulates their own green finance development plan, and there is no unified green finance development plan for the Yangtze River Economic Belt. Besides, there are lacking information-sharing mechanisms to share and disseminate green finance development, train green finance talent, and guide green credit.
2) The direct and indirect effects of technological innovation and carbon emission is significantly negative at the 5% test level. This means that technological innovation has an inhibitory effect on carbon emission. The main reasons are: On the one hand, Scientific and technological innovation is the main driving force for the economic transformation and upgrading of the Yangtze River Economic Belt. Comprehensive innovation and reform experiments in Shanghai, Anhui, Wuhan, and Sichuan have been launched. As a result, the effects of scientific and technological innovation on carbon emission have gradually emerged. On the other hand, in the context of China’s “carbon peak” and “carbon neutrality,” the transformation results of technological innovation, such as carbon capture, carbon decomposition, and carbon conversion, have begun to be applied to the process. Besides, The Yangtze River Belt has considerable advantages in scientific and technological resources and innovation capabilities, sufficient industrial connection in the entire Yangtze River Economic Belt leads to the extension of the regional innovation chain. The spillover effect on neighboring areas is significant.
3) The direct, indirect and total effects of industrial structure on carbon emission are all significant at the 5% test level and show an inverted U-shaped distribution, indicating that the industrial structure has a synergistic promotion effect on carbon emission in the early stage and a synergistic inhibitory effect later. The main reason is that each province has clarified the strategic positioning and implementation goals of self-examination under the “Yangtze River Economic Belt innovation-driven industrial transformation and upgrading plan.” Each province has seen the Yangtze River Economic Belt as a whole to promote industrial upgrading and transformation. Therefore, the spillover effect is pronounced.
4) The direct, indirect, and total effects of the level of opening-up on carbon emission are all significant at the 5% test level, indicating that the level of opening-up has a significant inhibitory impact on carbon emission in space. This phenomenon is mainly benefited from Shanghai’s agglomeration advantages in the field of international intermediary services. Shanghai can provide international professional intermediary services for enterprises in the Yangtze River Economic Belt and drive enterprises to join up.
5) The direct, indirect and total effects of urbanization on carbon emission is significantly harmful indicating that effect of urbanization on carbon emission is substantial. Theoretically, the impact of urbanization on carbon dioxide emissions is uncertain. On the one hand, urbanization makes people pursue a higher standard of living, there is an increase in energy consumption and energy demand, which leads to a rise in carbon dioxide emissions. On the other hand, urbanization helps people improve their education and environmental awareness, pursue a low-carbon life, and reduce carbon dioxide emissions. Now, the latter effect is greater than the former. We have the same conclusion as Hu et al. (Hu and Wang, 2018). In this case, the spillover effect between spaces is also obvious.
Robustness Analysis
In order to ensure the reliability of the research conclusions, This paper conducts a robust analysis of the main results from the following three aspects: 1) In order to eliminate endogenous problems such as regional scale and variable omission, this paper uses proportional index and comprehensive index calculated by entropy method. 2) A fixed-effect model is selected to solve the time-invariant and unobservable endogeneity problem by the Hausman test. 3) The model is re-estimated based on W1 by using the Second-order spatial lag term of carbon intensity as the instrumental variable in the generalized spatial least squares (GS2SLS) model. Compared with the traditional static spatial panel model, the dynamic spatial panel model not only takes into account the dynamic changes of environmental pollution, but also avoids reverse causality, especially it has incomparable advantages in solving the endogeneity problem caused by the spatial econometric model (Yuan et al., 2019).
The spatial lag term of carbon intensity is still significant, and the core explanatory variable is still significantly negative to carbon emission reduction. It could be inferred that the benchmark regression results have strong robustness. The results of GS2SLS are shown in Table 13.

TABLE 13. The results of the GS2SLS.
Conclusions and Recommendations
This research emphasized examining the association between green finance and carbon emission in the Yangtze River Economic Belt from the perspective of intermediary effect and spillover effect. The study results are in line and consistent with the body of past scientific literature. The unit root test and multicollinearity test proves the data are stationary and free from multicollinearity, which builds a foundation for constructing a regression model. The Hausman test provides evidence for the selection of time and individuals double fixed effects. This paper uses the mediation effect test method to confirm the mediating role of technological innovation between green finance and carbon emission. The analysis confirms the mediating effect of technological innovation exists. The validity of the theoretical hypothesis is verified. Additionally, the paper selects the spatial Durbin model based on the adjacency weight matrix to clarify the spillover effects. Through the endogeneity test, the reliability of the model results has been demonstrated. The spatial effect of carbon emission reduction in the Yangtze River Economic Belt has been formed. The carbon emission reduction has shown a downward trend year by year and a mutually inhibiting effect on various provinces. The outcomes of this study describe that green finance has shown a specific inhibitory effect on carbon emission and the direct effect is significantly negative. However, the indirect effect is not significant. The main reason is the green financial system is fragmented. The research findings stated that institutional mechanisms play an indispensable role in achieving healthier carbon emissions performance.
This Paper’s Recommendations Are as Follows.
Firstly, the provincial governments of the Yangtze River Economic Belt should establish a green finance development alliance of the Yangtze River Economic Belt, which should research and issue a “green finance development plan of the Yangtze River Economic Belt” to clarify the functional positioning of green finance. The provincial governments should try to build a green financial reform and innovation pilot zone which can form a batch of replicable, popularized experiences to promote the joint development of the Yangtze River Economic Belt from point to area. Commercial banks could enrich and implement green financial products, encourage the coordinated allocation of funds and credit resources and encourage institutions and the public to participate in the green fund and bond market.
Secondly, the Yangtze River Delta innovation cooperation alliance should further expand to the important node cities in the Yangtze River Economic Belt (such as Chongqing, Chengdu, Wuhan, Kunming, Guiyang, etc.) to promote innovation cooperation network between Shanghai and important node cities in the Yangtze River Economic Belt. Besides, the provincial governments must create a good atmosphere for scientific and technological innovation, set up special challenge bonuses for major technological innovation breakthroughs, encourage scientific and technological personnel to continuously climb towards better technology, and strive to break through the technical problems existing in the field of carbon emissions.
Limitations of the Study and Agenda for Future Research
Like any empirical research, this study suffers from some limitations. Studies from the impact of the epidemic on carbon emission are relatively rare. This research does not consider the impact of COVID-19 on corporate performance and green finance policies. The epidemic has challenged the operation of enterprises (Mamirkulova1 et al., 2022; Zhou et al., 2022). It is very important to discuss the challenges of the pandemic on various sectors and discuss how the challenges of COVID-19 have affected companies’ performance. So, the limitations suggest a potential for future studies and might help understand the connection of COVID-19 challenges and carbon emission. Hence, future studies can test these strategies and add some variables to explore compelling results for carbon emission.
Data Availability Statement
The original contributions presented in the study are included in the article/Supplementary Material, further inquiries can be directed to the corresponding author.
Author Contributions
Conceptualization, C-QG and XW; methodology, C-QG; software, XW; validation, C-QG and XW; formal analysis, C-QG; investigation, D-DC and Y-GH; resources, C-QG; data curation, XW; writing—original draft preparation, C-QG, XW, and D-DC; writing—review and editing, C-QG and XW; visualization, D-DC and Y-GH; supervision, Y-GH; All authors contributed to the article and approved the submitted version.
Funding
This research was supported by the National Natural Science Foundation of China (Grant No. 71763017).
Conflict of Interest
The authors declare that the research was conducted in the absence of any commercial or financial relationships that could be construed as a potential conflict of interest.
Publisher’s Note
All claims expressed in this article are solely those of the authors and do not necessarily represent those of their affiliated organizations, or those of the publisher, the editors and the reviewers. Any product that may be evaluated in this article, or claim that may be made by its manufacturer, is not guaranteed or endorsed by the publisher.
Supplementary Material
The Supplementary Material for this article can be found online at: https://www.frontiersin.org/articles/10.3389/fenvs.2022.844988/full#supplementary-material
References
Abbas, J., Raza, S., Nurunnabi, M., Minai, M. S., and Bano, S. (2019). The Impact of Entrepreneurial Business Networks on Firms' Performance through a Mediating Role of Dynamic Capabilities. Sustainability 11, 3006. doi:10.3390/su11113006
Abbas, J., Zhang, Q.-Y., Hussain, I., Akram, S., Afaq, A., and Shad, M. A. (2020). Sustainable Innovation in Small Medium Enterprises: The Impact of Knowledge Management on Organizational Innovation through a Mediation Analysis by Using SEM Approach. Sustainability 12, 2407. doi:10.3390/su12062407
Abbasi, K. R., Adedoyin, F. F., Abbas, J., and Hussain, K. (2021a). The Impact of Energy Depletion and Renewable Energy on CO2 Emissions in Thailand: Fresh Evidence from the Novel Dynamic ARDL Simulation. Renew. Energ. 180, 1439–1450. doi:10.1016/j.renene.2021.08.078
Abbasi, K. R., Abbas, J., and Tufail, M. (2021b). Revisiting Electricity Consumption, price, and Real GDP: A Modified Sectoral Level Analysis from Pakistan. Energy Policy 149, 112087. doi:10.1016/j.enpol.2020.112087
An, T.-X., Hou, X.-M., and Yang, Y. (2017). Research on the Theoretical Connotation and Realization Path of China's green Finance Development. Dong Yue Tribune 38 (06), 92–100. doi:10.15981/j.cnki.dongyueluncong.2017.06.013
An, W. (2008). A Probe into the Connotation, Mechanism and Practice of Green Finance. Econ. Surv. 25 (5), 156–158. doi:10.15931/j.cnki.1006-1096.2008.05
Anselin, L. (1988). Lagrange Multiplier Test Diagnostics for Spatial Dependence and Spatial Heterogeneity. Geographical Anal. 20 (1), 1–17. doi:10.1111/j.1538-4632.1988.tb00159.x
Anselin, L., and Bera, A. (1998). “Spatial Dependence in Linear Regression Models With an Introduction to Spatial Econometrics,” in Handbook of Applied Economic Statistics (New York: Marcel Dekker). doi:10.1201/9781482269901
Anselin, L., Gallo, J. L., and Jayet, H. (2008). “Spatial Panel Econometrics,” in The Econometrics of Panel Data: Fundamentals and Recent Developments in Theory and Practice, Part of the Advanced Studies in Theoretical and Applied Econometrics Book Series (Berlin, Heidelberg: Springer), 625–660. doi:10.1007/978-3-540-75892-1_19
Baumont, C., Ertur, C., and Gallo, J. L. (2004). Spatial Analysis of Employment and Population Density: The Case of the Agglomeration of Dijon 1999. Geographical Anal. 36 (2), 146–176. doi:10.1111/j.1538-4632.2004.tb01130.x
Cao, C., and Chen, Q.-L. (2018). Analysis on the Development of Green Finance in China. Mod. Manag. Sci. 37 (08), 109–111. doi:10.3969/j.issn.1007-368X.2018.08.036
Charfeddine, L., and Ben Khediri, K. B. (2016). Financial Development and Environmental Quality in UAE: Cointegration with Structural Breaks. Renew. Sust. Energ. Rev. 55 (55), 1322–1335. doi:10.1016/j.rser.2015.07.059
Chen, L.-M., Guo, L.-H., and Zhang, W.-W. (2016). The Operating Mechanism and Implementation Path of China's Green Credit Policy. Contemp. Econ. Res. 27 (01), 91–96. doi:10.3969/j.issn.1005-2674.2016.01.012
Chen, Q. (2019). Has China's Green Credit Police Been Implemented? An Analysis of Loan Scale and Costs Based on “Two Highs and One Surplus” Enterprises. Contemp. Finance Econ. 40 (03), 118–129. doi:10.13676/j.cnki.cn36-1030/f.2019.03.011
Chen, X., and Chen, Z.-G. (2021). Can Green Finance Development Reduce Carbon Emissions? Empirical Evidence from 30 Chinese Provinces. Sustainability 13 (21), 12137. doi:10.3390/su132112137
Chen, X.-Y. (2020). Financial Structure, Technological Innovation and Carbon Emissions: Discuss the Development of the Green Financial System. Social Sci. Guangdong 37 (4), 41–50. doi:10.3969/j.issn.1000-114X.2020.04.004
Chen, Z.-M., Wu, S.-M., Ma, W.-B., Liu, X.-M., Cai, B.-F., Liu, J.-W., et al. (2018). Driving Forces of Carbon Dioxide Emission for China's Cities: Empirical Analysis Based on Extended STIRPAT Model. Chin. Popul. Resour. Environ. 28 (10), 45–54. doi:10.12062/cpre.20180729
Development Research Center of the State Council, World Wide Fund for Nature or World Wildlife Fund, (2011). Climate and Energy Impacts of China's Economic Stimulus Plan. Available from: https://webadmin.wwfChina.org/storage/content/press/publication/Stimuluspackagereport_CN.pdf (Accessed January 27, 2011).
Ding, J. (2019). Green Credit Policy, Credit Resources Allocation and Strategic Response of Enterprises. Econ. Rev. 40 (04), 62–75. doi:10.19361/j.er.2019.04.05
Fang, J.-G., and Lin, F.-L. (2019). Research on Regional Differences and Influencing Factors of China’s Green Finance Development. Wuhan Finance 39 (07), 69–74. doi:10.3969/j.issn.1009-3540.2019.07.012
Gu, H.-M., and He, B. (2012). Study on Chinese Financial Development and Carbon Emission: Evidence from China's Provincial Data from 1979 to 2008. Chin. J. Popul. Resour. Environ. 22 (8), 22–27. doi:10.3969/j.issn.1002-2104.2012.08.004
Hayes, A. F. (2009). Beyond Baron and Kenny: Statistical Mediation Analysis in the New MillenniumStatistical Mediation Analysis in the New Millennium. Commun. Monogr. 76 (4), 408–420. doi:10.1080/03637750903310360
He, W.-J., Chen, H.-H., and Wang, Z. (2019). An Empirical Study on the Dynamic Relationship between Green Financial Development and Carbon Emissions——Testing Based on VAR Model. J. Gui-zhou Normal Univ. (Social Sciences) 60 (01), 99–108. doi:10.16614/j.gznuj.skb.2019.01.012
Hm Treasury and Department for Business, Energy & Industrial Strategy, (2019). Green Finance Strategy. Available at: https://www.gov.uk/government/publications/green-finance-strategy (Accessed July 2, 2019).
Houghton Mifflin Company, (2012). The American Heritage Dictionary. Fifth Edition. Bantam: United States of America.
Hu, J.-Y., and Wang, M.-Q. (2018). China’s Financial Development and Carbon Dioxide Emissions—Based on Provincial Panel Data from 1998 to 2015. Shandong Soc. Sci. 32 (4), 118–124. doi:10.14112/j.cnki.37-1053/c.2018.04.017
Huang, X.-X., Yu, D.-M., and Liu, Y.-Q. (2019). Construction and Evaluation of the Maturity Index System of Regional Green Innovation System. Stat. Decis. 35 (21), 45–49. doi:10.13546/j.cnki.tjyjc.2019.21.010
Jalil, A., and Feridun, M. (2011). The Impact of Growth, Energy and Financial Development on the Environment in China: A Cointegration Analysis. Energ. Econ. 33 (2), 284–291. doi:10.1016/j.eneco.2010.10.003
Javeed, S. A., Latief, R., and Lefen, L. (2020). An Analysis of Relationship between Environmental Regulations and Firm Performance with Moderating Effects of Product Market Competition: Empirical Evidence from Pakistan. J. Clean. Prod. 254, 120197. doi:10.1016/j.jclepro.2020.120197
Jiang, H.-L., Wang, W.-D., Wang, L., and Wu, J.-H. (2020). The Effects of the Carbon Emission Reduction of China’s Green Finance——An Analysis Based on Green Credit and Green Venture Investment. Finance Forum 25 (11), 39–48+80. doi:10.16529/j.cnki.11-4613/f.2020.11.006
Katircioğlu, S. T., and Taşpinar, N. (2017). Testing the moderating role of financial development in an environmental Kuznets curve: Empirical evidence from Turkey. Renew. Sust. Energ. Rev. 68, 572–586. doi:10.1016/j.rser.2016.09.127
LeSage, J., and Pace, R. K. (2009). Introduction to Spatial Econometrics. 1st Edn. New York: Chapman and Hall/CRC.
Li, W., Zhao, T., Wang, Y.-N., and Guo, F. (2017). Investigating the Learning Effects of Technological Advancement on CO2 Emissions: A Regional Analysis in China. Nat. Hazards 88, 1211–1227. doi:10.1007/s11069-017-2915-2
Li, Z.-X., Li, L.-Y., and Cheng, J. (2019). Effects of Industrial Structure, Carbon Rights Market and Technological Innovation on Carbon Emission Reduction Efficiency of Various Provinces. Sci. Tech. Manag. Res. 39 (16), 79–90. doi:10.3969/j.issn.1000-7695.2019.16.011
Li, X.-X., and Xia, G. (2014). China Green Finance Report. Beijing: Chinese Finance Publishing House.
Liao, J., Hu, W.-J., and Yang, D.-D. (2019). Dynamic Analysis of the Effect of Green Credit on Bank Operating Efficiency——Based on Panel VAR Model. Collected Essays Finance Econ. 35 (02), 57–64. doi:10.13762/j.cnki.cjlc.2019.02.005
Lin, D.-J., Chen, J.-L., and Qiu, G.-Y. (2018). Research on Green Financial Support Factors of China's Environmental Protection Industry——An Empirical Analysis Based on the Constituent Stocks of the CSI Environmental Protection Industry 50 Index. J. Ind. Technol. Econ. 37 (05), 129–135. doi:10.3969/j.issn.1004-910X.2018.05.017
Mamirkulova1, G., Abbas, J., and Salem, S. (2022). Corridor and tourism sustainability amid unpredictable COVID-19 challenges: Assessing community well-being in the World Heritage Sites. Front. Psychol. 12, 797568. doi:10.3389/fpsyg.2022.797568
Moran, P. A. P. (1948). The interpretation of statistical maps. J. R. Stat. Soc. Ser. B (Methodological) 10 (2), 243–251. doi:10.1111/j.2517-6161.1948.tb00012.x
Mubeen, R., Han, D., Abbas, J., and Hussain, I. (2020). The Effects of Market Competition, Capital Structure, and CEO Duality on Firm Performance: A Mediation Analysis by Incorporating the GMM Model Technique. Sustainability 12 (8), 3480. doi:10.3390/su12083480
Mubeen, R., Han, D., Abbas, J., Álvarez-Otero, S., and Sial, M. S. (2021). The Relationship Between CEO Duality and Business Firms' Performance: The Moderating Role of Firm Size and Corporate Social Responsibility. Front. Psychol. 12, 669715. doi:10.3389/fpsyg.2021.669715
National Bureau of Statistics of China (2007-2020). China Statistical Yearbook. Available from: http://www.stats.gov.cn/tjsj/ndsj/.
Niu, H.-P., Zhang, X.-Y., and Zhang, P.-D. (2020). Institutional Change and Effect Evaluation of Green Finance Policy in China: Evidence from Green Credit Policy. Manag. Rev. 32 (08), 3–12. doi:10.14120/j.cnki.cn11-5057/f.2020.08.001
People's Bank of China, (2016). Guiding Opinions on Building a Green Financial System. Acce-ssed Available from: http://www.pbc.gov.cn/goutongjiaoliu/113456/113469/3131684/index.html August 31, 2016).
Qian, L., and Lű, Q. (2020). Research on Coordinated Development of Green Finance, Economic Society and Ecological Environment in the Yangtze River Economic Belt. J. China Univ. Petroleum( Edition Soc. Sciences) 36 (05), 40–45. doi:10.13216/j.cnki.Upcjess.2020.05.0006
Qiao, Q., Fan, J., Sun, Y., and Song, Q.-H. (2021). Research on the Measurement and Influencing Factors of Green Finance in the Provinces Along “the Belt and Road” in China. J. Ind. Technol. Econ. 40 (07), 120–126. doi:10.3969/j.issn.1004-910X.2021.07.015
Qu, J.-H., Wang, L., Jiang, H.-L., and Wu, J.-H. (2019). An Empirical Study on Green Credit Promotes Green Economy Development——Based on the Yangtze River Economic Belt. Mod. Business Trade Industry 40 (33), 29–31. doi:10.19311/j.cnki.1672-3198.2019.33.01
Raza Abbasi, K., Hussain, K., Abbas, J., Fatai Adedoyin, F., Ahmed Shaikh, P., Yousaf, H., et al. (2021). Analyzing the role of industrial sector's electricity consumption, prices, and GDP: A modified empirical evidence from Pakistan. AIMS Energy 9 (1), 29–49. doi:10.3934/energy.2021003
Saeed Meo, M., and Karim, M. Z. A. (2022). The Role of Green Finance in Reducing CO2 Emissions: An Empirical Analysis. Borsa Istanbul Rev. 22, 169–178. doi:10.1016/j.bir.2021.03.002
Shahbaz, M., Solarin, S. A., Mahmood, H., and Arouri, M. (2013). Does financial development reduce CO2 emissions in Malaysian economy? A time series analysis. Econ. Model. 35(1), 145–152. doi:10.1016/j.econmod.2013.06.037
Shao, X.-F., and Fang, T.-S. (2021). Analysis on the Coupling Effect Between Regional Green Finance and Industrial Structure——Based on New Institutional Economics. J. Ind. Technol. Econ. 40 (01), 120–127. doi:10.3969/j.issn.1004-910X.2021.01.014
Su, R.-G., Zhao, X.-L., and Chen, H. (2019). Analysis of the Mechanism and Path of Green Finance in Supporting the Development of Green Industries. Finance Account. Monthly 40 (11), 153–158. doi:10.19641/j.cnki.42-1290/f.2019.11.023
Sun, L.-W., Li, Y.-F., and Ren, X.-W. (2020). Upgrading Industrial Structure, Technological Innovation and Carbon Emission: A Moderated Mediation Model. J. Technol. Econ. 39 (6), 1–9. doi:10.3969/j.issn.1002-980X.2020.06.001
The White House, (2021). Executive Summary:U.S.International Climate Finance Plan. Available from: https://www.whitehouse.gov/briefing-room/statements-releases/2021/04/22/executive-summary-u-s-international-climate-finance-plan/ (Accessed April 22, 2019).
Tien, C. L., Chen, C. N., and Chuang, C. M. (2013). A Study of CEO Power, Pay Structure, and Firm Performance. J. Manag. Organ. 19, 424–453. doi:10.1017/jmo.2013.30
Tobler, W. R. (1970). A Computer Movie Simulating Urban Growth in the Detroit Region. Econ. Geogr. 46 (1), 234–240. doi:10.2307/143141
UNEP, (2015). Green Financing in Asia and the Pacific. Available from: https://www.unep.org/regions/asia-and-pacific/regional-initiatives/supporting-resource-efficiency/green-financing AccessedJanuary 20, 2015).
Wang, F., Wang, G., Liu, J., and Chen, H.-T. (2019a). How Does Urbanization Affect Carbon Emission Intensity Under a Hierarchical Nesting Structure? Empirical Research on the China Yangtze River Delta Urban Agglomeration. Environ. Sci. Pollut. Res. 26, 31770–31785. doi:10.1007/s11356-019-06361-x
Wang, K.-S., Sun, X.-R., and Wang, F.-R. (2019b). Green Finance, Financing Constrains and the Investment of Polluting Enterprise. Contemp. Econ. Manag. 41 (12), 83–96. doi:10.13253/j.cnki.ddjjgl.2019.12.011
Wu, S.-S. (2018). How Does Bank Credit Affect Carbon Emissions?——Research Based on Growth Model and Chinese Experience. J. Zhongnan Univ. Econ. L. 61 (6), 22–32+43. doi:10.19639/j.cnki.issn1003-5230.2018.0077
Xie, T.-T., and Liu, J.-H. (2019). How does green credit affect China's green economy growth? Chin. J. Popul. Resour. Environ. 29 (9), 83–90. doi:10.12062/cpre.20190501
Xu, G.-Y., and Song, D.-Y. (2011). An Empirical Study on the Environmental Kuznets Curve for China's Carbon Emissions—Based on Provincial Panel Data. Chin. J. Popul. Resour. Environ. 9 (3), 66–76. doi:10.1080/10042857.2011.10685040
Xu, K., and Zhang, Y.-F. (2021). Can green technology innovation bring "lucid waters and lush mountains"?——a study based on the perspective of green patent. Chin. J. Popul. Resour. Environ. 31 (5), 141–151. doi:10.12062/cpre.20201018
Yan, C.-L., Li, T., and Lan, W. (2016). Financial Development, Innovation and Carbon Emission. J. Financial Res. 39 (1), 14–30.
Yang, K.-J., and Yang, T.-T. (2018). Aging, Industrial Structure and Carbon Emissions——Based on Dual Perspectives of Independent Action and Joint Action. J. Indust. Technol. Econ. 37 (12), 115–123. doi:10.3969/j.issn.1004-910X.2018.12.015
Yang, Y., and Wang, G.-S. (2017). Measurement of Green Finance Development Level——Taking Shanghai as an Example. Hainan Finance (04), 20–26. doi:10.3969/j.issn.1003-9031.2017.04.03
Yi, G. (2020). Develop green Finance to Promote Low-Carbon Development. Available from: http://www.pbc.gov.cn/goutongjiaoliu/113456/113469/4141550/index.html (Accessed December 09, 2020).
Yin, Z.-B., Sun, X.-Q., and Xin, M.-Y. (2021). Research on the Impact of Green Finance Development on Green Total Factor Productivity. Stat. Decis. 37 (03), 139–144. doi:10.13546/j.cnki.tjyjc.2021.03.030
Yuan, B.-L., Ren, S.-G., and Chen, X.-H. (2015). The effects of urbanization, consumption ratio and consumption structure on residential indirect CO2 emissions in China: A regional comparative analysis. Appl. Energ. 140, 94–106. doi:10.1016/j.apenergy.2014.11.047
Yuan, H.-X., Liu, Y.-B., Hu, S.-L., and Feng, Y.-D. (2019). Does Industrial Agglomeration Aggravate Environmental Pollution: From A Perspective of Foreign Direct Investment. Resour. Environ. Yangtze Basin 28 (04), 794–804. doi:10.11870/cjlyzyyhj201904006
Zeng, X.-W., Liu, Y.-Q., Man, M.-J., and Sheng, Q.-L. (2014). Measurement Analysis of the Development Level of China's Green Finance. J. China Executive Leadersh. Acad. Yan'an 7 (06), 112–121+105. doi:10.3969/j.issn.1674-0351.2014.06.013
Zeng, S., Li, X.-Y., and Qu, Y.-W. (2021). Research on the Evaluation of Green Finance Efficiency in the Yangtze River Economic Zone. Rural Finance Res. 42 (06), 29–39. doi:10.16127/j.cnki.issn1003-1812.2021.06.005
Zhang, D. F. (2021). It Is Urgent to Speed up the Construction of a green Energy Security System in the Yangtze River Economic Belt. Available from: https://baijiahao.baidu.com/s?id=1693537364274040948&wfr=spider&for=pc Accessed March 07, 2021).
Zhang, L.-L., Xiao, L.-M., and Gao, J.-F. (2018). Measurement and Comparison of Green Financial Development Level and Efficiency in China: Based on Data of 1040 Public Companies. Forum Sci. Tech. China 34 (09), 100–112+120. doi:10.13580/j.cnki.fstc.2018.09.017
Zhao, J., and Liu, C.-Y. (2020). Do green finance policies promote low-carbon development? ——Taking the key provinces of China along the "Belt and Road" as an example. J. Finance Econ. 41 (05), 45–52. doi:10.19622/j.cnki.cn36-1005/f.2020.05.006
Zhou, W.-Q., and Zhu, Y.-N. (2018). The Effect of Financial Development on Green Total Factor Productivity Growth in the Yangtze River Economic Belt. J. Marco-quality Res. 6 (03), 74–89. doi:10.13948/j.cnki.hgzlyj.2018.9.006
Zhou, Y.-Y., Draghici, A., Abbas, J., Mubeen, R., Boatca, M. E., and Salam, M. A. (2022). Social Media Efficacy in Crisis Management: Effectiveness of Non-pharmaceutical Interventions to Manage COVID-19 Challenges. Front. Psychiatry 12, 626134. doi:10.3389/fpsyt.2021.6210.3389/fpsyt.2021.626134
Keywords: carbon emission, green finance, mediation effect, spatial spillover effect, the Yangtze River Economic Belt, spatial Durbin model
Citation: Guo C-Q, Wang X, Cao D-D and Hou Y-G (2022) The Impact of Green Finance on Carbon Emission--Analysis Based on Mediation Effect and Spatial Effect. Front. Environ. Sci. 10:844988. doi: 10.3389/fenvs.2022.844988
Received: 29 December 2021; Accepted: 24 February 2022;
Published: 31 March 2022.
Edited by:
Faik Bilgili, Erciyes University, TurkeyReviewed by:
Liang Yuan, China Three Gorges University, ChinaSiyu Ren, Nankai University, China
J. Abbas, Shanghai Jiao Tong University, China
Copyright © 2022 Guo, Wang, Cao and Hou. This is an open-access article distributed under the terms of the Creative Commons Attribution License (CC BY). The use, distribution or reproduction in other forums is permitted, provided the original author(s) and the copyright owner(s) are credited and that the original publication in this journal is cited, in accordance with accepted academic practice. No use, distribution or reproduction is permitted which does not comply with these terms.
*Correspondence: Xin Wang, MTgyMTUxMjQ3MTdAMTYzLmNvbQ==