 Cheng-Yu Han1
- 1School of Human Settlements and Civil Engineering, Xi’an Jiaotong University, Xi’an, China
- 2College of Health and Human Services, George Mason University, Fairfax, VA, United States
The degree of industrial agglomeration in China has contributed to the reduction of nitrogen dioxide pollution because of financial support, the allocation of environmental governance efficiency, and technological advantages. However, the intensity and scope of the spatial effect of this contribution needs to be studied in depth. Based on the influence mechanism and intermediate mechanism of the spatial pattern, this paper uses the panel data of 282 prefecture-level and above cities in China from 2015 to 2018, draws on the STIRPAT model, and uses the Spatial Panel Durbin and Panel Threshold models to investigate the effects of industrial agglomeration on nitrogen dioxide. The study finds that 1) industrial agglomeration has a significant spatial spillover effect on the reduction of nitrogen dioxide pollution, and the increase in the level of local industrial agglomeration can greatly reduce the concentration of nitrogen dioxide in the surrounding area. 2) This kind of spatial overflow has a threshold boundary. Within 100 km, it is a dense area of overflow and reaches the threshold boundary beyond 150 km. 3) Under the influence of the three intermediate mechanisms of industrial agglomeration, the increase in car ownership, and the level of economic development, the impact of industrial agglomeration on the reduction of nitrogen dioxide pollution has gradually increased. The above conclusion is still valid after various robustness tests.
Introduction
In recent years, the contradiction between economic construction and environmental protection has become more and more intense (Zhao et al., 2021). Industrial activities in economic growth have brought great pollution to the atmosphere, such as automobile exhaust, coal and other fuel combustion gases, and a large number of industrial exhaust gases (Chen et al., 2021). In 2013, China launched a provincial-level climate change plan to ensure the effective implementation of the national climate change plan. The average concentration of air pollutants in major Chinese cities from 2004 to 2017 is shown in Figure 1. The data was obtained from the China City Statistical Yearbook. Since 2013, the concentrations of sulfur dioxide, PM10, and PM2.5 have all shown a downward trend, which proves that China’s implementation of energy-saving and emission-reduction policies has effectively alleviated part of the air environmental pressure, but the concentration of urban nitrogen dioxide has not decreased. After 2015, it also showed an upward trend. Although China’s methods and policies to control air pollutants, such as sulfur dioxide and PM2.5, have become increasingly mature, the concentration of nitrogen dioxide cannot be effectively controlled. Long-term living in an environment with high nitrogen dioxide concentration will also greatly affect human lung function and the respiratory system, severely irritating the upper respiratory tract, causing shock, shortness of breath, asthma, and other symptoms (Ding et al., 2017; Lu et al., 2020). Hossain et al. (2021) verifies that lower nitrogen dioxide concentration could offset the short-term health hazards of higher ozone. As the core element of the modern economy, industrial agglomeration plays an important role in reducing China’s nitrogen dioxide pollution by virtue of its high efficiency and clean characteristics. Investigating the spatial effect of industrial agglomeration on reducing the concentration of nitrogen dioxide and its spatial attenuation boundary and exploring the influence of some of the intermediate mechanisms have important theoretical and policy implications for China’s current nitrogen dioxide pollution.
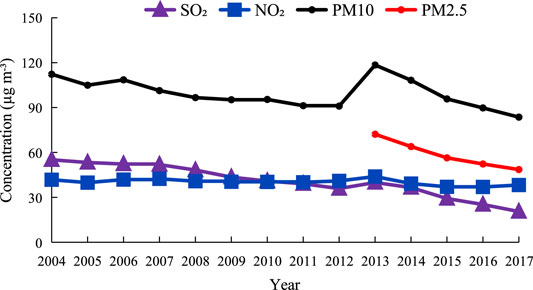
FIGURE 1. The average concentration of major air pollutants in China’s key cities in 2004–2017. The data are from the China City Statistical Yearbook (https://www.yearbookchina.com).
At present, China is using its own economic development to drive global ecological and environmental governance work, strengthening cooperation and innovation in environmental pollution treatment technology among countries, striving to build a community of a human ecological environment, advocating the development of green and energy-saving industries (Xie et al., 2021). However, some researchers believe that, when analyzing the impact of economic growth on environmental pressure, the spatial effects of pollutants are ignored, leading to deviations in estimates (Zhang et al., 2014; Meng et al., 2016; Shi et al., 2016; Zeng et al., 2017). Dinda (2005) mentions that, if the spatial effects of pollutants are not considered when analyzing the air pollution emissions effect, it will reduce the accuracy of the analysis results. If the inter-provincial scale is too large, the internal problems are also quite different, and the spatial effect of air pollution is difficult to accurately determine. Xie et al. (2019) adds a spatial autoregressive model to analyze the relationship between China’s PM2.5 and economic growth, and the results show that the problem of haze pollution is more accurately analyzed on the time and space scale.
The Spatial Durbin Model (SDM) can effectively analyze and study the spatial pattern effect between development and the environment. Li and Li (2020) show that regional economic growth inhibits carbon emissions in neighboring provinces through indirect effects. Jiang et al. (2019) point out that there is a significant spatial autocorrelation between urban energy consumption and air pollution. The increase in the economic output of surrounding cities brings economic radiation and promotes urban economic output, which provides strong evidence for the necessity of joint prevention and control policies. Lv et al. (2019) examine the direct impact of urbanization on energy consumption, its overall impact, and its spatial spillover effects and formulate energy policies by considering nearby sectoral consumption and urbanization. However, spatial geography is not the only factor contributing to environmental effects. In fact, frequent economic activities can generate closer bilateral linkages, which not only have an impact on the location, but also have a radiating effect on the surrounding area. Therefore, spatial effects should include economic factors to accurately describe the globality and complexity of spatial effects.
When investigating the impact of financial agglomeration on the efficiency of green development by setting the inverse distance matrix with different distance thresholds, it is found that financial agglomeration has a geographical distance attenuation impact on the green development efficiency of surrounding areas (Yuan et al., 2019). Inspired by the research direction of this article, does industrial agglomeration have geographic distance restrictions on the reduction of nitrogen dioxide in neighboring areas? Hong et al. (2020) reveal the spatial pattern effect of industrial agglomeration and environmental pollution. Some scholars study the impact of industrial agglomeration on ecological efficiency and propose an inflection point effect (Chen et al., 2020). When the agglomeration level exceeds the inflection point, pollution reduction and pollution can be produced. Based on green development effects, none of the above studies discuss the threshold boundary of the spatial effects of industrial agglomeration on the environment.
At the same time, regarding the nonlinear relationship between industrial agglomeration and nitrogen dioxide concentration, considering that there may be some intermediate mechanism effects on the relationship, it has a certain impact on the relationship between the two (Hansen, 1999). Based on the analysis of the spatial model, this paper introduces the panel threshold model PTR. Based on this model, it can be used to analyze the threshold value of the intermediate mechanism and give specific policy recommendations more effectively. Three thresholds were proposed when analyzing the effectiveness of marine patents in reducing marine pollution (Shao, 2020). Song (2021) analyzes economic growth and carbon emissions and calculates the panel thresholds of various development indicators in the process of China’s transformation. In the early stage of industrial agglomeration, pollution emissions were increased, which was manifested as a crowding effect, but when it developed to a certain extent beyond the threshold value, it was mainly manifested as an aggregation effect. Therefore, we must fully understand the importance of accelerating industrial agglomeration and promote the rational allocation of factors and the intensive use of resources.
This article contributes to the literature from three aspects. First, this article provides a wealth of empirical evidence for how to use industrial agglomeration to reduce nitrogen dioxide in neighboring areas. Second, from a methodological point of view, the STIRPAT model is expanded spatially by using SDM, and by setting a matrix of multiple geographic distance thresholds, it examines the geographic distance limit of industrial agglomeration to reduce nitrogen dioxide pollution in adjacent areas. Third, this paper calculates and analyzes the threshold number and specific values of some intermediate mechanism indicators through the panel threshold model and more fine-grained use of how these specific numerical changes affect the relationship between industrial agglomeration and nitrogen dioxide pollution. This article supplements the specific relationship between China’s industrial development and the spatial pattern of nitrogen dioxide pollution and fills this gap.
Research Methods
Nomenclature list: NO2, Nitrogen dioxide concentration; IA, Industrial agglomeration; A, Per capita GDP; P, Population; T, Technological level- Energy consumption per unit of GDP; EL, Economic development level-Total GDP; INV, Growth rate of vehicle ownership.
Model Selection
This paper uses the traditional IPAT model of stochastically extended STIRPAT as the basic theory and analysis framework (Dietz and Rosa 1997). This model is of great help to the study of the relationship between economic development and environmental pollution. Based on the original consideration of the effects of population factors, wealth, and technological level on urban nitrogen dioxide concentration changes, industrial agglomeration factors are added to observe the influence of industrial agglomeration on nitrogen dioxide concentration. The model expression is
Among all the representative subscripts, the subscripts i and t, respectively, represent the city and year; a is the model coefficient; I is the explained variable environmental pressure; IA is the core analysis variable of this article; P, A, T, respectively, represent the impact of population, wealth, and technological level on the environment influences. It is a random disturbance item.
Anselin (1988) believes that economic units do not exist alone, but are connected through various factors and have spatial influence with neighboring economic units, showing the characteristics of spatial overflow. The industrial agglomeration variables on which this article focuses have strong spatial externalities. Therefore, spatial effects must be introduced for observation when analyzing the relationship between industrial agglomeration and urban nitrogen dioxide concentration just as Yuan et al. (2019) verifies the relationship between financial agglomeration and green development efficiency. Li et al. (2021) introduces the spatial durbin that contains the spatial lag of both the dependent and independent variables when studying the impact of industrial agglomeration on smog. The model takes into account the spatial effects of explanatory variables and explains variables at the same time. Therefore, this paper is based on the STIRPAT model, adding the SDM to expand it and using the panel SDM to analyze the relationship between urban industrial agglomeration and urban nitrogen dioxide concentration in China. Wang et al. (2021) and Wu et al. (2022) use the same model integration method to analyze the impact of environmental pollution and green finance on the high-quality development of energy and the impact of industrial agglomeration on new urbanization. The model expression is
Among them, the subscripts i and j represent cities, and t represents the year; β1, β2, β3, β4, respectively, represent the regression coefficients of industrial agglomeration, population factors, wealth, and technological level; the total number of cities analyzed in this paper is 282, and W is a spatial weight matrix of order 282X282;
Observing Figure 2 shows that there is no obvious linear relationship between the concentration of nitrogen dioxide and the degree of industrial agglomeration, but when the degree of industrial agglomeration is greater than the range of 0.9, the scatter diagram of the concentration of nitrogen dioxide and the degree of industrial agglomeration becomes no longer discrete. Nitrogen concentration generally rises, and there is an obvious gathering phenomenon. The conjecture may be because some cities with high industrial agglomeration have some other intermediate mechanism indicators, and there are different degrees of constraints on the concentration of nitrogen dioxide. Therefore, this paper adopts the panel threshold model (PTR) proposed by Hansen (1999) to investigate industrially the characteristics of the threshold effect of agglomeration on the concentration of nitrogen dioxide in the city; this model is very helpful for analyzing and improving the influence of the intermediate mechanism on the investigated variables. The panel threshold model is as follows:
Among them,
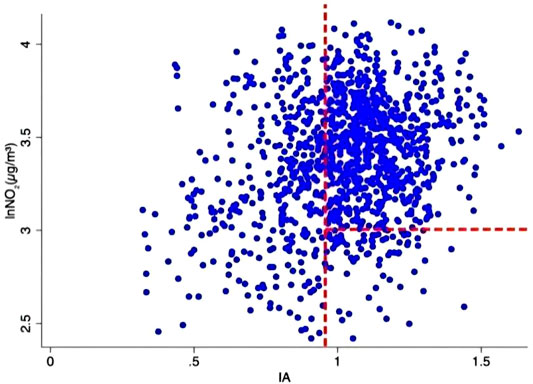
FIGURE 2. Scatter diagram of nitrogen dioxide concentration and industrial agglomeration.
Variable Selection and Data Sources
Explained variable: Nitrogen dioxide concentration (I): The nitrogen dioxide concentration data for 282 cities from 2015 to 2018 were obtained from historical data from China Environmental Monitoring Center (CNEMC). Since CNEMC’s historical data is recorded by the daily nitrogen dioxide concentration of each city, we downloaded the data and calculated the annual average nitrogen dioxide concentration of each city in the excel software.
Explanatory variable: Industrial agglomeration (IA): There are many methods to capture the degree of agglomeration of indicators. The space Gini coefficient and Ellison–Glaeser index are often used to capture the industry cluster of various industries in a region (Sueyoshi et al., 2021). In this paper, the location entropy model is used to calculate the degree of industrial agglomeration. It can more effectively analyze the degree of agglomeration of an indicator in different regions. Many studies also choose this method to calculate the degree of industrial agglomeration (Zeng and Zhao, 2009; Zheng and Lin, 2018; Li et al., 2020). The specific calculation method is
Among them,
Threshold variables (an intermediate mechanism): This article has a total of three threshold variables (
Control variables: The three inherent variables in the IPAT model select the total population of the city at the end of the year to represent the population factor (P); use per capita GDP to measure the degree of wealth (A); and use the ratio of the city’s total annual electricity consumption to the annual regional GDP, that is, energy consumption per unit of GDP to measure the level of science and technology (T).
Spatial weight matrix: This paper uses latitude and longitude to calculate the reciprocal of the centroid distance between two cities to characterize the spatial dependence between cities. Compared with the adjacent space weight matrix, the explanatory power of the inverse distance space weight matrix does not decrease as the sample size increases. The spatial weight matrix is a matrix that reflects the interdependence of indicators in space, and is used in research in different fields (Hui et al., 2007; Pasaribu et al., 2021).
The calculation formula is
where
The research sample is the balanced panel data of 282 cities at the level of China and above from 2015 to 2018. Except for the nitrogen dioxide concentration data from CNEMC, the rest of the data are from the China City Statistical Yearbook, and individual missing data are filled by interpolation. To reduce heteroscedasticity, this paper also reciprocates some data. Table 1 shows descriptive statistics.
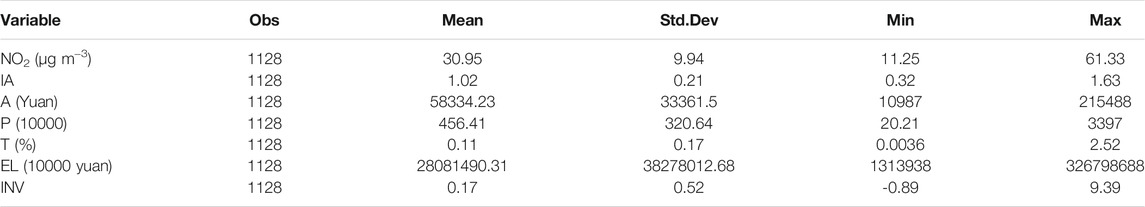
TABLE 1. Descriptive statistical results of each variable.
Empirical Analysis
Preliminary Statistical Observation
Table 1 shows that there are great regional differences in China’s per capita GDP with the maximum and minimum values being 215,488 and 10,987, respectively. The city with the highest concentration of nitrogen dioxide is more than six times higher than the city with the lowest. The energy consumption per unit of GDP of different cities in China is uneven. The average growth rate of car ownership in each city reached 17%. Figure 3 depicts the spatial distribution of nitrogen dioxide concentration and changes in industrial agglomeration in the surveyed cities in 2015 and 2018. The results show that the concentration of nitrogen dioxide did not decrease significantly from 2015 to 2018. The concentration of nitrogen dioxide in the central and eastern cities is higher than that in other regions, showing an obvious spatial agglomeration pattern. Some cities located in the Beijing–Tianjin–Hebei region, the border of Shaanxi and Mongolia, and the middle and lower reaches of the Yangtze River are more polluted by nitrogen dioxide. This is closely related to the large number of heavy industrial cities in this region, such as Yan’an, Cangzhou, and Tangshan. Some scholars also show that the aggregation of elements in the urban agglomeration in the Beijing–Tianjin–Hebei region have an impact on the regional environment, but these influencing factors include population, industry, investment, and other aspects (Liu et al., 2019). However, some areas have low nitrogen dioxide pollution but high income levels, such as some southern coastal cities, such as Fuzhou and Putian, and some cities in Inner Mongolia, such as Wuhai and Ordos. Therefore, it can be inferred that industrial agglomeration is not a single indicator of changes in nitrogen dioxide concentration. Factors such as development patterns and car ownership have mixed and complex effects. From the perspective of spatial distribution, the level of industrial agglomeration in Chinese cities has not changed significantly in the 4-year cycle. However, the Beijing–Tianjin wing, the border of Mongolia and Shaanxi, Jiangsu and Zhejiang have obvious industrial agglomeration, and the two regions in 2018 compared with 2015, in the area of more than 60 μg m−³, has indeed decreased in nitrogen concentration, which is consistent with the conjecture that industrial agglomeration can speed up the management of nitrogen dioxide concentration. The spatial pattern of industrial agglomeration and nitrogen dioxide pollution is obviously similar, and the concentration of nitrogen dioxide in nonindustrial agglomeration areas is generally low. It is judged that there may be a spatial connection between industrial agglomeration and nitrogen dioxide pollution.
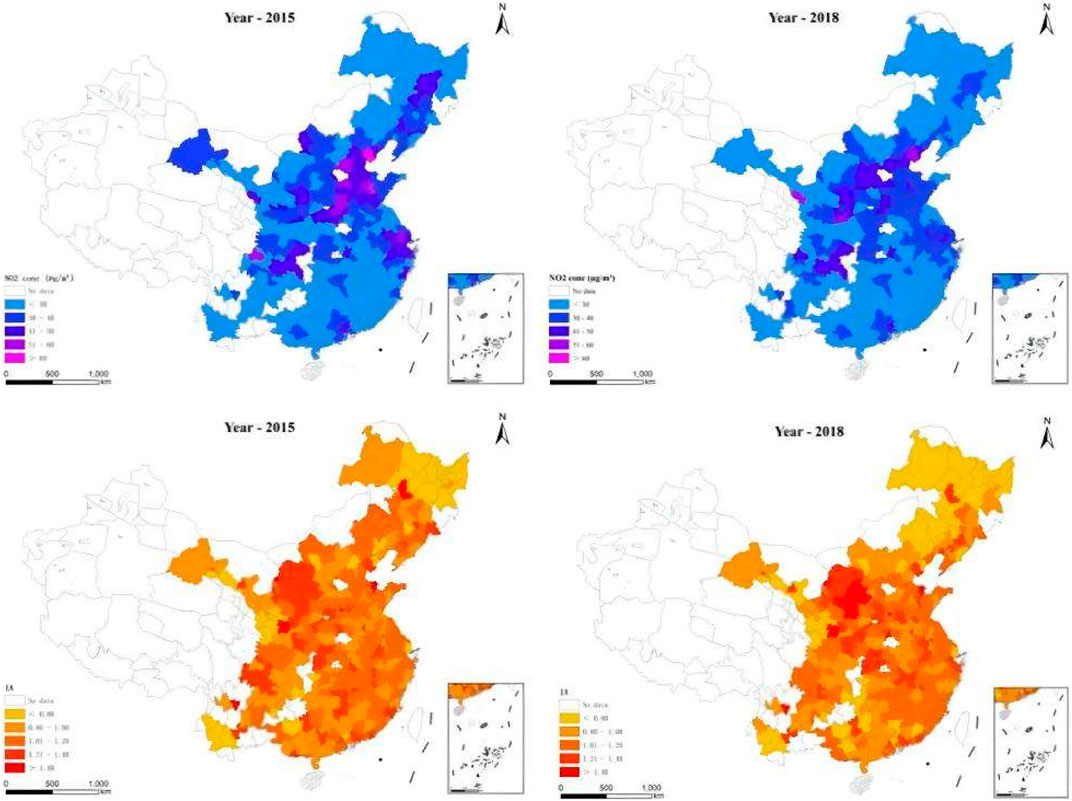
FIGURE 3. Spatial distribution of industrial agglomeration level and nitrogen dioxide concentration in Chinese cities in 2015 and 2018.
Spatial Spillover of Nitrogen Dioxide Pollution by Industrial Agglomeration
According to theoretical analysis and preliminary judgments on the spatial pattern of data, there is a significant spatial dependence between industrial agglomeration and nitrogen dioxide pollution, and this spatial dependence has a certain relationship with regional concentration and changes with distance. Therefore, this paper uses the spatial panel durbin model to test the hypothesis. Before the spatial measurement analysis, the model needs to be tested with the traditional panel model, and the correctness of the spatial panel durbin model is determined through the LM and LR tests. Table 2 shows the test results of the panel model. Through LM and LM (Robust) tests, it is found that the spatial error model (SEM) can test the spatial spillover effect of industrial agglomeration on nitrogen dioxide pollution. On the other hand, the spatial lag model (SAR) does not reject the null hypothesis. When studying SO2 and soot particle samples in China, Poon et al. (2006) point out that there are significant spatial effects for the SEM and SAR models. In view of this, this article further uses the LR test screening model. The results show that the LR test rejects the hypothesis that the SDM can be reduced to spatial lag and spatial error models, indicating that, if the spatial lag or spatial error model is used solely to investigate the industry, there may be errors in the spatial overflow of agglomeration. To sum up, this paper chooses the spatial panel durbin model under the time fixed effect to analyze the spatial spillover effect and attenuation boundary of industrial agglomeration and nitrogen dioxide pollution.
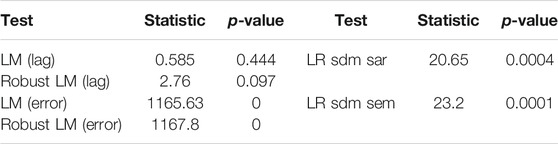
TABLE 2. Spatial panel model test results.
The analysis results in the third column of Table 3 show that the direct effect of industrial agglomeration has an impact coefficient of 0.154 on the concentration of nitrogen dioxide, which has passed the 1% significance test; that is, the increase in the level of industrial agglomeration in the region increases local nitrogen dioxide pollution. The industrial agglomeration coefficient under the indirect effect is −0.723, which also passes the 1% significance test; that is, the increase in the level of industrial agglomeration in this region helps reduce the concentration of nitrogen dioxide in neighboring areas. By comparing the regression data, it can be seen that the inter-regional spillover of nitrogen dioxide concentration by industrial agglomeration is significantly stronger than the intra-regional impact, which shows that industrial agglomeration does have spatial spillovers on nitrogen dioxide concentration, which provides data for the proposed hypothesis. Xu et al. (2020) show that air pollution in urban agglomerations is caused by both human and natural factors, and air pollution in various regions also has obvious spatial correlation and spillover effects. The fourth, fifth, and sixth columns in the table are explained below.
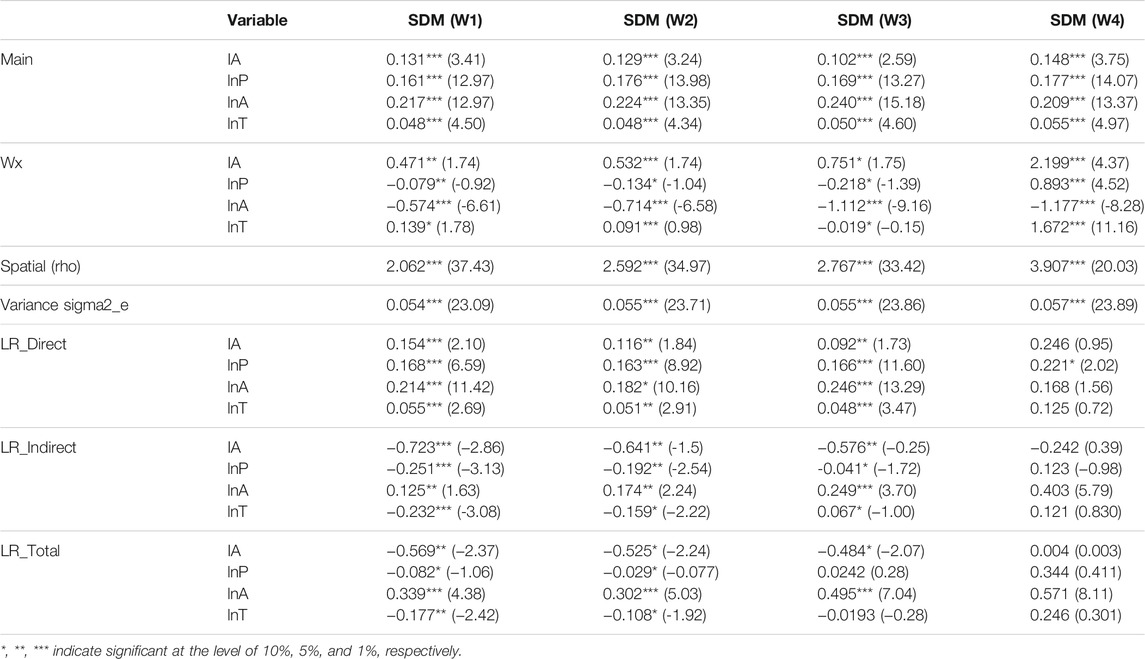
TABLE 3. Estimation results of spatial durbin model.
The situation that industrial agglomeration has a spatial spillover effect can be explained as the development process of each city is different, and the main industries on which it relies are also different. Different levels of science and technology also see obvious differences in productivity and environmental governance capabilities. However, due to objective reasons, such as productivity, natural resource conditions, and the dominance of industrial development, each city has caused uneven levels of industrial agglomeration. The environmental pollution brought about by industrial development is inevitable. Many cities with small industrial scales have a large gap in their ability to control environmental pollution compared with core industrial areas. This has resulted in much higher pollution caused by industrial development in small cities. The core areas of China’s industrial development are mostly combined areas of cities with rapid development, such as the Beijing–Tianjin wing and the Jiangsu, Zhejiang, and Shanghai areas. These cities have strong pollution control capabilities and have realized the development model of industrial agglomeration, merger, and unified pollution control. In this way, the cost of governance per unit of industrial energy consumption is further reduced, and the efficiency is further improved. Therefore, the development model of industrial agglomeration has become a policy requirement before the problem of environmental pressure. The core area of industrial agglomeration has a more complete production, governance model chain, wider service range, and more sophisticated technology. These advantages will continue to absorb the surrounding industrial resources, help the surrounding areas save higher unit costs of environmental governance and gradually transform into a regional industrial center or even a national industrial center. The industrial center will then serve the surrounding area through the diffusion effect, thereby generating spatial overflow and helping the adjacent area reduce nitrogen dioxide and other pollutants.
The Spatial Attenuation Boundary of Industrial Agglomeration to Reduce Nitrogen Dioxide Pollution
The first part confirms that industrial agglomeration has a spatial spillover effect on reducing nitrogen dioxide pollution. This study further uses the established SDM to investigate the spatial attenuation boundary of this industrial agglomeration to reduce nitrogen dioxide pollution. In general, the spatial correlation gradually decreases with the increase of the regional distance until there is no correlation, so the second part will try to confirm this conjecture and find the distance boundary of this spatial overflow. Refer to the document processing method of Yuan et al. (2019), artificially set the distance threshold from low to high, assuming that the distance between city i and city j is higher than this set threshold, then it is; otherwise, it is 0. The calculation method is
The function of the threshold is to verify whether the spatial correlation coefficient gradually decays when the distance between the spatial units participating in the spatial regression gradually expands. In Table 3, the W1 matrix is the initial matrix without a distance threshold, the threshold of the W2 matrix is set to 50 km, the threshold of the W3 matrix is set to 100 km, and the threshold of W4 is 150 km. Perform multiple regressions through the established model to record the direct and indirect effect coefficients of the industrial agglomeration level on reducing the concentration of nitrogen dioxide.
The regression results in Table 3 show that the spatial spillover coefficient is significant within 100 km and basically passes the 1% significance level test. After more than 100–150 km, the spatial spillover coefficient is no longer significant, which confirms that the industrial agglomeration has a twofold reduction. The spatial spillover of nitrogen oxide concentration conforms to the law of geographic attenuation. Specifically, the spatial spillover coefficient of industrial agglomeration can be divided into two intervals:
1) When the distance threshold is within 100 km, the industrial agglomeration has significant help in reducing the concentration of nitrogen dioxide in the adjacent area, and the coefficients are −0.723, −0.641, and −0.576. The spillover effect is stronger than the local influence, and the closer the distance, the higher the degree of help.
2) If the distance threshold is 150 km away, this kind of help is no longer significant. Starting from the analysis method, due to the substantial reduction of the spatial units in the weighted space matrix, the spatial spillover coefficient exhibits extremely strong random volatility and cannot pass the significance test, which means that industrial agglomeration can help reduce the concentration of nitrogen dioxide at 150. The boundary has been reached beyond the kilometer threshold. Judging from China’s current development model, China is still in the developing stage. Many Tier 3, 4, and 5 cities have entered industrial development within a short period of time and have not formed a relatively merged development model with neighboring industrial clusters. The development and governance environment is better. Much depends on the new cities themselves, and the level of industrial agglomeration in China is still in a relatively discrete stage.
It can also be seen from Figure 3 that most of China’s provinces usually only have one to two cities with high agglomeration levels, which further explains that around 150 km is the distance threshold attenuation boundary for spatial spillover correlation. Yuan et al. (2019) point out that financial agglomeration has obvious spatial spillover effect on green development efficiency, the threshold boundary is around 300 km, and this spatial spillover shows obvious spatial attenuation characteristics, similar to the results of this study. At present, there are no other national industrial agglomeration centers in China except Beijing, Tianjin, and Hebei; the junction of Inner Mongolia and Shaanxi; and Jiangsu, Zhejiang, and Shanghai, whereas there are more regional industrial agglomeration centers in the province, so the theme is short-distance travel to provincial capital cities and provinces. The overflow of the second industrial agglomeration center helps reduce nitrogen dioxide pollution in neighboring, relatively backward cities.
Analysis of the Intermediate Mechanism of Industrial Agglomeration on Reducing the Nonlinear Impact of Nitrogen Dioxide Pollution
After analyzing the relationship between industrial agglomeration and nitrogen dioxide pollution, this article considers introducing a panel threshold model to test the industrial agglomeration under the constraints of the three threshold variables of industrial agglomeration, economic development level, and increase in urban car ownership. The heterogeneous impact of nitrogen oxide pollution verifies the important reason for the nonlinear relationship between the level of industrial agglomeration and the concentration of nitrogen dioxide. First, determine the threshold number of each threshold variable through the threshold effect test and then calculate and analyze the threshold values of the three intermediate mechanisms. Observing Table 4, we can see that the impact of industrial agglomeration on the concentration of nitrogen dioxide is restricted by the level of industrial agglomeration, the level of economic development, and the increase in the number of urban vehicles. The level of industrial agglomeration shows a single threshold with a threshold value of 1.1667, whereas the level of economic development is less than the growth rate of urban car ownership represented by double thresholds. Figures 4A,B are the double-threshold confidence interval test of the economic development level and the growth rate of car ownership. The threshold values of the economic development level are 2512167 and 18773402, respectively. The threshold values are 0.0875 and 0.1256, respectively.
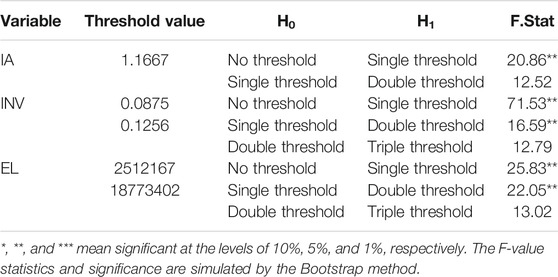
TABLE 4. Threshold effect test.
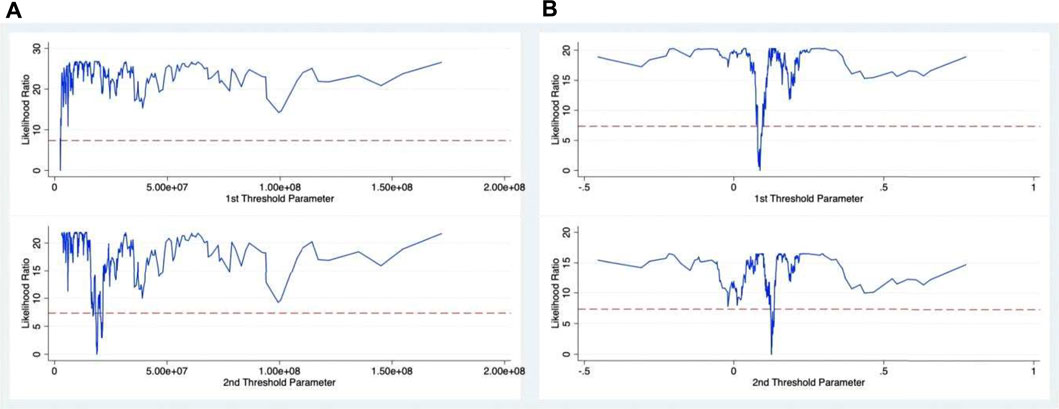
FIGURE 4. Double-threshold confidence interval test for the level of economic development and the increase in car ownership. (A,B) are the doublethreshold confidence interval tests for the level of economic development and the increase in car ownership, respectively. The threshold values of (A) are 2512167 and 18773402, and the (B) are 0.0875 and 0.1256, respectively.
After recording the threshold number and value of each intermediate mechanism, this paper further bases the test results of each threshold on the impact of industrial agglomeration levels on nitrogen dioxide pollution under these three intermediate mechanisms (Table 5).
1) The threshold effect of China’s overall industrial agglomeration level: When the industrial agglomeration level is on the left side of the threshold value of 1.1667, the influence coefficient of industrial agglomeration on the nitrogen dioxide concentration is 0.2039, which is significant at the 5% confidence level, and when the industrial agglomeration level crosses this threshold, the industrial agglomeration has a second the positive effect of nitrogen oxide concentration dropped to 0.1481, which was significant at the 5% confidence level. As of the end of 2018, only 62 of the 282 cities surveyed had crossed this threshold, indicating that China’s overall industrial agglomeration level is still in a relatively discrete state, most of which are high-level regional industrial agglomeration cities in the province.
2) The threshold effect of the increase in car ownership in Chinese cities: The life of the city cannot be separated from the help of cars, and the nitrogen dioxide produced by car exhaust also has a great impact on the environment. The steel manufacturing process in the production of cars also produces a large amount of nitrogen dioxide. When the increase in car ownership is less than 8.75%, the impact of industrial agglomeration on the concentration of nitrogen dioxide is 0.0653, which is significant at the 5% confidence level; when the increase is between 8.75% and 12.56%, the positive impact increases to 0.1092, which is significant at the 5% confidence level. When the increase crosses the 12.56% threshold, the positive impact reaches the highest, which is 0.1463 and is significant at the 5% confidence level. As of 2018, 101 of the cities surveyed were below the 8.75% threshold, accounting for 35.8%. This provides a good idea for cities to reduce nitrogen dioxide pollution. From the second threshold to increase threshold to the first threshold, the concentration coefficient of nitrogen dioxide pollution has been reduced by more than 50%.
3) The threshold effect of economic development level: The level of economic development also has two thresholds. When the level of economic development is lower than 2512167, the impact of industrial agglomeration on the concentration of nitrogen dioxide is 0.3191; when the level of economic development is between 2512167 and 18773402, the impact of industrial agglomeration on the concentration of nitrogen dioxide when the level of economic development is greater than 18773402, the impact of industrial agglomeration on the concentration of nitrogen dioxide is minimized to 0.0305, and the three sets of data are significant at the 5% confidence level. As of 2018, 53.2% of cities have not exceeded the second-tier threshold. When the level of economic development is higher, industrial capital and resources favors these high-efficiency, high-tech core development areas, and the efficiency of reducing environmental pollution also increases, and as the level of economic development increases, the overall environmental awareness of the city increases. Stronger, people’s living and consumption habits will be more environmentally friendly, thereby reducing nitrogen dioxide and other pollution.
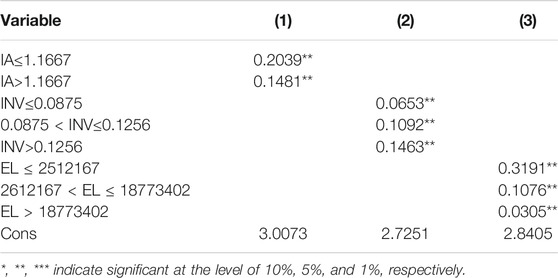
TABLE 5. Benchmark threshold regression.
Conclusion
Industrial agglomeration on nitrogen dioxide pollution has obvious spatial spillover effects, and this spatial spillover exhibits obvious spatial attenuation characteristics. Specifically, within 100 km is a dense area of spatial spillover, and there is no more spatial spillover accidentally within 150 km. Moreover, the inter-regional spillover of nitrogen dioxide pollution by industrial agglomeration is obviously stronger than the intra-regional spillover; that is, the indirect effect is stronger than the direct effect. However, due to spatial distance and regional boundary constraints, the spatial spillover of nitrogen dioxide pollution by industrial agglomeration shows obvious spatial attenuation characteristics. Under the adjustment of the two mechanisms of industrial agglomeration and economic development level, the impact of industrial agglomeration on reducing nitrogen dioxide pollution shows a gradual increase. In the process of intervention in the increased mechanism of car ownership, the industrial agglomeration has the promotion of nitrogen dioxide pollution as a process of gradual increase. When the increase in car ownership is less than 8.75%, the impact of industrial agglomeration on the concentration of nitrogen dioxide is 0.0653; when the increase is between 8.7%5 and 12.56%, the positive impact increases to 0.1092; and when the increase exceeds 12.56%, one threshold, the positive impact reached the highest at 0.1463. As of 2018, only 35.8% of the cities surveyed were below this indicator.
Based on the above two conclusions, the following policy recommendations are put forward. The research results verify that, in most regions of China, the level of industrial agglomeration is very discrete. Emerging cities should form a relatively merged development model with neighboring industrial clusters, outsourcing their relatively backward development links to industrial areas in developed cities, and make full use of the high-level environmental governance capabilities of developed industrial areas to reduce dioxide in neighboring areas. The characteristic of nitrogen pollution reduces the overall unit cost of environmental governance. On a larger scale, cities in northwestern China should gradually move more industrial links to the border area between Shaanxi and Mongolia. Cities in the northeast need to relocate more factories to the core industrial area of the Beijing–Tianjin wing, and in the south, the industrial development of the city should also be transferred to Jiangsu, Zhejiang, and Shanghai regions as soon as possible. This can further optimize the characteristics of the current level of industrial agglomeration in China, from a high level of industrial agglomeration in multiple cities to three national industrial agglomeration areas, so that the unit cost of China’s overall treatment of nitrogen dioxide will be further reduced.
From the conclusion of the intermediate mechanism, it is known that not only the increase in the level of industrial agglomeration can improve the ability to control nitrogen dioxide pollution, but the indicator of economic development is also very important. It represents the development intensity of a city itself, and the level of science and technology will develop with development. The higher the level, the higher. Therefore, in the professional process of industrial development, some developed cities should also simultaneously transfer some of their scientific nitrogen dioxide management technologies to industrial clusters to reduce the cost of governance in industrial core areas. As automobiles are a common source of nitrogen dioxide pollution in life, China should speed up the policy of transforming gasoline vehicles into electric vehicles at this stage. This will not only achieve China’s carbon peak goal earlier but also reduce nitrogen dioxide pollution.
Synthesizing all conclusions, it is predicted that the method of controlling nitrogen dioxide pollution in the future will further improve the agglomeration level of industrial agglomeration areas. The threshold value of industrial agglomeration level may further increase in the future, from 1.1667 to about 1.3, increasing the influence ability and scope of strong industrial agglomeration areas to reduce nitrogen dioxide pollution in surrounding areas. Cities with lower levels of economic development can also save a lot of immature environmental governance costs. At the same time, the annual growth rate of fuel vehicles in more cities will be controlled below 8.75%.
Of course, this research still has many issues worthy of in-depth discussion, such as that some of the neighboring cities examined in this article are too far apart. If these research samples are deleted, will the boundary of geographic attenuation increase? Residents in China use natural gas for heating in winter, and the combustion of natural gas will produce a large number of nitrogen oxides. If this intermediate mechanism index is added, the winter heating months in the sample year data are separately extracted for analysis. Will the impact of industrial agglomeration on nitrogen dioxide pollution be changed? I will conduct in-depth research on the above issues in the later stage.
Data Availability Statement
The data analyzed in this study is subject to the following licenses/restrictions: The data that support the findings of this study are available from (China City Statistical Yearbook and China Environmental Monitoring Center), but restrictions apply to the availability of these data, which were used under license for the current study, and so are not publicly available. Requests to access these datasets should be directed to China City Statistical Yearbook and China Environmental Monitoring Center.
Author Contributions
Conceptualization, C-YH and Z-LG; Methodology, C-YH; Software, HY; Validation, C-YH, Z-LG, and HY; Formal Analysis, HY; Investigation, C-YH; Resources, Z-LG; Data Curation, Z-LG; Writing—Original Draft Preparation, C-YH; Writing—Review and Editing, Z-LG; Visualization, HY; Supervision, Z-LG; Project Administration, Z-LG; Funding Acquisition, Z-LG. All authors have read and agreed to the published version of the manuscript.
Funding
This study was financially supported by the National Natural Science Foundation of China (41861144021, 11872295).
Conflict of Interest
The authors declare that the research was conducted in the absence of any commercial or financial relationships that could be construed as a potential conflict of interest.
Publisher’s Note
All claims expressed in this article are solely those of the authors and do not necessarily represent those of their affiliated organizations, or those of the publisher, the editors and the reviewers. Any product that may be evaluated in this article, or claim that may be made by its manufacturer, is not guaranteed or endorsed by the publisher.
Acknowledgments
We would like to thank the data query assistance provided by Zhang Yang et al., thank Professor Gu Zhaolin for his detailed insights and suggestions, which have substantially improved the research direction and content of the article.
References
Anselin, L. (1988). A Test for Spatial Autocorrelation in Seemingly Unrelated Regressions. Econ. Lett. 28 (4), 335–341. doi:10.1016/0165-1765(88)90009-2
Chen, C., Sun, Y., Lan, Q., and Jiang, F. (2020). Impacts of Industrial Agglomeration on Pollution and Ecological Efficiency-A Spatial Econometric Analysis Based on a Big Panel Dataset of China's 259 Cities. J. Clean. Prod. 258, 120721. doi:10.1016/j.jclepro.2020.120721
Chen, L., Li, K., Chen, S., Wang, X., and Tang, L. (2021). Industrial Activity, Energy Structure, and Environmental Pollution in China. Energ. Econ. 104, 105633. doi:10.1016/j.eneco.2021.105633
Dietz, T., and Rosa, E. A. (1997). Effects of Population and Affluence on CO2 Emissions. Proc. Natl. Acad. Sci. U S A 94 (1), 175–179.
Dinda, S. (2005). A Theoretical Basis for the Environmental Kuznets Curve. Ecol. Econ. 53, 403–413. doi:10.1016/j.ecolecon.2004.10.007
Ding, L., Zhu, D. J., Peng, D. H., and Zhao, Y. (2017). Air Pollution and Asthma Attacks in Children: A Case–Crossover Analysis in the City of Chongqing, China. Environ. Pollut. 220, 348–353. doi:10.1016/j.envpol.2016.09.070
Hansen, B. E. (1999). Threshold Effects in Non-dynamic Panels: Estimation, Testing, and Inference. J. Econom. 93 (2), 345–368. doi:10.1016/s0304-4076(99)00025-1
Hong, Y., Lyu, X., Chen, Y., and Li, W. (2020). Industrial Agglomeration Externalities, Local Governments' Competition and Environmental Pollution: Evidence from Chinese Prefecture-Level Cities. J. Clean. Prod. 277, 123455. doi:10.1016/j.jclepro.2020.123455
Hossain, M. S., Frey, H. C., Louie, P. K. K., and Lau, A. K. H. (2021). Combined Effects of Increased O3 and Reduced NO2 Concentrations on Short-Term Air Pollution Health Risks in Hong Kong. Environ. Pollut. 270, 116280. doi:10.1016/j.envpol.2020.116280
Hui, E. C. M., Chau, C. K., Pun, L., and Law, M. Y. (2007). Measuring the Neighboring and Environmental Effects on Residential Property Value: Using Spatial Weighting Matrix. Building Environ. 42, 2333–2343. doi:10.1016/j.buildenv.2006.05.004
Jiang, S. R., Wang, J. Y., Shi, L., and Ma, Z. (2019). Impact of Energy Consumption and Air Pollution on Economic Growth-An Empirical Study Based on Dynamic Spatial Durbin Model. Energ. Proced. 158, 4011–4016. doi:10.1016/j.egypro.2019.01.839
Li, J., and Li, S. (2020). Energy Investment, Economic Growth and Carbon Emissions in China-Empirical Analysis Based on Spatial Durbin Model. Energy Policy 140, 111425. doi:10.1016/j.enpol.2020.111425
Li, H., Lu, J., and Li, B. (2020). Does Pollution-Intensive Industrial Agglomeration Increase Residents' Health Expenditure? Sustain. Cities Soc. 56, 102092. doi:10.1016/j.scs.2020.102092
Li, X., Xu, Y., and Yao, X. (2021). Effects of Industrial Agglomeration on Haze Pollution: A Chinese City-Level Study. Energy Policy 148, 111928. doi:10.1016/j.enpol.2020.111928
Liu, N., Chen, J. H., Wang, H., and Wang, T. (2019). The Impact of Urban Element Aggregation on Environmental Pollution in Urban Agglomerations: Based on the Research of Beijing-Tianjin-Hebei Urban Agglomeration. Soft Sci. 33, 110–116. doi:10.13956/j.ss.1001-8409.2019.05.21
Lu, P., Zhang, Y., Lin, J., Xia, G., Zhang, W., Knibbs, L. D., et al. (2020). Multi-city Study on Air Pollution and Hospital Outpatient Visits for Asthma in China. Environ. Pollut. 257, 113638. doi:10.1016/j.envpol.2019.113638
Lv, Y., Chen, W., and Cheng, J. (2019). Modelling Dynamic Impacts of Urbanization on Disaggregated Energy Consumption in China: A Spatial Durbin Modelling and Decomposition Approach. Energy Policy 133, 110841. doi:10.1016/j.enpol.2019.06.049
Meng, F., Su, B., Thomson, E., Zhou, D., and Zhou, P. (2016). Measuring China's Regional Energy and Carbon Emission Efficiency with DEA Models: A Survey. Appl. Energ. 183, 1–21. doi:10.1016/j.apenergy.2016.08.158
Pasaribu, U. S., Mukhaiyar, U., Huda, N. M., Sari, K. N., and Indratno, S. W. (2021). Modelling COVID-19 Growth Cases of Provinces in Java Island by Modified Spatial Weight Matrix GSTAR through railroad Passenger's Mobility. Heliyon 7, e06025. doi:10.1016/j.heliyon.2021.e06025
Poon, J. P. H., Casas, I., and He, C. (2006). The Impact of Energy, Transport, and Trade on Air Pollution in China. Eurasian Geogr. Econ. 47, 568–584. doi:10.2747/1538-7216.47.5.568
Shao, Q. (2020). Nonlinear Effects of marine Economic Growth and Technological Innovation on marine Pollution: Panel Threshold Analysis for China's 11 Coastal Regions. Mar. Pol. 121, 104110. doi:10.1016/j.marpol.2020.104110
Shi, B., Yang, H., Wang, J., and Zhao, J. (2016). City green Economy Evaluation: Empirical Evidence from 15 Sub-provincial Cities in China. Sustainability 8 (6), 551. doi:10.3390/su8060551
Song, Z. (2021). Economic Growth and Carbon Emissions: Estimation of a Panel Threshold Model for the Transition Process in China. J. Clean. Prod. 278, 123773. doi:10.1016/j.jclepro.2020.123773
Sueyoshi, T., Qu, J., Li, A., and Liu, X. (2021). A New Approach for Evaluating Technology Inequality and Diffusion Barriers: The Concept of Efficiency Gini Coefficient and its Application in Chinese Provinces. Energy 235, 121256. doi:10.1016/j.energy.2021.121256
Wang, F., Wang, R., and He, Z. (2021). The Impact of Environmental Pollution and green Finance on the High-Quality Development of Energy Based on Spatial Durbin Model. Resour. Pol. 74, 102451. doi:10.1016/j.resourpol.2021.102451
Wu, X., Huang, Y., and Gao, J. (2022). Impact of Industrial Agglomeration on New-type Urbanization: Evidence from Pearl River Delta Urban Agglomeration of China. Int. Rev. Econ. Finance 77, 312–325. doi:10.1016/j.iref.2021.10.002
Xie, Q., Xu, X., and Liu, X. (2019). Is There an EKC between Economic Growth and Smog Pollution in China? New Evidence from Semiparametric Spatial Autoregressive Models. J. Clean. Prod. 220, 873–883. doi:10.1016/j.jclepro.2019.02.166
Xie, Z., Qu, L., Lin, R., and Guo, Q. (2021). Relationships between Fluctuations of Environmental Regulation, Technological Innovation, and Economic Growth: a Multinational Perspective. J. Enterprise Inf. Manage. 34, 356–367. doi:10.1108/jeim-02-2021-0104
Xu, X. K., Liu, S. Q., and Zhang, H. Y. (2020). Research on Spatial Effects and Influencing Factors of Air Pollution from the Perspective of Urban Agglomerations. Sci. Technol. Manage. Res. 40, 244–251. doi:10.3969/j.issn.1000-7695.2020.15.035
Yuan, H., Zhang, T., Feng, Y., Liu, Y., and Ye, X. (2019). Does Financial Agglomeration Promote the green Development in China? A Spatial Spillover Perspective. J. Clean. Prod. 237, 117808. doi:10.1016/j.jclepro.2019.117808
Zeng, D.-Z., and Zhao, L. (2009). Pollution Havens and Industrial Agglomeration. J. Environ. Econ. Manage. 58, 141–153. doi:10.1016/j.jeem.2008.09.003
Zeng, S., Liu, Y., Liu, C., and Nan, X. (2017). A Review of Renewable Energy Investment in the BRICS Countries: History, Models, Problems and Solutions. Renew. Sustain. Energ. Rev. 74, 860–872. doi:10.1016/j.rser.2017.03.016
Zhang, H., Qiu, F., Wei, Q., Tong, L., Ye, X., and Cheng, Y. (2014). Economic Development and Energy Efficiency in Jilin Province, China. J. Geogr. Sci. 24, 875–888. doi:10.1007/s11442-014-1126-y
Zhao, L. K., Liu, Y. Q., Chen, L. W., and Tian, J. S. (2021). Evaluation of Coordination and Coupling Degree of Cross-Regional Influence of the Construction Industry Based on Regional Economic Factors: a Case Study of Beijing, Capital of china. Discrete Dyn. Nat. Soc. 2021, 6650493. doi:10.1155/2021/6650493
Keywords: industrial development, ecological effect, nitrogen dioxide, spatial panel durbin model, panel threshold model
Citation: Han C-Y, Gu Z-L and Yang H (2022) Investigate the Effects of Industrial Agglomeration on Nitrogen Dioxide Pollution Using Spatial Panel Durbin and Panel Threshold Models. Front. Environ. Sci. 10:844479. doi: 10.3389/fenvs.2022.844479
Received: 28 December 2021; Accepted: 07 February 2022;
Published: 15 March 2022.
Edited by:
Magdalena Radulescu, University of Pitesti, RomaniaCopyright © 2022 Han, Gu and Yang. This is an open-access article distributed under the terms of the Creative Commons Attribution License (CC BY). The use, distribution or reproduction in other forums is permitted, provided the original author(s) and the copyright owner(s) are credited and that the original publication in this journal is cited, in accordance with accepted academic practice. No use, distribution or reproduction is permitted which does not comply with these terms.
*Correspondence: Zhao-Lin Gu, zhaolingu@outlook.com