 Jiabin Wang1
 Yuping Bai
94% of researchers rate our articles as excellent or good
Learn more about the work of our research integrity team to safeguard the quality of each article we publish.
Find out more
ORIGINAL RESEARCH article
Front. Environ. Sci. , 14 April 2022
Sec. Conservation and Restoration Ecology
Volume 10 - 2022 | https://doi.org/10.3389/fenvs.2022.843920
This article is part of the Research Topic Solutions to High-Quality Development: Theories and Practices in Ecological Aspects View all 21 articles
Household carbon emissions (HCEs) in urban communities are significant sources of China’s total carbon emissions and contribute to global warming and climate change dramatically. This study aims to estimate the HCEs and investigate their influential factors based on a total of 185 household survey data collected from three typical types of urban communities in Beijing: traditional communities, unit communities, and commercial housing communities with the application of the consumer lifestyle approach analysis and econometrics model. The results show that unit communities contribute to the highest direct carbon emissions and the commercial housing communities produce the most indirect carbon emissions, with the traditional communities emitting the lowest carbon emissions both directly and indirectly. The highest direct carbon emissions of households are found in unit communities at 723.79 kgCO2 per month, followed by commercial communities at 580.01 kgCO2, and finally the traditional communities with 526.44 kgCO2 direct carbon emissions monthly. And the highest monthly indirect carbon emissions of households are found in commercial communities at 707.70 kgCO2, followed by unit communities at 669.38 kgCO2, and finally with 554.85 kgCO2 indirect carbon emissions monthly in traditional communities. It concludes that the community type affects HCE characteristics and their driving factors significantly. Household income, household population, and the ownership of cars increase HCE in more than one type of community. Scientific research work-related population, community environment satisfaction, housing area have positive effects, while community convenience has negative impacts on HCEs in one certain type of community. Policy implications tailored to general and specific community types are proposed as the guidance of carbon reduction and community transformation finally. This study contributes to the understanding of the impact of community attributes on HCEs and proposes some methods for microregional carbon emission reduction and the ecological transformation of urban communities.
Over the years, the emission of greenhouse gases (GHGs) especially CO2 is confirmed as the primary reason for global warming (Eckstein et al., 2017). With the climate change caused by global warming, natural disasters and extreme weather are more likely to appear in those years (Calleja-Agius et al., 2021; Marlon et al., 2021). In 2020, China accounts for 27.2% of global energy consumption and 31.8% of global carbon emissions (BP 2021). Besides large amounts of industrial energy consumption, the daily life of communities has become a significant producer of greenhouse gases (Anderson et al., 2016; Lin et al., 2013; Yang and Chen, 2011; Yang, S. et al., 2018). The household carbon emissions (HCEs) accounted for 30–40% of China’s national total emission between 2000 and 2010 (Li et al., 2019). And the proportion shows a trend of growth (Wang and Yang, 2014). To protect the environment and to explore the path of community ecological construction and transformation development, CO2 emissions need to be controlled (Liu et al., 2021).
China emphasized the concept of carbon peak and carbon neutral recently and it is essential for environmental health. However, a broad and profound economic and social systemic change is needed to achieve it (Huo et al., 2021; Zhang and Hanaoka, 2021). Higher requirements have been given for the promotion of new-type ecological civilization construction and the realization of healthy and high-quality development (Bai et al., 2019; Deng, 2021; Lin and Zhu, 2021). As the capital of China, Beijing is in the process of transforming from a general city to an ecological city, and it is also faced with the challenges above, which will inevitably become obstacles to its development. Given its special urban nature and development orientation, it has a great demand for urban community transformation (Yang, Q. et al., 2018; Yang, S. et al., 2018). During its urbanization, the overexpansion of population, increasingly congested traffic, housing prices continuing to rise, resources and environmental carrying capacity are seriously insufficient (Wang et al., 2021), and much more carbon emission has been brought into Beijing with a high concentration of people and energy-consumed industries. The reduction of HCE will play a significant role in this section, and ecological communities will be the key to reduce regional carbon emissions. Recently, scholars start to set their sights on HCEs and discover methods to regulate carbon emission from a more micro perspective.
The results of studies on carbon emission carried out worldwide were impressive in the last 2 decades (Davis and Caldeira, 2010; Yang and Chen, 2011; Sun and Huang, 2020; Wang et al., 2021). Aside from the influence of carbon emission on global warming, there are some studies on the impact of carbon emission on public health and environmental protection (Yang, Q. et al., 2018; Yang, S. et al., 2018). In China, studies on carbon emission developed rapidly and HCE studies began after 2008 in different regions (Qin, 2009). Studies on HCE developed rapidly throughout these years, and huge progress was made (Ye et al., 2017; Zhang et al., 2021). In related studies, the growing household consumption level was confirmed as the main reason of the increase in emissions and waste (Wilson et al., 2013; Zhang et al., 2020). The community-level carbon emission research started at the same time as household level. At the same time, due to the large scale and variety of local communities, ecological community construction is expected to become a major way to break the bottleneck of its development, so it has a typical research significance. To reduce residents’ carbon emissions and promote low-carbon community construction is to strengthen the construction of a low-carbon society, an important way to promote the development of low-carbon communities and an important measure to mitigate global warming.
Existing studies confirm that HCEs are divided into direct and indirect carbon emissions (Liu et al., 2011; Zhang et al., 2015). However, the academic circle has not formed a strict unified standard for the estimation boundary of household direct and indirect carbon emissions. In general, direct carbon emissions refer to those that are obtained from energy consumption, such as fossil fuels and electricity. Indirect carbon emissions refer to the carbon emission from consumer goods and services, including food, clothes, and furniture, caused by the energy consumption during industrial production (Bin and Dowlatabadi, 2005; Liu et al., 2011; Zhang et al., 2015; Chen et al., 2019). Another point of view is that HCEs can be divided into three tiers. Tier 1 is direct carbon emissions, including only fossil fuels that directly produce carbon emissions; Tier 2 and tier 3 are indirect carbon emissions; tier 2 is energy consumption that does not directly emit carbon emissions, such as electricity and heating. Tier 3 are emissions from products and services (Matthews et al., 2008; Kenny and Gray, 2009; Andrew and Cortese, 2011; Zhao, 2019).
As for the influential factors of HCEs, socioeconomic factors, household characteristics, and geographic factors are widely considered (Li et al., 2016; Yang et al., 2016; Zhang et al., 2015). On the basis of previous studies, Zhang et al. (2015) summarized that the household income, age, household size, education level, household location, gender, and rebound effects are major influencing factors of HCEs. However, fewer studies have taken community attributes into consideration. Gu et al. (2013) illustrated the disparity in transport energy consumption of different residential communities. In Yang et al. (2016)’s study, HCEs are relevantly inequal in different communities, and this is due to the different level of infrastructure construction and commuting distance. Rong et al. (2020) demonstrated the influence of the built environment on HCEs. More profound influential factors on community attributes are looking forward to being examined in the following HCE studies (Rong et al., 2020; Yang et al., 2016).
The consumer lifestyle approach (CLA) was first proposed by Bin and Dowlatabadi (2005) for exploring consumer-related energy consumption and carbon emission. In China, the term CLA was first carried out in the same year (Wei et al., 2007). In previous studies, CLA was considered to be more efficient by combining the advantages of the input–output model and emission coefficient method (ECM), but it is complicated to apply (Zhang et al., 2015). CLA provides an integrated evaluation framework that is a clear understanding of the interaction factors affecting consumers, personal determinants, household characteristics, consumer choices, and consequences. Previous studies are more focused on the overall carbon emissions of communities (Adalilar et al., 2015; Rong et al., 2020), and CLA contributes to correlating carbon emissions with residents’ lifestyles, revealing effective pathways for the government to formulate effective policies of energy conservation and emission reduction targeting urban communities.
In this paper, different structures of CO2 emissions among three types of communities are estimated based on household survey questionnaires, and the influencing factors on the carbon emission of residents in different communities are identified. In our research, communities are classified differently and the factors involved, especially the factors of HCEs, are different from early studies. This paper contributes to the previous studies with the following perspectives: we explore new boundaries of HCE evaluation based on traditional studies with the selection of typical and distinctive communities. In addition, we focus more upon community residential services as well as attributes and their connections with HCEs, instead of simply explaining their structural features. Through our research, we hope to reveal the differences in HCE and their influential factors, respectively, between typical communities. Then, we can explore the eco-transformation solutions for the significant influential factors.
The remainder of this paper is organized as follows: in Study Area, the research area is introduced, in Methodology and Data, the relevant data are collected and analyzed, and the corresponding mathematical method is introduced. In Results, the results of HCE characteristics and driving factors in different communities are presented. The obtained results are discussed in Discussions; the policy implications obtained from this research are drawn in Policy Implications. Conclusion draws conclusions.
Beijing is the capital of China with the Global Positioning System (GPS) coordinates of 39°55′0.0048″N and 116°22′59.9916″E, which is located in the northern part of the North China Plain. Because of its dynamic economy, high-level urbanization construction, and strong innovation capability, Beijing has become an important engine for the economic development of north China. As the political, economic, and cultural center of China, Beijing has a large population of more than 20 million and a high GDP per capita, reaching up to 164,889 yuan in 2020 according to the National Bureau of Statistics (China Statistical Yearbook, 2021). Relying on a long history and a developed economy, Beijing has several different types of communities with distinctive characteristics: traditional communities, unit communities, and commercial housing communities. Due to the excellent protection of traditional buildings, a large number of houses and traditional communities built in the Ming and Qing dynasties have been preserved in Beijing. In addition, because of historical reasons, there are unit communities that are developed and uniformly allocated by the government and commercial communities, which are developed by commercial companies and allocated by the market. These three types of communities have obvious differences in lifestyles, consumption patterns, resource utilization styles, ecological adaptation, and public services. However, with the target of sustainable development, these three communities are facing the same challenge: ecological transformation. As widely recognized, the concept of the ecological community is committed to seeking harmony among people, society, and the environment (Dalton et al., 2007; Maliene et al., 2008; Roseland, 2012), and energy-saving and emission reduction in residential areas are thus one inevitable pathway for the ecological transformation of communities (Yang et al., 2016). For the reason that the study of community ecological transformation requires different types of research samples, Beijing has become a natural testing ground for studying the ecological transformation of communities in the process of ecological civilization construction and urban–rural integration development.
HCEs in communities can be divided into direct carbon emissions and indirect carbon emissions, of which the direct carbon emissions are building energy consumption system and transportation system emissions (Wei et al., 2007), as shown in Figure 1.
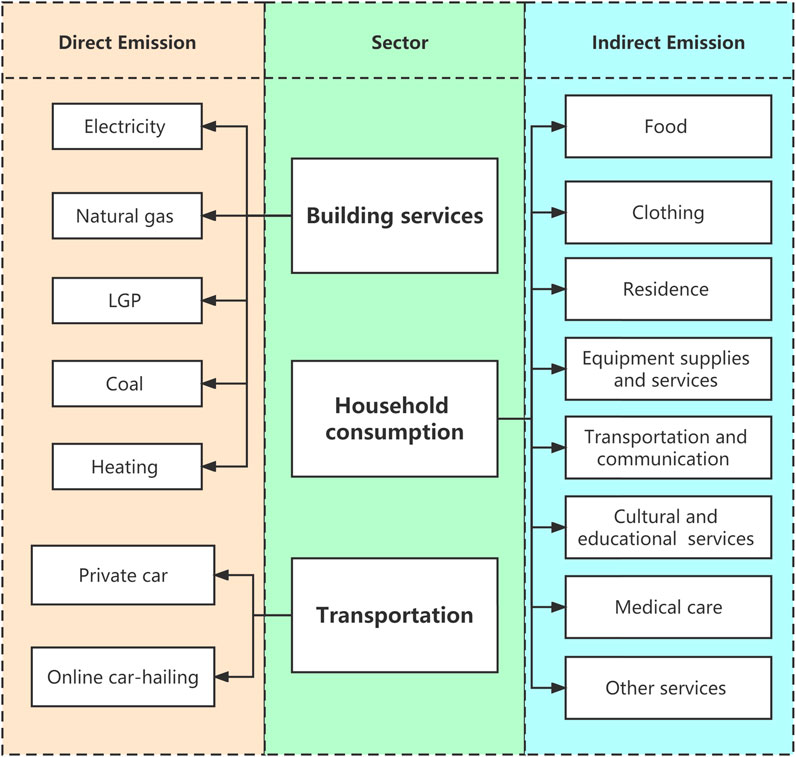
FIGURE 1. Boundary of household carbon emissions’ estimation system.
The estimation of direct carbon emissions was based on the ECM. Indirect carbon emissions are estimated by the conceptual model of consumers’ lifestyle and input–output method after the carbon emission coefficients of eight types of household expenditures were determined, and the carbon emissions implied in the production of products and services obtained by households in the process of consumption were calculated.
Direct carbon emissions in this paper refer to those produced from the energy consumption process of cooking, heating, lighting, and transportation, which were calculated from 2 sources: building energy consumption system and transportation system.
According to the Intergovernmental Panel on Climate Change (IPCC) Guidelines for National Greenhouse Gas Inventories 2017 and “China Energy Statistical Yearbook”, the energy consumed by communities in Beijing can be divided into three categories: residential electricity, gas, and heating. The accounting formula is (Fan et al., 2013; Liang et al., 2013; Chancel, 2014)
where
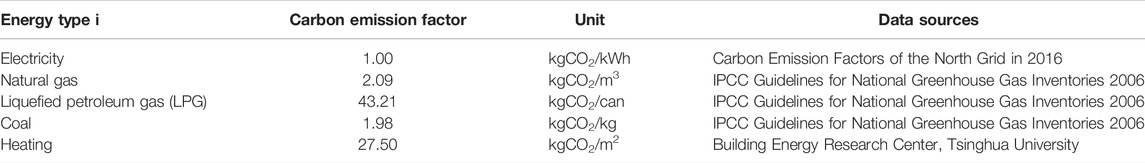
TABLE 1. Carbon emission factor of energy.
Private cars, online car-hailing, motorcycles, buses, planes, trains, bicycles, and electric cars are the significant means of transportation used by modern families. Carbon emission accounting in the category of community microresearch should have clear regional boundaries. Residents often travel beyond the community boundaries by long-distance vehicles such as planes and trains, so the carbon emissions generated are not included in this research, and these transportation modes are not considered. In recent years, Beijing has adopted a series of traffic management measures on motorcycles and implemented regulations banning motorcycles on many road sections from 2021, which has gradually reduced the number of families traveling by motorcycle. Shared bikes, private bikes, buses, and subways are commonly used, but their carbon emissions are low and data are not readily available. The carbon emissions of electric vehicles are accounted for in the building energy system in the form of household electricity consumption. To sum up, this paper only considers private cars and online car-hailing, which have high carbon emissions and are frequently used by residents for daily travel, and establishes a carbon emission model by referring to relevant literature (Yang et al., 2016) and the data required is declared in Table 2.
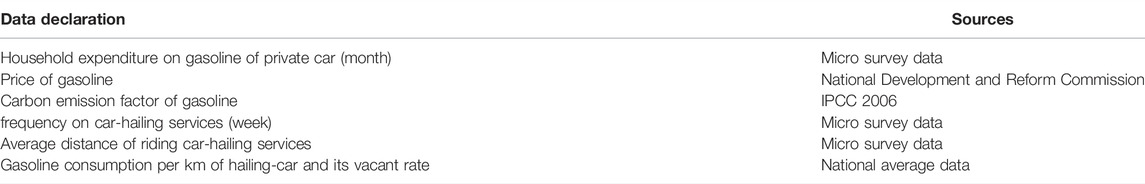
TABLE 2. Data declaration of transportation carbon emissions estimation.
where
where
Indirect carbon emission refers to the carbon emission indirectly generated by residents in the process of obtaining consumer goods and services to meet the needs of household food, clothing, housing, and transportation. The paper adopts the consumer lifestyle method (Feng et al., 2011; Wang and Yang, 2014; Chen et al., 2019) to determine the carbon emission coefficient of household consumption for accounting.
The common practice is based on the classification of the “China Energy Statistical Yearbook,” dividing the household consumption expenditure for food, clothing, supplies and services, healthcare, transportation, communication, education, culture and entertainment, eight housing, and other goods and services with reference to Wei et al. (2007) and others, each corresponding to one or more of the production departments. In this paper, our divisions of household consumption departments are shown in Table 3. The ratio of production carbon emission to the output value of multiple industries is used to represent the carbon emission coefficient of each type of expenditure, and the indirect carbon emission generated by consumption expenditure is determined by combining consumption.
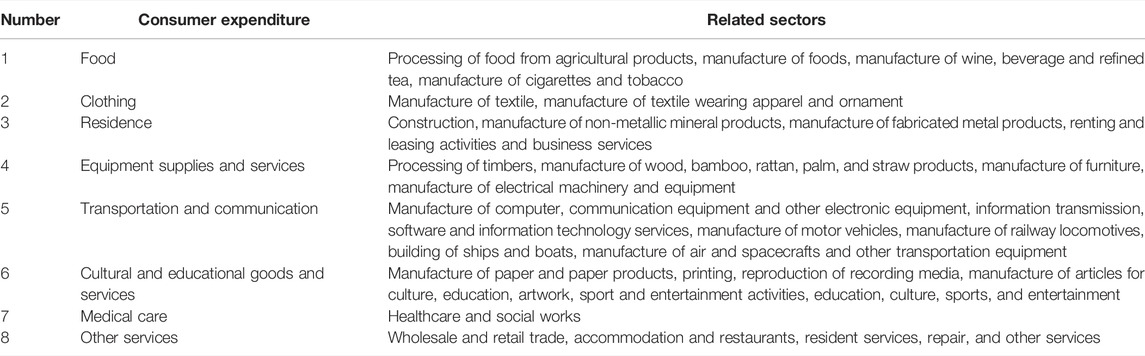
TABLE 3. Related sectors of consumer expenditure.
The input–output method is a frequently used optimization method in the application of CLA in China in recent years (Zhang et al., 2015). It is a common method to quantify and estimate carbon emissions (Wang et al., 2019). It was originally established by the American economist W. Leontief, and Bicknell et al. (1998) applied it and explained the principle reasonably. It determines the carbon emission coefficient by considering the correlation between industries, which can reflect the change of carbon emission caused by the change of one or more industries.
The formula is listed as follows:
where C is the carbon emission of household indirect energy consumption; F represents the implied carbon emission intensity of departments in the n × n input–output table; F′ represents the departments’ direct carbon emission intensity; A is the direct consumption coefficient matrix of the n × n input–output table; I is the same order of the identity matrix as A; Y is the column vector, representing the expenditure of the family; (I – A)−1 is the Leontief inverse matrix, which shows the impact on all other departments when there are technological changes in a sector of the national economy.
In order to simplify the calculation and consider the availability of data, this paper uses the carbon emission coefficient of standard coal to calculate the carbon emission of industry production (Tu and Liu, 2014). Since the input–output table is published every 5 years, the input–output table used in this paper comes from the relevant data of the 2017 Beijing Input–Output Table, and the energy consumption of various industries comes from the “2018 Beijing Statistical Yearbook.” The household characteristics of Beijing residents, including basic household information, household energy consumption, the consumption of life services, community life satisfaction, and residents’ decision-making behavior evaluation, were collected by a questionnaire survey.
The community type should have its representative characteristic and distinct characteristic. Based on community classification in the existing research results, this article first embarks from the community property, which could be divided into the traditional community, unit community, and commercial housing community, and selected the Beijing six rings of those three types of typical communities as the data sampling objects. The distribution of survey samples is shown in Figure 2. The survey covered six districts and 11 streets in Beijing, namely, the inner city (Dongcheng and Xicheng) and the inner-city suburbs (Chaoyang, Haidian, and Shijingshan). We adopted the method of random sampling, and distributed roughly the same number of questionnaires to each target community, which were scattered in space and did not overlap each other. Moreover, due to the randomness of questionnaire distribution, the interference of some subjective factors could be well avoided. Since the survey was conducted by a one-to-one interview, the authenticity and accuracy of data acquisition were also guaranteed. Thus, the differences of the community location, management mode, and residents’ income class make the selection of the three communities believed to have the significance of horizontal comparative analysis.
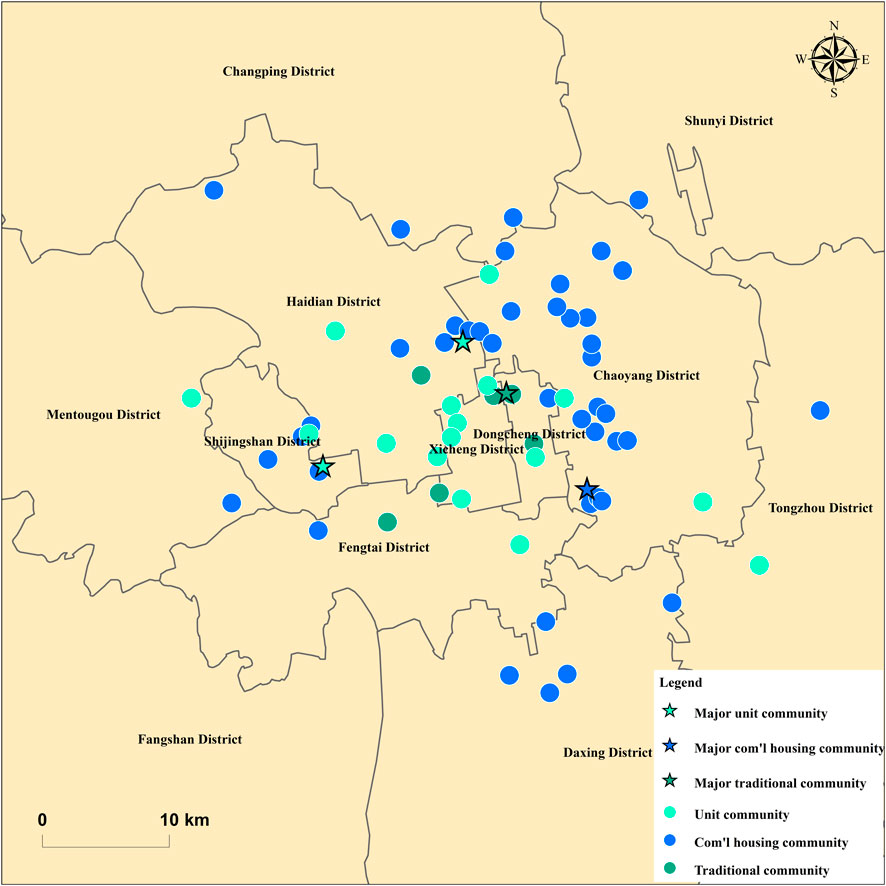
FIGURE 2. Distribution of the 185 selected household samples.
Based on the existing research and experts’ opinions, the questionnaire of our survey was divided into five modules: the basic information of individuals and families, information of household energy consumption, information of household life service consumption, community life satisfaction, and residents’ decision-making behavior evaluation. The rationality and feasibility of the questionnaire were determined through a pre-survey through online channels, and the survey was officially started after several revisions. In the early stage of the survey, questionnaires were collected through field visits and one-to-one interviews. In the later stage, due to the impact of the COVID-19, questionnaires were collected through the Internet. Finally, we collected 185 valid household samples.
This paper defines influencing factors such as housing satisfaction and participation in energy conservation and environmental protection based on the existing data obtained from the questionnaire. From the family and community levels, we assumed that there are a total of 17 influence factors, including the family monthly income, family structure, engaged in scientific research work, age structure, level of education, floor, housing area, travel mode, air conditioning temperature settings, environment satisfaction, housing satisfaction, energy conservation, environmental protection, activity participation, degree of willingness to participate in community management, community facilities, and car ownership.
Referring to the cross-sectional data model of the influencing factors of carbon emissions in existing studies, we took the total carbon emissions of traditional communities, unit communities, and commercial housing communities as dependent variables and studied the impact of the influencing factors on carbon emissions by applying econometrics analysis. The basic model is preliminarily set as
where
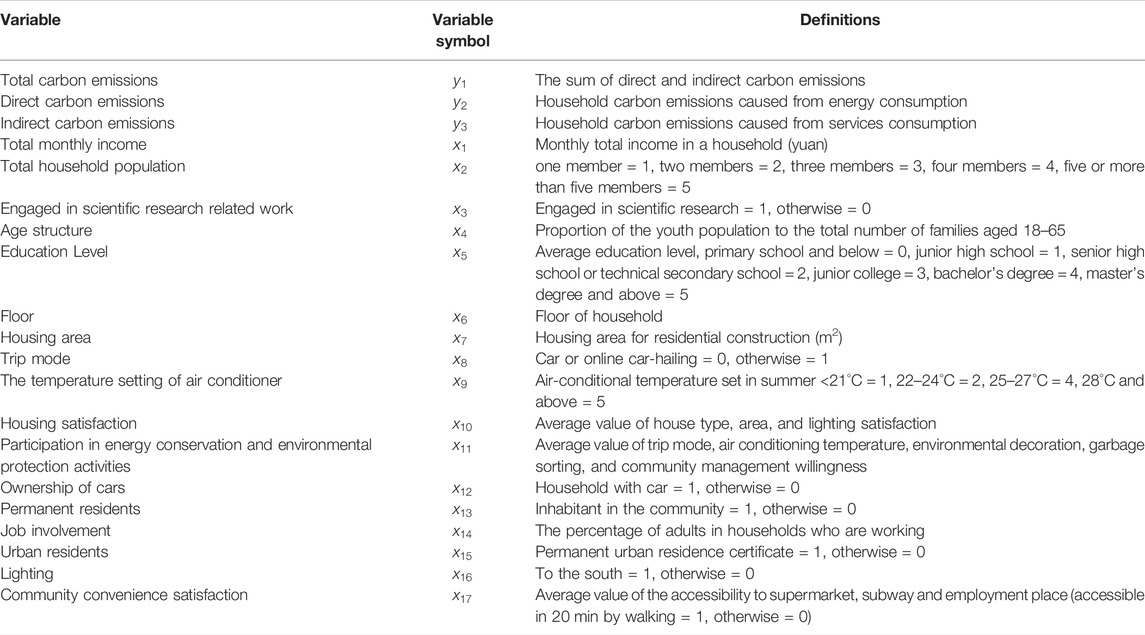
TABLE 4. The definitions of variables in regression analysis.
It is assumed that the observed individuals of the cross-sectional data are independent and there is no autocorrelation. Therefore, the Variance Inflation Factor (VIF) test, Breusch-Pagan (BP) test, and White test are carried out on the explained variables, respectively, and some factors that have negative effects on the model are removed by stepwise regression. Taking the traditional community as an example, we first test the multicollinearity of independent variables. The correlation matrices of the independent variables and variance inflation factor in the multiple regression model both indicate that there is no multicollinearity in the independent variables. The p-value of the BP test is 0.000, indicating that the independent variable has heteroscedasticity, so the heteroscedasticity robust standard error is added for correction.
After the modification, the two-stage least square method (2SLS) command was applied to it, and it was found that the estimators of the two models had little difference, and there was no endogeneity problem. For further verification, environmental satisfaction was set to be an endogenous variable. According to the coefficient of the correlation matrix, it is found that the correlation between environmental satisfaction and infrastructure satisfaction of tool variables is 0.599, which is suitable to be a tool variable of environmental satisfaction. Assuming that all other variables are exogenous, the 2SLS was used for regression. The results of Anderson Canon. Corr. LM Statistic and Cragg–Donald Wald F Statistic show that the instrumental variables pass the over recognition and just recognition tests. Also, for the test, namely, the results of the Minimum Eigenvalue statistic, its value 32.2022 significantly rejected the null hypothesis of the existence of weak instrumental variables. We also carried out the Durbin Wu Hausman (DWH) test to test the endogeneity of explanatory variables because of heteroscedasticity, and all the results above proved that the original hypothesis is verified without an endogeneity problem and all variables are considered exogenous. A more robust model is selected under the condition that there is no significant difference in estimated values and no significant difference in parameters.
From the data gathered in the survey, the basic characteristics of the three typical communities (traditional community, unit community, and commercial housing community) are portrayed in Table 5.
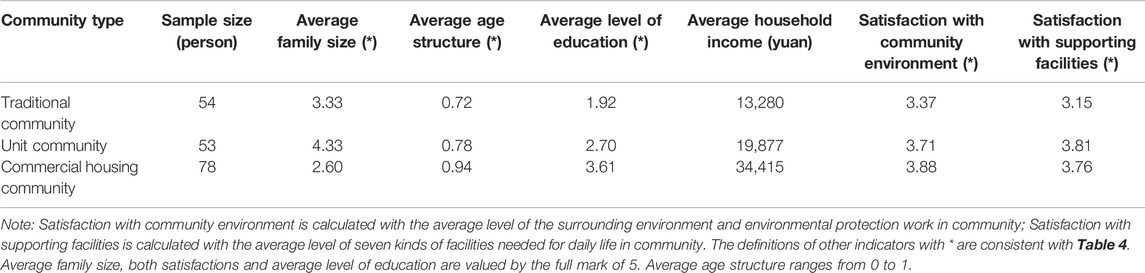
TABLE 5. Basic characteristics of three typical communities.
As shown, the community type affects its attributes significantly. The residents of traditional communities share the lowest income among the three types of communities. At the same time, this kind of community lacks labor-aged people more than the other two, with an average age structure of 0.72. The commercial housing community appears to have a much younger age structure of 0.94 and a higher level of education, at 3.61; thus, the respondents in this kind of community share the highest average income of 34,415. The family pattern of 2 or 3 members is common in commercial housing communities. The satisfaction with the community environment there is highest, while those with supporting facilities came in second place among three communities, respectively, at 3.88 and 3.76.
Figure 3 illustrates the estimation of direct carbon emissions in three typical communities. The estimation of indirect carbon emissions of the three typical communities is exhibited in Table 6 and Figure 4, and the structure of that is demonstrated in Figure 5.
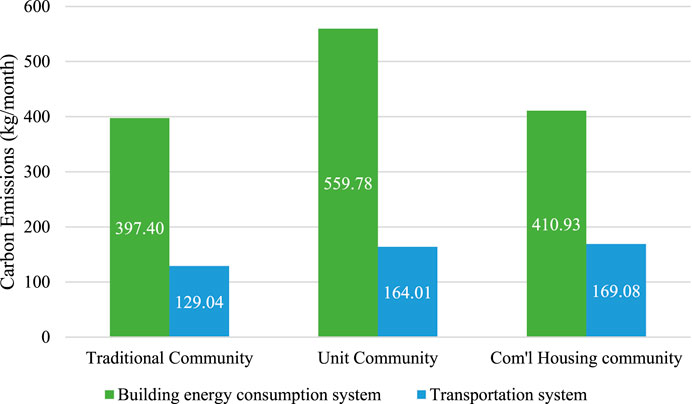
FIGURE 3. Direct carbon emissions per month in three typical communities.
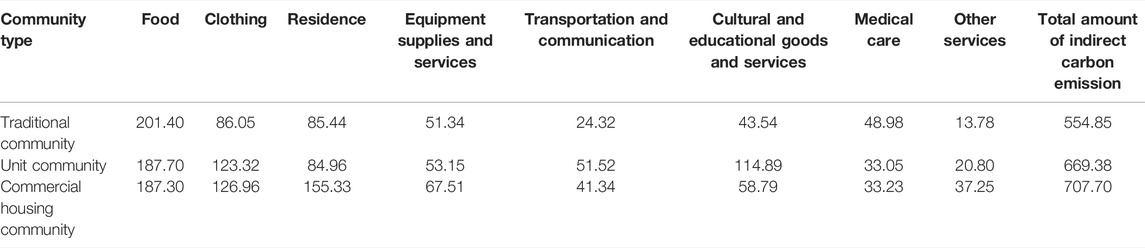
TABLE 6. Estimation of indirect carbon emissions of three typical communities (kg/month).
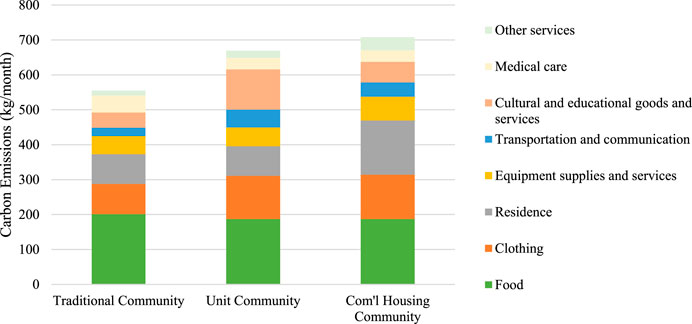
FIGURE 4. Indirect carbon emissions per month in three typical communities.
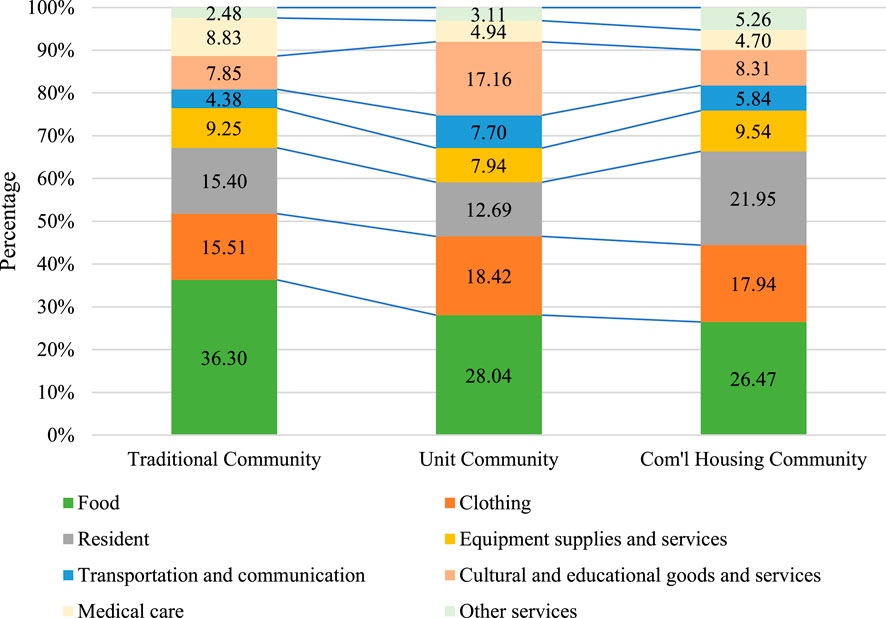
FIGURE 5. Composition of indirect carbon emissions in three typical communities.
Estimated direct carbon emissions are presented with the quantitative relation of unit community > commercial housing community > traditional community, while indirect carbon emissions are presented with the quantitative relation of commercial housing community > unit community > traditional community.
The average monthly direct carbon emissions of households in the unit community are the largest at 723.79 kgCO2, followed by the commercial housing community at 580.01 kgCO2 and traditional community at 526.44 kgCO2. Between its two subsystems, the building energy consumption system accounts for the maximum proportion, which takes more than 70% of direct carbon emissions in all three communities. The transportation carbon emissions correspondingly take less than 30% of direct carbon emissions in all three communities. With the largest population scale, households in unit communities produce 559.78 kgCO2 monthly from the building energy consumption system. On the contrary, households in traditional and commercial communities produce much lower carbon emissions from building energy consumption at 397.40 and 410.93 kgCO2, respectively, mainly because of their smaller family size. The transportation carbon emissions in the traditional community are the lowest with 129.04 kgCO2 per month, and that is mainly because the residents there are older and mostly retired without work-related mobility and the level of transportation carbon emissions in unit communities and commercial housing communities is flat, both estimated slightly more than 160 kgCO2 per month.
The average monthly indirect carbon emissions of households in the commercial housing community are largest at 707.70 kgCO2, followed by the unit community at 669.38 kgCO2, and traditional community at 554.85 kgCO2. Food consumption occupies more than 20% share of indirect carbon emissions in all three communities, numerically at 201.40, 187.70, and 187.30 kgCO2, respectively, per month. Food, clothing, and residents are the three major sectors of indirect carbon emissions, occupying more than 10% separately, and altogether near 60% of indirect carbon emissions in all three communities. The indirect carbon emissions of the other 5 household consumption sectors are found much lower on the whole. Different communities witness a significant disparity in their indirect carbon emission structure. Residents in traditional communities produce much fewer carbon emissions from clothing consumption, with only 86.05 kgCO2 per month, while those in the other two communities are both more than 120 kgCO2 monthly. That is mainly because more aged citizens live in traditional communities and they often spent their expenses sparingly and lack the passion for purchasing new clothes. As illustrated in the analysis of direct carbon emissions, traditional community residents also produce the lowest amount of carbon emissions in transportation and communication sectors, numerically about half of the other two’s levels. Traditional communities are more likely spatial aggregations in separation from the consumerism of modern society; residents there prefer a traditional and frugal living style, and thus, they choose to consume more on necessary daily needs and spend less on other sectors. Reasonably, expenses on medical care in traditional communities account for its largest constitution of the indirect carbon emission structure among three types of communities. Overall, the indirect carbon emission structures of unit communities and commercial communities are similar. No significant differences can be found in carbon emissions from food, clothing, and medical care consumption of these two kinds of communities. However, residents in commercial housing communities hold the highest income; therefore, the total indirect carbon emissions of consumption there is correspondingly the largest. Residents there tend to expend more on the fixture and repairing, which is included in residence consumption compared to others. The carbon emissions produced by expenditure on cultural and educational goods and services is highest in unit communities, more than ones from resident consumption there, which is probably because residents there are most likely former high-qualified staff of state-owned enterprises or colleges in China and perform cultural consumption more frequently.
Combining and comparing the direct and indirect carbon emissions, it can be found that the unit community owns the highest total carbon emissions among three types of communities, which is 1393.17 kgCO2, followed by commercial housing community with 1287.71 kgCO2, and the lowest in traditional community, which is 1081.29 kgCO2. Among them, the average indirect carbon emissions of the three types of communities exceeded direct carbon emissions, indicating that indirect carbon emissions accounted for a greater proportion of HCEs in the general community. However, according to the above calculation results, the indirect carbon emission of traditional community is 28.41 kg higher than direct carbon emission, while the indirect carbon emission of unit community is 54.41 kg lower than direct carbon emission. The indirect carbon emission of commercial housing communities is much higher than direct carbon emission, reaching 127.69 kg.
We further conducted the econometric regression model to examine the influential factors of total carbon emissions in three different types of communities. The results showed that the monthly income in households has shown a significant positive correlation with total carbon emissions in three communities, which means that the household income increases total carbon emissions (Table 7). Results also indicated that income is one of the most important factors influencing HCEs. In three types of communities, one enhanced standard unit of income increases 2.659, 1.611, and 0.463 of total HCEs, respectively. Household population plays a vital role in HCEs in unit communities and commercial housing communities. Compared to income, this variable increases HCEs both directly and indirectly. When the household population in unit communities and commercial housing communities increased by one unit, more 0.261 and 0.22 HCEs will be emitted. However, our research shows that its impact on HCEs in traditional communities is much weaker than the other two and is not strong enough to be significant. The obtained also depicts that car ownership is positively correlated with HCEs in both traditional communities and unit communities, at the level of 5% and 1%, respectively. It was also reported that the households with cars in these two communities produce more 0.117 and 0.139 of HCEs than those without cars monthly. However, car ownership is not in a statistically significant positive correlation with HCEs in commercial housing communities.
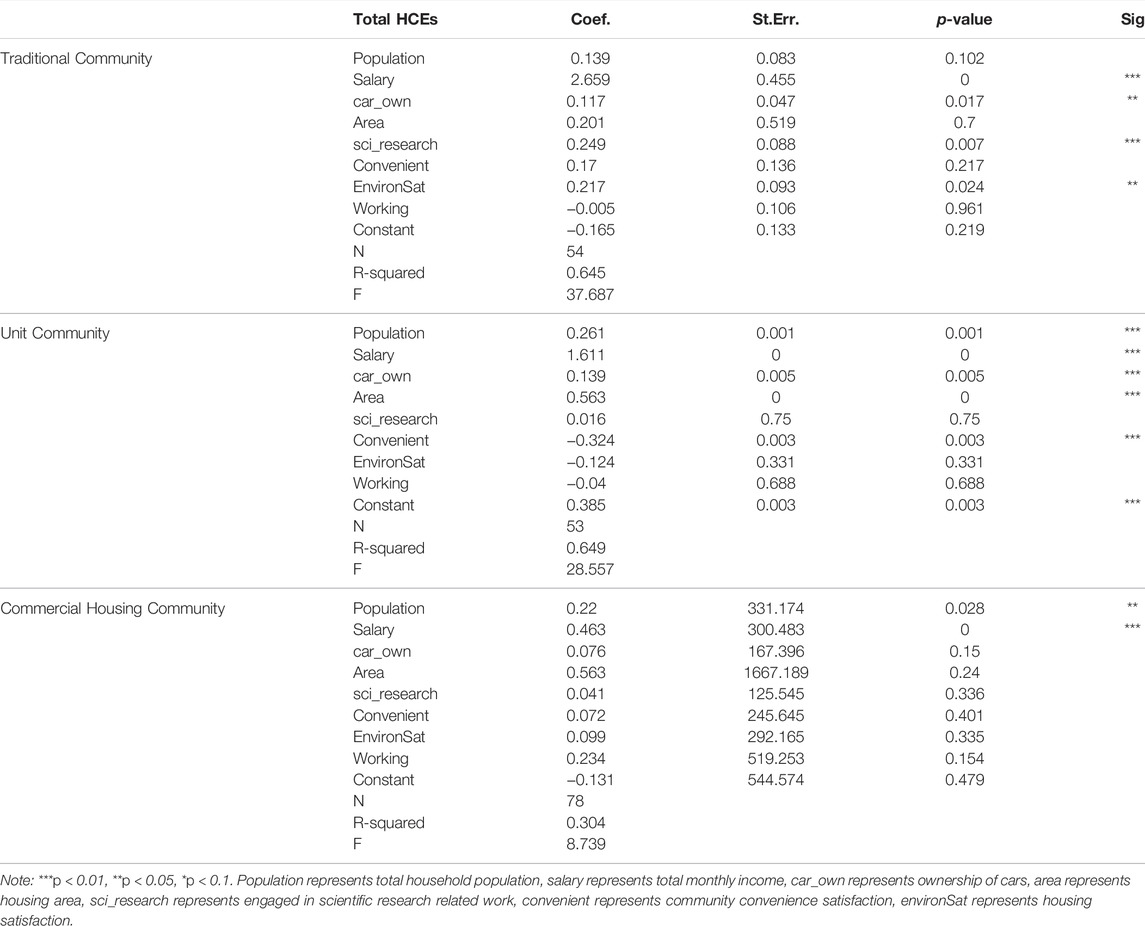
TABLE 7. Regression analysis results of HCEs in three typical communities.
In addition to universal influential factors in more than one type of community, each community owns some unique driving factors of HCEs there, which reflects their varied attributes and other characteristics. In traditional communities, there existed significant positive correlations between engaged in scientific research-related work and environmental satisfaction and HCEs. In unit communities, the housing area is positively correlated with carbon emissions while community convenience is negatively correlated with HCEs. Besides income and household population, no other unique significant correlations can be found between HCEs and other variables; the personnel involved in scientific research have a significant impact at the 1% level, and each additional unit of personnel involved in scientific research in the family will increase HCEs in traditional communities by 0.249. Carbon emissions are positively correlated with environmental satisfaction at the level of 0.05, and every unit increases in environmental satisfaction will increase carbon emissions by 0.217. In unit communities, there existed a positive correlation between the housing area and HCEs, and this impact is significant under the 1% level, and every 1 standard unit increase in the housing area increases carbon emissions by 0.563. The degree of convenience is proven to decrease carbon emissions significantly in unit communities. Each added degree of community convenience can reduce 0.324 of HCEs here.
During the process of the linear regression model, there are some other influential factors of HCEs that can be enlightening to us, although they were not statistically significant enough in each kind of community. The results suggest a positive correlation between the household population on the average level of education and carbon emissions in the commercial housing communities, but in the unit communities and traditional communities, this correlation turns out to be negative.
From our HCE estimation model, we draw the conclusion that both direct and indirect carbon emissions in three communities are distinctive, and those differences are detailed and showed the unique features of typical sort of communities clearly. In comparison, existing studies concentrate more on exploring the changes of HCEs cross-time and the inequality between urban and rural areas (Donglan et al., 2010; Feng et al., 2011; Wang and Yang, 2014; Chen et al., 2019). Our study design is based on a new vision concerning the inequality of HCEs in communities, and what we obtained declares that the phenomenon of unbalanced HCEs can occur in more microspatial units than urban and rural, or developed and developing, places. As for the quantitative relationship of two carbon sources, it is widely accepted that indirect carbon emissions account for most or the majority of HCEs (Zhang et al., 2015; Yin et al., 2020), but this study found that although the average amount of indirect carbon emissions in three communities is more than direct carbon emissions, the households in unit communities produce more direct carbon emissions than indirect ones while the remaining two types of community indirect carbon emissions are more than direct carbon emissions. A possible explanation is that with the application of clean production and energy-saving technologies (Khan et al., 2019), the embedded carbon intensities in industrial production are much lower in Beijing recently, and the defined calculating boundary of carbon emissions in different studies plays a role in the disparity of their findings. Our results provide insights for revealing the different quantitative relations of direct and indirect HCEs in different kinds of communities, which can be heuristic in future studies. More than one kind of community presents a positive correlation between car ownership and HCEs.
In terms of influencing factors, existing studies suggested that household expenditure or income is one of the most important driving factors of carbon emissions (Pachauri, 2004; Weber and Matthews, 2008; Xu et al., 2015; Li et al., 2016) which was consistent with our results. It is believed that income affects the purchasing power of households, differing their lifestyles and characteristics of consumption structure to shape their carbon emissions indirectly. Higher incomes are closely associated with high-quality life, as well as higher daily expenditure.
The household population is also recognized to have a significant positive correlation with HCEs in many papers (Qu et al., 2013; Xue, 2020; Yang and Liu, 2017). It is reasonable that the more members in a household, the more HCEs foreseeable to emit because people are the dual subjects of both basic energy and living services or goods consumption. However, from what we attained in this study, because it was lacking young family members, the carbon emissions in traditional community households are not significantly correlated with the household population. A possible explanation is that young family members seldom settle in traditional communities for long with their parents, leaving fewer energy needs in households there. Since that, it presents that the permanent population in households is a better choice for future studies. On the whole, the HCE drivers suiting all kinds of communities in this paper are the household income and household permanent population to a certain extent. Similar to Lyons et al. (2012), we find that the household income is a more significant driving force of HCEs in households than the household population.
The impact of car ownership on HCEs shows a significant positive effect in both traditional communities and unit communities. The daily use of vehicles increases HCEs from transportation (Wang and Liu, 2015; Xu et al., 2015), but it is worth mentioning that car ownership shapes lifestyle and personal decisions dramatically in modern society, from which more carbon emissions can be produced. In commercial housing communities, the impact of car ownership on HCEs is also positive but not statistically significant enough. Only 20.5% of residents choose car driving or car-hailing as their major travel decisions, while the percentage of private car owners here is 65.3%, which verifies that cars are not frequently used here for daily transportations. Besides, the large composition of consumption-induced indirect HCEs in carbon emissions structures there inhibits the positive effect of transportation carbon emissions in some means.
The other significant influential factors of HCEs obtained from our study are the scientific research work-related population, community environment satisfaction, housing area, and community convenience, which belongs to one certain kind of communities.
In traditional communities, scientific research work-related population and community environmental satisfaction are proven to increase HCEs here. The personnel involved in scientific research participate in more cultural and educational services and spend more in this field. At the same time, the carbon emission intensity of cultural and educational activities has also been confirmed to have a significant improvement in recent years. Additionally, the personnel involved in scientific research are generally highly educated, which may have more requirements for the quality of life and more frequent traffic activities (Büchs and Schnepf, 2013; Han et al., 2015) and such people may have a more luxurious lifestyle. These characteristics of people in those occupations are contrary to the overall structure of the main residents in the traditional communities, who are older and prefer a simple life and single carbon energy consumption concentrated in the basic daily consumption activities, making this factor significantly stimulate the carbon emissions of traditional communities to rise. This also suggests that households living in environmentally sound communities could have higher incomes and are able to pursue a better quality of life, but that higher environmental satisfaction in such communities may not be proportional to higher energy conservation awareness.
In unit communities, housing areas increase but the community convenience reduces HCEs significantly. This is mainly because the larger the residential area, the more the fixed devices, and the more energy needed (Li et al., 2019). When heating equipment is used, more energy is needed to achieve the same effect, so carbon emissions will consequently increase. Due to the frequent short-haul transmission between households and workplaces in this certain type of communities, the improvement of community convenience can reduce a lot of transportation carbon emissions there (Yang et al., 2016). This sheds a light on the importance of urban convenience in the means of carbon reduction (Rong et al., 2018).
Our study portrays the distinction between these three typical communities in Beijing via a new perspective: carbon emissions and their driving factors. From the aspect of carbon emissions, traditional communities emit the lowest total carbon emissions among the three types of communities, which is caused by the low mobility of its residents and their limited life quality demands. The commercial housing community takes the highest part of indirect carbon emission in the three kinds of communities, which suggests that the residents there are more likely wealthy and expect high life quality during daily living. The unit communities should be ones with both the largest household scale and total carbon emissions. As for the carbon emissions’ influential factors, they indicate that traditional communities and unit communities are a characteristic with most significant drivers and can be regulated with carbon restriction targets through multiple pathways. However, each of these two types of communities is very distinctive; carbon emissions in traditional communities are concentrated on community environment and human-related factors, like community environment satisfaction and scientific research work-related population,. while those in unit communities are more tightly related with community functions, such as convenience and housing area. Commercial housing communities are correspondingly the most complex or unknown type of community among these three types of communities with less obvious drivers. The following studies need to concentrate on these kinds of communities more from multi-angles to dig the mechanism behind their complexity.
Considered as important emitters of carbon emissions, households gain the great attention of scholars in recent years. In recent studies, the necessary data are mostly gathered from the microsurvey and their quality and quantity are highly connected with the credibility of study results (Zhang et al., 2015). To study HCEs more accurately and profoundly, more available related data should be provided with open access. Due to the limited resources, our research needs more effective samples to revise itself as with many survey studies. The following studies should enlarge the scale of the samples and re-examine the conclusions, and more classification of households should be taken into consideration in the future. Further studies exploring the interrelation between HCEs and community attributes can concentrate more on the concept of eco-community, establishing widely applicable models of community carbon emissions and estimating their eco-efficiency. Furthermore, we can evaluate the community management mode, and propose reasonable decision-making intention, treat the community as an independent unit to manage carbon emissions.
According to the results obtained in our study, concrete policies can be proposed to deal with carbon emissions in different communities specifically. Food consumption accounts for the largest share of indirect carbon emissions from eight types of consumption. Household food purchasing should be based on the principle of an appropriate amount; avoiding waste as much as possible, the consumption mode of unit community and commercial housing community is more diversified, and the quality requirements of daily life, clothing, and daily necessities are higher. It should mainly guide the rational consumption of these two types of community residents, thrift, and form a correct consumption concept. Residents in traditional communities are generally older and have simple lifestyles, which prefer needy daily consumption. We should add health equipment and provide exercise places, which can reduce medical consumption-induced HCEs to some extent. The commercial housing community and unit community residents’ lifestyles are relatively complex and diverse; guiding their green consumption to alleviate carbon emissions is more important. In particular, it is necessary to strengthen the investment in infrastructure in the unit communities. In the unit communities, improving the convenience of the community will greatly reduce the utilization rate of transportation tools or the frequency of the use of private cars. Under the condition of improving the same convenience, the unit community can achieve a better emission reduction effect than the other two communities.
On the whole, the following policy implications based on universal influential factors in three types of the community also need wide attention. With the steady growth of per capita disposable income, the level of indirect carbon emissions will remain high. Relevant policies should be promoted to improve the consumption structure of residents, encourage and guide green consumption, and reduce the proportion of consumption of goods with high carbon emissions. In our research, it is found that the residents’ living habits are one of the important factors affecting community carbon emissions. The government needs to strengthen the publicity of environmental protection and improve the residents’ living habits. At the same time, the residents’ consumption behavior can also be restrained by controlling energy prices within a reasonable range. In addition, promoting the development and utilization of renewable energy promotes the technology research and development and achieves the transformation of solar energy, tidal energy, and wind energy as well and realizes the technological breakthrough and practical application as soon as possible. More investment, development, and utilization of low-energy-consumption equipment. At the same time, the government will improve the coverage and utilization rate of low-carbon equipment through subsidies or tax exemption for low-carbon equipment in order to phase out traditional household equipment with low energy efficiency and high energy consumption. Manufacturers should be encouraged to continuously develop and launch household equipment with higher energy efficiency and lower energy consumption. Then, low-carbon transformation should be carried out at the community level to reduce carbon emissions without reducing the residents’ living standards.
This paper mainly analyzed the different characteristics of HCEs in three kinds of typical communities in Beijing and driving factors behind them, aiming to assist the ecological transformation of urban communities. During our research, we tried to examine the interaction between community attributes and HCEs and provide implications for policymakers to congratulate carbon emissions specifically on microspatial units: communities. Based on a micro survey conducted with 185 samples, we utilized the ECM method and input–output revised CLA method to evaluate HCEs in the traditional, unit, and commercial housing communities from direct and indirect portions. Then, we applied the econometric regression model to explore the influential factors behind their disparity.
The results suggested that direct carbon emissions are actually with the quantitative relation of the unit community (723.79 kgCO2) > commercial housing community (580.01 kgCO2) > traditional community (526.44 kgCO2), while indirect carbon emissions are with the quantitative relation of the commercial housing community (707.70 kgCO2) > unit community (669.38 kgCO2) > traditional community (554.85 kgCO2). The structure of carbon emissions in three kinds of communities is distinctive dramatically, and diverse and reliable factors were found. It was proven that the household income is the universal driver that increases HCEs in all three types of communities. Household population affects carbon emissions positively in the unit communities and commercial housing communities. Car ownership increases HCEs in traditional communities and unit communities significantly. A set of demographic, economic, and community attribute factors is the unique driver of HCEs in one certain type of community. The scientific research work-related population and community environment satisfaction increase HCEs in traditional communities. Housing areas increase, but the community convenience reduces HCEs in unit communities effectively. There are also some non-significant factors that have mentionable impacts on HCEs, like the average education level of households.
The raw data supporting the conclusions of this article will be made available by the authors, without undue reservation.
JW conducted and performed research, collected the partial data and estimated the carbon emissions and wrote the main body of this paper; WH collected the partial data and wrote the abstract and introduction of this paper and went through some sectional works; LL collected the partial data and performed the analysis of the influential factors and wrote the part of data and methodology; YB contributed to revising and finalizing the paper; YD collected the partial data and contributed to write the study area of this paper; JL analyzed the influential factors and did partial graphic works.
This research was supported by National Natural Science Foundation of China (Grant No. 72004215) and National Natural Science Foundation of China (Grant No. 72104223).
The authors declare that the research was conducted in the absence of any commercial or financial relationships that could be construed as a potential conflict of interest.
All claims expressed in this article are solely those of the authors and do not necessarily represent those of their affiliated organizations, or those of the publisher, the editors and the reviewers. Any product that may be evaluated in this article, or claim that may be made by its manufacturer, is not guaranteed or endorsed by the publisher.
Adalilar, S. N., Alkibay, S., and Eser, Z. (2015). Ecovillages as a Destination and a Study of Consumer Approaches to Ecovillages. Proced. Econ. Finance 23, 539–546. doi:10.1016/s2212-5671(15)00561-4
Anderson, T. R., Hawkins, E., and Jones, P. D. (2016). CO2, the Greenhouse Effect and Global Warming: from the Pioneering Work of Arrhenius and Callendar to Today's Earth System Models. Endeavour 40 (3), 178–187. doi:10.1016/j.endeavour.2016.07.002
Andrew, J., and Cortese, C. (2011). Accounting for Climate Change and the Self-Regulation of Carbon Disclosures. Account. Forum 35, 130–138. Elsevier. doi:10.1016/j.accfor.2011.06.006
Bai, Y., Deng, X., Gibson, J., Zhao, Z., and Xu, H. (2019). How Does Urbanization Affect Residential CO2 Emissions? an Analysis on Urban Agglomerations of China. J. Clean. Prod. 209, 876–885. doi:10.1016/j.jclepro.2018.10.248
Bicknell, K. B., Ball, R. J., Cullen, R., and Bigsby, H. R. (1998). New Methodology for the Ecological Footprint with an Application to the New Zealand Economy. Ecol. Econ. 27 (2), 149–160. doi:10.1016/s0921-8009(97)00136-5
Bin, S., and Dowlatabadi, H. (2005). Consumer Lifestyle Approach to US Energy Use and the Related CO2 Emissions. Energy policy 33 (2), 197–208. doi:10.1016/s0301-4215(03)00210-6
BP (2021) The BP Statistical Review of World Energy. Available at: http://www.bp.com/statisticalreview (accessed 28 July 2021)
Büchs, M., and Schnepf, S. V. (2013). Who Emits Most? Associations between Socio-Economic Factors and UK Households' home Energy, Transport, Indirect and Total CO2 Emissions. Ecol. Econ. 90, 114–123.
Calleja-Agius, J., England, K., and Calleja, N. (2021). The Effect of Global Warming on Mortality. Early Hum. Dev. 155, 105222. doi:10.1016/j.earlhumdev.2020.105222
Chancel, L. (2014). Are Younger Generations Higher Carbon Emitters Than Their Elders? Ecol. Econ. 100, 195–207. doi:10.1016/j.ecolecon.2014.02.009
Chen, C., Liu, G., Meng, F., Hao, Y., Zhang, Y., and Casazza, M. (2019). Energy Consumption and Carbon Footprint Accounting of Urban and Rural Residents in Beijing through Consumer Lifestyle Approach. Ecol. Indicators 98, 575–586. doi:10.1016/j.ecolind.2018.11.049
Dalton, M., Jiang, L., Pachauri, S., and O’Neill, B. C. (2007). Demographic Change and Future Carbon Emissions in China and India, Unpublished Update of the 16 March 2007 Draft Presented at the Annual Meeting of the Population. New York, NY: Association of America, 29–31.
Davis, S. J., and Caldeira, K. (2010). Consumption-based Accounting of CO2 Emissions. Proc. Natl. Acad. Sci. 107 (12), 5687–5692. doi:10.1073/pnas.0906974107
Deng, S. (2021). Exploring the Relationship between New-type Urbanization and Sustainable Urban Land Use: Evidence from Prefecture-Level Cities in China. Sustain. Comput. Inform. Syst. 30, 100446. doi:10.1016/j.suscom.2020.100446
Donglan, Z., Dequn, Z., and Peng, Z. (2010). Driving Forces of Residential CO2 Emissions in Urban and Rural China: An index Decomposition Analysis. Energy Policy 38 (7), 3377–3383. doi:10.1016/j.enpol.2010.02.011
Eckstein, D., Künzel, V., and Schäfer, L. (2017). Global Climate Risk Index 2018. Bonn, Germany: Germanwatch.
Fan, J.-L., Liao, H., Liang, Q.-M., Tatano, H., Liu, C.-F., and Wei, Y.-M. (2013). Residential Carbon Emission Evolutions in Urban-Rural Divided China: An End-Use and Behavior Analysis. Appl. Energ. 101, 323–332. doi:10.1016/j.apenergy.2012.01.020
Feng, Z.-H., Zou, L.-L., and Wei, Y.-M. (2011). The Impact of Household Consumption on Energy Use and CO2 Emissions in China. Energy 36 (1), 656–670. doi:10.1016/j.energy.2010.09.049
Gu, Z. H., Sun, Q., and Wennersten, R. (2013). Impact of Urban Residences on Energy Consumption and Carbon Emissions: An Investigation in Nanjing, China. Sustain. Cities Soc. 7, 52–61. doi:10.1016/j.scs.2012.11.004
Han, L., Xu, X., and Han, L. (2015). Applying Quantile Regression and Shapley Decomposition to Analyzing the Determinants of Household Embedded Carbon Emissions: Evidence from Urban China. J. Clean. Prod. 103, 219–230. doi:10.1016/j.jclepro.2014.08.078
Huo, T., Ma, Y., Cai, W., Liu, B., and Mu, L. (2021). Will the Urbanization Process Influence the Peak of Carbon Emissions in the Building Sector? A Dynamic Scenario Simulation. Energy and Buildings 232, 110590. doi:10.1016/j.enbuild.2020.110590
Kenny, T., and Gray, N. F. (2009). Comparative Performance of Six Carbon Footprint Models for Use in Ireland. Environ. impact Assess. Rev. 29 (1), 1–6. doi:10.1016/j.eiar.2008.06.001
Khan, Z., Sisi, Z., and Siqun, Y. (2019). Environmental Regulations an Option: Asymmetry Effect of Environmental Regulations on Carbon Emissions Using Non-linear ARDL. Energy Sourc. A: Recovery, Utilization, Environ. Effects 41 (2), 137–155. doi:10.1080/15567036.2018.1504145
Li, J., Huang, X., Yang, H., Chuai, X., Li, Y., Qu, J., et al. (2016). Situation and Determinants of Household Carbon Emissions in Northwest China. Habitat Int. 51, 178–187. doi:10.1016/j.habitatint.2015.10.024
Li, J., Zhang, D., and Su, B. (2019). The Impact of Social Awareness and Lifestyles on Household Carbon Emissions in China. Ecol. Econ. 160, 145–155. doi:10.1016/j.ecolecon.2019.02.020
Liang, L., Wu, W., Lal, R., and Guo, Y. (2013). Structural Change and Carbon Emission of Rural Household Energy Consumption in Huantai, Northern China. Renew. Sustain. Energ. Rev. 28, 767–776. doi:10.1016/j.rser.2013.07.041
Lin, B., and Zhu, J. (2021). Impact of China's New-type Urbanization on Energy Intensity: A City-Level Analysis. Energ. Econ. 99, 105292. doi:10.1016/j.eneco.2021.105292
Lin, T., Yu, Y., Bai, X., Feng, L., and Wang, J. (2013). Greenhouse Gas Emissions Accounting of Urban Residential Consumption: a Household Survey Based Approach. PloS one 8 (2), e55642. doi:10.1371/journal.pone.0055642
Liu, L.-C., Wu, G., Wang, J.-N., and Wei, Y.-M. (2011). China's Carbon Emissions from Urban and Rural Households during 1992-2007. J. Clean. Prod. 19 (15), 1754–1762. doi:10.1016/j.jclepro.2011.06.011
Liu, X., Guo, P., Yue, X., Zhong, S., and Cao, X. (2021). Urban Transition in China: Examining the Coordination between Urbanization and the Eco-Environment Using a Multi-Model Evaluation Method. Ecol. Indicators 130, 108056. doi:10.1016/j.ecolind.2021.108056
Lyons, S., Pentecost, A., and Tol, R. S. J. (2012). Socioeconomic Distribution of Emissions and Resource Use in Ireland. J. Environ. Manag. 112, 186–198. doi:10.1016/j.jenvman.2012.07.019
Maliene, V., Howe, J., and Malys, N. (2008). Sustainable Communities: Affordable Housing and Socio-Economic Relations. Local Economy 23 (4), 267–276. doi:10.1080/02690940802407989
Marlon, J. R., Wang, X., Mildenberger, M., Bergquist, P., Swain, S., Hayhoe, K., et al. (2021). Hot Dry Days Increase Perceived Experience with Global Warming. Glob. Environ. Change 68, 102247. doi:10.1016/j.gloenvcha.2021.102247
Matthews, H. S., Hendrickson, C. T., and Weber, C. L. (2008). The Importance of Carbon Footprint Estimation Boundaries. ACS Publications.
Pachauri, S. (2004). An Analysis of Cross-Sectional Variations in Total Household Energy Requirements in India Using Micro Survey Data. Energy policy 32 (15), 1723–1735. doi:10.1016/s0301-4215(03)00162-9
Qin, C. J. P. X. Z. (2009). Impacts of Household Pattern on Carbon Emission [J]. Chin. J. Popul. Sci. 5.
Qu, J., Zeng, J., Li, Y., Wang, Q., Maraseni, T., Zhang, L., et al. (2013). Household Carbon Dioxide Emissions from Peasants and Herdsmen in Northwestern Arid-alpine Regions, China. Energy Policy 57, 133–140. doi:10.1016/j.enpol.2012.12.065
Rong, P., Zhang, L., Qin, Y., Xie, Z., and Li, Y. (2018). Spatial Differentiation of Daily Travel Carbon Emissions in Small- and Medium-Sized Cities: An Empirical Study in Kaifeng, China. J. Clean. Prod. 197, 1365–1373. doi:10.1016/j.jclepro.2018.06.205
Rong, P., Zhang, Y., Qin, Y., Liu, G., and Liu, R. (2020). Spatial Differentiation of Carbon Emissions from Residential Energy Consumption: A Case Study in Kaifeng, China. J. Environ. Manage. 271, 110895. doi:10.1016/j.jenvman.2020.110895
Roseland, M. (2012). Toward Sustainable Communities: Solutions for Citizens and Their Governments. New Society Publishers.
Sun, W., and Huang, C. (2020). How Does Urbanization Affect Carbon Emission Efficiency? Evidence from China. J. Clean. Prod. 272, 122828. doi:10.1016/j.jclepro.2020.122828
Tu, H., and Liu, C. (2014). Calculation of CO2 Emission of Standard Coal. Coal Qual. Technol. [Epub ahead of print].
Wang, C., Zhan, J., Li, Z., Zhang, F., and Zhang, Y. (2019). Structural Decomposition Analysis of Carbon Emissions from Residential Consumption in the Beijing-Tianjin-Hebei Region, China. J. Clean. Prod. 208, 1357–1364. doi:10.1016/j.jclepro.2018.09.257
Wang, C., Zhan, J., Zhang, F., Liu, W., and Twumasi-Ankrah, M. J. (2021). Analysis of Urban Carbon Balance Based on Land Use Dynamics in the Beijing-Tianjin-Hebei Region, China. J. Clean. Prod. 281, 125138. doi:10.1016/j.jclepro.2020.125138
Wang, Z., and Liu, W. (2015). Determinants of CO2 Emissions from Household Daily Travel in Beijing, China: Individual Travel Characteristic Perspectives. Appl. Energ. 158, 292–299. doi:10.1016/j.apenergy.2015.08.065
Wang, Z., and Yang, L. (2014). Indirect Carbon Emissions in Household Consumption: Evidence from the Urban and Rural Area in China. J. Clean. Prod. 78, 94–103. doi:10.1016/j.jclepro.2014.04.041
Weber, C. L., and Matthews, H. S. (2008). Quantifying the Global and Distributional Aspects of American Household Carbon Footprint. Ecol. Econ. 66 (2-3), 379–391. doi:10.1016/j.ecolecon.2007.09.021
Wei, Y.-M., Liu, L.-C., Fan, Y., and Wu, G. (2007). The Impact of Lifestyle on Energy Use and CO2 Emission: An Empirical Analysis of China's Residents. Energy Policy 35 (1), 247–257. doi:10.1016/j.enpol.2005.11.020
Wilson, J., Tyedmers, P., and Spinney, J. E. L. (2013). An Exploration of the Relationship between Socioeconomic and Well-Being Variables and Household Greenhouse Gas Emissions. J. Ind. Ecol. 17 (6), 880–891. doi:10.1111/jiec.12057
Xu, X., Tan, Y., Chen, S., Yang, G., and Su, W. (2015). Urban Household Carbon Emission and Contributing Factors in the Yangtze River Delta, China. PLOS ONE 10 (4), e0121604. doi:10.1371/journal.pone.0121604
Xue, Y. (2020). Empirical Research on Household Carbon Emissions Characteristics and Key Impact Factors in Mining Areas. J. Clean. Prod. 256, 120470. doi:10.1016/j.jclepro.2020.120470
Yang, J., and Chen, B. (2011). Using LMDI Method to Analyze the Change of Industrial CO2 Emission from Energy Use in Chongqing. Front. Earth Sci. 5 (1), 103–109. doi:10.1007/s11707-011-0172-3
Yang, Q., Liu, G., Hao, Y., Coscieme, L., Zhang, J., Jiang, N., et al. (2018). Quantitative Analysis of the Dynamic Changes of Ecological Security in the Provinces of China through Emergy-Ecological Footprint Hybrid Indicators. J. Clean. Prod. 184, 678–695. doi:10.1016/j.jclepro.2018.02.271
Yang, S., Wang, Y., Ao, W., Bai, Y., and Li, C. (2018). Prediction and Analysis of CO2 Emission in Chongqing for the protection of Environment and Public Health. Ijerph 15 (3), 530. doi:10.3390/ijerph15030530
Yang, T., and Liu, W. (2017). Inequality of Household Carbon Emissions and its Influencing Factors: Case Study of Urban China. Habitat Int. 70, 61–71. doi:10.1016/j.habitatint.2017.10.004
Yang, Z., Fan, Y., and Zheng, S. (2016). Determinants of Household Carbon Emissions: Pathway toward Eco-Community in Beijing. Habitat Int. 57, 175–186. doi:10.1016/j.habitatint.2016.07.010
Ye, H., Ren, Q., Hu, X., Lin, T., Xu, L., Li, X., et al. (2017). Low-carbon Behavior Approaches for Reducing Direct Carbon Emissions: Household Energy Use in a Coastal City. J. Clean. Prod. 141, 128–136. doi:10.1016/j.jclepro.2016.09.063
Yin, X., Hao, Y., Yang, Z., Zhang, L., Su, M., Cheng, Y., et al. (2020). Changing Carbon Footprint of Urban Household Consumption in Beijing: Insight from a Nested Input-Output Analysis. J. Clean. Prod. 258, 120698. doi:10.1016/j.jclepro.2020.120698
Zhang, H., Shi, X., Cheong, T. S., and Wang, K. (2020). Convergence of Carbon Emissions at the Household Level in China: a Distribution Dynamics Approach. Energ. Econ. 92, 104956. doi:10.1016/j.eneco.2020.104956
Zhang, J., Li, F., Sun, M., Sun, S., Wang, H., Zheng, P., et al. (2021). Household Consumption Characteristics and Energy-Related Carbon Emissions Estimation at the Community Scale: A Study of Zengcheng, China. Clean. Responsible Consumption 2, 100016. doi:10.1016/j.clrc.2021.100016
Zhang, R., and Hanaoka, T. (2021). Deployment of Electric Vehicles in China to Meet the Carbon Neutral Target by 2060: Provincial Disparities in Energy Systems, CO2 Emissions, and Cost Effectiveness. Resour. Conservation Recycling 170, 105622. doi:10.1016/j.resconrec.2021.105622
Zhang, X., Luo, L., and Skitmore, M. (2015). Household Carbon Emission Research: an Analytical Review of Measurement, Influencing Factors and Mitigation Prospects. J. Clean. Prod. 103, 873–883. doi:10.1016/j.jclepro.2015.04.024
Keywords: household carbon emissions, survey, consumer lifestyle approach, community type, influencing factors, Beijing
Citation: Wang J, Hui W, Liu L, Bai Y, Du Y and Li J (2022) Estimation and Influencing Factor Analysis of Carbon Emissions From the Entire Production Cycle for Household consumption: Evidence From the Urban Communities in Beijing, China. Front. Environ. Sci. 10:843920. doi: 10.3389/fenvs.2022.843920
Received: 27 December 2021; Accepted: 22 February 2022;
Published: 14 April 2022.
Edited by:
Jinyan Zhan, Beijing Normal University, ChinaReviewed by:
Guofeng Wang, Shanxi University of Finance and Economics, ChinaCopyright © 2022 Wang, Hui, Liu, Bai, Du and Li. This is an open-access article distributed under the terms of the Creative Commons Attribution License (CC BY). The use, distribution or reproduction in other forums is permitted, provided the original author(s) and the copyright owner(s) are credited and that the original publication in this journal is cited, in accordance with accepted academic practice. No use, distribution or reproduction is permitted which does not comply with these terms.
*Correspondence: Yuping Bai, YmFpeXBAY3VnYi5lZHUuY24=
Disclaimer: All claims expressed in this article are solely those of the authors and do not necessarily represent those of their affiliated organizations, or those of the publisher, the editors and the reviewers. Any product that may be evaluated in this article or claim that may be made by its manufacturer is not guaranteed or endorsed by the publisher.
Research integrity at Frontiers
Learn more about the work of our research integrity team to safeguard the quality of each article we publish.