
95% of researchers rate our articles as excellent or good
Learn more about the work of our research integrity team to safeguard the quality of each article we publish.
Find out more
ORIGINAL RESEARCH article
Front. Environ. Sci. , 03 February 2022
Sec. Atmosphere and Climate
Volume 10 - 2022 | https://doi.org/10.3389/fenvs.2022.843582
This article is part of the Research Topic Air Pollution and Climate Change: Interactions and Co-mitigation View all 18 articles
 Bahadar Zeb1*Khan Alam2
 Allah Ditta3,4*Sami Ullah5,6
 Hayssam M. Ali7
 Muhammad Ibrahim8*
 Mohamed Z.M. Salem9
Introduction: The elemental composition and morphological study of particulate matter are very important to understand the nature of particles influencing the environment, climate, soil, and health.
Methods: The PM10 samples were collected during the winter season (2018) in Nowshera city, KPK, Pakistan, in three locations, namely, urban, industrial, and suburban. Scanning electron microscopy (SEM) and electron-dispersive X-ray (EDX) spectroscopy were used to examine the PM samples for morphological examination and elemental composition.
Results: The average mass concentrations of particulate matter (PM10) at the urban, industrial, and suburban locations were 238.5, 505.1, and 255.0 μg m−3, respectively. The average PM10 mass concentration was higher than the WHO and National Ambient Air Quality Standards (NAAQS). The results of EDX showed that samples contained variable amounts of thirteen elements, such as oxygen, carbon, silicon, magnesium, sodium, calcium, iron, aluminum, potassium, sulfur, titanium, gold, and chlorine. The probable sources of PM were biogenic like plant debris, pollen, and diatoms; geogenic like road dust and resuspended soil dust; and anthropogenic like carbonaceous particles and fly ash, as confirmed by SEM–EDX. The carbonaceous species, that is, OC and EC, had average values of 55.8 ± 13.1 and 4.6 ± 0.6, 5.2 ± 3.2, and 36.4 ± 10.4, 40.0 ± 2.6 and, 6.3 ± 0.2 in industrial, urban, and suburban locations, respectively. Similarly, OC/EC had average values of 12.0 ± 1.2, 8.0 ± 3.0, and 6.3 ± 0.2 in industrial, urban, and suburban locations, respectively. Highly significant correlations among water-soluble ions (K+), OC, and EC were found in each location.
Conclusions: The examined PM10 mass concentration in Nowshera city was above the thresholds of National Ambient Air Quality Standards (NAAQS) set by the U.S. Environmental Protection Agency (EPA). In addition, the concentration of pollutants was the highest at the industrial site compared to the other sites. The HYSPLIT model showed that the air mass originated from local sources like cement industries, brick kiln industries, and others.
Ambient air pollution is one of the biggest threats all around the world. In various countries, governments are developing technologies to decrease pollutants in the air. A different pollutant source emits pollutants in the form of gases and particulates into the earth’s atmosphere. Particulate matter (PM) is a suspended combination of solid particles and liquid droplets. Suspended PM contains dust and other particulates of size << 1–200 μm (Chandrasekaran et al., 1997). The most important physical properties of PM are its size and shape. Thus, the PM based on size is divided into two main groups or types. The aerodynamic diameter of the coarse particles spans from 2.5 to 10 µm. Mechanical disruption, that is, crushing, grinding, dust from roads, uncovered sand, industry, and construction fly ash from fossil fuel burning, as well as from non-combustible material, such as pollen grain and mold spores, causes them to form. The life span of coarse particles (PM10) ranges from minutes to hours, and their transit distance varies from 1 to 10 km. The aerodynamic diameter of fine particles (PM2.5) is less than 2.5 µm and comprises multiple sulfates, nitrates, and carbon compounds, as well as ammonium, hydrogen ions, and metals (Pb, Cu, Zn, Mn, and Fe). Fossil fuel combustion, biomass burning, smelting, and metal processing are the main producers of PM2.5. Their life span ranges from days to weeks, and they may travel between 100 and 1,000 km (Pipal and Satsangi, 2015).
PM has a key role in changing the Earth’s climate (Fowler et al., 2009). Particulate matter with an aerodynamic diameter of 2.5–10 µm (PM10-2.5) can readily pass through and settle in a thoracic area of airways (Berube et al., 2007). On the other hand, PM with an aerodynamic diameter between 1 and 2.5 μm (PM2.5-1) can enter deep into the distal lung, which eventually intensifies never-ending respiratory and cardiovascular diseases (Stevanovic et al., 2013). The number of particles and their surface area are also important because of the ultrafine proportion of coarse particles (Levin et al., 2016). There are very limited studies about the characterization of the size, chemical composition, and morphology of PM, which can provide substantial insights into their origin (Khan et al., 2010; Deshmukh et al., 2012; Kumar et al., 2013). The chemical composition of PM plays a significant function in its characterization and identification of various emission sources (Wu et al., 2013). For the determination of the chemical composition of PM, various techniques are used like XRF, ICP-MS, PIXE, INAA, and XPS. However, most of these techniques do not reveal chemical composition based on the shape and size of the object (Ram et al., 2012). For that reason, SEM-EDS is used to find sources based on morphological properties such as size, shape, equivalent spherical diameter, aspect ratio, circulatory, and perimeter (Kulkarni et al., 2011; Satsangi and Yadav, 2014; Mishra et al., 2015).
Because of the climatic implications, atmospheric carbonaceous particles have a key role (Frazer, 2002; Rajput et al., 2014). The types of carbonaceous PM including elemental carbon (EC) are generated from the combustion process and are called primary pollutants. Similarly, organic carbon (OC) can be emitted directly from anthropogenic and biogenic sources, that is, primary organic carbon, or it can be generated in the atmosphere by photochemical reactions, that is, secondary organic compounds via volatile organic carbon gas-to-particle conversion (Cao et al., 2003; Satsangi et al., 2012). Elemental carbon is strongly absorbed via solar radiation and has a significant role in climate change after CO2 (Hansen et al., 2000; Rajput et al., 2013). Similarly, OC scatters solar radiation and causes negative radiative forcing (Li and Bai, 2009).
Most cities in the world are facing challenges associated with air pollution. Air pollution has become a severe problem in densely populated nations like Pakistan, owing to industrialization and the uncontrolled release of air-polluting agents (Liu and Diamond, 2005; Bradsher and Barboza, 2006; Kahn and Yardley, 2007; Kerchich et al., 2011). Air pollution is caused by particulate matter (PM10, PM2.5) and other organic agents emitted by congested road traffic systems, as well as other reasons (Chow et al., 1994; Eldred et al., 1997). Dust, particles, and aerosols all contribute to air pollution, which disrupts the dynamic atmospheric balance (Dhakal, 2003; Rajput et al., 2017). PM, one of the most frequent ambient air pollutants, is currently the subject of epidemiological and toxicological research.
Previous research revealed that environmental epidemiologists focused mostly on PM with an aerodynamic diameter of 10 μm (PM10) (Goldberg et al., 2001; Janssen et al., 2002). According to a recent report by the World Health Organization (WHO) on ambient air pollution, annual mean PM10 concentrations increased by more than 5% in 720 cities throughout the world between 2008 and 2013 (Goel and Kumar, 2014). There are very limited studies on the characterization of PM in the Khyber Pakhtunkhwa Province of Pakistan (Alam et al., 2015; Zeb et al., 2018), and there is no study in Nowshera city. As per the National Disaster Management Plan 2012-22, Nowshera has been regarded as the most “at-risk district” in Khyber Pakhtunkhwa, Pakistan. Various types of hazards have been proposed for Nowshera, such as riverine floods, flash floods, earthquakes, land sliding, soil erosion, epidemics, drought, pest attacks, waterborne disease, hailstorms, as well as industrial fires, sectarian violence, terrorism, and refuges (District Disaster Management Unit, 2014). Therefore, it is the need of the hour to find the extent of different types of pollutants, especially air pollutants, including particulate matter. In the current study, we attempted to study the concentration of PM10, its chemical composition, and morphological analysis collected from three locations in Nowshera city. The morphology and chemical composition of samples were carried out through SEM and SEM–EDX, respectively. The current research will aid in the understanding of air quality, chemical composition, and sources of PM in Nowshera city. Furthermore, this study will help the researchers’ study the other types of PM in Nowshera.
Nowshera lies on a sandy plain surrounded by small hills. The city is an important hub connected by rails and roads to various locations of the country, like Malakand, Mardan, Peshawar, and Islamabad. The city is also surrounded by national highways (N-5) and motorways (M-1). Nowshera city is the fastest growing city with a population of 1.394 million and lies between 34.01°N latitude and 71.97°E longitude having an altitude of 128 m, which covers an area of 1748 km3. The climate of Nowshera is a local steppe climate. The winters are chilly from November to February, and the summers are hot from June to August. The average annual temperature is 22.4°C, and the rainfall is 532 mm (Bibi et al., 2015). The study was carried out in three locations in Nowshera city, namely, 1) urban location, 2) industrial location, and 3) suburban location (Figure 1).
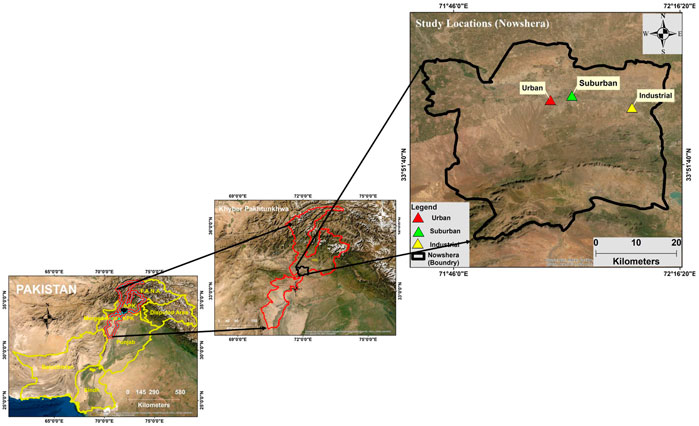
FIGURE 1. Map of study locations of Nowshera.
At the urban location, the sampling was performed at the top of a three-story building of Apostle Degree College located in the main city of Nowshera, near the main general bus stand and the main bazaar. In this area, there are many vehicle workshops and a huge traffic. Samplings were collected from the industrial location of Adamzai at the top of a two-story building surrounded by several factories, operating in the area, such as the Pakistan Tobacco Company, cotton, wool, newsprint, paper, marble, cement, and glass industries. The industrial location is also surrounded by mining areas. The sampling at a suburban location was performed in the city campus of Northern University at the top of a two-story building situated in Hakimabad. In Hakimabad, there are many housing colonies. This site is 5 km away from the urban location. Agricultural lands, woodlands, tea plantations, riverine, and marshy areas make up the majority of the region.
During March, April, and May 2018, a low-volume sampler (LVS) with one head was used to collect PM10 samples from 8 to 8 a.m. The LVS was run at a constant flow rate of 16 L/M for 24 h. PM10 was collected on quartz fiber filter substrates with a diameter of 47 mm and a pore size of 0.4 µm. The PM filters were removed using forceps, kept in a petri dish, conditioned, weighed, and stored in the refrigerator at 4°C for further investigation to prevent thermal deterioration and evaporation of volatile components. Using a microbalance, the gravimetric PM masses were computed by subtracting the blank filter’s initial average mass from the sampled filter’s final average mass. Before and after sampling, each filter substrate was weighted three times, and the mean value was computed.
Scanning electron microscopy (SEM) is an electron beam–based high-resolution surface imaging technique. The samples were analyzed by SEM (JSM-5910, JEOL Japan) equipped with energy-dispersive X-ray spectroscopy (INCA-200, United Kingdom) at the Centralized Resource Laboratory in the Department of Physics, University of Peshawar, to determine their shape and elemental composition. The PM produced from various sources may be recognized using this crucial technique, which is based on the shape and chemical content. Sections of a filter (1 mm by 1 mm) were cut from the center with scissors and put on an aluminum stub for analysis with double-sided tape. A very thin layer of gold (Au) was coated on the surface of each sample using a vacuum coating equipment called a gold sputter coater (SPI MODULE, United States) to improve conductivity and reduce electron charge. Six samples can be prepared at the same time using the sputter. Two photos of each sample were captured after they were placed in the corner of the SEM–EDX chamber. A microscope magnification of 550 was utilized to examine coarse particles, allowing detection areas of 60 × 150 m. The backscattered electron model was utilized to examine the particle shape and position. Every signal has an embedded detector that recognizes its related signal and rejects others, effectively blocking undesirable or background transmissions. The morphological parameters such as particle shape and physical diameter were manually measured by using all the images recorded for each field and particle (minimum, maximum, and mean). The findings were obtained from three randomly selected fields for each filter substrate, which offered representative results and minimized subjectivity. Individual EDX spectra of PM particles were obtained after scanning an electron beam to determine the elemental composition of the particles. The distinct peaks were recognized, and the peak intensities were converted to weight using the computer program’s quantifying function (Pipal and Satsangi, 2015). The Au data from EDX could not be used for quantitative purposes since the samples were Au-coated. As a result, the Au contribution was manually removed from the EDX spectra evaluation. SEM–EDX has also been used by other researchers to analyze the morphology and chemical composition (Chabas and Lefevre, 2000; Ma et al., 2001; Liu et al., 2005; Li et al., 2011).
The weight of individual elements was determined by the EDX examination of each particle. Blank quartz fiber filters were also subjected to EDX analysis, with the spectra results manually removed from those of the real individual aerosol particles. The weight of different elements was determined from the EDX spectra of each particle. For PM10, the average weight percent of each constituent was computed after determining the total number of particles in each constituent.
A portion of the sample, 1.5 cm2, was cut and analyzed by using a thermal/optical carbon aerosol analyzer (Sunset Laboratory, Forest Grove, OR) using the NIOSH 5040 (National Institute of Occupational Safety and Health) protocol based on thermal optical transmittance for the measurement of the carbonaceous group in PM like OC, EC, CC, and TC (TOT). Satsangi et al. (2012) present a precise approach for the analysis of OC-EC. Sucrose solution (3.2 g L−1) was used to standardize the instrument. A 10 L solution yields 32.0 1.8 g OC. Every day, the analyzer was calibrated for quality control using a blank punch of preheated quartz fiber filter and standard sucrose solutions. For blank filters, quartz filters were also sampled and evaluated in the same way. The overall blank concentrations for OC and EC were 0.5, 0.2, and 0.0, 0.02 g cm−2, respectively, from the quartz filters. These were removed from the aerosol samples’ observed OC and EC values. With 3 mM MSA (methane sulfonic acid) as eluent, water-soluble K+ was measured using a Dionex ICS 1100 Ion Chromatograph on an SCS 1 Cation Column and SCG 1 Guard Column. K+ has a detection limit of 0.06 ppm, a precision of 3.7%, and an accuracy of 1.5%. The blank filter was retrieved and examined for blank adjustments and then subtracted from the observed K+ concentrations in the PM samples for quality control.
The 24 h average PM mass concentrations at the three locations, that is, urban, industrial, and suburban, are investigated, as shown in Figure 2. The PM10 mass concentration at the industrial, urban, and suburban locations ranged from 412.52 to 597.60 μg m−³, 198.84–278.12 μg m−³ and 164.32–345.77 μg m−³, with an average value of 505.06, 255.04, and 238.48 μg m−³, respectively. The WHO permissible limit for 24 h PM10 mass concentrations is 50 μg m−3 and that of the National Ambient Air Quality Standards (NAAQS) is 150 μg m−³ (Davidson et al., 2005). In the three locations, that is, industrial, urban, and suburban locations, the measured values of PM mass concentration were 10.1, 5.1, and 4.8 times greater than the WHO standard and 3.4, 1.7, and 1.6 times higher than the NAAQS levels. There are heterogeneous sources of PM in the present study sites of Nowshera city. The urban location is surrounded by heavy transport and mechanical workshops; the industrial site is surrounded by Pakistan Tobacco Company, many small marble industries, vehicles, etc. At the suburban site, the emission sources were biomass burning and resuspended road dust. The high value of PM in these sites was due to the lack of vegetation cover area, bare earth, drought situation, unpaved roads, jammed traffic, and low-quality engines and fuels. The other reasons for high PM in the city were vehicular emissions, industrial emissions, re-suspension of road dust, emissions from brick kilns, and domestic combustion (Alam et al., 2011; Alam et al., 2015).
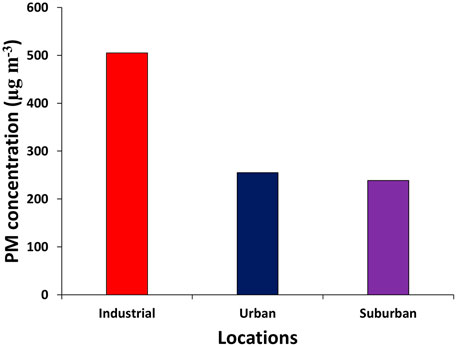
FIGURE 2. Mean PM10 concentration at three locations of Nowshera during the winter season.
Various researchers have found different concentrations of PM under different scenarios. For example, Zeb et al. (2018) reported a PM10 concentration of 638 μg m−3 during the autumn season in Peshawar city, which was high as compared to that of the present study. However, Mehmood et al. (2018) reported the PM10 mass concentration of 152.4, 97.22, 86.52, and 40.45 μg m−³ during autumn, winter, spring, and summer seasons, respectively, in Islamabad city which is a low concentration in comparison to the present study. Khodeir et al. (2012) and Yadav et al. (2014) also reported a low concentration of PM10. A PM10 concentration value of 480 ± 83 μg m−3 was recorded in Peshawar city using the GRIMM instrument, which is similar to the present study (Alam et al., 2015). Nowshera had higher concentrations than other cities such as Lahore, Pakistan (406 g m−³), Kolkata, India (197 g m−³), Quetta, Pakistan (331 g m−³), Karachi, Pakistan (302 g m−³), Islamabad, Pakistan (280 g m−³), Hangzhou, China (119 g m−³), Punjab, India (116 g m−³), Beijing-China (140 μg m−³), Shanghai-China (100 μg m−³), and Taipei-China (60 μg m−³) (Karar and Gupta, 2007; Cao et al., 2009; Awasthi et al., 2011).
The scanning electron microscopic images of PM10 collected in three locations (industrial, urban, and suburban) in Nowshera city are shown in Figures 3A–F. SEM micrographs of PM at three locations show that particles were of various shapes and sizes, like triangular, oval, capsule, sharp-edged, spherical, fluffy, rod-like, angular, agglomerates, and diatom sheets. Other researchers also pointed out particles of various shapes (Prabhu et al., 2019). One of the key processes in the formation of irregular particles is the aggregation process (Rodríguez et al., 2009). The incomplete combustion of fossil fuels and biomass combustion are the primary causes of agglomeration particle emissions (Li et al., 2016). In the present study, carbonaceous chains and agglomerates were also observed, which are emitted from the combustion of fossil fuel in vehicles and industries (Mogo et al., 2005; Prabhu et al., 2019). Spherical particles were largely seen in micrographs, which were usually investigative of high-temperature processes or burning processes (Mogo et al., 2005). Particulate matter from sheet-like structures and spherical carbonaceous particles were also observed. The existence of sheet-like structures related to clay is produced from geogenic sources, which are later resuspended from the surface of the earth by the wind. Figures 3E,F depict sharp-edged particles generated by anthropogenic activities such as construction and vehicular moments on the road. The figure also indicated biogenic particles, such as diatoms. The biological particles can be transported from 100 to 1,000 km from one place to another (Sofiev et al., 2006), which can also work as cloud condensation nuclei (Steiner et al., 2015). Fine PMs of size less than 1.5 µm are generated from fly ash emitted from the combustion process, and fine dust particles are produced from vehicular movement and construction activities (Mogo et al., 2005). The combustion of coal and biomass is one of the key sources of spherical soot particles. There are a large number of brick kilns surrounding the studied locations. The particles of irregular morphology are produced from crustal and construction activities. Therefore, the identified PM was grouped into geogenic, biogenic, and anthropogenic sources based on morphology.
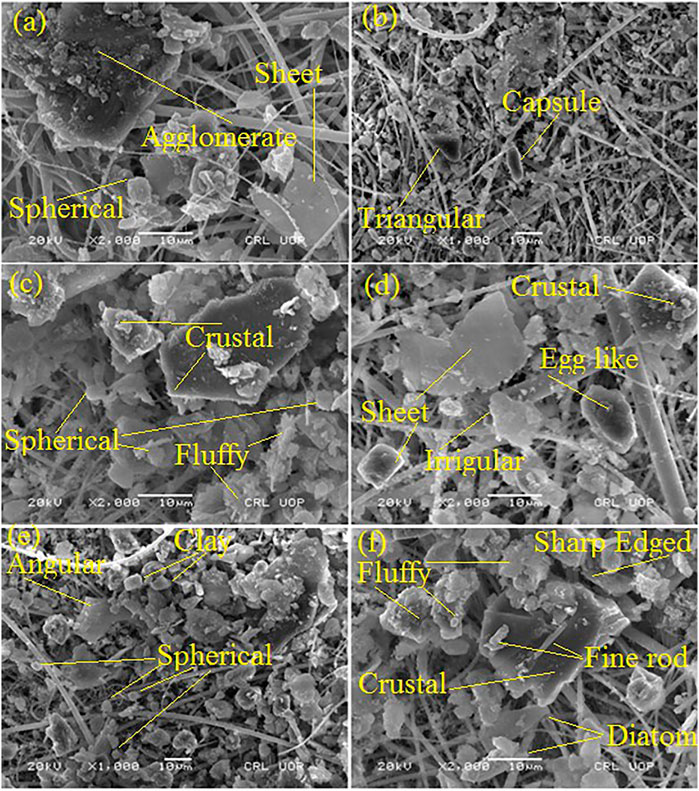
FIGURE 3. SEM images of collected PM in three locations that is, industrial (A,B), urban (C,D), and suburban (E,F).
High concentrations of Si and Al, as well as varied proportions of Mg, K, Fe, and Ca, distinguish aluminosilicates (Cuadros et al., 2015) and have diverse sources and compositions. Aluminosilicate particles of triangular shape are shown in Figure 4C. Figure 4A shows the presence of Si and O in the blank filter. Aluminosilicates, quartz, chlorides, calcium, and iron particles are found in irregular shapes (Pipal et al., 2011; Pachauri et al., 2013). The largest quantity of aerosol mass in the atmosphere is made up of these particles (Pipal and Satsangi, 2015). Soil dust, resuspended dust from roads and the earth’s crust, and anthropogenic activities (constructions, combustion processes, agriculture fields, and moments of vehicles on roads) are the main sources of these particles (Satsangi and Yadav, 2014).
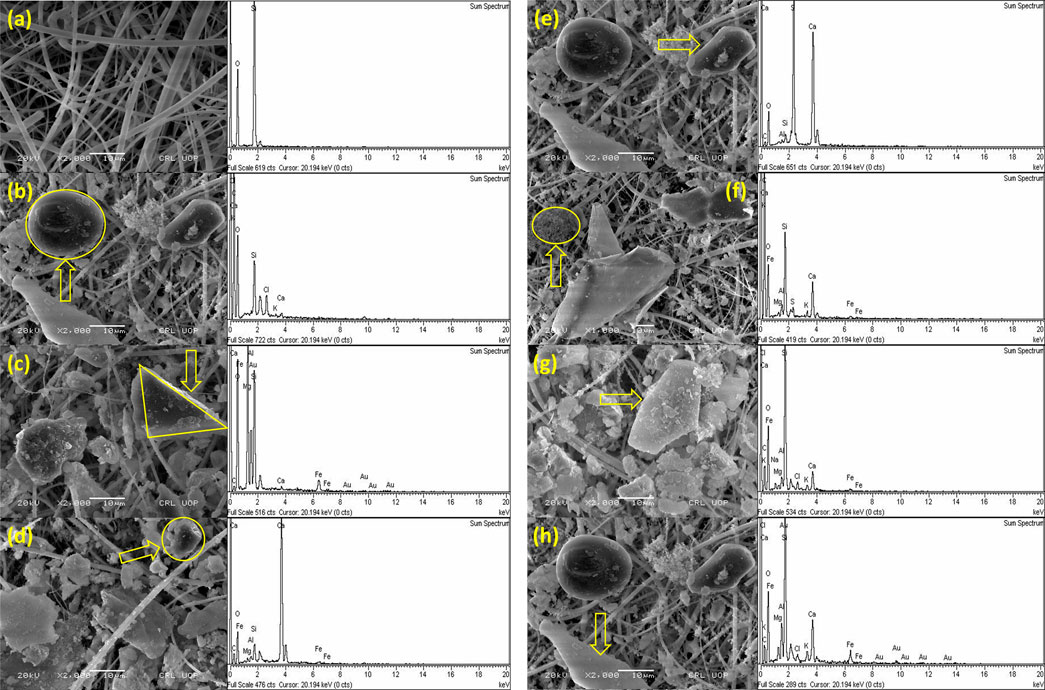
FIGURE 4. SEM–EDX of particulates. (A) Blank filter, (B) carbonaceous particles, (C) aluminosilicate particles, (D) calcium-rich particles, (E) sulfate particles, (F) carbonaceous agglomerates, (G) iron-rich particles, and (H) biological particles.
Aggregate carbonaceous particles are shown in Figure 4F. Aggregated carbonaceous particles are generated from the combustion of fossil fuel and can be simply detected by their unique structure, varying from linear to complex forms (Tumolva et al., 2010). High-temperature process regions such as industries emit these types of particles (Gao and Ji, 2018). Near the study locations, the construction activities were the source of carbonaceous particles. Figure 4B shows tarball particles with spherical morphology. The special property of tarballs is recognized by their spherical and amorphous structures and generally is not aggregated with other particles (Cong et al., 2010). The typical source of tarballs is incomplete biomass and fossil fuel burning. The existence of tarballs in the atmosphere has a key role in climate forcing and the regional haze because these affect the absorption and scattering of light efficiently (Hand et al., 2005). At Nowshera city, there was a mix of human activities including significant traffic congestion, which resulted in the emission of burnt or semi-burnt motor fuels, coal used in industries, generators used in suburban facilities, and tire abrasion (Satsangi and Yadav, 2014). Similar findings were reported in China by Cao et al. (2004).
The calcium (Ca) particles of irregular shape are shown in Figure 4D. These particles are rich in Ca and are found in various shapes and sizes. The sources of Ca-rich particles are natural, as well as anthropogenic, that is, marble industries produce marble dust during their processes (Reist, 1993).
As indicated in Figure 4G, Fe-rich particles were also found, emitted from a variety of sources. Fe particles are released into the atmosphere by both natural and manmade activities. With the combination of mineral dust elements such as C, Al, K, Si, Ca, Na, and Mg, Fe-rich particles are found abundantly in Fe, Ti, and O. Fe oxides with irregular shapes make up the majority of this type of particles.
The existence of sulfur (S) particles confirms their source from the process of combustion. Generally, sulfate particles are generated from sulfur dioxide (SO2) emitted through biomass and fossil fuel combustion (Pósfai et al., 1999). SO2 is adsorbed on the surface of already existing particles and results in secondary minerals (Li and Shao, 2009). The high concentration of S is produced in the atmosphere through the combustion process of diesel inside heavy-duty vehicles and is very dangerous to human health. The sulfate particles having a rotundate rectangular shape of the size of the order of 8.4 µm are shown in Figure 4E.
Biological particles were detected, as shown in Figure 4H, containing >80% (C + O) and a small amount (<10%) of Na, Si, and Al. These particles are generated due to the existence of pollen, algae, protozoa, bacteria, and fragments of leaves. The excrements and fragments are also the sources of biological particles. Since there are a large number of trees, plants, and vegetation areas around the sampling sites, these particles are found in various shapes and sizes.
Figures 5, 6 show the variation in the atomic percentage of thirteen elements, that is, carbon (C), oxygen (O), silicon (Si), magnesium (Mg), sodium (Na), calcium (Ca), iron (Fe), aluminum (Al), potassium (K), sulfur (S), titanium (Ti), gold (Au), and chlorine (Cl) calculated from EDX spectra at three sites. The elemental arrangements at 1) industrial, 2) urban, and 3) suburban locations are O > C > Si > Al > Mg > K > Ca > Fe > Cl > Ti > Na > S, O > C > Si > Al > Mg > K > Ca > Fe > Cl > Na > S, and O > C > Si > Al > Mg > K > Ca > Fe > Cl > Ti > Na, respectively. The elemental compositions of PM10 in three locations are very similar. The difference between the two elements, that is, S and Ti, is observed in the locations. Sulfur was found only at industrial and urban sites, and titanium was found at urban and industrial sites. A large number of industries, such as brick kilns, pharmaceutical, steel and iron, and electroplating industries, were around the sampling locations. Oxygen was found in high amounts in all sites, which might be due to oxides of metals emitted from the burning of fossil fuels, vehicular exhaust, and different industries. After O, C was found to be the major element during the study.

FIGURE 5. Percentage of different elements in PM10 in three locations.
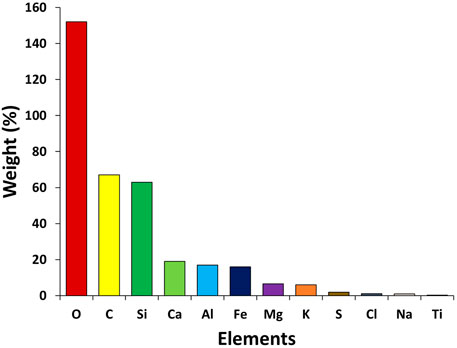
FIGURE 6. Average elemental weight percent in the area in Nowshera city.
The high amount of C after O in all three sites is a straightforward indicator of the various emission sources like fossil fuel and biomass burning, vehicular and coal burning emissions, energy sources in the industries, generator sets used in suburban facilities, and abraded vehicle tires (Shahid et al., 2013). Si is one of the most abundant elements in soil-derived mineral particles, according to the research. As a result, it could be caused by the transfer of airborne soil particles or fly ash created during industrial combustion. These particles were common in heavily industrialized areas and frequently contained Si (Herman et al., 1997; Baron and Willeke, 2001; Houghton et al., 2001). The anthropogenic sources of Al and Fe are industrial emissions, and their natural sources are mineral dust. The presence of soil-based elements like Ca, K, and Mg shows their existence from natural sources such as crustal resuspension and mineral dust (Kulshrestha et al., 2003; Kulshrestha et al., 2009; Tiwari et al., 2015). Regular open-air solid waste burning, as well as diverse industrial operations, can contribute to the elevated levels of Al (Pant et al., 2016; Mehra et al., 2020; Bangar et al., 2021) as found in the present study. From soil dust, Na was recognized as a crustal element. The presence of K has been linked to vegetation and biomass burning, and Cl has been linked to industrial emissions because it is not found in ambient natural minerals but is commonly used in industrial processes (Hsu et al., 2016). Due to building and road renovations/construction, Ca and Al are produced, which cause mineral dust (Wang et al., 2013; Mustaffa et al., 2014; Rajput et al., 2018).
Figure 7 depicts the mass concentrations of carbonaceous species such as OC and EC across the study period. In the industrial, urban, and suburban locations, OC ranged from 46.61 to 65.08, 29.01 to 43.69, and 38.19 to 41.91 μg m−3, with an average value of 55.85 ± 13.06, 36.35 ± 10.38, and 40.05 ± 2.64 μg m−3, respectively. Similarly, EC ranged from 4.18 to 5.06, 2.88 to 7.46, and 6.16 to 6.51 μg m−3, with an average value of 4.62 ± 0.62, 5.17 ± 3.23, and 6.33 ± 0.24 μg m−3 in the industrial, urban, and suburban locations, respectively. There are numerous sources of EC, including traffic pollutants, gasoline, diesel cars, and biomass burning (Ghauri et al., 2007; Zhang et al., 2008). OC is released directly from the combustion of fossil fuels or biomass, or by a chemical reaction known as secondary organic carbon (Satsangi et al., 2012). The high value of EC during the winter season might be due to less dispersion, wood burning, fuel burning, and coal burning in the region. Various researchers have also noted similar results regarding OC and EC values in different cities. For example, Satsangi et al. (2012) recorded OC and EC values during winter (37.4 ± 23.4, 6.3 ± 4.7 μg m−3), post-monsoon (33.0 ± 17.5, 3.4 ± 2.0 μg m−3), summer (29.4 ± 20.0, 2.6 ± 1.4 μg m−3), and monsoon (9.8 ± 9.6, 1.7 ± 1.3 μg m−3) in Dayalbagh, India. Similarly, Alam et al. (2012) reported the OC (63 ± 42 μg m−3) and EC (21 ± 15 μg m−3) values in the urban environment of Lahore, and these values were close to those observed in the present study.
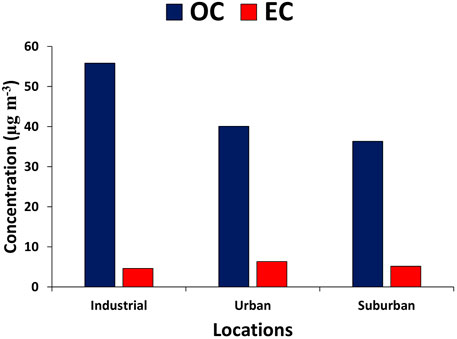
FIGURE 7. Concentration of OC and EC in three locations of the study area.
To validate the presence of primary and secondary organic aerosols, the ratios of organic carbon to elemental carbon (OC/EC) are utilized (Chow et al., 1996). OC/EC ratios have been reported by many researchers for various sources of emissions, such as biomass burning (3.8–13.2) (Zhang et al., 2007), coal smoke (2.5–10.5) (Chen et al., 2006), vehicular exhaust (2.5–5.00) (Schauer et al., 2002), kitchen emissions (4.3–7.7) (See and Balasubramanium, 2008), and wood combustion (16.8–40.00) (Schauer et al., 2001). In the present study, the ratios (OC/EC) ranged from 11.13 to 12.86, 5.85 to 10.06, and 6.19 to 6.44, with average values of 12 ± 1.22, 7.95 ± 2.96, and 6.32 ± 0.17 in the industrial, urban, and suburban locations, respectively (Table 1). The larger values of the OC/EC ratio have a variety of reasons, including the combustion of wood and coal during the winter season, which results in large emissions of volatile organic precursors. During the winter season, stagnant meteorological circumstances produce a large amount of secondary organic aerosols (SOA). The high OC/EC values during the winter season are noted by different researchers in different sites in China, including Shanghai (Feng et al., 2009), Tianjin (Li and Bai, 2009), Taiyuan (Meng et al., 2007), and Beijing (Dan et al., 2004). According to Alam et al., 2012, OC/EC ranged from 1.5 to 7.6, with an average value of 3.92 in the urban environment of Lahore, and was attributed to both biogenic and secondary aerosol formations. Table 1 shows the K+/OC and K+/EC ratios for the three locations examined. In comparison to fossil fuels, K+/OC and K+/EC ratios can be utilized to classify carbonaceous aerosol emission sources such as biomass burning. The K+/EC ratio has been reported to be high (0.21–0.46) for biomass burning and low (0.025–0.09) for fossil fuel emissions (Ram and Sarin, 2010). In the present work, in industrial locations, K+/OC and K+/EC ranged from 0.05 to 0.06 and 0.55 to 0.77, with an average of 0.05 ± 0.007 and 0.66 ± 0.15, respectively. K+/OC and K+/OC varied from 0.04–0.05, 0.31–0.43, with an average value of 0.050.007 and 0.370.38, respectively, across urban locations. K+/OC varied from 0.03 to 0.04, with an average value of 0.03, 0.004. K+/EC ranged from 0.22 to 0.56, with an average value of 0.24 0.022 in suburban locations, respectively. The average K+/EC (0.560.32) value was discovered to be suggestive of biomass burning. According to Ram and Sarin (2010), the K+/EC ratio has varied between 0.30 and 0.69, 0.08 and 0.19, and 0.15 and 0.98 in Allahabad, Jaduguda, and Kanpur, respectively.
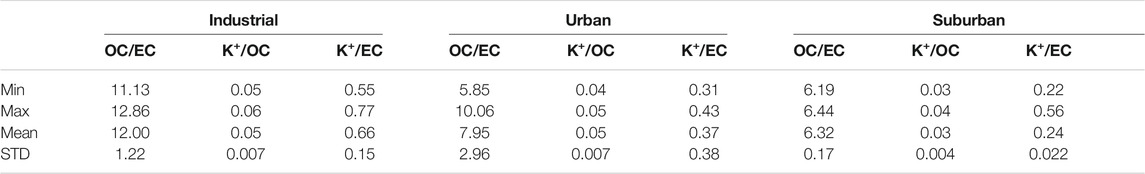
TABLE 1. Ratio of OC/EC, K+/OC, and K+/EC in three locations of the study area.
The correlation between OC, EC, and water-soluble ions (K+) is presented in Table 2. The origin of carbonaceous aerosols can be investigated by the correlation between OC and EC (Chow et al., 1996; Li and Bai, 2009). A very good correlation of OC to EC is found with a correlation coefficient of 0.92, 0.89, and 0.85 in industrial, urban, and suburban locations. OC has a good correlation with K+ in industrial (0.78), urban (0.71) and suburban (0.81) locations. Similarly, EC shows a strong relationship with K+ in three different settings: industrial (0.75), urban (0.73), and domestic (0.73) (0.87). The OC/EC ratios are commonly employed to interpret carbonaceous aerosol emission and transformation features. Our findings reveal that OC and EC are proportionate, implying that the main sources of OC and EC are the same, that is, motor vehicle exhaust, coal combustion, and biomass burning (Li and Bai, 2009). Similarly, K+ produced during combustion is utilized as a marker of biomass burning (Deshmukh et al., 2010; Deshmukh et al., 2012). At the three locations, there is a strong association between water-soluble ion (K+), OC, and EC, indicating that biomass burning is a significant source of carbonaceous aerosols (Pachauri et al., 2013). Earlier, Stone et al. (2010) found a strong correlation between OC, coal combustion, and other unidentified sources, which is in line with the findings of the present study.
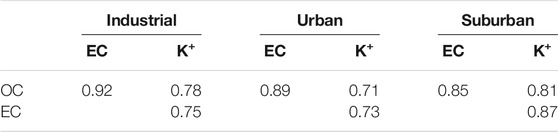
TABLE 2. Correlations between OC, EC, and water-soluble ions (K+) in study locations.
The number of water-soluble ions found in PM10 in three locations is listed in Table 3. In each location, the water-soluble ions followed the trend, that is, Ca2+ > Na+ > K+ > Mg2+ > NH4+. The values of the mass concentration of water-soluble ions in the industrial, urban and suburban locations were Ca2+ (30.05 ± 6.85, 18.31 ± 6.58, 17.87 ± 1.74 μg m−3) >Na+ (5.24 ± 0.17, 5.17 ± 0.40, 5.12 ± 0.09 μg m−3) > K+ (3.13 ± 1.13, 1.77 ± 0.77, 1.50 ± 0.84 μg m−3) > Mg2+ (2.50 ± 0.47, 1.27 ± 0.47, 1.26 ± 0.12 μg m−3). The values were high in the industrial region, followed by the urban and suburban regions. The concentration of NH4+ (1.25 ± 0.72 μg m−3) was highest in urban areas, followed by suburban (0.77 ± 0.14) and industrial (0.71 ± 0.02 μg m−3) locations. NH4+ was produced during the reactions of NH3 with HNO3, H2SO4, and their precursors. Generally, NH3 is generated from anthropogenic sources, particularly from agricultural activities and fossil fuel burning (Meng et al., 2011). During winter season, NH3 release from agricultural activities is decreased; therefore, NH4+ in winter is associated with traffic, coal combustion, and biomass burning activities against cold weather. The concentration of different soluble ions is similar to that of Shahid et al. (2019) who found the concentration of different ions as Na+ (4.4 ± 0.4 μg m−3), Ca2+ (42.6 ± 15.4 μg m−3) K+ (2.5 ± 0.5 μg m−3), Mg2+ (0 0.8 ± 0.3 μg m−3), and NH4+ (1.3 ± 0.7 μg m−3).
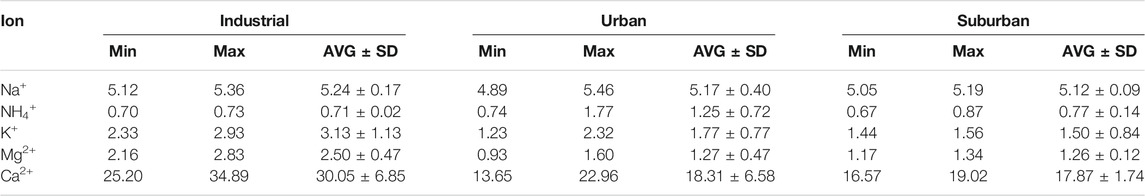
TABLE 3. Mass concentration of water-soluble ions in PM10 in three locations.
The results discussed in the previous sections show that biomass burning, cement, vehicular emissions, biological and brick kiln emissions were recognized to play a significant role in affecting the air quality of Nowshera city. However, it is suggested to have in-depth knowledge of the pathways traversed by the air masses converging in Nowshera city. Thus, to find out the source region of the air masses, analyses using the Hybrid-Single-Particle-Lagrangian Integrated-Trajectory (HYSPLIT) model were performed. The National Oceanic and Atmospheric Administration (NOAA) Air Resource Laboratory (ARL) Hybrid Single-Particle Lagrangian Integrated Trajectory (HYSPLIT) model was used to obtain these air mass back trajectories using the Global Data Assimilation System model’s final run data archive. In Figure 8, five-day back trajectory studies of the winter months were simulated at the local standard time (noon) at three heights (500, 1,000, and 1,500 m) above ground level at three heights (500, 1,000, and 1,500 m) above ground level. The obtained data suggest that anthropogenic emission sources dominate short trajectories coming from local areas near Nowshera city.
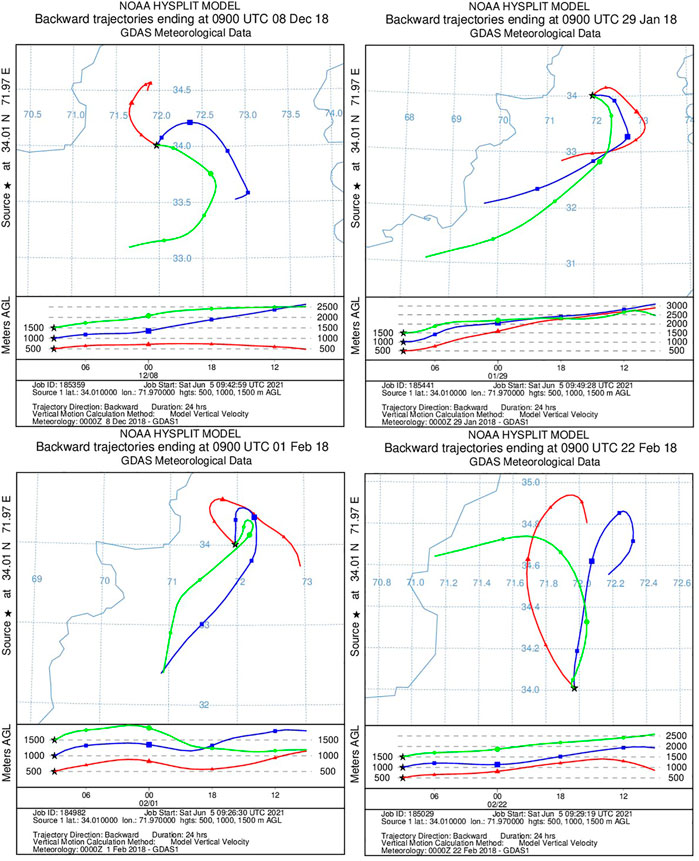
FIGURE 8. Five-day air mass back trajectories during the winter season (December, January, and February), calculated for three heights (500, 1,000, and 1,500 m) above the ground level indicating short trajectories from localized sources.
The current study has investigated the atmospheric pollution in Nowshera city for the first time. The examined PM mass concentration in Nowshera city was confirmed to be above the Environmental Protection Agency’s (EPA) and National Ambient Air Quality Standards (NAAQS) thresholds. This study revealed that the concentration of pollution was highest at the industrial site than at the other sites. The morphological and elemental characterization of the atmosphere of Nowshera has been investigated through SEM and EDX, respectively. Individual particulate matter characterizations through SEM–EDX have provided helpful insights corresponding to the PM sources based on the shape and size of particulates. Particulates produced from anthropogenic and geogenic sources were usually spherical and irregular in shape, but particles emitted from biogenic sources had a specific shape, according to the morphological investigation of particulate matter. The SEM results revealed various morphological shapes and sizes of pollutants, that is, sheets like rod-like, irregular, angular, triangular, spherical, agglomerates, and soot particles. The EDX results showed that O (oxygen), C (carbon), and Si (silicon) were the major pollutants in the study area. We have observed the values of OC and EC in industrial (55.85 ± 13.06 and 4.62 ± 0.62), urban (5.17 ± 3.23 and 36.35 ± 10.38), and suburban (40.05 ± 2.64 and 6.33 ± 0.24) locations. Similarly, the average values of OC/EC were 12 ± 1.22, 7.95 ± 2.96, and 6.32 ± 0.17 in industrial, urban, and suburban locations, respectively. In industrial, urban, and suburban locations, the values of K+/OC and K+/EC are found to be (0.05 ± 0.007 and 0.66 ± 0.15), (0.05 ± 0.007 and 0.37 ± 0.38), and (0.03 ± 0.004 and 0.24 ± 0.022), respectively. In our study, we observed a good correlation of water-soluble ions (K+), OC, and EC, which supports the idea that the sources of carbonaceous matter are biomass burning. In addition, Nowshera city has a large number of factories, that is, cement industries, brick kiln industries, and others that release a large number of emissions because of the poor technology used in the manufacturing processes. For that reason, it can be interesting to note that the air masses from various directions have a significant effect on the air quality in Nowshera city. The results of the HYSPLIT model show that the air mass originates from local sources.
The original contributions presented in the study are included in the article/supplementary material; further inquiries can be directed to the corresponding authors.
BZ contributed to conceptualization; BZ and SU helped with data curation; BZ, KA, AD, and SU assissted with formal analysis; HA, MI, and MS acquired funding; KA and SU framed the methodology; KA, HA, MI, and MS involved in project administration; KA, AD, and SU helped with software; AD, HA, MI, and MS validated the study; AD contributed to visualization; BZ and KA wrote the original draft; and BZ, AD, SU, HA, MI, and MS reviewed and edited the manuscript. All authors have read and agreed to the published version of the manuscript.
The authors declare that the research was conducted in the absence of any commercial or financial relationships that could be construed as a potential conflict of interest.
All claims expressed in this article are solely those of the authors and do not necessarily represent those of their affiliated organizations, or those of the publisher, the editors, and the reviewers. Any product that may be evaluated in this article, or claim that may be made by its manufacturer, is not guaranteed or endorsed by the publisher.
The authors thank the Director of the Centralized Resource Laboratory University of Peshawar for help with SEM–EDX analysis. The authors thank the working team (http://ready.arl.noaa.gov) for the HYSPLIT trajectories. The authors acknowledge the financial support by Researchers Supporting Project number (RSP-2021/123) King Saud University, Riyadh, Saudi Arabia.
Alam, K., Blaschke, T., Madl, P., Mukhtar, A., Hussain, M., Trautmann, T., et al. (2011). Aerosol Size Distribution and Mass Concentration Measurements in Various Cities of Pakistan. J. Environ. Monit. 13, 1944–1952. doi:10.1039/c1em10086f
Alam, K., Rahman, N., Khan, H. U., Haq, B. S., and Rahman, S. (2015). Particulate Matter and its Source Apportionment in Peshawar, Northern Pakistan. Aerosol Air Qual. Res. 15, 634–647. doi:10.4209/aaqr.2014.10.0250
Alam, K., Trautmann, T., Blaschke, T., and Majid, H. (2012). Aerosol Optical and Radiative Properties during Summer and Winter Seasons over Lahore and Karachi. Atmos. Environ. 50, 234–245. doi:10.1016/j.atmosenv.2011.12.027
Awasthi, A., Agarwal, R., Mittal, S. K., Singh, N., Singh, K., and Gupta, P. K. (2011). Study of Size and Mass Distribution of Particulate Matter Due to Crop Residue Burning with Seasonal Variation in Rural Area of Punjab, India. J. Environ. Monit. 13, 1073–1081. doi:10.1039/c1em10019j
Bangar, V., Mishra, A. K., Jangid, M., and Rajput, P. (2021). Elemental Characteristics and Source Apportionment of PM2.5 during the post-monsoon Season in Delhi, India. Front. Sustain. Cities 3, 18. doi:10.3389/frsc.2021.648551
Baron, P. A., and Willeke, K. (2001). Aerosol Measurement: Principles, Techniques, and Applications. Second ed. New York: John Wiley & Sons, 15.
BéruBé, K., Balharry, D., Sexton, K., Koshy, L., and Jones, T. (2007). Combustion-derived Nanoparticles: Mechanisms of Pulmonary Toxicity. Clin. Exp. Pharmacol. Physiol. 34 (10), 1044–1050. doi:10.1111/j.1440-1681.2007.04733.x
Bibi, S., Alam, K., Bibi, H., Khan, H., and SafyaHaq, B. (2015). Variation in Aerosol Optical Depth and its Impact on Longwave Radioactive Properties in Northern Areas of Pakistan. J. GeoSpace Sci. 1, 28–43.
Bradsher, K., and Barboza, D. (2006). Pollution from Chinese Coal Casts a Global Shadow. The New York Times.
Cao, J.-J., Zhu, C.-S., Chow, J. C., Watson, J. G., Han, Y.-M., Wang, G.-h., et al. (2009). Black Carbon Relationships with Emissions and Meteorology in Xi'an, China. Atmos. Res. 94 (2), 194–202. doi:10.1016/j.atmosres.2009.05.009
Cao, J. J., Lee, S. C., Ho, K. F., Zou, S. C., Fung, K., Li, Y., et al. (2004). Spatial and Seasonal Variations of Atmospheric Organic Carbon and Elemental Carbon in Pearl River Delta Region, China. Atmos. Environ. 38, 4447–4456. doi:10.1016/j.atmosenv.2004.05.016
Cao, J., Lee, S. C., Ho, K. F., Zhang, X. Y., Zou, S. C., Fung, K., et al. (2003). Characteristics of Carbonaceous Aerosol in Pearl River Delta Region, China during 2001 Winter Period. Atmos. Environ. 37, 1451–1460. doi:10.1016/s1352-2310(02)01002-6
Chabas, A., and Lefèvre, R. A. (2000). Chemistry and Microscopy of Atmospheric Particulates at Delos (Cyclades-Greece). Atmos. Environ. 34 (2), 225–238. doi:10.1016/s1352-2310(99)00255-1
Chandrasekaran, G. E., Ravichandran, C., and Shetty, N. (1997). Ambient Air Quality at Selected Sites in Bangalore City. Indian J. Environ. Protect. 17 (3), 184–188.
Chen, J., Tan, M., Nemmar, A., Song, W., Dong, M., Zhang, G., et al. (2006). Quantification of Extrapulmonary Translocation of Intratracheal-Instilled Particles In Vivo in Rats: Effect of Lipopolysaccharide. Toxicology 222 (3), 195–201. doi:10.1016/j.tox.2006.02.016
Chow, J. C., Watson, J. G., Fujita, E. M., Lu, Z., Lawson, D. R., and Ashbaugh, L. L. (1994). Temporal and Spatial Variations of PM2.5 and PM10 Aerosol in the Southern California Air Quality Study. Atmos. Environ. 28 (12), 2061–2080. doi:10.1016/1352-2310(94)90474-x
Chow, J. C., Watson, J. G., Lu, Z., Lowenthal, D. H., Frazier, C. A., Solomon, P. A., et al. (1996). Descriptive Analysis of PM2.5 and PM10 at Regionally Representative Locations during SJVAQS/AUSPEX. Atmos. Environ. 30, 2079–2112. doi:10.1016/1352-2310(95)00402-5
Cong, Z., Kang, S., Dong, S., Liu, X., and Qin, D. (2010). Elemental and Individual Particle Analysis of Atmospheric Aerosols from High Himalayas. Environ. Monit. Assess. 160 (1), 323–335. doi:10.1007/s10661-008-0698-3
Cuadros, J., Diaz-Hernandez, J. L., Sanchez-Navas, A., and Garcia-Casco, A. (2015). Role of clay Minerals in the Formation of Atmospheric Aggregates of Saharan Dust. Atmos. Environ. 120, 160–172. doi:10.1016/j.atmosenv.2015.08.077
Dan, M., Zhuang, G., Li, X., Tao, H., and Zhuang, Y. (2004). The Characteristics of Carbonaceous Species and Their Sources in PM2.5 in Beijing. Atmos. Environ. 38, 3443–3452. doi:10.1016/j.atmosenv.2004.02.052
Davidson, C. I., Phalen, R. F., and Solomon, P. A. (2005). Airborne Particulate Matter and Human Health: a Review. Aerosol Sci. Techn. 39 (8), 737–749. doi:10.1080/02786820500191348
Deshmukh, D. K., Deb, M. K., Tsai, Y. I., and Mkoma, S. L. (2010). Atmospheric Ionic Species in PM2.5 and PM1 Aerosols in the Ambient Air of Eastern central India. J. Atmos. Chem. 66, 81–100. doi:10.1007/s10874-011-9194-1
Deshmukh, D. K., Tsai, Y. I., Deb, M. K., and Zarmpas, P. (2012). Characteristics and Sources of Water-Soluble Ionic Species Associated with PM10 Particles in the Ambient Air of central India. Bull. Environ. Contam. Toxicol. 89, 1091–1097. doi:10.1007/s00128-012-0806-5
Dhakal, S. (2003). Implications of Transportation Policies on Energy and Environment in Kathmandu Valley, Nepal. Energy Policy 31 (14), 1493–1507. doi:10.1016/s0301-4215(02)00205-7
District Disaster Management Unit (2014). District Disaster Risk Management Plan Nowshera DDMU. Peshawar: Provincial Disaster Management Authority. Retrieved from: https://www.pdma.gov.pk/sub/uploads/drm_road_map_2014-19%20(1).pdf.
Eldred, R. A., Cahill, T. A., and Flocchini, R. G. (1997). Composition of PM2.5 and PM10 Aerosols in the IMPROVE Network. J. Air Waste Manag. Assoc. 47 (2), 194–203. doi:10.1080/10473289.1997.10464422
Feng, Y., Chen, Y., Guo, H., Zhi, G., Xiong, S., Li, J., et al. (2009). Characteristics of Organic and Elemental Carbon in PM2.5 Samples in Shanghai, China. Atmos. Res. 92, 434–442. doi:10.1016/j.atmosres.2009.01.003
Fowler, D., Pilegaard, K., Sutton, M. A., Ambus, P., Raivonen, M., Duyzer, J., et al. (2009). Atmospheric Composition Change: Ecosystems-Atmosphere Interactions. Atmos. Environ. 43 (33), 5193–5267. doi:10.1016/j.atmosenv.2009.07.068
Frazer, L. (2002). Seeing through Soot. Environ. Health Perspect. 110, A471–A473. doi:10.1289/ehp.110-a470
Gao, Y., and Ji, H. (2018). Microscopic Morphology and Seasonal Variation of Health Effect Arising from Heavy Metals in PM2.5 and PM10: One-Year Measurement in a Densely Populated Area of Urban Beijing. Atmos. Res. 212, 213–226. doi:10.1016/j.atmosres.2018.04.027
Ghauri, B., Lodhi, A., and Mansha, M. (2007). Development of Baseline (Air Quality) Data in Pakistan. Environ. Monit. Assess. 127, 237–252. doi:10.1007/s10661-006-9276-8
Goel, A., and Kumar, P. (2014). A Review of Fundamental Drivers Governing the Emissions, Dispersion and Exposure to Vehicle-Emitted Nanoparticles at Signalised Traffic Intersections. Atmos. Environ. 97, 316–331. doi:10.1016/j.atmosenv.2014.08.037
Goldberg, M. S., Burnett, R. T., Bailar, J. C., Brook, J., Bonvalot, Y., Tamblyn, R., et al. (2001). The Association between Daily Mortality and Ambient Air Particle Pollution in Montreal, Quebec. Environ. Res. 86 (1), 12–25. doi:10.1006/enrs.2001.4242
Hand, J. L., Malm, W. C., Laskin, A., Day, D., Lee, T., Wang, C., et al. (2005). Optical, Physical, and Chemical Properties of Tar Balls Observed during the Yosemite Aerosol Characterization Study. J. Geophys. Res. Atmos. 110, 1–14. doi:10.1029/2004jd005728
Hansen, J., Sato, M., Ruedy, R., Lacis, A., and Oinas, V. (2000). Global Warming in the Twenty-First Century: An Alternative Scenario. Proc. Natl. Acad. Sci. 97, 9875–9880. doi:10.1073/pnas.170278997
Herman, J. R., Bhartia, P. K., Torres, O., Hsu, C., Seftor, C., and Celarier, E. (1997). Global Distribution of UV-Absorbing Aerosols from Nimbus 7/TOMS Data. J. Geophys. Res. 102, 16911–16922. doi:10.1029/96jd03680
Houghton, J. T., Ding, Y., Griggs, D. J., Noguer, M., van der Linden, P. J., Dai, X., et al. (2001). Climate Change. Cambridge, United Kingdom and New York, NY, USA: Cambridge University Press, pp881.
Hsu, C.-Y., Chiang, H.-C., Lin, S.-L., Chen, M.-J., Lin, T.-Y., and Chen, Y.-C. (2016). Elemental Characterization and Source Apportionment of PM 10 and PM 2.5 in the Western Coastal Area of central Taiwan. Sci. Total Environ. 541, 1139–1150. doi:10.1016/j.scitotenv.2015.09.122
Janssen, N. A. H., Schwartz, J., Zanobetti, A., and Suh, H. H. (2002). Air Conditioning and Source-specific Particles as Modifiers of the Effect of PM(10) on Hospital Admissions for Heart and Lung Disease. Environ. Health Perspect. 110 (1), 43–49. doi:10.1289/ehp.0211043
Kahn, J., and Yardley, J. (2007). As China Roars, Pollution Reaches Deadly Extremes. New York Times 26 (8), A1.
Karar, K., and Gupta, A. K. (2007). Source Apportionment of PM10 at Residential and Industrial Sites of an Urban Region of Kolkata, India. Atmos. Res. 84, 30–41. doi:10.1016/j.atmosres.2006.05.001
Kerchich, Y., Kerbachi, R., and Khatraoui, H. (2011). Ambient Air Levels of Aromatic Organic Compounds in the Urban Area of Algiers, Algeria. Asian J. Chem. 23 (1), 323.
Khan, M. F., Shirasuna, Y., Hirano, K., and Masunaga, S. (2010). Characterization of PM2.5, PM2.5-10 and PM>10 in Ambient Air, Yokohama, Japan. Atmos. Res. 96 (1), 159–172. doi:10.1016/j.atmosres.2009.12.009
Khodeir, M., Shamy, M., Alghamdi, M., Zhong, M., Sun, H., Costa, M., et al. (2012). Source Apportionment and Elemental Composition of PM2.5 and PM10 in Jeddah City, Saudi Arabia. Atmos. Pollut. Res. 3, 331–340. doi:10.5094/apr.2012.037
Kulkarni, P., Baron, P. A., and Willeke, K. (2011). Aerosol Measurement: Principles, Techniques, and Applications. 3rd ed. Hoboken: Wiley.
Kulshrestha, U. C., Kulshrestha, M. J., Sekar, R., Sastry, G. S. R., and Vairamani, M. (2003). Chemical Characteristics of Rainwater at an Urban Site of South-central India. Atmos. EnvironmentEnviron 37, 3019–3026. doi:10.1016/s1352-2310(03)00266-8
Kulshrestha, U. C., Reddy, L. A. K., Satyanarayana, J., and Kulshrestha, M. J. (2009). Real-time Wet Scavenging of Major Chemical Constituents of Aerosols and Role of Rain Intensity in Indian Region. Atmos. Environ. 43, 5123–5127. doi:10.1016/j.atmosenv.2009.07.025
Kumar, S., Verma, M. K., and Srivastava, A. K. (2013). Ultrafine Particles in Urban Ambient Air and Their Health Perspectivesfine Particles in Urban Ambient Air and Their Health Perspectives. Rev. Environ. Health 28, 117–128. doi:10.1515/reveh-2013-0008
Levin, M., Witschger, O., Bau, S., Jankowska, E., Koponen, I. K., Koivisto, A. J., et al. (2016). Can We Trust Real Time Measurements of Lung Deposited Surface Area Concentrations in Dust from Powder Nanomaterials? Aerosol Air Qual. Res. 16, 1105–1117. doi:10.4209/aaqr.2015.06.0413
Li, W., and Bai, Z. (2009). Characteristics of Organic and Elemental Carbon in Atmospheric Fine Particles in Tianjin, China. Particuology 7, 432–437. doi:10.1016/j.partic.2009.06.010
Li, W. J., and Shao, L. Y. (2009). Observation of Nitrate Coatings on Atmospheric mineral Dust Particles. Atmos. Chem. Phys. 9, 1863–1871. doi:10.5194/acp-9-1863-2009
Li, W., Shao, L., Shen, R., Yang, S., Wang, Z., and Tang, U. (2011). Internally Mixed Sea Salt, Soot, and Sulfates at Macao, a Coastal City in South China. J. Air Waste Manag. Assoc. 61 (11), 1166–1173. doi:10.1080/10473289.2011.603996
Li, W., Shao, L., Zhang, D., Ro, C.-U., Hu, M., Bi, X., et al. (2016). A Review of Single Aerosol Particle Studies in the Atmosphere of East Asia: Morphology, Mixing State, Source, and Heterogeneous Reactions. J. Clean. Prod. 112, 1330–1349. doi:10.1016/j.jclepro.2015.04.050
Liu, J., and Diamond, J. (2005). China's Environment in a Globalizing World. Nature 435 (7046), 1179–1186. doi:10.1038/4351179a
Liu, X., Zhu, J., Van Espen, P., Adams, F., Xiao, R., Dong, S., et al. (2005). Single Particle Characterization of spring and Summer Aerosols in Beijing: Formation of Composite Sulfate of Calcium and Potassium. Atmos. Environ. 39 (36), 6909–6918. doi:10.1016/j.atmosenv.2005.08.007
Ma, C.-J., Kasahara, M., Höller, R., and Kamiya, T. (2001). Characteristics of Single Particles Sampled in Japan during the Asian Dust-Storm Period. Atmos. Environ. 35 (15), 2707–2714. doi:10.1016/s1352-2310(00)00410-6
Mehmood, T., Tianle, Z., Ahmad, I., Li, X., Shen, F., Akram, W., et al. (2018). “Variations of PM2. 5, PM10 Mass Concentration and Health Assessment in Islamabad, Pakistan,” in IOP Conference Series: Earth and Environmental Science, Shanghai, China, January 19–21, 2018, 012031.
Mehra, M., Zirzow, F., Ram, K., and Norra, S. (2020). Geochemistry of PM2.5 Aerosols at an Urban Site, Varanasi, in the Eastern Indo-Gangetic Plain during Pre-monsoon Season. Atmos. Res. 234, 104734. doi:10.1016/j.atmosres.2019.104734
Meng, Z. Y., Jiang, X. M., Yan, P., Lin, W. L., Zhang, H. D., and Wang, Y. (2007). Characteristics and Sources of PM2.5 and Carbonaceous Species during Winter in Taiyuan, China. Atmos. Environ. 41, 6901–6908. doi:10.1016/j.atmosenv.2007.07.049
Meng, Z. Y., Lin, W. L., Jiang, X. M., Yan, P., Wang, Y., Zhang, Y. M., et al. (2011). Characteristics of Atmospheric Ammonia over Beijing, China. Atmos. Chem. Phys. 11, 6139–6151. doi:10.5194/acp-11-6139-2011
Mishra, S. K., Agnihotri, R., Yadav, P. K., Singh, S., Prasad, M. V. S. N., Praveen, P. S., et al. (2015). Morphology of Atmospheric Particles over Semi-arid Region (Jaipur, Rajasthan) of India: Implications for Optical Properties. Aerosol Air Qual. Res. 15, 974–984. doi:10.4209/aaqr.2014.10.0244
Mogo, S., Cachorro, V. E., and de Frutos, A. M. (2005). Morphological, Chemical and Optical Absorbing Characterization of Aerosols in the Urban Atmosphere of Valladolid. Atmos. Chem. Phys. 5 (10), 2739–2748. doi:10.5194/acp-5-2739-2005
Mustaffa, N. I. H., Latif, M. T., Ali, M. M., and Khan, M. F. (2014). Source Apportionment of Surfactants in marine Aerosols at Different Locations along the Malacca Straits. Environ. Sci. Pollut. Res. 21, 6590–6602. doi:10.1007/s11356-014-2562-z
Pachauri, T., Singla, V., Satsangi, A., Lakhani, A., and Kumari, K. M. (2013). SEM-EDX Characterization of Individual Coarse Particles in Agra, India. Aerosol Air Qual. Res. 13, 523–536. doi:10.4209/aaqr.2012.04.0095
Pant, P., Baker, S. J., Goel, R., Guttikunda, S., Goel, A., Shukla, A., et al. (2016). Analysis of Size-Segregated winter Season Aerosol Data from New Delhi, India. Atmos. Pollut. Res. 7, 100–109. doi:10.1016/j.apr.2015.08.001
Pipal, A. S., and Gursumeeran Satsangi, P. (2015). Study of Carbonaceous Species, Morphology and Sources of fine (PM2.5) and Coarse (PM10) Particles along with Their Climatic Nature in India. Atmos. Res. 154, 103–115. doi:10.1016/j.atmosres.2014.11.007
Pipal, A. S., Kulshrestha, A., and Taneja, A. (2011). Characterization and Morphological Analysis of Airborne PM2.5 and PM10 in Agra Located in north central India. Atmos. EnvironmentEnviron 45, 3621–3630. doi:10.1016/j.atmosenv.2011.03.062
Pósfai, M., Anderson, J. R., Buseck, P. R., Sievering, H., and Buseck, P. R. (1999). Soot and Sulfate Particles in the Remote Marine Troposphere. J. Geophys. Res. 104, 21685–21693.
Prabhu, V., Shridhar, V., and Choudhary, A. (2019). Investigation of the Source, Morphology, and Trace Elements Associated with Atmospheric PM10 and Human Health Risks Due to Inhalation of Carcinogenic Elements at Dehradun, an Indo-Himalayan City. SN Appl. Sci. 1 (5), 429. doi:10.1007/s42452-019-0460-1
Rajput, P., Anjum, M. H., and Gupta, T. (2017). One Year Record of Bioaerosols and Particles Concentration in Indo-Gangetic Plain: Implications of Biomass Burning Emissions to High-Level of Endotoxin Exposure. Environ. Pollut. 224, 98–106. doi:10.1016/j.envpol.2017.01.045
Rajput, P., Sarin, M., and Kundu, S. S. (2013). Atmospheric Particulate Matter (PM2.5), EC, OC, WSOC and PAHs from NE-Himalaya: Abundances and Chemical Characteristics. Atmos. Pollut. Res. 4 (2), 214–221. doi:10.5094/apr.2013.022
Rajput, P., Sarin, M., Sharma, D., and Singh, D. (2014). Characteristics and Emission Budget of Carbonaceous Species from post-harvest Agricultural-Waste Burning in Source Region of the Indo-Gangetic Plain. Tellus B: Chem. Phys. Meteorology 66 (1), 21026. doi:10.3402/tellusb.v66.21026
Rajput, P., Singh, D. K., Singh, A. K., and Gupta, T. (2018). Chemical Composition and Source-Apportionment of Sub-micron Particles during Wintertime over Northern India: New Insights on Influence of Fog-Processing. Environ. Pollut. 233, 81–91. doi:10.1016/j.envpol.2017.10.036
Ram, K., and Sarin, M. M. (2010). Spatio-temporal Variability in Atmospheric Abundances of EC, OC and WSOC over Northern India. J. Aerosol Sci. 41, 88–98. doi:10.1016/j.jaerosci.2009.11.004
Ram, S. S., Majumdar, S., Chaudhuri, P., Chanda, S., Santra, S. C., Maiti, P. K., et al. (2012). SEMEDS: An Important Tool for Air Pollution Bio-Monitoring. Micron 43, 490–493. doi:10.1016/j.micron.2011.07.007
Reist, P. C. (1993). Aerosol Science and Technology. Second ed. North Carolina, USA: R.R. Donnelley & Sons Company, 5.
Rodríguez, I., Galí, S., and Marcos, C. (2009). Atmospheric Inorganic Aerosol of a Non-industrial City in the center of an Industrial Region of the North of Spain, and its Possible Influence on the Climate on a Regional Scale. Environ. Geol. 56 (8), 1551–1561. doi:10.1007/s00254-008-1253-9
Satsangi, A., Pachauri, T., Singla, V., Lakhani, A., and Kumari, K. M. (2012). Organic and Elemental Carbon Aerosols at a Suburban Site. Atmos. Res. 113, 13–21. doi:10.1016/j.atmosres.2012.04.012
Satsangi, P. G., and Yadav, S. (2014). Characterization of PM2.5 by X-ray Diffraction and Scanning Electron Microscopy-Energy Dispersive Spectrometer: its Relation with Different Pollution Sourcesffraction and Scanning Electron Microscopy–Energy Dispersive Spectrometer: its Relation with Different Pollution Sources. Int. J. Environ. Sci. Technol. 11, 217–232. doi:10.1007/s13762-012-0173-0
Schauer, J. J., Kleeman, M. J., Cass, G. R., and Simoneit, B. R. T. (2001). Measurement of Emissions from Air Pollution Sources. 3. C1−C29 Organic Compounds from Fireplace Combustion of Wood. Environ. Sci. Technol. 35, 1716–1728. doi:10.1021/es001331e
Schauer, J. J., Kleeman, M. J., Cass, G. R., and Simoneit, B. R. T. (2002). Measurement of Emissions from Air Pollution Sources. 5. C1−C32 Organic Compounds from Gasoline-Powered Motor Vehicles. Environ. Sci. Technol. 36, 1169–1180. doi:10.1021/es0108077
See, S. W., and Balasubramanium, R. (2008). Chemical Characteristics of Fine Particles Emitted from Different Gas Cooking Methods. Atmos. Environ. 42, 8852–8862. doi:10.1016/j.atmosenv.2008.09.011
Shahid, I., Kistler, M., Shahid, M. Z., and Puxbaum, H. (2019). Aerosol Chemical Characterization and Contribution of Biomass Burning to Particulate Matter at a Residential Site in Islamabad, Pakistan. Aerosol Air Qual. Res. 19 (1), 148–162. doi:10.4209/aaqr.2017.12.0573
Shahid, M. A. K., Awan, M. S., Hussain, K., and Sabir, R. (2013). Scanning and Transmission Electron Microscopical and Dynamical Characterization of Soot Coated Solid Aerosols. Peak J. Phys. Environ. Sci. Res. 1 (1), 1–11.
Sofiev, M., Siljamo, P., Ranta, H., and Rantio-Lehtimäki, A. (2006). Towards Numerical Forecasting of Long-Range Air Transport of Birch Pollen: Theoretical Considerations and a Feasibility Study. Int. J. Biometeorol. 50 (6), 392–402. doi:10.1007/s00484-006-0027-x
Steiner, A. L., Brooks, S. D., Deng, C., Thornton, D. C. O., Pendleton, M. W., and Bryant, V. (2015). Pollen as Atmospheric Cloud Condensation Nuclei. Geophys. Res. Lett. 42 (9), 3596–3602. doi:10.1002/2015gl064060
Stevanovic, S., Miljevic, B., Surawski, N. C., Fairfull-Smith, K. E., Bottle, S. E., Brown, R., et al. (2013). Influence of Oxygenated Organic Aerosols (OOAs) on the Oxidative Potential of Diesel and Biodiesel Particulate Matterfluence of Oxygenated Organic Aerosols (OOAs) on the Oxidative Potential of Diesel and Biodiesel Particulate Matter. Environ. Sci. Technol. 47 (14), 7655–7662. doi:10.1021/es4007433
Stone, E., Schauer, J., Quraishi, T. A., and Mahmood, A. (2010). Chemical Characterization and Source Apportionment of fine and Coarse Particulate Matter in Lahore, Pakistan. Atmos. Environ. 44 (8), 1062–1070. doi:10.1016/j.atmosenv.2009.12.015
Tiwari, S., Pipal, A. S., Hopke, P. K., Bisht, D. S., Srivastava, A. K., Tiwari, S., et al. (2015). Study of the Carbonaceous Aerosol and Morphological Analysis of fine Particles along with Their Mixing State in Delhi, India: a Case Study. Environ. Sci. Pollut. Res. 22 (14), 10744–10757. doi:10.1007/s11356-015-4272-6
Tumolva, L., Park, J.-Y., Kim, J.-s., Miller, A. L., Chow, J. C., Watson, J. G., et al. (2010). Morphological and Elemental Classification of Freshly Emitted Soot Particles and Atmospheric Ultrafine Particles Using the TEM/EDSfication of Freshly Emitted Soot Particles and Atmospheric Ultrafine Particles Using the TEM/EDS. Aerosol Sci. Techn. 44, 202–215. doi:10.1080/02786820903518907
Wang, J., Hu, Z., Chen, Y., Chen, Z., and Xu, S. (2013). Contamination Characteristics and Possible Sources of PM10 and PM2.5 in Different Functional Areas of Shanghai, China. Atmos. Environ. 68, 221–229. doi:10.1016/j.atmosenv.2012.10.070
Wu, S., Deng, F., Wang, X., Wei, H., Shima, M., Huang, J., et al. (2013). Association of Lung Function in a Panel of Young Healthy Adults with Various Chemical Components of Ambient fine Particulate Air Pollution in Beijing, Chinafine Particulate Air Pollution in Beijing, China. Atmos. Environ. 77, 873–884. doi:10.1016/j.atmosenv.2013.06.018
Yadav, R., Sahu, L. K., Jaaffrey, S. N. A., and Beig, G. (2014). Temporal Variation of Particulate Matter (PM) and Potential Sources at an Urban Site of Udaipur in Western India. Aerosol Air Qual. Res. 14, 1613–1629. doi:10.4209/aaqr.2013.10.0310
Zeb, B., Khan Alam, K., Armin Sorooshian, A., Blaschke, T., Ahmad, I., and Shahid, I. (2018). On the Morphology and Composition of Particulate Matter in an Urban Environment. Aerosol Air Qual. Res. 18 (6), 1431–1447. doi:10.4209/aaqr.2017.09.0340
Zhang, Y.-x., Shao, M., Zhang, Y.-h., Zeng, L.-m., He, L.-y., Zhu, B., et al. (2007). Source Profiles of Particulate Organic Matters Emitted from Cereal Straw Burnings. J. Environ. Sci. 19, 167–175. doi:10.1016/s1001-0742(07)60027-8
Keywords: particulate matter, Nowshera, SEM–EDX, OC, EC, OC/EC ratio
Citation: Zeb B, Alam K, Ditta A, Ullah S, Ali HM, Ibrahim M and Salem MZ (2022) Variation in Coarse Particulate Matter (PM10) and Its Characterization at Multiple Locations in the Semiarid Region. Front. Environ. Sci. 10:843582. doi: 10.3389/fenvs.2022.843582
Received: 26 December 2021; Accepted: 13 January 2022;
Published: 03 February 2022.
Edited by:
Shupeng Zhu, University of California, Irvine, United StatesReviewed by:
Kai Wu, University of California, Davis, United StatesCopyright © 2022 Zeb, Alam, Ditta, Ullah, Ali, Ibrahim and Salem. This is an open-access article distributed under the terms of the Creative Commons Attribution License (CC BY). The use, distribution or reproduction in other forums is permitted, provided the original author(s) and the copyright owner(s) are credited and that the original publication in this journal is cited, in accordance with accepted academic practice. No use, distribution or reproduction is permitted which does not comply with these terms.
*Correspondence: Bahadar Zeb, emVic2JidUBnbWFpbC5jb20=; Allah Ditta, YWxsYWguZGl0dGFAc2JidS5lZHUucGs=; Muhammad Ibrahim, ZWJyYWhlbS5tQGdtYWlsLmNvbQ==
Disclaimer: All claims expressed in this article are solely those of the authors and do not necessarily represent those of their affiliated organizations, or those of the publisher, the editors and the reviewers. Any product that may be evaluated in this article or claim that may be made by its manufacturer is not guaranteed or endorsed by the publisher.
Research integrity at Frontiers
Learn more about the work of our research integrity team to safeguard the quality of each article we publish.