 Dan Zhao
 Siyu Chen
 Yu Chen
- Key Laboratory for Semi-Arid Climate Change of the Ministry of Education, Lanzhou University, Lanzhou, China
Dust in the atmosphere and snow on the Tibetan Plateau (TP) remarkably influence the Asian climate, which can influence snow cover by changing radiative forcing. In this study, we investigated the spatial and temporal distributions of dust and snow cover over the TP from 2009 to 2018 and estimated the relative contributions of atmospheric dust and dust-on-snow to the change in snow cover over the northern TP through the use of reanalysis datasets and satellite retrievals. The results show that the high and low centers of aerosol and dust aerosol optical depth (AOD) are roughly similar. Dust concentrations over the TP generally decrease from north to south and from west to east, showing decreasing trends in the winter half-year (December to May). The correlation coefficients between the dust concentration and snow cover over the northern TP are −0.6 in spring. Dust in the atmosphere and on snow over the TP could significantly influence snow cover by changing the radiative forcing, and the influence of dust deposited on snow is greater than that in the atmosphere. Atmospheric dust reduces the surface net solar radiation by −3.84 W m−2 by absorbing shortwave radiation, decreasing the surface temperature by −2.27°C, and finally increasing the snow cover by 1.04%. However, dust deposited on snow can decrease the surface albedo by −0.004 by reducing the surface optical properties, induce surface warming at 0.42°C, and reduce snow cover by −2.00% by rapid snowmelt in the northern TP.
1 Introduction
As the “sensitive area” of climate change (Wu et al., 2005; Xu et al., 2015a), snow/ice is the largest seasonal variable of land cover over the Tibetan Plateau (TP) (Smith and Bookhagen, 2018; Lievens et al., 2019). The snow and ice systems over the TP are very fragile, have experienced widespread melting, and retreat in the last 20 years (Kang et al., 2015), besides the extent of ablation retreat being still gradually increasing (Yao et al., 2012). In addition, the enhanced warming over the TP has also caused widespread concern (Wu et al., 2017; Zhou and Zheng, 2021). The warming rate over the TP in the last 50 years has reached 0.3–0.4°C/decade, which is twice the global average of the same period (Shen et al., 2015). The Intergovernmental Panel on Climate Change (IPCC) (2021) pointed out that even if global warming was to be controlled within 1.5°C by the end of this century, TP warming is likely to exceed 2.1°C (Duan and Xiao, 2015). The surface albedo of glaciers over the TP has declined significantly in recent decades (Liu and Chen, 2000; Wang et al., 2014; Zhang et al., 2021). In addition to the notably rapid warming over the TP (Qin et al., 2006; Wang et al., 2008; Kang et al., 2010; Bolch et al., 2012), factors such as land use change, water vapor feedback, cloud properties, and the radiation forcing of light-absorbing aerosols (LAAs) can also significantly influence warming (Kang et al., 2000; Flanner et al., 2009; Xu et al., 2009).
Dust aerosols are mainly emitted from drylands through wind erosion (Chen et al., 2014; Huang et al., 2016; Wang et al., 2012; Bi et al., 2016). The atmosphere, hydrosphere, and cryosphere are closely related to the physical process of dust aerosols, including dust emission, transport, and wet/dry deposition (Niemand et al., 2012). Through direct and indirect effects, dust has a significant regulating effect on the Earth’s radiative budget and hydrological cycle. Due to human activities, the aggravation of desertification, and vegetation degradation in recent years, the TP has become a new source of dust emissions that cannot be ignored (Ma et al., 2014). Moreover, sufficient evidence has proved that in addition to local dust emissions, a large quantity of dust particles over the TP come from external transport (Mao et al., 2019). Feng et al. (2020) found that the atmospheric dust in the top of the troposphere above the TP in spring of the 2000s increased by 34% compared with that in the 1990s, which is related to increasing dust aerosols from East Asia, South Asia, and the Middle East since the 2000s. Moreover, the results of the MISR retrievals showed that the correlation between the TP and Taklimakan Desert (TD) aerosol optical depth (AOD) is lower in spring than in summer (Xia et al., 2008). Chen et al. (2013), Chen et al. (2014) and Yuan et al. (2019) investigated the dynamic and thermal transport mechanisms of dust aerosols from the TD to the northern TP. By the weakening and northward movement of the East Asian westerly jet and the increase in surface-sensible heat over the TD in summer, abundant TD dust particles are transported to the northern slope of the TP. These results were also supported by ice cores and aerosol products from the total ozone mapping spectrometer (TOMS), as well as the coupled model intercomparison project (Phase 6) (CMIP6) and community earth system model (CESM) (Feng et al., 2020). As a crucial natural aerosol, the TP dust deposited on ice and snow is much larger than black carbon (BC). Dust can lead to significant climate effects by influencing slight initial changes in snow albedo, with rapid subsequent adjustment and feedback (Cong et al., 2015; Ji et al., 2016; Xie et al., 2018; Shi et al., 2019). The magnitude of dust deposition and its spatial distributions over the TP diverge from BC (Flanner et al., 2009), which causes the climate effect of dust-on-snow in spring to be more complex. For example, dust deposited on snow and ice could reduce snow depths by 5–25 mm in the Himalayas and western TP (Zhang et al., 2017). Qu et al. (2014) found that dust is an important factor in Zhadang Glacier melting, with an average radiative forcing weakened by dust-on-snow of 1.1–8.6 W m−2. Dust deposited on snow in the Himalaya–TP also increases the surface temperature and the lower atmospheric temperature over the TP and strengthens the southwest wind in the lower layer through reducing snow albedo during the premonsoon, which, in turn, increases dust over the Indo-Gangetic Plain-Himalayas (Lau and Kim, 2018).
In this study, we used satellite retrievals and reanalysis datasets to obtain the spatial distributions of aerosols, especially dust aerosols and snow cover over the TP, and analyzed the correlation between dust and snow cover. This study mainly evaluates the relative impacts of atmospheric dust and dust-on-snow over the TP in spring and winter from 2009 to 2018. We hope to provide a reference and basis for the causes of ice and snow melting and regional warming over the TP. The datasets used in the study are presented in Section 2. Section 3.1 analyzes the spatial and temporal distributions of aerosols over the TP. Section 3.2 focuses on spatial and temporal distributions of snow cover over the TP. In Section 3.3, the influence mechanism of dust aerosols on snow over the TP is discussed. Section 4 shows the conclusion and discussion.
2 Datasets and Methods
2.1 MODIS
The Moderate-Resolution Imaging Spectroradiometer (MODIS) installed on the Terra and Aqua satellites is one of the most widely used remote sensing platforms in earth science research (Parkinson, 2003). The Terra and Aqua satellites feature 5-min temporal and 36-channel spectral resolutions, 2330-km viewing swath widths, wide spectral ranges (0.412–14.24 μm), and near-global coverage every 1–2 days. Thus, MODIS not only provides reliable and extensive retrieval data products on aerosols and clouds but also offers an ideal solution for aerosol model development and validation, dynamic analysis of atmospheric pollution, and air quality monitoring with a spatial resolution of 1–10 km (Levy et al., 2007; Remer et al., 2008). Dark target (DT) and deep blue (DB) are the two major algorithms applied to the MODIS instrument for retrieving AOD. DT manifests its excellent performance over high vegetation coverage regions such as farmlands or forests, while DB was developed to retrieve the aerosol properties over Gobi, deserts, or snow-covered areas. The retrieval deviation can be reduced in the estimation of surface albedo and further in AOD over the regions of bright surface with a weaker blue-band reflectance (Hsu et al., 2006). In this study, snow cover and AOD at 550 nm were derived from MODIS-Aqua version 6.1. The resolution of snow cover is 0.05° × 0.05° (lat x lon), and the AOD at 550 nm is 1° × 1° (lat x lon).
2.2 MISR
The Multiangle Imaging SpectroRadiometer (MISR) onboard Terra was launched on 18 December 1999. The sensors can measure particles with medium spatial resolution and can cover almost the whole world. MISR products have made significant progress in retrieving aerosols. However, the predictability of MISR aerosol products for PM2.5 concentrations has not improved (Liu et al., 2007). Both MISR and MODIS are onboard the Terra satellite. Statistical comparisons were made with coincident AOD retrieved by MODIS and MISR. The correlation coefficient between MISR and MODIS is approximately 0.9 over the ocean and approximately 0.7 over land (Kahn et al., 2009). Compared to AERONET, marine stations have the highest correlation coefficient (0.9), and dusty sites have the lowest correlation coefficient (0.7) (Kahn et al., 2005). Although MISR has these biases, MISR can still represent the spatial and temporal variations in aerosols. In this study, 550 nm AOD at 550 nm with a horizontal resolution of 0.5° × 0.5° (lat x lon) was derived from the MISR Level 3 Data.
2.3 MERRA-2 Reanalysis Data
The Modern-Era Retrospective Analysis for Research and Applications, version 2 (MERRA-2) is produced by the NASA Global Modeling and Assimilation Office (GMAO), which provides datasets dating back to 1980 (Gelaro et al., 2017). Previous studies have evaluated MERRA-2. Compared with models and observations, the MERRA-2 AOD is larger than the simulated AOD, but observations are larger than the MERRA-2 AOD (Randles et al., 2017). Furthermore, previous studies compared observed AOD based on AERONET and found that the MERRA-2 AOD better matches that of AERONET (Randles et al., 2017). Liu et al. (2019) combined the AAI and several satellite datasets to check the reliability of long-term changes in the MERRA-2 dust concentration. Moreover, MERRA-2 underestimates the daily temperature and overestimates the latent heat flux in summer (Draper et al., 2017). Although MERRA-2 still presented these biases, MERRA2 could represent the spatial and temporal variations in aerosols. In this study, we used AOD, dust aerosol optical depth (DAOD), and surface albedo with a horizontal resolution of 0.5° × 0.625°(lat x lon) to analyze the impacts of dust over the TP.
2.4 ERA5 Reanalysis Data
The European Centre for Medium-range Weather Forecasting Reanalysis V5 (ERA5) is a global atmospheric reanalysis dataset (Hersbach et al., 2019) dating back to 1950, with a horizontal resolution of 0.25° × 0.25° (Hersbach et al., 2018). Compared with ERA-Interim, ERA5 was significantly improved. The assimilation method uses the ensemble 4DVar data assimilation scheme with 10 ensemble members, with a horizontal resolution of 31 km × 31 km and a vertical stratification of 137 layers with a top pressure of 1 Pa. The integrated forecast system version was upgraded to Cy41r2, the radiative transfer mode was upgraded to RTTOV-v11, and the temporal resolution was improved to 1 h. The ERA5 reanalysis datasets are better than MERRA-2 in estimating solar irradiance, but there are some biases in cloudy conditions. ERA5 overestimates solar radiation, while MERRA-2 underestimates solar radiation in most areas. In terms of wind speed, ERA5 is superior to MERRA-2 compared to the observation data. In terms of precipitation, ERA-5 performs better on the monthly scale, followed by JRA-55, MERRA-2, and CFS-2 (Taszarek et al., 2021) in terms of thermodynamic theoretical parameters, low-altitude decrement rate, low-altitude wind shear, etc. (Maa et al., 2021). Both ERA5 and MERRA-2 data better represent variables such as temperature, moderateness, mid-tropospheric decrement rate, and mean wind. However, ERA5 has a higher correlation and lower mean error compared to MERRA-2 (Taszarek et al., 2021). In general, ERA5 is better than MERRA-2 data in terms of solar radiation, precipitation, temperature, and wind speed. However, ERA5 excludes aerosol data; we use MERRA-2 data for analyzing aerosols in this article. For the analysis of temperature and radiation, ERA5 data are used. In this study, we used surface temperature and surface net solar radiation (clear) with a horizontal resolution of 0.25° × 0.25° (lat x lon).
2.5 Correlation Analysis Method
By using the correlation analysis method, this article analyzes the correlation relationship between MERRA-2 AOD and MODIS, MISR AOD, verifying the feasibility of MERRA-2 AOD in the study area. The correlation coefficient as defined by Pearson can be used to characterize the correlation between two different variables. Assuming a sample size of n for variables x and y, the correlation coefficient formula is as follows:
where
The significance test for the correlation coefficient r can be performed using the t-test method, assuming that the two variables are not correlated, with the statistic t:
n is the sample size and n-2 is the degree of freedom. The significance level is assumed to be α. If t < tα, the linear correlation is insignificant. If t > tα, the linear correlation is significant.
2.6 Climate Trends
Assuming a sample size of n for a certain climate variable xi, and ti represents the time corresponding to xi, establishing a one-dimensional linear regression equation between xi and ti:
In Eq. 3, a is the regression constant and b is the regression coefficient. For the observed data xi and the time ti, the least-squares estimates of the regression coefficient b and the constant a are:
where
Using the relationship between the regression coefficient b and the correlation coefficient a, finding the correlation coefficient between time ti and the variable xi:
The correlation coefficient r indicates the closeness of the linear correlation between the variable x and time t. When r = 0, the regression coefficient b is 0, and the regression line determined by the least-squares estimation is parallel to the x-axis, indicating that the change of x is independent of time t; when r > 0, b > 0, indicating an upward trend of x with time t; when r < 0, b < 0, indicating a downward trend of x with time t. In this article, we mainly use this method to calculate the linear trend of snow and dust aerosols.
2.7 Rate of Dust Change
This article focuses on calculating the rate of dust change by using statistical methods. The difference between the dust concentrations of two adjacent days (the latter-day minus the previous day) is calculated using dust concentration data from MERRA-2 reanalysis datasets, and the rate of dust change concentration is obtained by dividing the difference by the dust concentration of the day. The main calculation formula is as follows:
where Dust is the atmospheric dust concentration and Dustrate is the diurnal rate of atmospheric dust concentration. i represents the time series, i represents the current day, and i+1 represents the next day.
The dust concentration is influenced by the season; the effect of seasonal variability of dust concentration needs to be removed for a clearer analysis of the effect of dust on snow. We use the difference transform to remove the seasonal variability. To specifically analyze the effect of high and low values of dust variability on snow, the rates of dust change data from 2009 to 2018 were arranged from smallest to largest in spring, and the high and low values were selected using the 5% and 95% quartiles. In this article, we calculated the 5% and 95% quartiles as −0.63 mg m−3 d−1 and 0.65 mg m−3 d−1. Therefore, all dates greater than 0.65 mg m−3 d−1 are identified as high-value days, while dates less than −0.63 mg m−3 d−1 are identified as low-value days. Furthermore, the highest diurnal rates of atmospheric dust concentration and the lowest diurnal rates of atmospheric dust concentration are usually located next to each other. When the diurnal rate of atmospheric dust is high, the dust concentration in the atmosphere gradually increases at this time, mainly because most of dust is released into the atmosphere. When the diurnal rate of atmospheric dust is low, the dust deposits on snow at this time. Thus, the high values represent the atmospheric dust and the low values represent dust-on-snow. High and low-value days are analyzed separately for radiation, temperature, and snow distribution to comprehend the mechanism of the effect of dust to snow.
3 Results
3.1 Spatial and Temporal Distributions of Aerosols Over the Tibetan Plateau
As a major aerosol over the TP, dust in the atmosphere and snow on the TP remarkably influence the Asian climate. In this article, we choose the most dominant absorbing aerosols (dust aerosols) to estimate the relative contributions of atmospheric dust and dust-on-snow to the change in snow cover over the TP through the use of reanalysis datasets and satellite retrievals. We use three aerosol-related datasets, MERRA-2 reanalysis datasets, MODIS, and MISR retrievals. The MERRA-2 reanalysis datasets include dust-related variables, which are used to investigate the association between dust aerosols and snow cover, and they further analyze the influence of atmospheric dust and dust-on-snow to the change in snow cover over the TP. Due to differences in models and emissions, MERRA-2 AOD shows specific uncertainties in different regions and should be evaluated before use. We need to analyze the applicability of MERRA-2 reanalysis datasets on the TP. To evaluate the feasibility of MERRA-2 reanalysis datasets over the TP, the aerosol products from MERRA-2 are compared with those derived from MODIS and MISR retrievals. Overall, MERRA-2 captures the spatial and temporal distributions of 550 nm AOD over the TP for 2009–2018. The monthly mean AOD distribution from MERRA-2 is similar to that from the MODIS and MISR retrievals. The TP AOD from MERRA-2, MODIS, and MISR has the largest values in April (0.31 ± 0.03, 0.36 ± 0.04, and 0.23 ± 0.03), and December (0.09 ± 0.01, 0.08 ± 0.01, and 0.06 ± 0.01) has the smallest (Figures 1A–C). The MERRA-2 AOD, MODIS AOD, and MISR AOD have the largest values in the northern TP (0.25 ± 0.1, 0.30 ± 0.12, and 0.20 ± 0.08) and gradually decrease from the periphery of the TP to the inside and from north to south over the TP. Meanwhile, the TP AOD from MERRA-2 has been found to be greater than that from MODIS and MISR retrievals. The differences between MERRA-2 and MODIS may be related to cloud contamination effects and emission uncertainty in each model system (Liu and Chen, 2020) (Figures 1D–F). The cloud contamination effects are a source of bias in the MODIS retrieval of AOD, and the emission uncertainty refers to the MERRA-2 reanalysis.
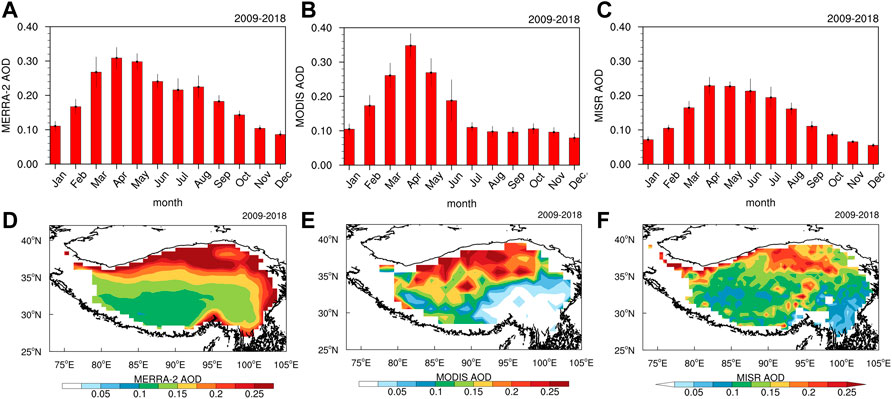
FIGURE 1. Monthly variations in the TP AOD from the (A) MERRA-2, (B) MODIS, and (C) MISR retrievals during 2009–2018 and spatial distributions of the averaged AOD over the TP from the (D) MERRA-2, (E) MODIS, and (F) MISR retrievals during 2009–2018. Note that the error bars represent the standard deviation of the corresponding variables.
Moreover, the MERRA-2 reanalysis datasets are consistent with the MODIS and MISR retrievals, which could reflect the seasonal and monthly variations in the TP AOD during 2009–2018 (Figure 2). Figure 2 shows that the values of the TP AOD from the MERRA-2 reanalysis datasets, MODIS, and MISR retrievals are 0.20 ± 0.08, 0.16 ± 0.09, and 0.14 ± 0.07 from 2009 to 2018, respectively. The TP AOD from the MERRA-2 reanalysis datasets has the largest values of 0.29 ± 0.03 in spring, followed by 0.23 ± 0.03 in summer, and the lowest AOD of 0.12 ± 0.02 in winter, which are consistent with the MODIS AOD values (0.31 ± 0.05, 0.15 ± 0.04, and 0.12 ± 0.02) and MISR AOD values (0.21 ± 0.02, 0.19 ± 0.03, and 0.08 ± 0.01) (Figure 2A). Although MERRA-2 AOD has been found to be greater than that from MODIS and MISR retrievals, the seasonal and monthly variation characteristics of three datasets are basically consistent. MERRA-2 AOD data can be used to reflect the variation characteristics of AOD in the TP. Figures 2B,C show the comparison between monthly MERRA-2 AOD and MISR AOD, MODIS AOD from 2009 to 2018. The comparison results show better correlations and smaller errors among the MERRA-2 reanalysis datasets, MISR, and MODIS retrievals, with correlation coefficients (R) of 0.90 and 0.76 and root-mean-square errors (RMSEs) of 0.03 and 0.06 (Figures 2B,C). Overall, the MERRA-2 monthly average AOD is in good agreement with MISR and MODIS.
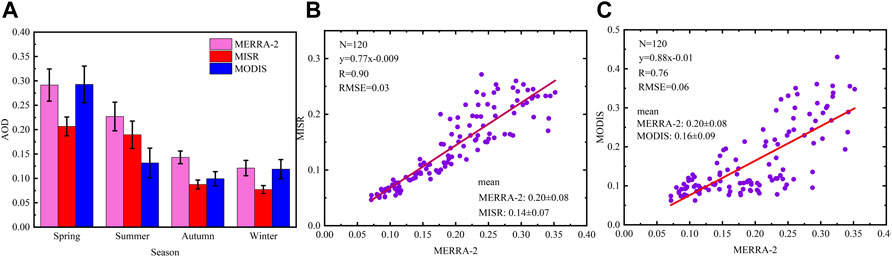
FIGURE 2. (A) Seasonal variations in the TP AOD from the MERRA-2. MODIS and MISR retrievals during 2009–2018 and comparison of MERRA-2 AOD, (B) MISR AOD, and (C) MODIS AOD over the TP (70–110°E, 25–45°N) for 2009–2018. The red line is the fit line.
As the main type of aerosol over the TP, dust AOD has the largest value of 0.15 ± 0.02 in spring and the lowest value of 0.03 ± 0.007 in winter, showing gradual decreases from the northern to southern regions of the TP (Figure 3A). The temporal and spatial distributions of DAOD (Figures 3A,C) and dust concentration (Figures 3B,D) are similar to that of AOD over the TP (Figure 1). DAOD (0.15 ± 0.02) and dust concentration (0.2 ± 0.06 mg m−3) had the largest values from March to June, while DAOD (0.03 ± 0.007) and dust concentration (0.04 ± 0.01 mg m−3) had the lowest values from October to February (Figures 3A,B). The monthly variations in DAOD in the northern TP diverge from those in the southern TP, with the DAOD in the northern TP having the largest values in May (0.28 ± 0.03) and the DAOD in the southern TP having the largest values in May (0.11 ± 0.016) (Figure 3).
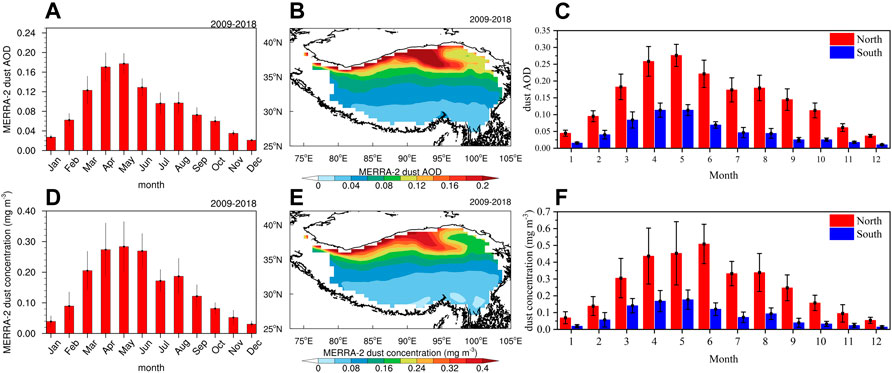
FIGURE 3. (A) Monthly dust AOD (DAOD), (B) spatial distributions of DAOD, and (C) monthly dust AOD in the north and south over the TP for 2009–2018 from the MERRA-2 reanalysis datasets. (D) Monthly dust concentration (units: mg m−3), (E) spatial distributions of dust concentration (units: mg m−3), and (F) monthly dust concentration (units: mg m−3) in the north and south over the TP for 2009–2018 from the MERRA-2 reanalysis datasets. The error bars represent the standard deviation of the corresponding variables.
The dust occurrence frequency in the northern TP is higher than that in the southern TP. The DAOD (0.25 ± 0.1) and dust concentration (0.35 ± 0.2 mg m−3) in the Qaidam Basin are higher than those in other regions over the TP. The difference between the northern TP and southern TP is closely related to the atmospheric circulation and aerosol emissions in the surrounding areas (Figures 3C,F). The results are consistent with those from Xu et al. (2015b), who showed the three-dimensional structure of aerosols over the TP based on MISR and Cloud-aerosol Lidar and Infrared Pathfinder Satellite (CALIPSO) retrievals. They further found that the spatial distribution of dust aerosols in the northern TP is significantly different from that in the southern TP, which can be seen clearly from 6 to 8 km above sea level, especially in spring and summer. Chen et al. (2013) and Yuan et al. (2020) also investigated the meridional transport path of dust from the TD to the northern slope of the TP and found that the westerly jet weakens and moves northward providing dynamic and thermal conditions for meridional transport.
The spatial distribution of dust concentration in spring and winter (Figures 4A,C) is similar to that of MERRA2 DAOD (Figures 1D, 4B,D). The dust concentration in the northern TP (0.5 ± 0.1 mg m−3) was higher than that in the southern TP (0.15 ± 0.05 mg m−3) in spring from 2009 to 2018. A large dust concentration value (0.6 ± 0.1 mg m−3) occurred in the Qaidam Basin, and a small ±value (0.05 ± 0.01 mg m−3) was located east of 95°E and south of 30°N on the TP based on MERRA-2 reanalysis datasets (Figure 4A). The spatial distribution in winter is similar to that in spring; due to the frequent dust storms in spring, the dust concentration in winter (0.15 ± 0.02 mg m−3) is smaller than that in spring (Figure 4B). In addition, based on Eq. 3, the regression coefficients of monthly data with time series were calculated for spring and winter from 2009 to 2018 to obtain the long-term trend of dust concentration. The long-term trend of dust concentration shows a decreasing trend over the TP, with domain-mean values of −0.012 mg m−3month−1 in spring and −0.003 mg m−3 month−1 in winter at the 95% significance level. The maximum values of −0.015 mg m−3 month−1 in spring and −0.006 mg m−3 month−1 in winter are located in the northern TP, which was related to the reduction of dust storms over the TD and Gobi Desert (GD) in recent years (Figures 4C,D).
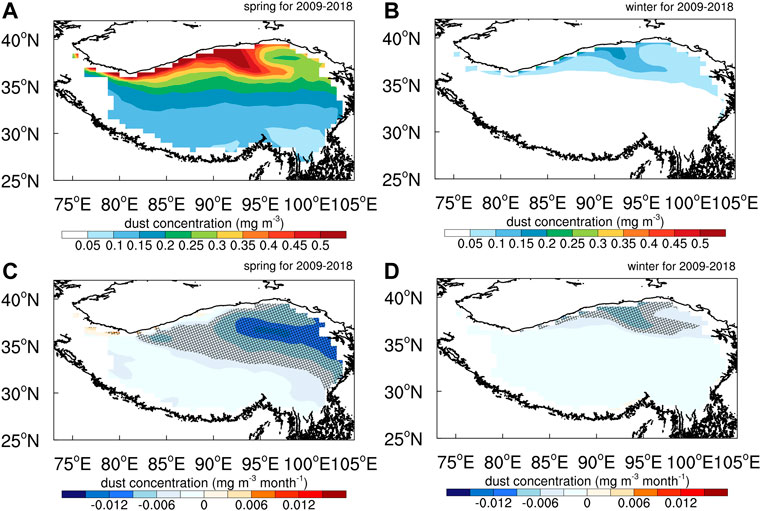
FIGURE 4. Spatial distributions of dust concentration over the TP in (A) MAM and (B) DJF for 2009–2018 derived from MERRA-2 reanalysis datasets; spatial distributions of dust concentration linear trends (units: mg m−3 month−1) over the TP in (C) MAM and (D) DJF for 2009–2018 from MERRA-2 reanalysis datasets. Regions passing the 95% significance level are highlighted by stipple. Significance is assessed through the t value of the ensemble trend.
3.2 Spatial and Temporal Distributions of Snow Cover Over the Tibetan Plateau
Snow cover is mainly located in the western TP (Kunlun Mountains) southeast of the TP, especially in the Hengduan Mountains, the Himalayas, and Qilian Mountains, and snow cover is difficult to melt due to the complex terrain. The snow cover in the hinterland of the TP and the Qaidam Basin with a dry climate and scarce precipitation belongs to instantaneous snow, and the snow cover is lower (10% ± 2) (Figure 5C). Both the fraction of coverage and duration of snow cover over the TP are lower than those at high latitudes, which leads to rapid changes in seasonal snow cover over the TP. Due to the influence of local temperature and precipitation, the changes in snow cover are more active in the cold season (Figures 5A,C). The snow cover accumulates gradually during the accumulation period from October to January, which causes the snow cover to have the highest values in January (30% ± 6) and lasts until spring (Figure 5A).
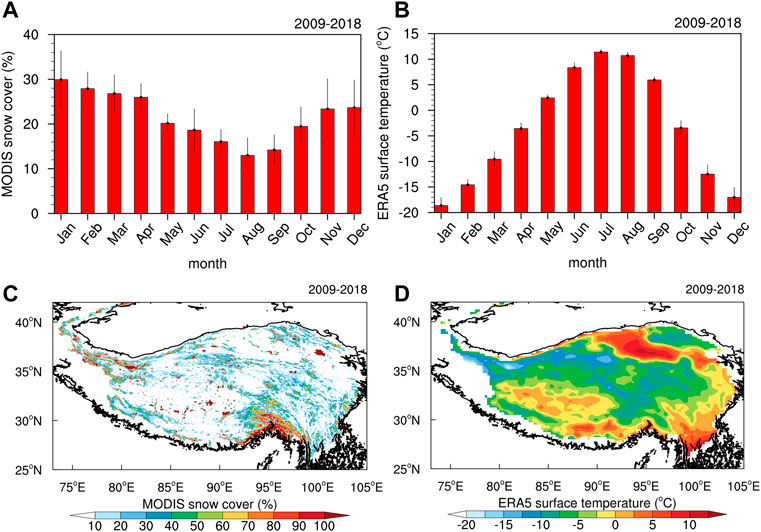
FIGURE 5. (A) Monthly snow cover (units: %) and (C) spatial distributions of snow cover (units: %) over the TP for 2009–2018 derived from the MODIS retrievals. (B) Monthly surface temperature (units: °C) and (D) spatial distributions of surface temperature (units: °C) over the TP for 2009–2018 derived from ERA5 reanalysis datasets. The error bars represent the standard deviation of the corresponding variables.
The spatial distributions of surface temperature are opposite to snow cover (Figures 5B,D). The monthly variability of snow on the TP is opposite to surface temperature, with snow reaching minimum values in July and August while surface temperature is at a maximum and snow reaching a maximum in December and January while surface temperature is at a minimum. With increased surface temperature, snow cover will decrease. The surface temperature has larger values in the northern TP, especially the Qaidam Basin, with the maximum value being 11.4°C, and the lowest values mainly occur in the middle, west, and southeast of the TP (−6.3°C ± 0.83, −8.8°C ± 1.15, and −5.0°C ± 1.30, respectively) (Figure 5D). The surface temperature over the TP has the highest value in summer (10.2°C ± 0.69) and the lowest value in winter (−16.7°C ± 1.52), with the highest value in July (11.4°C ± 0.47) and the lowest value in January (−18.6°C ± 1.58) (Figure 5B). The surface temperature has a larger value over the TP in summer; thus, the snow cover of only 15% indicates that most of the snow cover has melted and supplied water to the lake (Zhang et al., 2012), and the minimum snow cover appears in August (12.97% ± 3.92) (Figures 5A,B).
To compare the snow with dust, the snow cover was interpolated to a spatial resolution of 0.5° × 0.625° of MERRA-2. With the lower surface temperature and higher dust concentration over the TP in the winter half-year (December to May), we further investigated the influence of dust aerosols on snow cover over the TP. The distribution of snow cover in spring and winter is consistent with the annual snow cover (Figures 6A,B). In the eastern 90°E of the TP, snow cover increases in spring and decreases in winter. In the western 90°E of the TP, snow cover increases in spring and winter (Figures 6C,D), but the variation trend of dust concentration is opposite to that of snow cover in spring (Figures 4C,D). May dust lead to significant melting of snow in spring and winter, causing most of them at risk of rapid mass loss? We will further discuss the relationship between dust and snow cover. However, due to the accumulation of snow, the relationship between snow cover and dust concentration is not clear (Figures 7C,D).
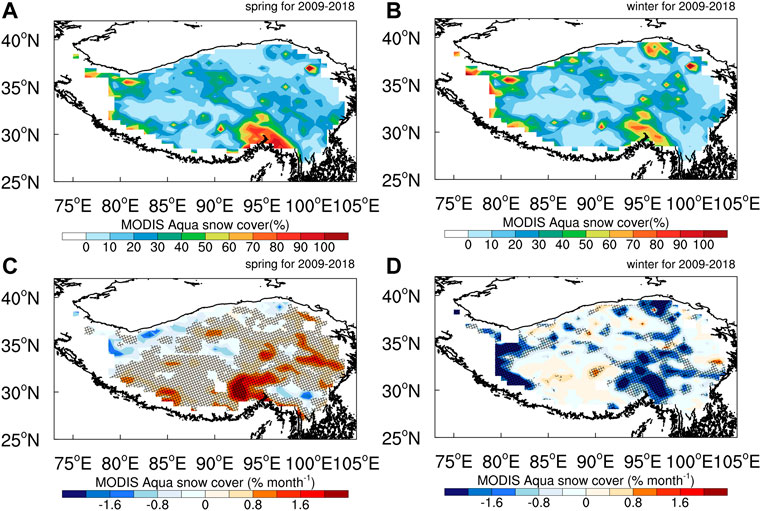
FIGURE 6. Spatial distributions of snow cover (units: %) over the TP in (A) MAM and (B) DJF for 2009–2018 derived from MODIS retrievals. Spatial distributions of snow cover trends (units: % month−1) over the TP in (C) spring (MAM) and (D) winter (DJF) for 2009–2018 derived from MODIS retrievals. Regions passing the 95% significance level are highlighted by stipple. Significance is assessed through the t value of the ensemble trend.
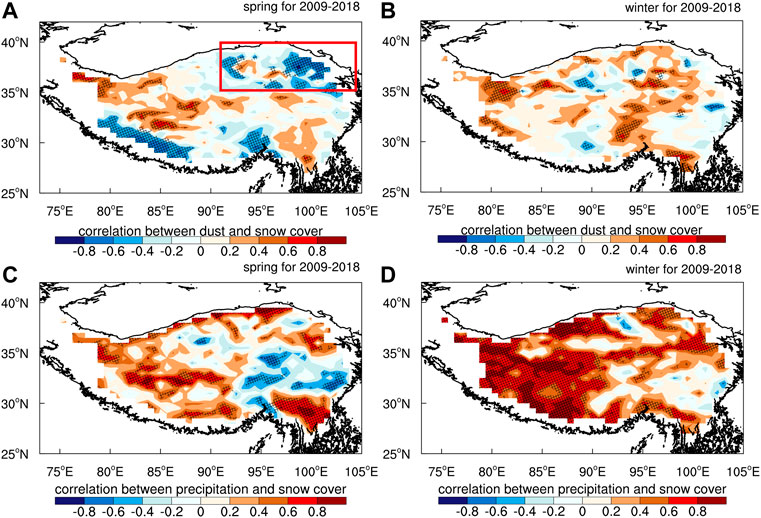
FIGURE 7. Spatial distributions of correlation between dust concentration (units: mg m−3) and snow cover (units: %) over the TP in (A) MAM and (B) DJF for 2009–2018. Spatial distributions of correlation between precipitation (units: mm) and snow cover (units: %) over the TP in (C) MAM and (D) DJF for 2009–2018. Regions passing the 85% significance level are highlighted by stipple. Significance is assessed through the t value of the ensemble trend.
Snow cover has a larger value (80% ± 12) in the southeastern TP in spring from 2009 to 2018, and the lower values (10% ± 1) are mainly in the center of the TP, including the Kunlun Mountains and Qaidam Basin (Figure 6A). The spatial distribution of snow cover in winter is almost equal to that in spring, while for the entire domain, snow cover in winter is lower than that in spring, and the maximum values (70% ± 8) are mainly located in the southeastern TP. The value of snow cover is 60% ± 4 in Qinghai Lake (Figure 6B). There is an obviously increasing trend of snow cover in the southern TP in spring from 2009 to 2018. The maximum value was mainly located in the southeastern TP, with a maximum value of up to 1.6% month−1; the snow cover in the northeastern TP shows a decreasing trend (−1.2% month−1). However, whether this change is due to dust will be discussed further below. With the deposition of dust aerosols from the TD in the northern TP, dust aerosols mainly influence fresh snow in the northern TP (Figure 6C). The variation trend of snow cover in winter is significantly different from that in spring. Most areas of the TP show decreasing trends and are mainly located in the west, southeast, and northeast of the TP, with a maximum value of up to −2% month−1. Could dust have caused the decrease in snow cover in regions of maximum snow cover? We will use the rate of dust to analyze. The snow cover shows an increasing trend in the southwestern TP, which is mainly caused by the influence of precipitation (Figure 7D).
Due to the influence of precipitation and temperature, the correlation between snow and dust is uncertainty. Therefore, positive correlation will occur in the case of low precipitation, and inverse phase deposition of dust in snow will occur when the dust concentration is large, while the influence of dust in the atmosphere and dust in snow is different, so the correlation results are different. Therefore, we cannot get an obvious signal from the climatic state, so we use the rate of dust change to analyze.
To explain the influence of dust on snow over the TP, this study analyzed the temporal and spatial correlations between dust concentration and snow cover. Dust has a significant correlation with snow cover in most regions of the TP at an 85% significance level of the t test. In particular, dust has a greater influence on snow cover duration in the regions of maximum snow cover (Figure 7). In spring, there is a significant negative correlation between dust and snow cover in the northern 35°N and eastern 90°E of the TP, with the highest correlation coefficients being −0.6. However, in winter, there is a significant positive correlation between dust and snow cover in the TP, with the highest correlation coefficients being 0.5. In the northwest and the hinterland of the TP, there is a significant positive correlation between dust and snow cover, with values of 0.4 in spring and 0.5 in winter, which are mainly influenced by precipitation more than dust aerosols (Figures 7C,D).
In spring, there is a significant negative correlation between dust and snow cover in the northern 35°N and eastern 90°E of the TP. Surface temperature and precipitation are two direct factors that can affect snow, while dust usually affect the snow by affecting surface temperature. The influence of precipitation will lead to a non-significant correlation in some areas. Therefore, we select the northern region of the TP (35–40°N, 87–105°E) and calculate the rate of dust and the variability characteristics of precipitation and select the high and low values of dust rate in the case of precipitation less than 0.0049 mm, so as to reduce the influence of precipitation on snow and then analyze the influence of dust on snow in the northern region of the TP (35–40°N, 87–105°E).
3.3 The Influence of Dust in the Atmosphere and Deposition in Snow Over the Tibetan Plateau
We select the northern region of the TP (35–40°N, 87–105°E) and calculate the rate of dust and the variability characteristics of precipitation and select the high and low values of dust rate in the case of precipitation less than 0.0049 mm, so as to reduce the influence of precipitation on snow and then analyze the influence of dust on snow in the northern region of the TP (35–40°N, 87–105°E). Dust physical processes, including dust emissions, long-term transport, and dry/wet deposition, are closely related to the climatic effects of dust aerosols. The study of the climate effect of dust is always very complex. It is difficult to separately analyze the effect of dust in the atmosphere and snow for observations, which leads to the lack of observational facts in the climate effects of dust aerosols over the TP. We distinguished between atmospheric dust and dust-on-snow by calculating the diurnal rate of dust concentration in the northern region of the TP (35–40°N, 87–105°E) in this study (Figure 8). The highest (red dots, >0.65 mg m−3 d−1) and the lowest diurnal rates of atmospheric dust concentration (blue dots, <−0.63 mg m−3 d−1) are usually located next to each other in Figure 8. In particular, the dust concentration is higher during high events (red dots) due to local dust emissions and transport from other sources. However, dust aerosols settle quickly to snow due to dry/wet deposition, which leads to dust concentrations in the atmosphere decreasing rapidly in low events (blue dots). The pattern of surface dust concentration in high and low events is almost the opposite in the northern TP (Figures 8, 9). Therefore, the high and low values of the diurnal rates of atmospheric dust represent atmospheric dust and dust-on-snow over the TP, respectively. Furthermore, we investigate the influencing mechanism of atmospheric dust and dust-on-snow on snow cover over the TP based on high and low events.
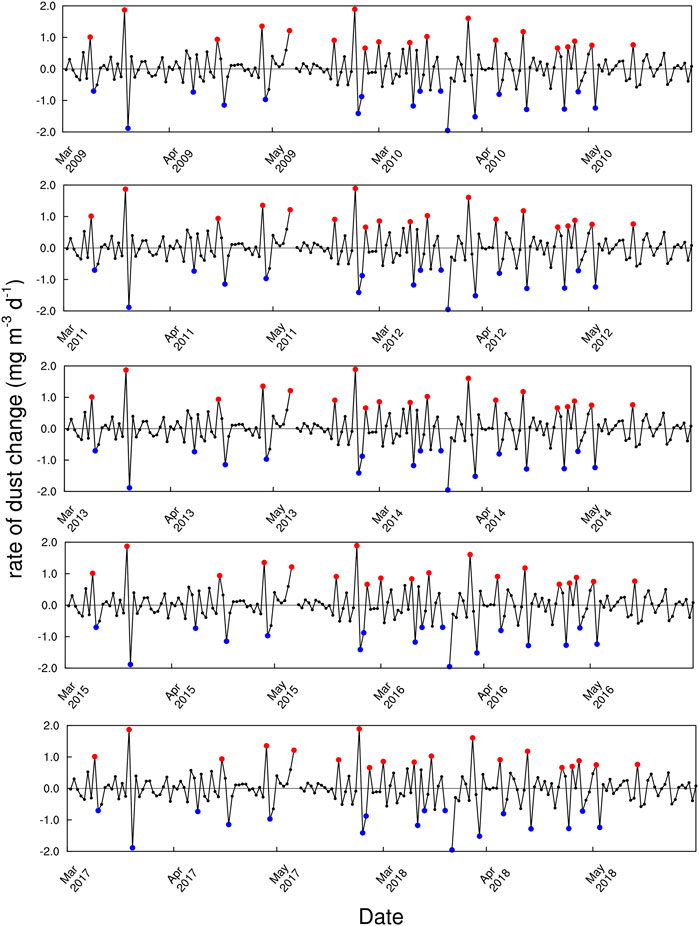
FIGURE 8. Time variation of dust concentration (units: mg m−3 d−1) over the TP in spring for 2009–2018 and selected cases representing atmospheric dust (red dots) and dust-on-snow (blue dots).
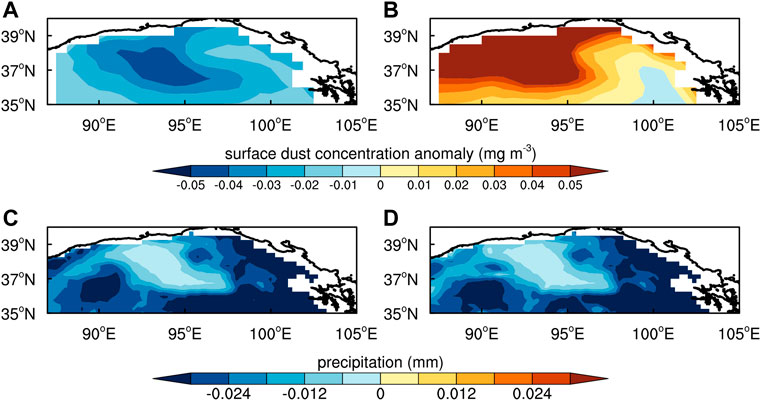
FIGURE 9. Spatial distributions of (A,B) surface dust concentration (units: mg m−3) and (C,D) precipitation (units: mm) on (first column) the difference between high and normal days and (second column) the difference between low and normal days.
Based on high and low values of dust variability, using radiation data from MERRA-2 and meteorological element data from ERA5, we analyze the characteristics of changes in solar radiation, surface temperature, and snow cover. Through analyzing the distribution characteristics of radiation, surface temperature, and snow cover in the northern region of the TP (35–40°N, 87–105°E) based on the high and low values of the rate of dust, we can analyze the influence of atmospheric dust and dust-on-snow on snow cover in the northern region of the TP (35–40°N, 87–105°E). The solar radiation anomaly and surface temperature anomaly are mainly obtained by calculating the average values of solar radiation and surface temperature in the high and low values to subtract the average values from 2009 to 2018 in spring. Dust can affect solar radiation directly, while the variation of solar radiation directly affects surface temperature. The radiation anomaly and surface temperature anomaly can be interpreted as being caused by dust. The precipitation is lower in the high and low events; thus, we can ignore the influence of precipitation on snow over the northern TP (Figures 9C,D).
Atmospheric dust reduces the surface net solar radiation (−3.84 W m−2) through absorbing shortwave radiation, decreases the surface temperature (−2.27°C), and finally increases the snow cover (−1.04%). The high events occur mainly from March to May, which are mainly from local dust emissions and external transport. During high events, surface dust concentration anomaly has negative values (−0.026 mg m−3), and the minimum value is −0.05 mg m−3. During this time, surface dust aerosols are emitted to the atmosphere. As one of the major LAAs, dust aerosols can significantly absorb solar radiation. Due to the influence of atmospheric dust, the surface net solar radiation anomaly has lower values of −3.84 W m−2 in the northern TP (Figure 10C), which caused a negative surface temperature anomaly of −2.27°C in the northern TP during the high events (Figure 11A). The surface temperature can significantly influence snow cover, and the snow cover anomaly shows higher values of 3% in the eastern 90°E of the north TP and lower values of 2% in the western 90°E of the north TP. The spatial distribution of surface albedo is similar to that of snow cover; a positive surface albedo anomaly mainly occurs in the northern TP (0.0004).
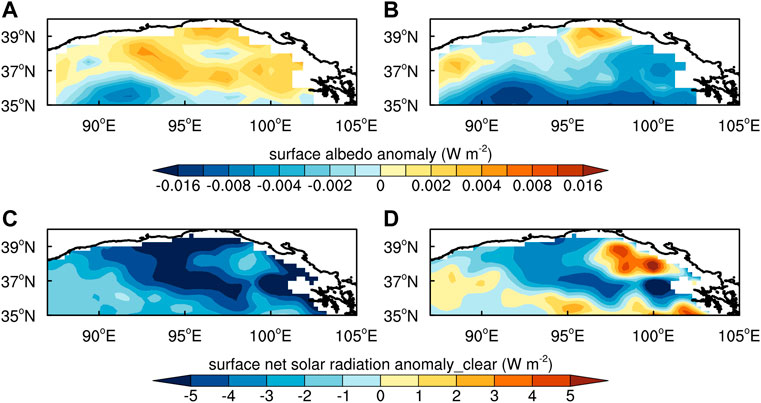
FIGURE 10. Spatial distribution of (A,B) surface albedo and (C,D) surface net solar radiation (units: W m−2) on (first column) the difference between high and normal days and (second column) the difference between low and normal days.
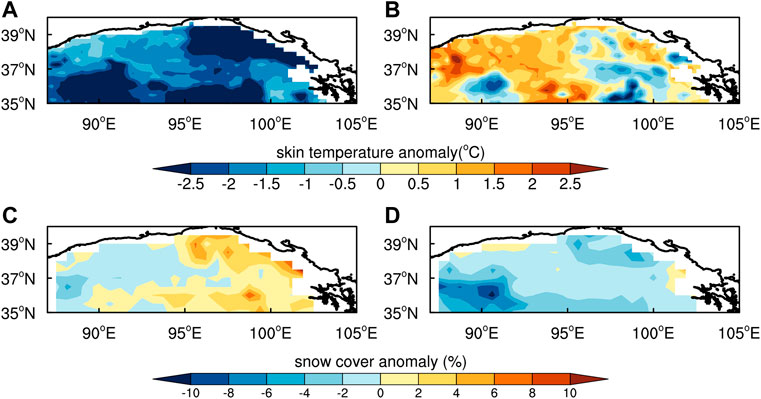
FIGURE 11. Spatial distribution of (A,B) skin temperature (units: °C) and (C,D) snow cover (units: %) on (first column) the difference between high and normal days and (second column) the difference between low and normal days.
The dust deposited on snow reduces the surface albedo by −0.004, induces surface warming (0.42°C), and reduces snow cover (−2.00%) by rapid snowmelt in the northern TP. The positive surface dust concentration anomaly is high over the northern TP (0.057 mg m−3), and the negative values of −0.01 mg m−3 are located on the southern 37°N and eastern 98°E of the northern TP during low events (Figure 9B). Dust deposited on snow can reduce surface albedo; thus, the surface albedo anomaly has lower values of −0.004 in the northern TP, with minimum values down to −0.016. (Figure 10B). The spatial distribution of the surface net solar radiation anomaly is contrary to that of the surface albedo, and the larger values of 3 W m−2 are located in the south of northern TP (Figure 10D). The surface temperature has a larger value of 2°C, mainly in the west of the northern TP (Figure 11B). The spatial distribution of snow cover is almost opposite to that of surface temperature, while for the entire snow cover domain, the lower values of snow cover of −2.00% are mainly located north of the TP (Figure 11D). The significant decreasing snow cover over the TP is induced due to the snow darkening effect. Dust-on-snow increases the surface solar shortwave radiation by decreasing the surface albedo, which further strengthens the surface temperature, weakens the snow cover, and further increases dust emissions. Hence, TP dust can create a positive feedback loop, which decreases snow cover. In the same period, snow cover can partially block the upward longwave radiation from the ground and affect the ground thermal regime. When the snow cover decreases, the upward longwave radiation from the ground increases, which weakens the surface temperature. The effect of snow darkening is higher than the thermal regime of snow cover, which finally increases surface temperature and decreases snow cover. Figure 12B shows the significant increase in the surface latent heat flux by the dust-on-snow. This is due to the increased soil moisture induced by a rise in the amount of snowmelt over the northern TP in spring. The warming of the northern TP also increases the regional surface sensible heat flux in Figure 12C. The total surface heat flux (latent + sensible heat flux) shows a larger value over the northern TP (4.29 W m−2). Hence, dust-on-snow over the TP can warm the TP and enhance its thermal effects by increasing the surface latent heat flux and sensible heat flux, thereby affecting the Asian climate.
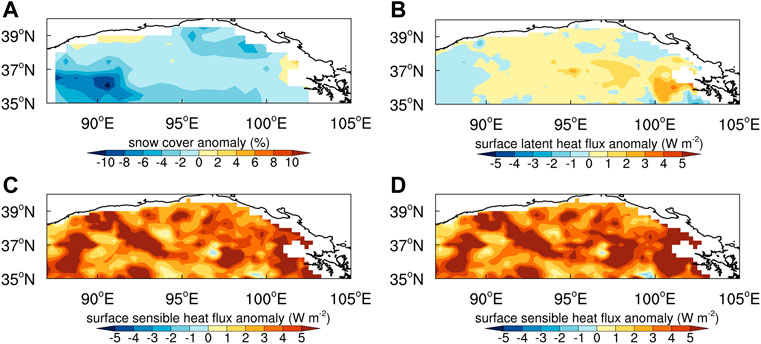
FIGURE 12. Spatial distribution of (A) snow cover (units: %), (B) surface latent heat flux (units: W m−2), (C) surface sensible heat flux (units: W m−2), and (D) the surface latent + sensible heat flux (units: W m−2) on the difference between low and normal days.
4 Discussion and Conclusion
In addition to local dust emissions, a large number of dust particles over the TP come from external transport. Furthermore, both atmospheric dust and dust-on-snow over the TP affect snow over the TP by influencing the net surface radiation. Previous studies have mainly analyzed the effect of absorbing aerosols in the atmosphere and snow on snow cover from simulation models. This study evaluated the relative impacts of atmospheric dust and dust-on-snow over the TP in spring from 2009 to 2018 based on satellite data (MODIS) and reanalysis data (MERRA-2, ERA5).
The results showed that MERRA-2 captures the spatial and temporal distributions of aerosols over the TP well during 2009–2018. The seasonal distributions of AOD from the MERRA-2 reanalysis datasets are similar to those from MODIS and MISR retrievals. The climatic effects of dust on the energy budget and water cycle of the TP and surrounding areas cannot be ignored. Dust aerosols show decreasing trends over the TP from December to May, and snow cover shows increasing trends. Dust can absorb shortwave radiation, which can further affect snow cover over the TP.
By calculating the diurnal rate of dust concentration over the northern TP in the case of precipitation less than 0.049 mm, the extreme values of dust concentration were used to analyze the influencing mechanism of atmospheric dust and dust-on-snow over the TP. The results show that the influence mechanism of atmospheric dust is different from that of dust-on-snow over the TP. Atmospheric dust reduces the surface temperature (−2.27°C) by weakening the net surface solar radiation (-3.84 W m-2) and increases the snow cover (1.04%). Dust-on-snow reduces the surface albedo (-0.004) and removes the snow cover (−2.00%) and expands the dust source region area by increasing snowmelt, resulting in an increase in dust emissions, which creates a significant positive feedback loop.
However, we ignore the effects of dry/wet deposition of dust on snow over the TP; as the influence of dry/wet deposition of dust on snow cover is different, the results might not be accurate. Additionally, we analyzed only dust aerosols and other types of aerosols mixed with dust aerosols in the atmosphere, which will result in different radiative characteristics (Bauer et al., 2007). We will discuss this in subsequent studies (Herman et al., 1997; Torres et al., 1998; Diner et al., 2002; Levelt et al., 2006a; Levelt et al., 2006b; Yao et al., 2010; Olauson, 2018; Tian et al., 2018; Kang et al., 2019; Sun et al., 2020; Allan et al., 2021; Liu et al., 2021).
Data Availability Statement
The raw data supporting the conclusion of this article will be made available by the authors without undue reservation.
Author Contributions
SYC conceived the idea. SYC and DZ designed the experiments. DZ, YC, and YG performed the analysis. DZ, SYC, GL, and SLC interpreted the results and wrote this article. All authors participated in the revision and editing of this article.
Funding
This work was supported by the Foundation for National Natural Science Foundation of China (91837103 and 41775003) and the Fundamental Research Funds for the Central Universities (lzujbky-2020-ct03).
Conflict of Interest
The authors declare that the research was conducted in the absence of any commercial or financial relationships that could be construed as a potential conflict of interest.
Publisher’s Note
All claims expressed in this article are solely those of the authors and do not necessarily represent those of their affiliated organizations, or those of the publisher, the editors, and the reviewers. Any product that may be evaluated in this article, or claim that may be made by its manufacturer, is not guaranteed or endorsed by the publisher.
Acknowledgments
The data of M-ODIS AOD and snow cover from https://ladsweb.modaps.eosdis.nasa.gov/search/, the data of MISR AOD from https://l0dup05.larc.nasa.gov/L3Web/view, the data of MERRA-2 AOD from https://disc.gsfc.nasa.gov/datasets?keywords=MERRA2&page=1, and the data of ERA surface temperature and surface net solar radiation from https://cds.climate.copernicus.eu/cdsapp#!/dataset/reanalysis-era5-pressure-levels?tab=form.
References
Allan, R. P., Arias, P. A., Berger, S., Canadell, J. G., Cassou, C., and Chen, D. (2021). IPCC Climate Change 2021: The Physical Science Basis.
Bauer, S. E., Mishchenko, M. I., Lacis, A. A., Zhang, S., Perlwitz, J., and Metzger, S. M. (2007). Do sulfate and Nitrate Coatings on Mineral Dust Have Important Effects on Radiative Properties and Climate Modeling? J. Geophys. Res. 112, D06307. doi:10.1029/2005JD006977
Bi, J. R., Huang, J. P., Holben, B., and Zhang, G. L. (2016). Comparison of Key Absorption and Optical Properties Between Pure and Transported Anthropogenic Dust over East and Central Asia Atmos. Chem. Phys. 16, 15501–15516. doi:10.5194/acp-16-15501-2016
Bolch, T., Kulkarni, A., Kääb, A., Huggel, C., Paul, F., Cogley, J. G., et al. (2012). The State and Fate of Himalayan Glaciers. Science 336 (6079), 310–314. doi:10.1126/science.1215828
Chen, S., Huang, J., Zhao, C., Qian, Y., Leung, L. R., and Yang, B. (2013). Modeling the Transport and Radiative Forcing of Taklimakan Dust over the Tibetan Plateau: A Case Study in the Summer of 2006. J. Geophys. Res. Atmos. 118, 797–812. doi:10.1002/jgrd.50122
Chen, S., Zhao, C., Qian, Y., Leung, L. R., Huang, J., Huang, Z., et al. (2014). Regional Modeling of Dust Mass Balance and Radiative Forcing over East Asia Using WRF-Chem. Aeolian Res. 15, 15–30. doi:10.1016/j.aeolia.2014.02.001
Cong, Z., Kang, S., Kawamura, K., Liu, B., Wan, X., Wang, Z., et al. (2015). Carbonaceous Aerosols on the South Edge of the Tibetan Plateau: Concentrations, Seasonality and Sources. Atmos. Chem. Phys. 15 (3), 1573–1584. doi:10.5194/acp-15-1573-2015
Diner, D. J., Beckert, J. C., Bothwell, G. W., and Rodriguez, J. I. (2002). Performance of the MISR Instrument during its First 20 Months in Earth Orbit. IEEE Trans. Geosci. Remote Sens. 40 (7), 1449–1466. doi:10.1109/TGRS.2002.801584
Draper, C. S., Reichle, R. H., and Koster, R. D. (2018). Assessment of MERRA-2 Land Surface Energy Flux Estimates. J. Clim. 31 (2), 671–691. doi:10.1175/jcli-d-17-0121.1
Duan, A., and Xiao, Z. (2015). Does the Climate Warming Hiatus Exist over the Tibetan Plateau? Sci. Rep. 5 (1), 13711. doi:10.1038/srep13711
Feng, X., Mao, R., Gong, D. Y., Zhao, C., Wu, C., Zhao, C., et al. (2020). Increased Dust Aerosols in the High Troposphere over the Tibetan Plateau from 1990s to 2000s. J. Geophys. Res. Atmos. 125, 807. doi:10.1029/2020JD032807
Flanner, M. G., Zender, C. S., Hess, P. G., Mahowald, N. M., Painter, T. H., Ramanathan, V., et al. (2009). Springtime Warming and Reduced Snow Cover from Carbonaceous Particles. Atmos. Chem. Phys. 9, 2481–2497. doi:10.5194/acp-9-2481-2009
Gelaro, R., McCarty, W., Suárez, M. J., Todling, R., Molod, A., Takacs, L., et al. (2017). The Modern-Era Retrospective Analysis for Research and Applications, Version 2 (MERRA-2). J. Clim. 30 (14), 5419–5454. doi:10.1175/JCLI-D-16-0758.1
Herman, J. R., Bhartia, P. K., Torres, O., Hsu, C., Seftor, C., and Celarier, E. (1997). Global Distribution of UV-Absorbing Aerosols from Nimbus 7/TOMS Data. J. Geophys. Res. 102 (D14), 16911–16922. doi:10.1029/96JD03680
Hersbach, H., Rosnay, P. D., Bell, B., Schepers, D., Simmons, A., Soci, C., et al. (2018). Operational Global Reanalysis: Progress, Future Directions and Synergies with NWP. doi:10.21957/tkic6g3wm
Hersbach, H., Bell, W., Berrisford, P., Horányi, A., Nicolas, J., Radu, R., et al. (2019). Global Reanalysis: Goodbye ERA-Interim, Hello ERA5. ECMWF Newsl. 159, 17–24. doi:10.21957/vf291hehd7
Hsu, N. C., Tsay, S.-C., King, M. D., and Herman, J. R. (2006). Deep Blue Retrievals of Asian Aerosol Properties during ACE-Asia. IEEE Trans. Geosci. Remote Sens. 44 (11), 3180–3195. doi:10.1109/TGRS.2006.879540
Huang, J., Yu, H., Guan, X., Wang, G., and Guo, R. (2016). Accelerated Dryland Expansion under Climate Change. Nat. Clim. Change 6 (2), 166–171. doi:10.1038/nclimate2837
Ji, Z., Kang, S., Zhang, Q., Cong, Z., Chen, P. F., Chen, P., et al. (2016). Investigation of Mineral Aerosols Radiative Effects over High Mountain Asia in 1990-2009 Using a Regional Climate Model. Atmos. Res. 178-179, 484–496. doi:10.1016/j.atmosres.2016.05.003
Kahn, R. A., Gaitley, B. J., Martonchik, J. V., Diner, D. J., Crean, K. A., and Holben, B. (2005). Multiangle Imaging Spectroradiometer (MISR) Global Aerosol Optical Depth Validation Based on 2 Years of Coincident Aerosol Robotic Network (AERONET) Observations. J. Geophys. Res. 110 (D10), D10S04. doi:10.1029/2004JD004706
Kahn, R. A., Nelson, D. L., Garay, M. J., Levy, R. C., Bull, M. A., Diner, D. J., et al. (2009). MISR Aerosol Product Attributes and Statistical Comparisons with MODIS. IEEE Trans. Geosci. Remote Sens. 47 (12), 4095–4114. doi:10.1109/TGRS.2009.2023115
Kang, S., Wake, C. P., Qin, D. H., Paul A, M., and Yao, T. D. (2000). Monsoon and Dust Signals Recorded in Dasuopu Glacier, Tibetan Plateau. J. Glaciol. 46 (153), 222–226. doi:10.3189/172756500781832864
Kang, S., Xu, Y., You, Q., Flügel, W.-A., Pepin, N., and Yao, T. (2010). Review of Climate and Cryospheric Change in the Tibetan Plateau. Environ. Res. Lett. 5 (1), 015101. doi:10.1088/1748-9326/5/1/015101
Kang, S., Wang, F., Morgenstern, U., Zhang, Y., Grigholm, B., Kaspari, S., et al. (2015). Dramatic Loss of Glacier Accumulation Area on the Tibetan Plateau Revealed by Ice Core Tritium and Mercury Records. Cryosphere 9 (3), 1213–1222. doi:10.5194/tc-9-1213-2015
Kang, S., Zhang, Q., Qian, Y., Ji, Z., Li, C., Cong, Z., et al. (2019). Linking Atmospheric Pollution to Cryospheric Change in the Third Pole Region: Current Progress and Future Prospects. Nati. Sci. Rev. 6 (4), 796–809. doi:10.1093/nsr/nwz031
Lau, W., and Kim, K.-M. (2018). Impact of Snow Darkening by Deposition of Light-Absorbing Aerosols on Snow Cover in the Himalayas-Tibetan Plateau and Influence on the Asian Summer Monsoon: A Possible Mechanism for the Blanford Hypothesis. Atmosphere 9, 438. doi:10.3390/atmos9110438
Levelt, P. F., Hilsenrath, E., Leppelmeier, G. W., van den Oord, G. H. J., Bhartia, P. K., Tamminen, J., et al. (2006a). Science Objectives of the Ozone Monitoring Instrument. IEEE Trans. Geosci. Remote Sens. 44 (5), 1199–1208. doi:10.1109/TGRS.2006.872336
Levelt, P. F., Van Den Oord, G. H. J., Dobber, M. R., Malkki, A., Huib Visser, H., Johan de Vries, J. D., et al. (2006b). The Ozone Monitoring Instrument. IEEE Trans. Geosci. Remote Sens. 44 (5), 1093–1101. doi:10.1109/TGRS.2006.872333
Levy, R. C., Remer, L. A., Mattoo, S., Vermote, E. F., and Kaufman, Y. J. (2007). Second‐generation Operational Algorithm: Retrieval of Aerosol Properties over Land from Inversion of Moderate Resolution Imaging Spectroradiometer Spectral Reflectance. J. Geophys. Res. 112, D13211. doi:10.1029/2006JD007811
Lievens, H., Demuzere, M., Marshall, H.-P., Reichle, R. H., Brucker, L., Brangers, I., et al. (2019). Snow Depth Variability in the Northern Hemisphere Mountains Observed from Space. Nat. Commun. 10 (1), 4629. doi:10.1038/s41467-019-12566-y
Liu, L., Guo, J., Gong, H., Li, Z., Chen, W., Wu, R., et al. (2019). Contrasting Influence of Gobi and Taklimakan Deserts on the Dust Aerosols in Western North America. Geophys. Res. Lett. 46, 9064–9071. doi:10.1029/2019GL083508
Liu, H., Yan, R., and Yang, J. (2021). Credibility and Statistical Characteristics of CAMSRA and MERRA-2 AOD Reanalysis Products over the Sichuan Basin during 2003-2018. Atmos. Environ. 244, 117980. doi:10.1016/j.atmosenv.2020.117980
Liu, X., and Chen, B. (2000). Climatic Warming in the Tibetan Plateau during Recent Decades. Int. J. Climatol. 20 (14), 1729–1742. doi:10.1002/1097-0088(20001130)20:14<1729::aid-joc556>3.0.co;2-y
Liu, Y., Franklin, M., Kahn, R., and Koutrakis, P. (20072007). Using Aerosol Optical Thickness to Predict Ground-Level PM2.5 Concentrations in the St. Louis Area: A Comparison between MISR and MODIS. Remote Sens. Environ. 107, 33–44. doi:10.1016/j.rse.2006.05.022
Ma, Y., Zhu, Z., Zhong, L., Wang, B., Han, C., Wang, Z., et al. (2014). Combining MODIS, AVHRR and In Situ Data for Evapotranspiration Estimation over Heterogeneous Landscape of the Tibetan Plateau. Atmos. Chem. Phys. 14, 1507–1515. doi:10.5194/acp-14-1507-2014
Maa, B., Ma, X. Y., Yin, J., Ullah, W., Liu, M. Y., and Ullah, I. (2021). Performance Evaluation of ERA-5, JRA-55, MERRA-2, and CFS-2 Reanalysis Datasets, Over Diverse Climate Regions of Pakistan. Weather and Climate Extremes 33 (2), 100373. doi:10.1016/j.wace.2021.100373
Mao, R., Hu, Z., Zhao, C., Gong, D.-Y., Guo, D., and Wu, G. (2019). The Source Contributions to the Dust over the Tibetan Plateau: A Modelling Analysis. Atmos. Environ. 214, 116859. doi:10.1016/j.atmosenv.2019.116859
Niemand, M., Möhler, O., Vogel, B., Vogel, H., Hoose, C., Connolly, P., et al. (2012). A Particle-Surface-Area-Based Parameterization of Immersion Freezing on Desert Dust Particles. J. Atmos. Sci. 69 (10), 3077–3092. doi:10.1175/JAS-D-11-0249.1
Olauson, J. (2018). ERA5: The New Champion of Wind Power Modelling? Renew. Energy 126, 322–331. doi:10.1016/j.renene.2018.03.056
Parkinson, C. L. (2003). Aqua: an Earth-Observing Satellite Mission to Examine Water and Other Climate Variables. IEEE Trans. Geosci. Remote Sens. 41 (2), 173–183. doi:10.1109/TGRS.2002.808319
Qin, D. H., Shi, Y. L., and Li, P. J. (2006). Snow Cover Distribution, Variability, and Response to Climate Change in Western China. J. Clim. 19 (9), 1820–1833. doi:10.1175/JCLI3694.1
Qu, B., Ming, J., Kang, S.-C., Zhang, G.-S., Li, Y.-W., Li, C.-D., et al. (2014). The Decreasing Albedo of the Zhadang Glacier on Western Nyainqentanglha and the Role of Light-Absorbing Impurities. Atmos. Chem. Phys. 14 (20), 11117–11128. doi:10.5194/acp-14-11117-2014
Randles, C. A., Da Silva, A. M., Buchard, V., Colarco, P. R., Darmenov, A., Govindaraju, R., et al. (2017). The MERRA-2 Aerosol Reanalysis, 1980 Onward. Part I: System Description and Data Assimilation Evaluation. J. Clim. 30 (17), 6823–6850. doi:10.1175/JCLI-D-16-0609.1
Remer, L. A., Kleidman, R. G., Levy, R. C., Kaufman, Y. J., Tanré, D., Mattoo, S., et al. (2008). Global Aerosol Climatology from the MODIS Satellite Sensors. J. Geophys. Res. 113, D14S07. doi:10.1029/2007JD009661
Shen, M., Piao, S., Jeong, S.-J., Zhou, L., Zeng, Z., Ciais, P., et al. (2015). Evaporative Cooling over the Tibetan Plateau Induced by Vegetation Growth. Proc. Natl. Acad. Sci. U.S.A. 112 (30), 9299–9304. doi:10.1073/pnas.1504418112
Shi, Z., Xie, X., Ren, X., Li, X., Yang, L., Lei, J., et al. (2019). Radiative Effect of Mineral Dust on East Asian Summer Monsoon during the Last Glacial Maximum: Role of Snow‐Albedo Feedback. Geophys. Res. Lett. 46 (19), 10901–10909. doi:10.1029/2019gl084211
Smith, T., and Bookhagen, B. (2018). Changes in Seasonal Snow Water Equivalent Distribution in High Mountain Asia (1987 to 2009). Sci. Adv. 4 (1), e1701550. doi:10.1126/sciadv.1701550
Sun, G., Hu, Z., Ma, Y., Xie, Z., Yang, S., and Wang, J. (2020). Analysis of Local Land-Atmosphere Coupling in Rainy Season over a Typical Underlying Surface in Tibetan Plateau Based on Field Measurements and ERA5. Atmos. Res. 243 (2020), 105025. doi:10.1016/j.atmosres.2020.105025
Taszarek, M., Pilguj, N., Allen, J. T., Gensini, V., Brooks, H. E., and Szuster, P. (2021). Comparison of Convective Parameters Derived from ERA5 and MERRA2 with Rawinsonde Data over Europe and North America. J. Clim. 34 (8), 3211–3237. doi:10.1175/JCLI-D-20-0484.1
Tian, X., Xie, P., Xu, J., Li, A., Wang, Y., Qin, M., et al. (2018). Long-term Observations of Tropospheric NO2, SO2 and HCHO by MAX-DOAS in Yangtze River Delta Area, China. J. Environ. Sci. 71, 207–221. doi:10.1016/j.jes.2018.03.006
Torres, O., Bhartia, P. K., Herman, J. R., Ahmad, Z., and Gleason, J. (1998). Derivation of Aerosol Properties from Satellite Measurements of Backscattered Ultraviolet Radiation: Theoretical Basis. J. Geophys. Res. 103 (D14), 17099–17110. doi:10.1029/98JD00900
Wang, B., Bao, Q., Hoskins, B., Wu, G., and Liu, Y. (2008). Tibetan Plateau Warming and Precipitation Changes in East Asia. Geophys. Res. Lett. 35 (14), L14702. doi:10.1029/2008GL034330
Wang, H. B., Zhang, L., Cao, X. J., Zhang, Z. W., and Liang, J. N. (2012). A-Train Satellite Measurements of Dust Aerosol Distributions Over Northern China. J. Quantitat. Spectr. Radiat. Transf. 122, 170–179. doi:10.1016/j.jqsrt.2012.08.011
Wang, Q., Jacob, D. J., Spackman, J. R., Perring, A. E., Schwarz, J. P., Moteki, N., et al. (2014). Global Budget and Radiative Forcing of Black Carbon Aerosol: Constraints from Pole-To-Pole (HIPPO) Observations across the Pacific. J. Geophys. Res. Atmos. 119, 195–206. doi:10.1002/2013JD020824
Wu, G. X., Liu, Y. M., Liu, X., Duan, A. M., and Liang, X. Y. (2005). How the Heating over the Tibetan Plateau Affects the Asian Climate in Summer. Chin. J. Atmos. Sci. 29 (1), 47–56. (in Chinese).doi:10.3878/j.issn.1006-9895.2005.01.06
Wu, G., He, B., Duan, A., Liu, Y., and Yu, W. (2017). Formation and Variation of the Atmospheric Heat Source over the Tibetan Plateau and its Climate Effects. Adv. Atmos. Sci. 34 (10), 1169–1184. doi:10.1007/s00376-017-7014-5
Xia, X., Wang, P., Wang, Y., Li, Z., Xin, J., Liu, J., et al. (2008). Aerosol Optical Depth over the Tibetan Plateau and its Relation to Aerosols over the Taklimakan Desert. Geophys. Res. Lett. 35, L16804. doi:10.1029/2008gl034981
Xie, X., Liu, X., Che, H., Xie, X., Li, X., Shi, Z., et al. (2018). Radiative Feedbacks of Dust in Snow over Eastern Asia in CAM4-BAM. Atmos. Chem. Phys. 18, 12683–12698. doi:10.5194/acp-18-12683-2018
Xu, B. Q., Wang, M., Joswiak, D. R., Cao, J. J., Yao, T. D., Wu, G. J., et al. (2009). Deposition of Anthropogenic Aerosols in a Southeastern Tibetan Glacier. J. Geophys. Res. Atmos. 114, 1510. doi:10.1029/2008jd011510
Xu, C., Ma, Y. M., You, C., and Zhu, Z. K. (2015a). The Regional Distribution Characteristics of Aerosol Optical Depth over the Tibetan Plateau. Atmos. Chem. Phys. 15 (20), 12065–12078. doi:10.5194/acp-15-12065-2015
Xu, X. D., Zhao, T. L., Shi, X. H., and Lu, C. G. (2015b). A Study of the Role of the Tibetan Plateau's Thermal Forcing in Modulating Rainband and Moisture Transport in Eastern China. Acta Meteorol. Sin. (in Chin. 73 (1), 20–35.
Yao, T., Li, Z., Yang, W., Guo, X., Zhu, L., Kang, S., et al. (2010). Glacial Distribution and Mass Balance in the Yarlung Zangbo River and its Influence on Lakes. Chin. Sci. Bull. 55 (20), 2072–2078. doi:10.1007/s11434-010-3213-5
Yao, T., Thompson, L., Yang, W., Yu, W., Gao, Y., Guo, X., et al. (2012). Different Glacier Status with Atmospheric Circulations in Tibetan Plateau and Surroundings. Nat. Clim. Change 2, 663–667. doi:10.1038/nclimate1580
Yuan, T., Chen, S., Huang, J., Wu, D., Lu, H., Zhang, G., et al. (2019). Influence of Dynamic and Thermal Forcing on the Meridional Transport of Taklimakan Desert Dust in Spring and Summer. J. Clim. 32 (3), 749–767. doi:10.1175/JCLI-D-18-0361.1
Yuan, T. G., Chen, S. Y., Wang, L., Yang, Y., Bi, H., Zhang, X., et al. (2020). Impacts of Two East Asian Atmospheric Circulation Modes on Black Carbon Aerosol over the Tibetan Plateau in Winter. J. Geophys. Res. 125 (12), e2020JD032458. doi:10.1029/2020jd032458
Zhang, G., Xie, H., Yao, T., Liang, T., and Kang, S. (2012). Snow Cover Dynamics of Four Lake Basins over Tibetan Plateau Using Time Series MODIS Data (2001-2010). Water Resour. Res. 48 (10), 1–22. doi:10.1029/2012WR011971
Zhang, Y., Kang, S., Sprenger, M., Cong, Z., Gao, T., Li, C., et al. (2017). “BC and Mineral Dust in Snow Cover on the Third Pole,” in The Cryosphere Discussions, 1–26. doi:10.5194/tc-2017-111
Zhang, Y. L., Gao, T. G., Kang, S. C., Shanggua, D. h., and Luo, X. (2021). Albedo Reduction as an Important Driver for Glacier Melting in Tibetan Plateau and its Surrounding Areas. Earth Sci. Rev. 22, 103735. doi:10.1016/J.EARSCIREV.2021.103735
Keywords: dust aerosol, Tibetan Plateau, aerosol radiative forcing, snow albedo, snow darkening, surface radiation
Citation: Zhao D, Chen S, Chen Y, Gong Y, Lou G, Cheng S and Bi H (2022) Influence of Dust Aerosols on Snow Cover Over the Tibetan Plateau. Front. Environ. Sci. 10:839691. doi: 10.3389/fenvs.2022.839691
Received: 20 December 2021; Accepted: 19 April 2022;
Published: 23 May 2022.
Edited by:
Yang Gao, Ocean University of China, ChinaReviewed by:
Xianwen Jing, Hubei Normal University, ChinaJiandong Wang, Nanjing University of Information Science and Technology, China
Copyright © 2022 Zhao, Chen, Chen, Gong, Lou, Cheng and Bi. This is an open-access article distributed under the terms of the Creative Commons Attribution License (CC BY). The use, distribution or reproduction in other forums is permitted, provided the original author(s) and the copyright owner(s) are credited and that the original publication in this journal is cited, in accordance with accepted academic practice. No use, distribution or reproduction is permitted which does not comply with these terms.
*Correspondence: Siyu Chen, Y2hlbnNpeXVAbHp1LmVkdS5jbg==