 Divyaja Lawand1
 Sudheer Bhakare2
 Suvarna Fadnavis2
 Rohini L. Bhawar1*
 P. R. C. Rahul2
 Pradeep Kumar Pallath1
 Simone Lolli3
- 1Department of Atmospheric and Space Sciences, Savitribai Phule Pune University, Pune, India
- 2Indian Institute of Tropical Meteorology, Pune, India
- 3CNR-IMAA, Contrada S. Loja, Potenza, Italy
The implementation of a nationwide lockdown to curb the spread of COVID-19 disease has reduced the loading of anthropogenic aerosols. However, AOD distribution over South Asia during the lockdown period shows a dipole pattern: reduction over North Indian and enhancement over the Myanmar region. This dipole pattern is evident in some datasets (MODIS, MERRA, and CALIPSO). MODIS fire counts collocated with CALIPSO smoke aerosols show enhancement over Myanmar indicating the contribution from fires. However, over the North India region number of fires during the lockdown period are less compared to climatology. Thus, the observed reduction in AOD is due to fires and anthropogenic sources. Our analysis shows that aerosols originating from biomass burning forms a layer (900–600 hPa) over the Myanmar region that produces atmospheric heating (0–2.8 K/day) that eventually leads to cloud dissipation/burning (negative in-atmospheric cloud radiative forcing ∼ −13 W/m2) and precipitation reduction (−1 to −4 mm) over Myanmar. In contrast, the aerosol reduction over North India favors cloud formation, that is, increase in cloud cover and reduction in specific cloud liquid water content leading to precipitation enhancement, indicating the anti-Twomey effect.
1 Introduction
Clouds are critical in controlling Earth’s radiation budget, and aerosols are inherently a major component of the clouds. Aerosols act as nuclei over which water vapor condense and form the cloud droplet. An increase in anthropogenic activity has led to an increase in aerosol emissions at a global scale, which led to an increase in cloud condensation nuclei (CCN) and ice nucleating particles (INP) (Seinfeld et al., 2016). However, the increase in CCN does not lead to enhanced precipitation, indicating complex microphysical processes affecting the precipitation (Koren et al., 2008; Bhawar and Rahul, 2013). Previous studies reported an adverse effect of aerosol increase and thereby giant CCN formation on precipitation (Posselt and Lohmann 2008). These studies elucidate that an increase in aerosol loading (thereby CCN) leads to numerous smaller cloud droplets when these aerosols interact with warm clouds (Twomey, 1977). Furthermore, with the increase in the droplet number, the total droplet surface area also resulted in the higher scattering of sunlight to space (Seinfeld et al., 2016). Aerosols participate in the cloud microphysical processes by acting as nuclei, leading to the increase in cloud droplet number concentration, changes in the cloud drop sizes, and radiative properties of clouds, well known as the Twomey effect (Twomey, 1977). Thus, smaller cloud droplets reduce warm rain formation by increasing cloud lifetime or dissipation of clouds (Albrecht, 1989). Thus, aerosol-cloud-radiation interaction causes changes in temperature, moisture, and cloud water content, which essentially changes cloud microphysical processes and, in turn, affects the precipitation rates (Albrecht, 1989; Pincus and Baker, 1994; Johnson and Onwuegbuzie, 2004). These complex aerosol-cloud-interaction processes are not fully understood (IPCC, 2013).
The complexity of aerosol-cloud-radiation effects on precipitation is further convoluted by different types of aerosols with varied impacts on the cloud droplet size, cloud lifetime, and cloud radiative effects, especially over large metropolitan regions (Zheng et al., 2020). Both natural and anthropogenic forest fires have been affecting atmospheric aerosol amounts for centuries. Fire aerosols affect local weather by affecting the cloud microphysical properties, serving as CCN or ice nuclei and consequently changing cloud droplet sizes. Jones et al. (2007) reported that the increasing fire aerosol emissions from the preindustrial period to the present day had cooled global near-surface air temperatures by 0.258°C. The fire aerosols decreased precipitation over excessive biomass burning regions in Africa and South America (Tosca et al., 2013). Fire-emitted BC causes stratification in the troposphere that inhibits convection and reduces precipitation (Ackerman et al., 2000; Andreae and Rosenfeld 2008). Fire aerosols also suppress cloud formation and precipitation if black carbon is embedded in the clouds (Feingold et al., 2005; Kaufman et al., 2005).
Over South Asia, open crop burning during spring is a source of enormous carbonaceous aerosols (Reddy et al., 2012; Song et al., 2012; Liu et al., 2014; Zhang et al., 2015). These biomass burring aerosols may suppress or enhance cloud fraction depending on aerosol concentration (Koren et al., 2008; Li et al., 2018). Biomass burning aerosols tend to enhance the formation and lifetime of warm clouds and suppress high-level clouds by reducing updrafts as part of the aerosol-cloud interaction process (Lolli et al., 2019; Liu et al., 2020). Liu et al., 2020 further reported that, in high biomass burning aerosol loading conditions, aerosol-radiation interaction dominates, which can cause a decrease in the occurrence frequency and rate of precipitation. Wagh et al., 2021 found that the ice nuclei concentration during Delhi’s 2016–2017 winter fog episodes was significantly correlated with black carbon. Delhi’s fog episodes are caused by industrial, vehicular, and biomass burning activities in the surrounding regions. Among Asian countries, Myanmar is the largest hot spot of woodland fires in spring (Biswas et al., 2015; Vadrevu et al., 2015). Emissions from biomass burning in Southeast Asia have been observed up to an altitude of 3 km (Lin et al., 2009).
The novel pandemic COVID-19 originated in China in December 2019 and spread to Italy and Europe at the beginning of 2020 (Lolli et al., 2020). The first reported case in India was in January 2020. The pandemic outbreak spread very quickly (Paital, 2020; Singh and Chauhan, 2020). The Indian government imposed what is called a “Janata curfew” (lockdown-like situation) on 22 March 2020 and, later, a complete lockdown between 25 March and 14 April 2020, which extended up to May 2020 (Singh and Chauhan, 2020; Fadnavis et al., 2021). The implemented restrictions include a complete shutdown of industries, public transport, and so on. These restrictions helped curb the spread of COVID-19 to a large extent (Paital, 2020; Yunus et al., 2020). Different studies over the Indian region showed a drastic reduction of aerosol loading over the North Indian region (Jain and Sharma, 2020; Fadnavis et al., 2021; Mishra and Rathore, 2021). However, biomass burning caused an enhancement in AOD over central India (Bhawar et al., 2021). The biomass burning aerosols formed a layer at altitudes 2–4 km over Myanmar and produced heating of 3–4 K/day near the layer. The biomass burning aerosol-induced heating may affect the clouds and precipitation. Thus, during the COVID-19 lockdown period (spring 2020), although there was a reduction in anthropogenic aerosols, biomass burning fires may still be a source of aerosols within South Asia, especially over central India and Myanmar region that may affect the local clouds, radiative effects, and precipitation. This study assesses the impact of biomass burning aerosols on clouds, radiative effects, and precipitation over two contrasting fire aerosol loading regions (low over North India and high over Myanmar) that formed a dipole structure within South Asia. It is organized as follows: Section 2 describes the methodology and data used in this study, Section 3 mentions the results and discussions, and Section 4 summarizes and concludes the main findings.
2 Data Methodology
2.1 Satellite Data
2.1.1 Moderate Resolution Imaging Spectroradiometer
Moderate Resolution Imaging Spectroradiometer (MODIS) is an instrument onboard the polar-orbiting Earth Observation satellites (EOS) Aqua/Terra that provides atmosphere, land, and cryosphere products with equatorial crossing times of 10:30 and 13:30, local time (Remer et al., 2005). MODIS provides the observations of aerosols for more than 20 years during the cloud-free scenarios by measuring radiances at 36 wavelengths from 0.41 to 14 µm with near-global coverage every day. The uncertainties in MODIS aerosol product at 550 nm over land ±(0.05 to ±15%) and ocean ±(0.03 to ±5%) respectively (Remer et al., 2008; Levy et al., 2010) may be due to the assumptions on surface reflectance, location, season, and aerosol retrieval algorithm (Remer et al., 2005; Levy et al., 2010; Breon et al., 2011). Herein, we used the level 3, C6.1, and gridded (1 × 1 degree) aerosol optical depth (AOD) data from MODIS combined Dark Target and Deep blue at 550 nm. The data can be downloaded from https://giovanni.gsfc.nasa.gov/giovanni/.
2.1.2 The Cloud-Aerosol Lidar and Infrared Pathfinder
Cloud-Aerosol Lidar and Infrared Pathfinder Satellite Observations (CALIPSO) has been providing 3D aerosol and cloud observation globally with a 16-day repeating cycle crossing the equator at 1:30 p.m and 1:30 a.m. (Ma et al., 2012). Cloud-Aerosol Lidar with Orthogonal Polarization (CALIOP) is the primary instrument that profiles the cloud and aerosol layers at two wavelengths of 1064 nm and 532 nm (linear depolarization is derived from 532 nm) (Hunt et al., 2009). The lidar ratios are used to retrieve aerosol extinction above clouds and below optically thin clouds and in the cloud-free columns. In contrast, the optical depth is measured from attenuated backscatter (Young and Vaughan, 2009; King et al., 2018). This study uses CALIPSO lidar level 2 version 4.10/4.20 standard aerosol profile product, which represents near actual conditions. The extinction profiles are used to derive AOD at 532 nm and gridded at 1 × 1 degree resolution for the study period. The data were downloaded from https://asdc.larc.nasa.gov/project/CALIPSO (details available in Bhawar et al., 2021). We analyzed CALIPSO observed elevated smoke product. The smoke aerosols occurring above the boundary layer are termed elevated layers (McGrath-Spangler and Denning 2013; Kim et al., 2018).
2.2 Reanalysis Datasets
2.2.1 The Modern-Era Retrospective Analysis for Research and Applications
We used the Modern-Era Retrospective Analysis for Research and Applications (MERRA) reanalysis dataset based on the Goddard Earth Observing System Data Analysis System, version 5 (GEOS-5 DAS; Rienecker et al., 2011). MERRA uses three-dimensional variational data assimilation (3DVAR) analysis algorithm based on the Gridpoint Statistical Interpolation scheme (Wu et al., 2002; Derber et al., 2003) with a 6 h update cycle. The monthly mean AOD and cloud fraction gridded on ½° latitude × ⅔° longitude, with 72 vertical levels, from the surface to 0.01 hPa were analyzed here. The AOD and cloud fraction data are available at https://giovanni.gsfc.nasa.gov/giovanni/.
2.2.2 European Centre for Medium-Range Weather Forecasting Reanalysis Version 5
We analyzed European Centre for Medium-Range Weather Forecasting Reanalysis version 5 (ERA5) global model (Poli et al., 2016). ERA5 analysis is produced at a 1-hour time step advanced 4D-var assimilation scheme. It has a horizontal resolution of approximately 30 km (0.25° × 0.25°). In the present work, ERA5 Cloud base height and specific cloud water liquid content monthly data are used. Cloud water liquid content data are analyzed for 37 pressure levels from 1,000 to 1 hPa. The above datasets are available at https://cds.climate.copernicus.eu/cdsapp#!/dataset/.
2.3 Global Precipitation Measurement
The Global Precipitation Measurement GPM Level 3 IMERG daily data at 10 × 10 km (GPM_3IMERGDF) derived from the half-hour GPM_3IMERGHH are analyzed. The IMERG products were downloaded from Giovanni—Time Averaged Map (nasa.gov). The level-3 GPM product uses the algorithm Day-1 U.S. multi-satellite precipitation estimation, which relies on three existing algorithms: TMPA, CMORPH, and PERSIANN (Huffman et al., 2015).
All the datasets have been used for 2 months, April and May, during the period from 2010 to 2020. The analysis is performed for two regions: North India (22–30°N and 74–81°E) and Myanmar region (12–25°N and 92–100°E).
2.4 Radiative Transfer Model
To evaluate the radiative effects of clouds over the whole atmospheric column, we computed the heating rate (HR) and the Cloud Radiative Effect both at the surface (SFC) and at the top-of-the-atmosphere (TOA) through the Fu-Liou-Gu (FLG) radiative transfer model (Fu and Liou, 1992; Fu and Liou, 1993; Gu et al., 2003; Gu et al., 2011). The FLG model is a one-dimensional plane-parallel model that needs the vertical profile of the most common meteorological variables such as temperature, pressure, and relative humidity as input, besides the vertically resolved optical properties of the clouds obtained from lidar observations. To correctly compute the radiative effect of clouds concerning a pristine atmosphere (no clouds present, Eq. 1), the Solar Zenith Angle (SZA), the vertical profile of ozone concentration, the surface albedo, and emissivity are needed. The FLG model computes the radiative calculations over 18 bands covering both the spectrum of the shortwave (SW) solar radiation and the outgoing longwave (LW) radiation.
The FLG radiative transfer model has been recently used to assess aerosol and cloud radiative properties over strategic regions very sensitive to climate change (Bhawar et al., 2021) or to retrieve the AOD using photovoltaic solar panels (Lolli, 2021). In those works, it is possible to find a very detailed description of the FLG model and a discussion on the choice of the above-cited variables.
3 Results and Discussion
3.1 Variability in Fires and Aerosol Loading
Significant reduction in AOD over North India during the COVID-19 lockdown period is quite visible in MODIS (−0.1, ∼48%) and MERRA (−0.1, ∼50%) data (Figure 1). This decrease is associated with a reduction in anthropogenic emissions and suppressed dust transport from the western region during 2020 (Fadnavis et al., 2021). Interestingly, there is a significant reduction in AOD over the Northern Bay of Bengal region (15–22oN) as seen in the MODIS (−0.1, ∼50%) and MERRA (−0.05, ∼22%) data. The reduction in AOD in MERRA data is lower in magnitude than the MODIS over the Bay of Bengal region. Past studies have shown that, during the spring season, large amounts of aerosols (BC, OC sulfate, and dust) are transported from Indo-Gangetic Plain and Northeast India to the North Bay of Bengal (Hsu et al., 2012; Thomas et al., 2021). The COVID-19 lockdown restrictions have caused a reduction of aerosol amounts over the Indo Gangetic plain and Northeast India. Thus, their transport to the North Bay of Bengal region is also reduced in 2020 compared to climatology. In agreement with our results, some past studies reported ∼14%–30% decrease in aerosol amounts (including absorbing aerosols) over the northern Indian region that improved regional air quality (Muhammad et al., 2020; Yunus et al., 2020; Pathakoti et al. (2021); Sanap 2021; Mishra and Rathore, 2021). Figure 1 also shows an increase in AOD over the eastern and central Indian regions as seen in MODIS (∼10%–25%) and MERRA data. Nevertheless, the MERRA AOD increase is less predominant (∼2%–5%). A similar increase in AOD over the eastern and central Indian region during the lockdown period is also reported by Bhawar et al. (2021). This AOD enhancement was due to biomass burning emissions (Bhawar et al., 2021). The AOD reduction over Northern India of ∼40% and increase in AOD over the central Indian region by 0.1 (12%) seen in Figure 1 is in agreement with Pandey and Vinoj (2021) and Bhawar et al. (2021). Figure 1 also shows higher amounts of aerosols over the Myanmar region (positive anomalies) in both the MODIS (∼30%) and MERRA (∼22%) datasets. Thus, aerosol distribution in Figure 1 shows a dipole-like structure: 1) reduction in aerosols (negative AOD anomalies) over North India (longitude: 74oE to 84oE; latitude: 22–30oN) and 2) enhancement in AOD (positive AOD anomalies) over the east India-Myanmar region (longitude: 92–110oE latitude: 12–25oN). These changes in aerosols during the lockdown period may affect local clouds, radiative forcing, and precipitation. We provide further insight on aerosols and their effects on clouds, radiative forcing, and precipitation over these two regions.
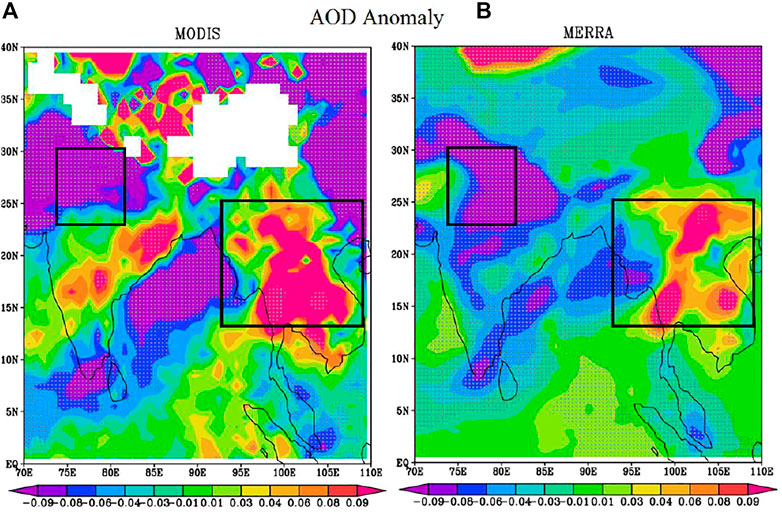
FIGURE 1. Spatial distribution of anomaly (2020-climatology) in aerosol optical depth (AOD) averaged for the lockdown period from (A) MODIS and (B) MERRA. The white dots plotted on Figures (A,B) indicate a 99% significance level. Boxes in (A) and (B) indicate North India and Myanmar regions.
The enhanced aerosol amounts over Central India and Myanmar regions seen in Figure 1 may be due to aerosols emitted from fires. Large numbers of fires occur every spring over the Myanmar region (Shi et al., 2014; Kaskaoutis et al., 2011). We show fire anomaly during the lockdown in Figure 2A. It shows positive anomalies over Myanmar and eastern and central Indian regions. The spatial distribution of elevated smoke aerosol anomaly from the CALIPSO measurements during April-May is shown in Figure 2B. Positive anomalies in the elevated smoke aerosol are observed over the eastern, central, and Myanmar regions, coinciding with the fire anomalies seen in Figure 2A. There is a large enhancement in smoke optical depth over the Myanmar region by +0.04, whereas the North Indian region shows a reduction by −0.01. This confirms that the observed increase in AOD Myanmar and central Indian regions has been caused by large amounts of fires. A past study shows that fires emit smoke/carbonaceous aerosols peak in spring over the Myanmar region (Chavan et al., 2021). It will be interesting to observe the vertical structure of fire-emitted smoke. We show the longitudinal vertical distribution of CALIPSO elevated smoke aerosols and their anomalies over North India and Myanmar regions.
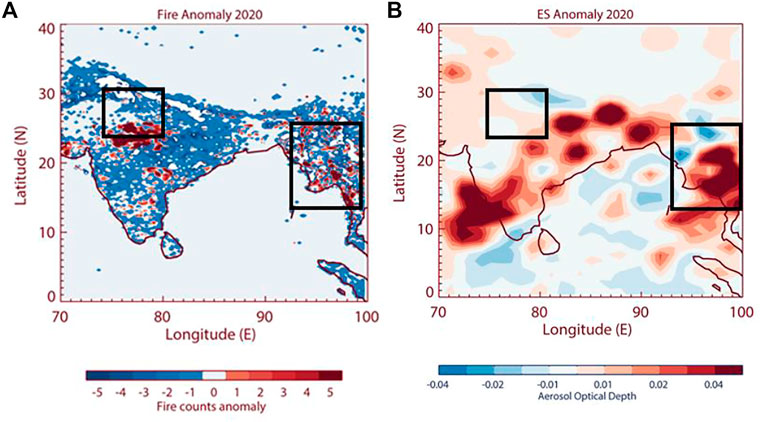
FIGURE 2. (A) Spatial distribution of changes in fire counts during the lockdown period from (A) MODIS (2020-climatology). (B) Elevated smoke aerosol optical depth from CALIPSO at 532 nm (2020-climatology) Boxes in (A,B) indicate North India and Myanmar regions.
3.2 Vertical Variability of Smoke Aerosols and Specific Cloud Liquid Water Content
Further, we show vertical profiles of CALIPSO observed elevated smoke aerosols over the central part of North India (22–30oN and 74–81oE) and Myanmar (12−25oN and 92−100oE) during the lockdown period in Figure 3A. It shows that the elevated smoke aerosols over the Myanmar region reach up to the height of 400 mb. In contrast, over the North Indian region, there is a small enhancement of 700–670 hPa. The Myanmar region shows a peak in the elevated smoke aerosol optical depth at 870 hPa, whereas North India shows negative anomalies at this altitude. The aerosol reduction over North India might have resulted in negative anomalies near 600 hPa. The small enhancement of elevated smoke aerosols over North India is near 650 hPa. It may be due to the aerosol advection from the nearby regions. The most obvious feature is the enhanced amounts of elevated smoke optical depths by 0.03 at levels 800–500 hPa over the Myanmar region. This enhancement is 2.5 times higher than that in North India.
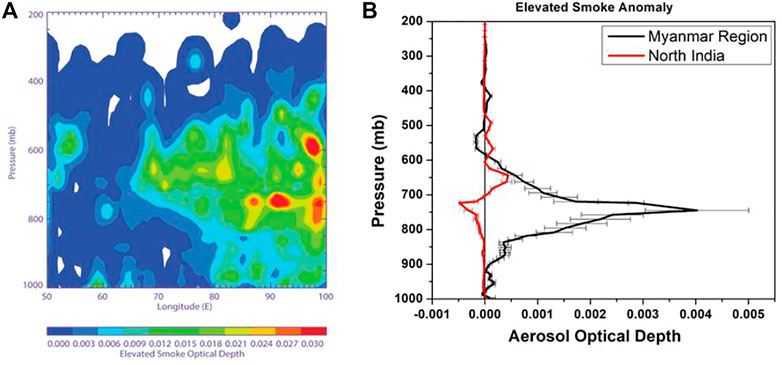
FIGURE 3. (A) Longitudinal variation of elevated smoke aerosols from CALIPSO at 532 nm during the lockdown period. (B) Profile of elevated smoke aerosol anomaly (2020-climatology) averaged for the lockdown period and over for the two regions: Myanmar (12–25oN and 92–100oE) and North India (22–30oN and 74–81oE). Horizontal lines in Figure 3B indicate standard deviation.
To understand the association of enhanced/reduced aerosols with clouds, we show the vertical distribution of specific cloud liquid water content over North India and Myanmar regions in Figure 4.
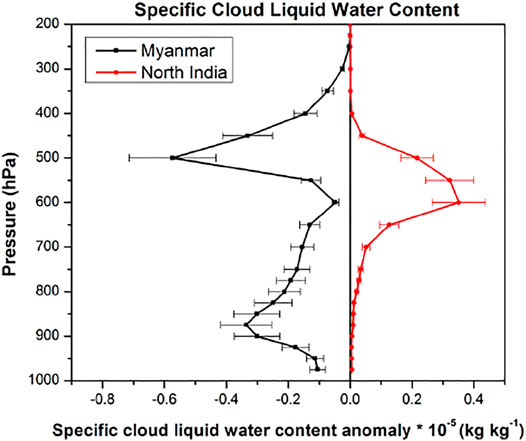
FIGURE 4. Anomalous specific cloud liquid water content for the two regions Myanmar (12–25oN and 92–100oE) and North India (22–30oN and 74–81oE) from the ERA data for the period of April-May. Horizontal lines in the figure indicate standard deviation.
Figure 4 shows negative anomalies in specific cloud liquid water content over the Myanmar region. It should be noted that anomalies in elevated smoke aerosols are positive at the same region, although altitude differs (Figure 3). Moreover, the vertical distribution of specific cloud liquid water content and elevated smoke aerosols over North India are opposite to the Myanmar region (Figures 3, 4). The minimum altitude in cloud liquid water content of 500 hPa and 900 hPa is at a higher level than the maximum altitude in elevated smoke aerosols (750 hPa) in Myanmar. It indicates that atmospheric heating by aerosol due to aerosol-radiation interaction spread above and below the layer of aerosols (Liu et al., 2020) that may be causing burning of low (900 hPa) and high clouds (500 hPa).
In general, there is a decrease in specific cloud liquid water content over the Myanmar region. It may be due to the increase in the elevated smoke aerosols (Figure 3B), which may be causing enhanced warming and suppression of low-level clouds through the radiative impacts (discussed in Section 3.4). It indicates the role of aerosols in the cloud formation process. We investigate the role of the Twomey effect; that is, aerosols act as cloud condensation nuclei and lead to a greater number of smaller cloud droplets in the presence of a constant amount of cloud liquid water content (Twomey, 1977.) Figures 2–4 show that the Myanmar region is associated with a high amount of biomass burning activity paired with high elevated smoke optical depths and negative cloud liquid water content, indicating that aerosols contributed to smaller cloud droplet formation. In contrast, the North Indian region is associated with lower elevated smoke aerosols accompanied with enhancement in specific cloud liquid water content, indicating larger cloud droplets and anti-Twomey effect. The aerosol impact on cloud formation and consequently on precipitation is still a challenge due to the complexity of aerosols (Flossmann and Wobrock, 2019; Morrison et al., 2020). Zhang et al. (2008) and Feingold et al. (2005) also showed that the increase in biomass burning aerosols leads to reduced cloudiness, which further stabilizes the boundary layer via surface cooling and elevated heating. Thus, enhanced absorbing aerosols over the Myanmar region have eventually dissipated the clouds (discussed in Section 3.3).
3.3 Impact on Cloud Fraction
Figure 5A,B shows the total cloud fraction anomaly from MODIS and MERRA during the lockdown period. It shows a reduction in cloud fraction over Myanmar −10% (−0.1) and enhancement over North India +10% (+0.1) in MODIS and MERRA. The high aerosol loading region over Myanmar is collocated with a negative cloud fraction anomaly. Huang et al., 2019 showed that biomass burning aerosols reaching ∼ 2 km altitudes absorb solar radiation and evaporate cloud droplets, reducing LWC, IWC, and cloud cover (decrease by 7%). In contrast, over the North Indian region, positive anomalies of cloud fraction are collocated with negative AOD anomalies.
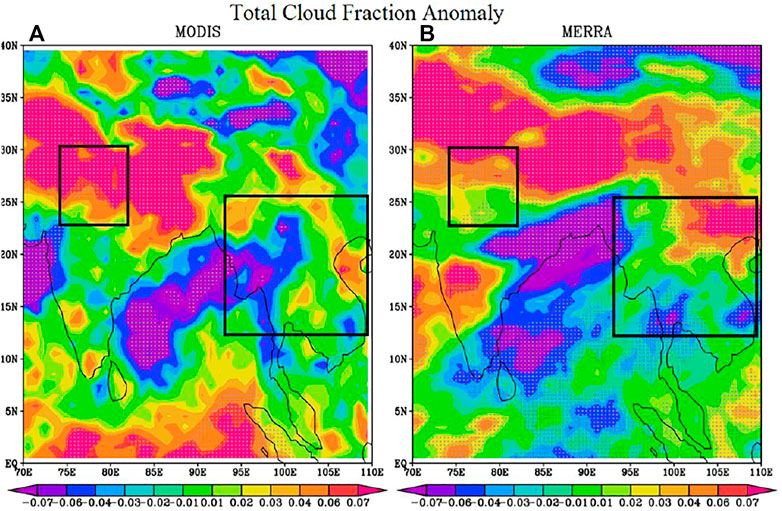
FIGURE 5. Total cloud fraction anomaly (2020-climatology) from MODIS and MERRA for the lockdown period of April-May. White dots in (A,B) indicate a 99% significance level. Boxes in (A,B) indicate North India and Myanmar regions.
Figures 1–5 indicate that the carbonaceous aerosols, emitted from biomass burning, might have suppressed local cloud fraction. Changes in aerosols affect the radiative forcing and therefore the atmosphere dynamics that, in turn, cause aerosol redistribution. Thus, aerosols produce feedback on dynamics and vice versa. Therefore, observed changes in cloud fraction may be the combined impact of carbonaceous aerosols and changes in dynamics. The high amount of biomass burning aerosols results in an increased amount of INP (Levin et al., 2016; Jahn et al., 2020). However, such analysis is out of the scope of this study. The impact of the suppressed/enhanced cloud fraction may affect the regional rainfall.
3.4 Heating Rate, Radiative Forcing, and Precipitation
Biomass burning aerosols are an important part of the Earth-atmosphere radiative budget. Absorbing the incoming solar radiation with consequent warming of the atmospheric layer, they cool the surface (Li et al., 2017; Zhang et al., 2020; Fadnavis et al., 2019). The lockdown of April–May 2020 was characterized by a higher number of fires over the Myanmar region and a lower number of fires over the North Indian region. It led to a differential biomass burning aerosol loading over these regions that might have affected heating and radiations. Figure 6A shows the anomaly of the heating rate profile for the elevated smoke aerosols observed by CALIPSO. The heating rate profiles over the Myanmar region show a significantly high amount of heating ∼0.05–2.8 K/day in the levels from 900 to 600 hPa, whereas the North Indian region shows a small amount of heating ∼0.05–0.2 K/day in the levels from 700 to 650 hPa. The strong heating in the Myanmar region coincides with the presence of elevated smoke aerosols. The North Indian region shows negative or no heating below 700 hPa during the lockdown period because of the absence of fires and anthropogenic aerosols, which used to otherwise contribute to heating. This high amount of heating may be responsible for cloud dissipation, affecting the precipitation over the Myanmar region. Figures 6B,C show the radiative forcing anomaly due to elevated smoke aerosols averaged for the lockdown period over the North Indian and Myanmar regions. It shows warming of ∼2.17 W/m2 the TOA over the Myanmar region and a slight cooling of ∼0.01 W/m2 over the North Indian region. The surface radiative forcing also shows slight warming of +0.19 W/m2 over the North Indian region, which may be due to improved air quality and more solar radiation reaching the surface during the lockdown period. The surface radiative forcing over the Myanmar region showed a cooling of ∼15.89 W/m2 due to the presence of an elevated smoke layer over the region. This accounts for the atmospheric warming of ∼18.06 W/m2 over the Myanmar region but an atmospheric cooling of ∼0.2 W/m2 over the North India region. This high atmospheric heating affects the cloud formation process and the stability of the atmosphere. Previous studies also showed warming in the TOA and cooling at the surface due to black carbon aerosols (Babu et al., 2002; Nair et al., 2017). The high surface cooling and atmospheric warming due to elevated smoke aerosols caused the burning of clouds and suppression of the precipitation. However, small surface warming due to less elevated smoke aerosols over the North Indian region might have caused an increase in liquid water content (as seen in Figure 4) to form clouds, giving rise to the enhanced precipitation over the North Indian region (see Figure 7).
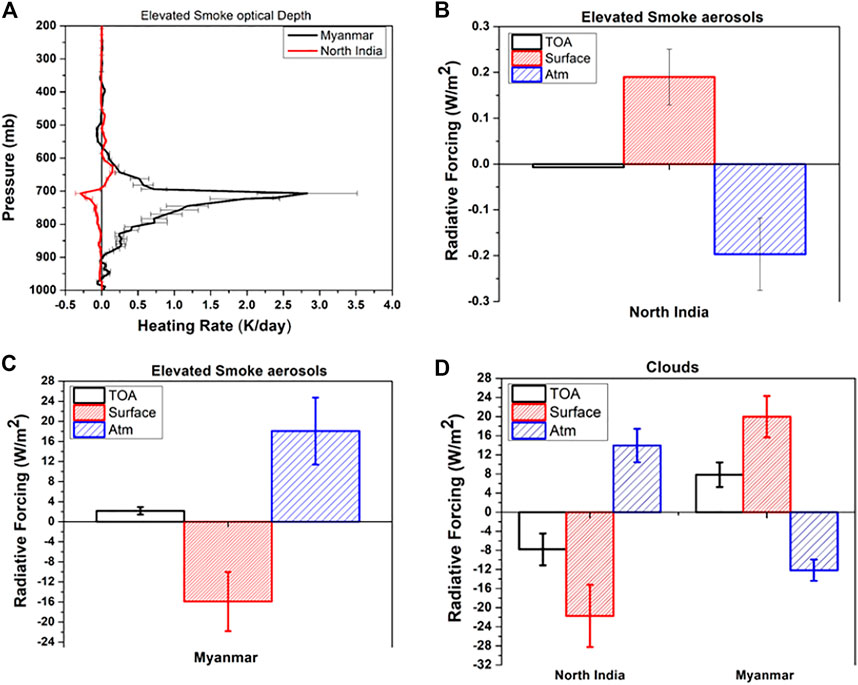
FIGURE 6. (A) Anomaly of heating rate profile for elevated smoke optical depth-averaged for the period of April-May for the two regions. (B) Radiative forcing due to the elevated smoke aerosols at the top of atmosphere (TOA), atmosphere (ATM), and surface for North Indian region. (C) Radiative forcing due to the elevated smoke aerosols at the top of atmosphere (TOA), atmosphere (ATM), and surface for Myanmar region (D) Radiative forcing due to the clouds at the TOA, ATM, and surface for the two regions North India and Myanmar.
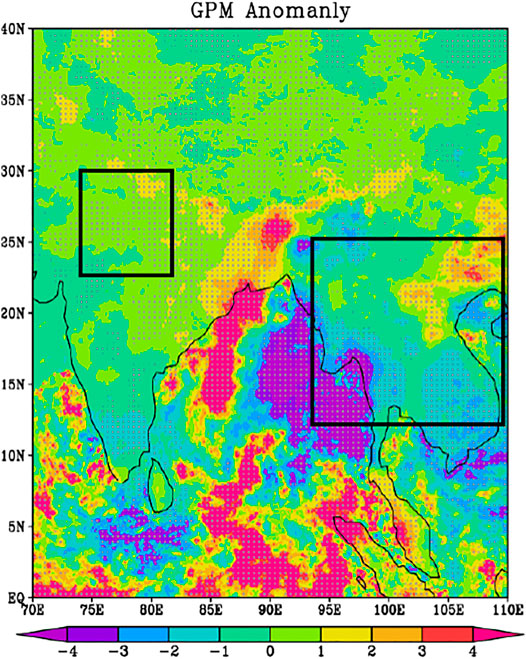
FIGURE 7. GPM rainfall anomaly (2020-climatology) for the lockdown period of April-May. White dots indicate a 99% significance level. Boxes indicate North India and Myanmar regions.
Figure 6C indicates cloud radiative forcing anomaly averaged for the lockdown period over the two regions. The North Indian region shows negative radiative forcing of ∼7.78 W/m2 at the TOA and ∼21.72 W/m2 at the surface, −13.98 W/m2 in atmosphere (TOA—surface) due to clouds. Myanmar regions show positive radiative forcing of ∼7.84 W/m2 at TOA and ∼19.99 W/m2 at the surface, and negative ∼ −12.51 W/m2 in atmosphere due to clouds. Thus, high atmospheric cloud warming (∼+14 W/m2) over the North Indian region may be conducive for rain formation processes in contrast to cloud atmospheric cooling (∼−13 W/m2) over the Myanmar region.
Figure 7 indicates the GPM rainfall anomaly for the lockdown period. An increase in the elevated smoke aerosols over the Myanmar region inhibited the cloud formation process leading to a high number of smaller cloud droplets, thereby suppressing rainfall over the Myanmar region. The North Indian region shows a reduction in elevated smoke during the lockdown period. The aerosol reduction has enhanced the cloud formation process resulting in enhanced rainfall over the North Indian region. In agreement with our results, Bhawar and Rahul 2013 showed that the absorbing aerosols had enhanced the microphysical and radiative effect, which reduced the cloud fraction by almost 30% and might have contributed to the drought-like conditions in the year 2009. It should be noted that the anomalies of cloud and rainfall might have been influenced by other drivers, such as convection and dynamics. As aerosols and these atmospheric drivers provide feedback on each other, the anomalies of cloud cover, atmospheric heating, and radiative forcing at the surface, rainfall, and so on agree with previous studies (Table 1).
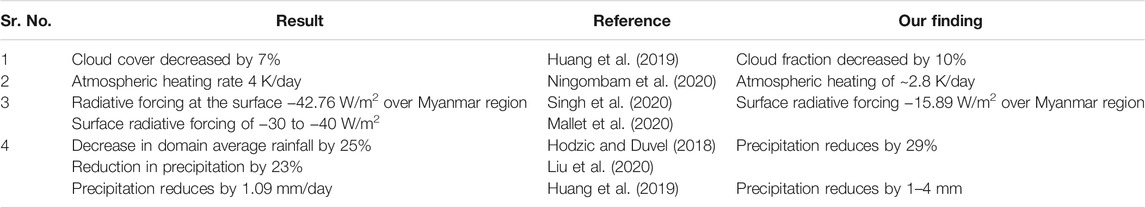
TABLE 1. A comparison of cloud cover, atmospheric heating, radiative forcing at the surface and rainfall with previous studies.
4 Conclusion
This study explores variability in aerosols and clouds over South Asia using multiple datasets (MODIS, MERRA, CALIPSO, and ERA-5) during the COVID lockdown period (April-May 2020). Our analysis shows that the distribution of AOD with South Asia shows a dipole pattern, that is, an enhancement over Myanmar and reduction over North India, although there was a reduction in anthropogenic aerosols due to lockdown restriction. MODIS fire count, along with CALIPSO elevated smoke data, shows that aerosol enhancement (reduction) over the Myanmar region (North India) is due to enhancement (reduction) in fires during the lockdown period compared to climatology (10 years). The smoke aerosol formed a layer over the Myanmar region (900–600 hPa with a peak at 750 hPa). They produced atmospheric heating of 0–2.8 K/day leading to in-atmospheric warming of (radiative forcing ∼18.06 W/m2 and cooling of the surface (∼15.89 W/m2). This region is associated with a reduction in cloud cover and precipitation (−1 to −4 mm), indicating cloud dissipation/burning by the heating due to the smoke aerosols. The North Indian region is associated with an increase in cloud cover, a decrease in cloud liquid water content, and an enhancement in precipitation. Thus, reduction in aerosol over North India might have enhanced precipitation via the anti-Twomey effect. The clouds over North India have produced radiative forcing ∼−21.72 W/m2 at the surface and ∼−7.78 W/m2 at the TOA and ∼ +14 W/m2 in the atmosphere. Although other factors contribute to precipitation processes, for example, moisture convergence, temperature gradient, low-pressure zone, and convective process (Levy et al., 2013; Gryspeerdt et al., 2020; Guo et al., 2020; Liu et al., 2020; Lolli and Vivone, 2020), this study provides a clear signature of cloud dissipation/burning by the smoke aerosol over the Myanmar region leading to precipitation reduction. Also, the anti-Twomey effect due to aerosol reduction over North India led to precipitation enhancement during the lockdown period. It should be noted that the anomalies of cloud and rainfall might have been influenced by other drivers such as convection and dynamics.
Data Availability Statement
The original contributions presented in the study are included in the article/Supplementary Material, further inquiries can be directed to the corresponding author.
Author Contributions
This article is the combined efforts of all the authors. RB and SF formulated and wrote the article, with contributions from all co-authors. DL, SB, PR, PP, and SL contributed to the analysis. SL computed heating rates and radiative forcing using a radiative transfer model.
Conflict of Interest
The authors declare that the research was conducted in the absence of any commercial or financial relationships that could be construed as a potential conflict of interest.
Publisher’s Note
All claims expressed in this article are solely those of the authors and do not necessarily represent those of their affiliated organizations or those of the publisher, the editors, and the reviewers. Any product that may be evaluated in this article, or claim that may be made by its manufacturer, is not guaranteed or endorsed by the publisher.
Acknowledgments
RB and DL acknowledge with gratitude the Department of Science and Technology (DST), SERB, through which the work was initiated. RB also acknowledges UGC-FRP, CALIPSO, MODIS, MERRA, and ERA database teams and NASA websites from where data were downloaded.
References
Ackerman, A. S., Toon, O. B., Stevens, D. E., Heymsfield, A. J., Ramanathan, V., and Welton, E. J. (2000). Reduction of Tropical Cloudiness by Soot. Science 288 (5468), 1042–1047. doi:10.1126/science.288.5468.1042
Albrecht, B. A. (1989). Aerosols, Cloud Microphysics, and Fractional Cloudiness. Science 245 (4923), 1227–1230. doi:10.1126/science.245.4923.1227
Andreae, M. O., and Rosenfeld, D. (2008). Aerosol-cloud-precipitation Interactions. Part 1. The Nature and Sources of Cloud-Active Aerosols. Earth-Science Rev. 89 (1-2), 13–41. doi:10.1016/j.earscirev.2008.03.001
Babu, S. S., Satheesh, S. K., and Moorthy, K. K. (2002). Aerosol Radiative Forcing due to Enhanced Black Carbon at an Urban Site in India. Geophys. Res. Lett. 29 (18), 1880. doi:10.1029/2002gl015826
Bhawar, R. L., Fadnavis, S., Kumar, V., Rahul, P. R. C., Sinha, T., and Lolli, S. (2021). Radiative Impacts of Aerosols during COVID-19 Lockdown Period over the Indian Region. Front. Environ. Sci. 9, 746090. doi:10.3389/fenvs.2021.746090
Bhawar, R. L., and Rahul, P. R. C. (2013). Aerosol-Cloud-Interaction Variability Induced by Atmospheric Brown Clouds during the 2009 Indian Summer Monsoon Drought. Aerosol Air Qual. Res. 13 (4), 1384–1391. doi:10.4209/aaqr.2012.11.0329
Biswas, S., Vadrevu, K. P., Lwin, Z. M., Lasko, K., and Justice, C. O. (2015). Factors Controlling Vegetation Fires in Protected and Non-protected Areas of Myanmar. PLoS one 10 (4), e0124346. doi:10.1371/journal.pone.0124346
Bréon, F.-M., Vermeulen, A., and Descloitres, J. (2011). An Evaluation of Satellite Aerosol Products against Sunphotometer Measurements. Remote sensing Environ. 115 (12), 3102–3111. doi:10.1016/j.rse.2011.06.017
Chavan, P., Fadnavis, S., Chakroborty, T., Sioris, C. E., Griessbach, S., and Müller, R. (2021). The Outflow of Asian Biomass Burning Carbonaceous Aerosol into the Upper Troposphere and Lower Stratosphere in spring: Radiative Effects Seen in a Global Model. Atmos. Chem. Phys. 21 (18), 14371–14384. doi:10.5194/acp-21-14371-2021
Derber, J. C., Purser, R. J., Wu, W. S., Treadon, R., Pondeca, M., Parrish, D., et al. (2003). “Flow-dependent Jb in a Global Grid-point 3D-Var,” in Proceeding of the ECMWF annual seminar on recent developments in data assimilation for atmosphere and ocean, U.K., 2003 September, 125–134.
Fadnavis, S., Sabin, T. P., Roy, C., Rowlinson, M., Rap, A., Vernier, J.-P., et al. (2019). Elevated Aerosol Layer over South Asia Worsens the Indian Droughts. Sci. Rep. 9 (1), 1–11. doi:10.1038/s41598-019-46704-9
Fadnavis, S., Sabin, T. P., Rap, A., Müller, R., Kubin, A., and Heinold, B. (2021). The Impact of COVID-19 Lockdown Measures on the Indian Summer Monsoon. Environ. Res. Lett. 16 (7), 074054. doi:10.1088/1748-9326/ac109c
Feingold, G., Jiang, H., and Harrington, J. Y. (2005). On Smoke Suppression of Clouds in Amazonia. Geophys. Res. Lett. 32, L02804. doi:10.1029/2004GL021369
Flossmann, A. I., and Wobrock, W. (2019). Cloud Processing of Aerosol Particles in marine Stratocumulus Clouds. Atmosphere 10 (9), 520. doi:10.3390/atmos10090520
Fu, Q., and Liou, K. N. (1992). On the Correlatedk-Distribution Method for Radiative Transfer in Nonhomogeneous Atmospheres. J. Atmos. Sci. 49, 2139–2156. doi:10.1175/1520-0469(1992)049<2139:otcdmf>2.0.co;2
Fu, Q., and Liou, K. N. (1993). Parameterization of the Radiative Properties of Cirrus Clouds. J. Atmos. Sci. 50, 2008–2025. doi:10.1175/1520-0469(1993)050<2008:potrpo>2.0.co;2
Geng, G., Zhang, Q., Martin, R. V., van Donkelaar, A., Huo, H., Che, H., et al. (2015). Estimating Long-Term PM2.5 Concentrations in China Using Satellite-Based Aerosol Optical Depth and a Chemical Transport Model. Remote sensing Environ. 166, 262–270. doi:10.1016/j.rse.2015.05.016
Gryspeerdt, E., Mülmenstädt, J., Gettelman, A., Malavelle, F. F., Morrison, H., Neubauer, D., et al. (2020). Surprising Similarities in Model and Observational Aerosol Radiative Forcing Estimates. Atmos. Chem. Phys. 20 (1), 613–623. doi:10.5194/acp-20-613-2020
Gu, Y., Farrara, J., Liou, K. N., and Mechoso, C. R. (2003). Parameterization of Cloud-Radiation Processes in the UCLA General Circulation Model. J. Clim. 16, 3357–3370. doi:10.1175/1520-0442(2003)016<3357:pocpit>2.0.co;2
Gu, Y., Liou, K. N., Ou, S. C., and Fovell, R. (2011). Cirrus Cloud Simulations Using WRF with Improved Radiation Parameterization and Increased Vertical Resolution. J. Geophys. Res. 116, D06119. doi:10.1029/2010JD014574
Guo, Z. D., Wang, Z. Y., Zhang, S. F., Li, X., Li, L., Li, C., et al. (2020). Aerosol and Surface Distribution of Severe Acute Respiratory Syndrome Coronavirus 2 in Hospital Wards, Wuhan, China, 2020. Emerg. Infect. Dis. 26 (7), 1583–1591. doi:10.3201/eid2607.200885
Hodzic, A., and Duvel, J. P. (2018). Impact of Biomass Burning Aerosols on the Diurnal Cycle of Convective Clouds and Precipitation over a Tropical Island. J. Geophys. Res. Atmos. 123, 1017–1036. doi:10.1002/2017jd027521
Hsu, N. C., Gautam, R., Sayer, A. M., Bettenhausen, C., Li, C., Jeong, M. J., et al. (2012). Global and Regional Trends of Aerosol Optical Depth over Land and Ocean Using SeaWiFS Measurements from 1997 to 2010. Atmos. Chem. Phys. 12 (17), 8037–8053. doi:10.5194/acp-12-8037-2012
Huang, L., Lin, W., Li, F., Wang, Y., and Jiang, B. (2019). Climate Impacts of the Biomass Burning in Indochina on Atmospheric Conditions over Southern China. Aerosol Air Qual. Res. 9, 2707–2720. doi:10.4209/aaqr.2019.01.0028
Huffman, G. J., Bolvin, D. T., Nelkin, E. J., and Tan, J. (2015). Integrated Multi-satellitE Retrievals for GPM (IMERG) Technical Documentation. NASA/GSFC Code 612 (47), 2019.
Hunt, W. H., Winker, D. M., Vaughan, M. A., Powell, K. A., Lucker, P. L., and Weimer, C. (2009). CALIPSO Lidar Description and Performance Assessment. J. Atmos. Oceanic Tech. 26 (7), 1214–1228. doi:10.1175/2009jtecha1223.1
Ippc, (2013). in Climate Change 2013: The Physical Science Basis. Contribution of Working Group I to the Fifth Assessment Report of the Intergovernmental Panel on Climate Change. Editors T. F. Stocker, D. Qin, G.-K. Plattner, M. Tignor, S. K. Allen, J. Boschunget al. (Cambridge, United Kingdom and New York, NY, USA: Cambridge University Press), 1535.
Jahn, L. G., Polen, M. J., Jahl, L. G., Brubaker, T. A., Somers, J., and Sullivan, R. C. (2020). Biomass Combustion Produces Ice-Active Minerals in Biomass-Burning Aerosol and Bottom Ash. Proc. Natl. Acad. Sci. USA 117 (36), 21928–21937. doi:10.1073/pnas.1922128117
Jain, S., and Sharma, T. (2020). Social and Travel Lockdown Impact Considering Coronavirus Disease (COVID-19) on Air Quality in Megacities of India: Present Benefits, Future Challenges and Way Forward. Aerosol Air Qual. Res. 20 (6), 1222–1236. doi:10.4209/aaqr.2020.04.0171
Johnson, R. B., and Onwuegbuzie, A. J. (2004). Mixed Methods Research: A Research Paradigm Whose Time Has Come. Educ. Res. 33 (7), 14–26. doi:10.3102/0013189x033007014
Jones, A., Haywood, J. M., and Boucher, O. (2007). Aerosol Forcing, Climate Response and Climate Sensitivity in the Hadley Centre Climate Model. J. Geophys. Res. Atmospheres 112, D20211. doi:10.1029/2007jd008688
Kaskaoutis, D. G., Kumar Kharol, S., Sinha, P. R., Singh, R. P., Kambezidis, H. D., Rani Sharma, A., et al. (2011). Extremely Large Anthropogenic-Aerosol Contribution to Total Aerosol Load over the Bay of Bengal during winter Season. Atmos. Chem. Phys. 11 (14), 7097–7117. doi:10.5194/acp-11-7097-2011
Kaufman, Y. J., Koren, I., Remer, L. A., Rosenfeld, D., and Rudich, Y. (2005). The Effect of Smoke, Dust, and Pollution Aerosol on Shallow Cloud Development over the Atlantic Ocean. Proc. Natl. Acad. Sci. 102 (32), 11207–11212. doi:10.1073/pnas.0505191102
Kim, M.-H., Omar, A. H., Tackett, J. L., Vaughan, M. A., Winker, D. M., Trepte, C. R., et al. (2018). The CALIPSO Version 4 Automated Aerosol Classification and Lidar Ratio Selection Algorithm. Atmos. Meas. Tech. 11 (11), 6107–6135. doi:10.5194/amt-11-6107-2018
Koren, I., Martins, J. V., Remer, L. A., and Afargan, H. (2008). Smoke Invigoration versus Inhibition of Clouds over the Amazon. science 321 (5891), 946–949. doi:10.1126/science.1159185
Levin, E. J. T., McMeeking, G. R., DeMott, P. J., McCluskey, C. S., Carrico, C. M., Nakao, S., et al. (2016). Ice‐nucleating Particle Emissions from Biomass Combustion and the Potential Importance of Soot Aerosol. J. Geophys. Res. Atmos. 121, 5888–5903. doi:10.1002/2016JD024879
Levy, R. C., Remer, L. A., Kleidman, R. G., Mattoo, S., Ichoku, C., Kahn, R., et al. (2010). Global Evaluation of the Collection 5 MODIS Dark-Target Aerosol Products over Land. Atmos. Chem. Phys. 10 (21), 10399–10420. doi:10.5194/acp-10-10399-2010
Levy, H., Horowitz, L. W., Schwarzkopf, M. D., Ming, Y., Golaz, J.-C., Naik, V., et al. (2013). The Roles of Aerosol Direct and Indirect Effects in Past and Future Climate Change. J. Geophys. Res. Atmos. 118 (10), 4521–4532. doi:10.1002/jgrd.50192
Li, Z., Guo, J., Ding, A., Liao, H., Liu, J., Sun, Y., et al. (2017). Aerosol and Boundary-Layer Interactions and Impact on Air Quality. Natl. Sci. Rev. 4 (6), 810–833. doi:10.1093/nsr/nwx117
Li, J., Jiang, Y., Xia, X., and Hu, Y. (2018). Increase of Surface Solar Irradiance across East China Related to Changes in Aerosol Properties during the Past Decade. Environ. Res. Lett. 13 (3), 034006. doi:10.1088/1748-9326/aaa35a
Lin, C.-Y., Hsu, H.-m., Lee, Y. H., Kuo, C. H., Sheng, Y.-F., and Chu, D. A. (2009). A New Transport Mechanism of Biomass Burning from Indochina as Identified by Modeling Studies. Atmos. Chem. Phys. 9 (20), 7901–7911. doi:10.5194/acp-9-7901-2009
Liu, S., Aiken, A. C., Arata, C., Dubey, M. K., Stockwell, C. E., Yokelson, R. J., et al. (2014). Aerosol Single Scattering Albedo Dependence on Biomass Combustion Efficiency: Laboratory and Field Studies. Geophys. Res. Lett. 41 (2), 742–748. doi:10.1002/2013gl058392
Liu, L., Cheng, Y., Wang, S., Wei, C., Pöhlker, M. L., Pöhlker, C., et al. (2020). Impact of Biomass Burning Aerosols on Radiation, Clouds, and Precipitation over the Amazon: Relative Importance of Aerosol-Cloud and Aerosol-Radiation Interactions. Atmos. Chem. Phys. 20, 13283–13301. doi:10.5194/acp-20-13283-2020
Lolli, S. (2021). Is the Air Too Polluted for Outdoor Activities? Check by Using Your Photovoltaic System as an Air-Quality Monitoring Device. Sensors 21 (19), 6342. doi:10.3390/s21196342
Lolli, S., Khor, W. Y., Matjafri, M. Z., and Lim, H. S. (2019). Monsoon Season Quantitative Assessment of Biomass Burning clear-sky Aerosol Radiative Effect at Surface by Ground-Based Lidar Observations in Pulau Pinang, Malaysia in 2014. Remote Sensing 11 (22), 2660. doi:10.3390/rs11222660
Lolli, S., Chen, Y. C., Wang, S. H., and Vivone, G. (2020). Impact of Meteorological Conditions and Air Pollution on COVID-19 Pandemic Transmission in Italy. Sci. Rep. 10 (1), 16213–16215. doi:10.1038/s41598-020-73197-8
Lolli, S., and Vivone, G. (2020). The Role of Tropospheric Ozone in Flagging COVID-19 Pandemic Transmission. Bull. Atmos. Sci. Technol. 1 (3), 551–555. doi:10.1007/s42865-020-00026-1
Ma, X., Yu, F., and Luo, G. (2012). Aerosol Direct Radiative Forcing Based on GEOS-Chem-APM and Uncertainties. Atmos. Chem. Phys. 12 (12), 5563–5581. doi:10.5194/acp-12-5563-2012
Mallet, M., Solmon, F., Nabat, P., Elguindi, N., Waquet, F., Bouniol, D., et al. (2020). Direct and Semi-direct Radiative Forcing of Biomass-Burning Aerosols over the Southeast Atlantic (SEA) and its Sensitivity to Absorbing Properties: a Regional Climate Modeling Study. Atmos. Chem. Phys. 20, 13191–13216. doi:10.5194/acp-20-13191-2020
McGrath-Spangler, E. L., and Denning, A. S. (2013). Global Seasonal Variations of Midday Planetary Boundary Layer Depth from CALIPSO Space-Borne LIDAR. J. Geophys. Res. Atmos. 118 (3), 1226–1233. doi:10.1002/jgrd.50198
Mishra, M. K., and Rathore, P. S. (2021). Impact of Nationwide COVID-19 Lockdown on Indian Air Quality in Terms of Aerosols as Observed from the Space. Aerosol Air Qual. Res. 21, 200461. doi:10.4209/aaqr.2020.07.0461
Morrison, H., van Lier-Walqui, M., Fridlind, A. M., Grabowski, W. W., Harrington, J. Y., Hoose, C., et al. (2020). Confronting the Challenge of Modeling Cloud and Precipitation Microphysics. J. adv. model. earth syst. 12. doi:10.1029/2019MS001689
Muhammad, S., Long, X., and Salman, M. (2020). COVID-19 Pandemic and Environmental Pollution: A Blessing in Disguise? Sci. total Environ. 728, 138820. doi:10.1016/j.scitotenv.2020.138820
Nair, V. S., Babu, S. S., Manoj, M. R., Moorthy, K. K., and Chin, M. (2017). Direct Radiative Effects of Aerosols over South Asia from Observations and Modeling. Clim. Dyn. 49 (4), 1411–1428. doi:10.1007/s00382-016-3384-0
Ningombam, S. S., Chandra Dumka, U., Srivastava, A. K., and Song, H.-J. (2020). Optical and Physical Properties of Aerosols during Active Fire Events Occurring in the Indo-Gangetic Plains: Implications for Aerosol Radiative Forcing. Atmos. Environ. 223, 17225. doi:10.1016/j.atmosenv.2019.117225
Paital, B. (2020). Nurture to Nature via COVID-19, a Self-Regenerating Environmental Strategy of Environment in Global Context. Sci. Total Environ. 729, 139088. doi:10.1016/j.scitotenv.2020.139088
Pandey, S. K., and Vinoj, V. (2021). Surprising Changes in Aerosol Loading over India amid COVID-19 Lockdown. Aerosol Air Qual. Res. 21, 200466. doi:10.4209/aaqr.2020.07.0466
Pathakoti, M., Muppalla, A., Hazra, S., D. Venkata, M., A. Lakshmi, K., K. Sagar, V., et al. (2021). Measurement Report: An Assessment of the Impact of a Nationwide Lockdown on Air Pollution - a Remote Sensing Perspective over India. Atmos. Chem. Phys. 21 (11), 9047–9064. doi:10.5194/acp-21-9047-2021
Pincus, R., and Baker, M. B. (1994). Effect of Precipitation on the Albedo Susceptibility of Clouds in the marine Boundary Layer. Nature 372 (6503), 250–252. doi:10.1038/372250a0
Poli, P., Hersbach, H., Dee, D. P., Berrisford, P., Simmons, A. J., Vitart, F., et al. (2016). ERA-20C: An Atmospheric Reanalysis of the Twentieth century. J. Clim. 29 (11), 4083–4097. doi:10.1175/jcli-d-15-0556.1
Posselt, R., and Lohmann, U. (2008). Influence of Giant CCN on Warm Rain Processes in the ECHAM5 GCM. Atmos. Chem. Phys. 8 (14), 3769–3788. doi:10.5194/acp-8-3769-2008
Reddy, B. S. K., Kumar, K. R., Balakrishnaiah, G., Gopal, K. R., Reddy, R. R., Reddy, L. S. S., et al. (2012). Potential Source Regions Contributing to Seasonal Variations of Black Carbon Aerosols over Anantapur in Southeast India. Aerosol Air Qual. Res., 12(3), 344–358. doi:10.4209/aaqr.2011.10.0159
Remer, L. A., Kaufman, Y. J., Tanré, D., Mattoo, S., Chu, D. A., Martins, J. V., et al. (2005). The MODIS Aerosol Algorithm, Products, and Validation. J. Atmos. Sci. 62 (4), 947–973. doi:10.1175/jas3385.1
Remer, L. A., Kleidman, R. G., Levy, R. C., Kaufman, Y. J., Tanré, D., Mattoo, S., et al. (2008). Global Aerosol Climatology from the MODIS Satellite Sensors. J. Geophys. Res. Atmospheres 113, D14S07. doi:10.1029/2007jd009661
Rienecker, M. M., Suarez, M. J., Gelaro, R., Todling, R., Bacmeister, J., Liu, E., et al. (2011). MERRA: NASA's Modern-Era Retrospective Analysis for Research and Applications. J. Clim. 24 (14), 3624–3648. doi:10.1175/jcli-d-11-00015.1
Sanap, S. D. (2021). Global and Regional Variations in Aerosol Loading during COVID-19 Imposed Lockdown. Atmos. Environ. 246, 118132. doi:10.1016/j.atmosenv.2020.118132
Seinfeld, J. H., Bretherton, C., Carslaw, K. S., Coe, H., DeMott, P. J., Dunlea, E. J., et al. (2016). Improving Our Fundamental Understanding of the Role of Aerosol−cloud Interactions in the Climate System. Proc. Natl. Acad. Sci. USA 113 (21), 5781–5790. doi:10.1073/pnas.1514043113
Shepherd, R. H., King, M. D., Marks, A. A., Brough, N., and Ward, A. D. (2018). Determination of the Refractive index of Insoluble Organic Extracts from Atmospheric Aerosol over the Visible Wavelength Range Using Optical Tweezers. Atmos. Chem. Phys. 18 (8), 5235–5252. doi:10.5194/acp-18-5235-2018
Shi, Y., Zhang, J., Reid, J. S., Liu, B., and Hyer, E. J. (2014). Critical Evaluation of Cloud Contamination in the MISR Aerosol Products Using MODIS Cloud Mask Products. Atmos. Meas. Tech. 7 (6), 1791–1801. doi:10.5194/amt-7-1791-2014
Singh, P., Sarawade, P., and Adhikary, B. (2020). Carbonaceous Aerosol from Open Burning and its Impact on Regional Weather in South Asia. Aerosol Air Qual. Res. 20, 419–431. doi:10.4209/aaqr.2019.03.0146
Singh, R. P., and Chauhan, A. (2020). Impact of Lockdown on Air Quality in India during COVID-19 Pandemic. Air Qual. Atmos. Health 13 (8), 921–928. doi:10.1007/s11869-020-00863-1
Song, M., Marcolli, C., Krieger, U. K., Zuend, A., and Peter, T. (2012). Liquid‐liquid Phase Separation in Aerosol Particles: Dependence on O: C, Organic Functionalities, and Compositional Complexity. Geophys. Res. Lett. 39, L19801. doi:10.1029/2012gl052807
Thomas, A., Kanawade, V. P., Sarangi, C., and Srivastava, A. K. (2021). Effect of COVID-19 Shutdown on Aerosol Direct Radiative Forcing over the Indo-Gangetic Plain Outflow Region of the Bay of Bengal. Sci. Total Environ. 782, 146918. doi:10.1016/j.scitotenv.2021.146918
Tosca, M. G., Randerson, J. T., and Zender, C. S. (2013). Global Impact of Smoke Aerosols from Landscape Fires on Climate and the Hadley Circulation. Atmos. Chem. Phys. 13 (10), 5227–5241. doi:10.5194/acp-13-5227-2013
Twomey, S. (1977). The Influence of Pollution on the Shortwave Albedo of Clouds. J. Atmos. Sci. 34 (7), 1149–1152. doi:10.1175/1520-0469(1977)034<1149:tiopot>2.0.co;2
Vadrevu, K. P., Lasko, K., Giglio, L., and Justice, C. (2015). Vegetation Fires, Absorbing Aerosols and Smoke Plume Characteristics in Diverse Biomass Burning Regions of Asia. Environ. Res. Lett. 10 (10), 105003. doi:10.1088/1748-9326/10/10/105003
Wagh, S., Singh, P., Ghude, S. D., Safai, P., Prabhakaran, T., and Kumar, P. P. (2021). Study of Ice Nucleating Particles in Fog-Haze Weather at New Delhi, India: A Case of Polluted Environment. Atmos. Res. 259 (2021), 105693. doi:10.1016/j.atmosres.2021.105693
Wu, W.-S., Purser, R. J., and Parrish, D. F. (2002). Three-dimensional Variational Analysis with Spatially Inhomogeneous Covariances. Mon. Wea. Rev. 130 (12), 2905–2916. doi:10.1175/1520-0493(2002)130<2905:tdvaws>2.0.co;2
Young, S. A., and Vaughan, M. A. (2009). The Retrieval of Profiles of Particulate Extinction from Cloud-Aerosol Lidar Infrared Pathfinder Satellite Observations (CALIPSO) Data: Algorithm Description. J. Atmos. Oceanic Tech. 26 (6), 1105–1119. doi:10.1175/2008jtecha1221.1
Yunus, A. P., Masago, Y., and Hijioka, Y. (2020). COVID-19 and Surface Water Quality: Improved lake Water Quality during the Lockdown. Sci. Total Environ. 731, 139012. doi:10.1016/j.scitotenv.2020.139012
Zhang, R., Khalizov, A. F., Pagels, J., Zhang, D., Xue, H., and McMurry, P. H. (2008). Variability in Morphology, Hygroscopicity, and Optical Properties of Soot Aerosols during Atmospheric Processing. Proc. Natl. Acad. Sci. 105 (30), 10291–10296. doi:10.1073/pnas.0804860105
Zhang, X., Ji, Z., Yue, Y., Liu, H., and Wang, J. (2020). Infection Risk Assessment of COVID-19 Through Aerosol Transmission: A Case Study of South China Seafood Market. Environ. Sci. Technol. 55 (7), 4123–4133. doi:10.1021/acs.est.0c02895
Zhang, Y. L., Huang, R. J., El Haddad, I., Ho, K. F., Cao, J. J., Han, Y., et al. (2015). Fossil vs. Non-Fossil Sources of Fine Carbonaceous Aerosols in Four Chinese Cities During the Extreme Winter Haze Episode of 2013. Atmos. Chem. Phys. 15 (3), 1299–1312. doi:10.5194/acp-15-1299-2015
Keywords: aerosols, clouds, biomass burning, radiative forcing, precipitation
Citation: Lawand D, Bhakare S, Fadnavis S, Bhawar RL, Rahul PRC, Pallath PK and Lolli S (2022) Variability of Aerosols and Clouds Over North Indian and Myanmar During the COVID-19 Lockdown Period. Front. Environ. Sci. 10:838778. doi: 10.3389/fenvs.2022.838778
Received: 18 December 2021; Accepted: 24 February 2022;
Published: 15 March 2022.
Edited by:
Yang Gao, Ocean University of China, ChinaReviewed by:
Eduardo Landulfo, Instituto de Pesquisas Energéticas e Nucleares (IPEN), BrazilShweta Yadav, Central University of Jammu, India
Copyright © 2022 Lawand, Bhakare, Fadnavis, Bhawar, Rahul, Pallath and Lolli. This is an open-access article distributed under the terms of the Creative Commons Attribution License (CC BY). The use, distribution or reproduction in other forums is permitted, provided the original author(s) and the copyright owner(s) are credited and that the original publication in this journal is cited, in accordance with accepted academic practice. No use, distribution or reproduction is permitted which does not comply with these terms.
*Correspondence: Rohini L. Bhawar, cm9oaW5pYmhhd2FyQGdtYWlsLmNvbQ==