 Xinyang Yu
 Yin Zhang
 Ningwei Liu
 Suying Yang4
95% of researchers rate our articles as excellent or good
Learn more about the work of our research integrity team to safeguard the quality of each article we publish.
Find out more
ORIGINAL RESEARCH article
Front. Environ. Sci. , 21 January 2022
Sec. Atmosphere and Climate
Volume 10 - 2022 | https://doi.org/10.3389/fenvs.2022.837158
This article is part of the Research Topic Air Pollution Remote Sensing and the Subsequent Interactions with Ecology on Regional Scales View all 31 articles
With the increasing control of air pollution, the levels of atmospheric particulates in the Pearl River Delta (PRD) region are gradually decreasing. However, ozone pollution has become more and more serious, and the problem of secondary aerosol pollution caused by photochemical reactions cannot be ignored. Based on the observation data of environmental and meteorological stations in the nine cities of the PRD during 2019, we investigated the variations of secondary PM2.5 (PM2.5-sec) in the PRD under different photochemical reactivity backgrounds. It was shown that the photochemical reactivities appeared more significant in the central and western areas than those in the eastern areas of the PRD and appeared more significant in inland areas than those in coastal areas. The days of moderate and high photochemical reactivities mainly appeared from August to November. PM2.5-sec concentrations were the highest in autumn, during which the regional discrepancies appeared most significantly with the highest levels in the southern areas. With the enhancement of the photochemical reactivity background, the PM2.5-sec level at each station increased significantly, which appeared significantly higher in coastal areas than in inland areas. Both PM2.5-sec and ozone concentrations showed single-peak variations, which appeared higher in the daytime than at night with the peak occurring at about 15:00. For each pollutant, the average maximum concentration appeared higher for polluted stations than for clean ones, indicating that the atmospheric oxidation background was conducive to the formation of PM2.5-sec.
With the strengthening of environmental governance, air pollution in some cities of China has been gradually transforming from single to complex pollution as a result of the increase in ozone and aerosol levels (Zhang et al., 2019; Wang et al., 2021a; Wang et al., 2021b; Wang et al., 2021c). Ozone and aerosols significantly influence human health, crop yield, and global climate change (Mills et al., 2009; Stoker et al., 2013; Zhang et al., 2017; Fleming et al., 2018), meaning that their coordinated control is very urgent. Therefore, many scholars have carried out relevant studies and found that their coordinated variations are fulfilled through the influence of aerosols on the levels of atmospheric radiation and hydroxyl radicals and the influence of ozone on atmospheric photochemical reactivities (Yuan et al., 2012; Liu et al., 2021; Wang et al., 2021a; Wang et al., 2021b; Wang et al., 2021c). It is worth noting that the strengthening of atmospheric photochemical reactivities and the following significant growth of secondary aerosols resulting from ozone enhancement have become the common causes of complex pollution in China. However, because of the influence of weather background, emission source structure, and geographical factors, the characteristics of complex pollution are different (Liu et al., 2019; Zhao et al., 2021). Some scholars found that with the increase of PM2.5 levels, the maximum values and change rates of ozone concentrations with different backgrounds in Guangzhou increase gradually, indicating the coordinated increase between PM2.5 and ozone (Yao et al., 2021). Some scholars found that in Handan, the fourth largest city of Hebei Province, ozone increased with the enhancement of PM2.5 during summer in the case of its concentration being below the standard values, whereas high-level PM2.5 had an inhibitory effect on ozone formation in winter (Zhao et al., 2021).
The common precursors of aerosols and ozone (i.e., VOCS and NOx) can be transformed into secondary aerosols and inorganic salts through gas–particulate matter interactions (Xing et al., 2017), contributing to the formation of PM2.5. Li (Li et al., 2020) evaluated the coordinated increase of ozone and secondary aerosols in Beijing, Shanghai, and Guangzhou and found that the formation of secondary aerosols in Shanghai and Guangzhou increased by multiples with the enhancement of photochemical reactivities, whereas that in Beijing was scarcely varied. Previous studies were mainly based on a single city or station and rarely focused on regional ozone and secondary aerosol variations (Wu et al., 2021).
The Pearl River Delta (PRD) region is located south of the Tropic of Cancer, bordering the South China Sea, with good thermal conditions. The regional economy is developed, the manufacturing industry is prosperous, and the population is dense. The precursors produced by a large number of industrial sources and man-made sources are conducive to the generation of ozone photochemical reactions. In recent years, the ozone levels in the PRD have gradually increased (Zhan, 2018; Yin and Wang, 2020), with complex pollution of ozone and secondary aerosols occurring frequently (Lai et al., 2018). In this article, we analyze the various characteristics of PM2.5-sec concentration in the PRD under different photochemical reactivity backgrounds, based on the observed data from environmental and meteorological stations in nine cities of the PRD in 2019; the correlation between ozone pollution and secondary PM2.5 were revealed; and the possible mechanisms of formation of PM2.5-sec under different ozone levels were analyzed, which provide scientific support for the coordinated control of PM2.5 and ozone in the PRD.
This article selects the PRD as the research area including nine cities of Guangdong Province, i.e., Zhaoqing, Guangzhou, Foshan, Zhuhai, Jiangmen, Zhongshan, Huizhou, Shenzhen, and Dongguan. The data come from the national control station of the Department of Ecology and Environment of Guangdong Province (Station No. 1345A-1400A, Figure 1). Season classification criteria are as follows: spring (March, April, and May), summer (June, July, and August), autumn (September, October, and November), and winter (December, January, and February). The validities of atmospheric pollutant concentration data meet the requirements of the Environmental Air Quality Standard (GB3095-2012) and the Technical Specification for Environmental Air Quality Assessment (TRIAL) (HJ633-2013). The meteorological data come from the national basic meteorological observation stations of the respective cities, and the accuracy of all meteorological data was over 98% after quality control. Data on the 10 m mean wind and accumulated rainfall in the PRD in 2019 were obtained from the EC ERA5 monthly reanalysis data.
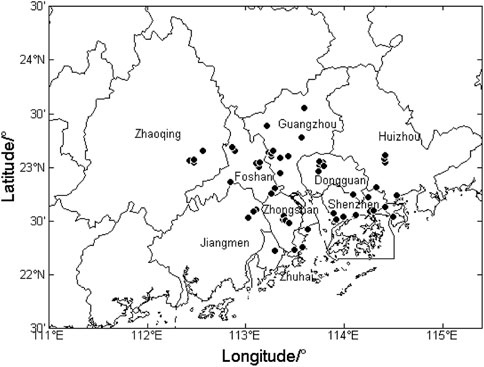
FIGURE 1. Distribution of national control stations in the Pearl River Delta.
Li et al. (2020) used the following research methods to analyze the coordinated increase of ozone and secondary aerosols in typical Chinese cities: First, the daily maximum 1 h average concentration of ozone (O3-max) was used to classify the atmospheric photochemical reactivity level. O3-max < 100 μg/m3 was defined as a low level of photochemical reactivity (O3L), and 100 μg/m3 ≤ O3-max < 160 μg/m3 was defined as a light level of photochemical reactivity (O3LH). 160 μg/m3 ≤ O3-max < 200 μg/m3 was defined as a moderate level of photochemical reactivity (O3M), and O3-max ≥ 200 μg/m3 was defined as a high level of photochemical reactivity (O3H). Then, CO was used as a tracer of the primary emission source, assuming that the structure of the emission source is basically stable; the larger the ratio of PM2.5/CO mass concentration is, the larger the proportion of secondary components in PM2.5 is (Chang and Lee, 2007; Zhang et al., 2015). Specific equations are as follows:
where p is the primary pollutant, sec is a secondary pollutant, and obs is observed PM2.5 concentration. t is the specific time of the day. L, LH, M, and H represent O3L, O3LH, O3M, and O3H, respectively.
Figure 2 shows the mean concentrations of PM2.5, NO2, O3–8h, and CO at various stations in the PRD in 2019. The air pollutants have obvious spatial variation characteristics. Concentrations of PM2.5, NO2, and CO are higher in the central and northern parts of the PRD (e.g., Guangzhou, Foshan, and Dongguan), whereas they are lower in coastal areas. The maximum annual mean concentrations of PM2.5, NO2, and CO appear in Dongguan (37 μg/m3), Guangzhou (54 μg/m3), and Foshan (980 μg/m3), respectively. The average ozone concentrations in coastal areas (e.g., Zhuhai, Shenzhen, and Huizhou) are higher than those in other areas, and the maximum appears in Shenzhen with a value of 72 μg/m3.
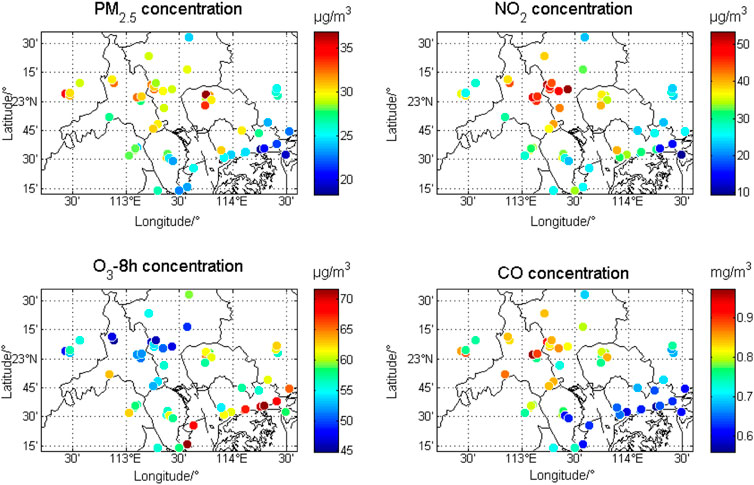
FIGURE 2. Mean concentrations of PM2.5, NO2, O3–8h, and CO at various stations.
Table 1 shows the seasonal variations of air pollutants in the PRD in 2019. The average concentrations of PM2.5, CO, and NO2 in the PRD appear the highest in winter and the lowest in summer, whereas the concentrations of O3–8h appear the highest in autumn and the lowest in winter. The concentrations of PM2.5, NO2, and CO in the northern part of the PRD are higher than those in the southern part, whereas the distributions of O3–8h appear vice versa. Figure 3 shows the variations of PM2.5 and ozone with temperature and humidity during autumn and winter in the PRD. The high-level PM2.5 in autumn mainly occurs in the environment with humidity over 80%, but there is no similar distribution in winter. High ozone concentrations in autumn and winter appear under high-temperature and low-humidity conditions. According to the 10 m average wind field and cumulative rainfall distribution in the PRD (Figure 4), the prevailing wind directions in spring and summer are southeast and southwest, which bring clean marine air mass. Meanwhile, abundant precipitation is also conducive to pollutant removal. In autumn and winter, the prevailing wind changes to the northeastern direction, leading to inland polluted air masses influencing the air quality of the PRD, and the precipitation decreasing significantly compared with that in spring and summer, thus forming high levels of PM2.5, NO2, and CO in autumn and winter. In addition, concentrated human activities in the central PRD (e.g., Guangzhou, Foshan, and Dongguan) cause the local levels of primary air pollutants to be higher than those in the coastal areas. For the secondary pollutants (e.g., ozone), the northeast wind in autumn brings polluted air masses from the upwind direction in the PRD (Dongguan, Foshan, and Guangzhou), and the air masses mix with the local pollution, forming ozone enhancement in the southern and coastal areas. In summer, under the conditions of high temperature and strong radiation, a large number of local photochemical reactions cause ozone concentrations to be slightly higher than those in spring and winter.

TABLE 1. Seasonal variations of air pollutants in the PRD.
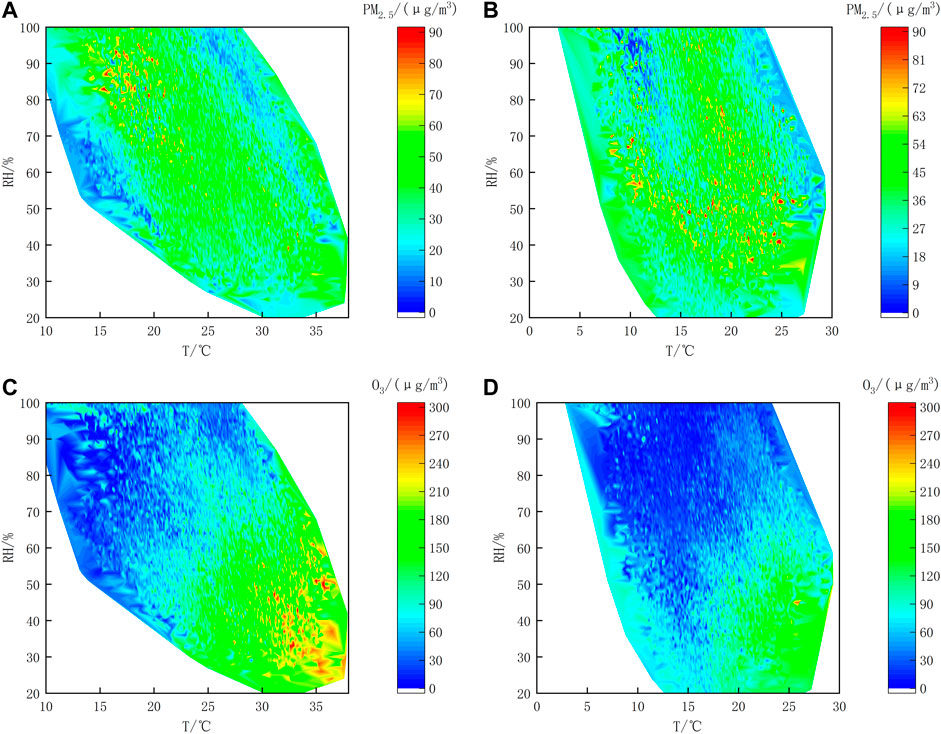
FIGURE 3. Variations of PM2.5 and ozone with temperature and humidity in autumn and winter. (A). PM2.5 in autumn, (B). PM2.5 in winter, (C). ozone in autumn, and (D). ozone in winter.
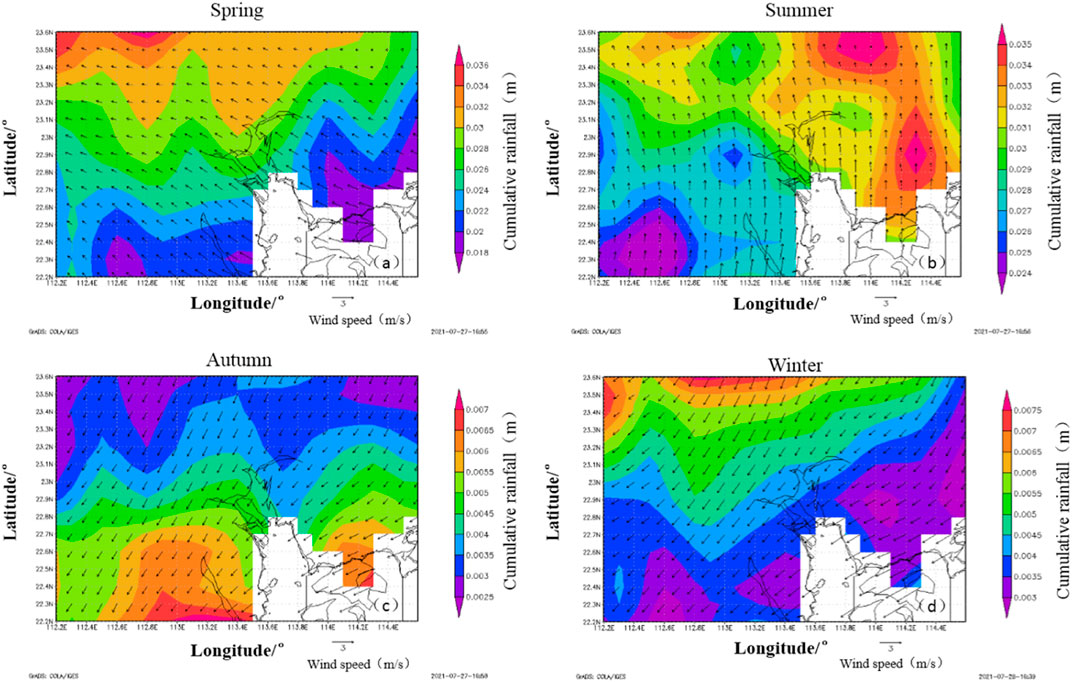
FIGURE 4. 10 m wind field and accumulated rainfall in the PRD.
A previous study showed that air pollutants in the PRD have significant temporal and spatial variation characteristics. To explore the differences of photochemical reactivities in various cities, the day distributions of different photochemical reactivities at each station are presented in Figure 5. In 2019, the PRD mainly experienced O3L and O3LH for an average of 151 and 115 days, respectively, totally accounting for 74.9% of the year, whereas it experienced 46 days of O3M and 43 days of O3H. Most stations in Shenzhen, Zhuhai, Huizhou, and Zhaoqing experience more days of low- and light-photochemical reactivities than the median in the PRD (264 days). Figure 6 shows the cumulative time of the coordinated increase between PM2.5 and ozone and the mean values of PM2.5/CO in the PRD. The cumulative time of the coordinated increase is 511–1,048 h, in accordance with the results of Li et al. (2020) in Guangzhou from April to October 2017 (580 h). The high values of cumulative time are mainly concentrated in Jiangmen, Zhongshan, and Dongguan. The ratio of PM2.5/CO is between 0.030 and 0.045, which is lower than that in Beijing and Shanghai in 2017 and comparable to that of Guangzhou in 2017 (Li et al., 2020). The high values are concentrated in Dongguan and Shenzhen.
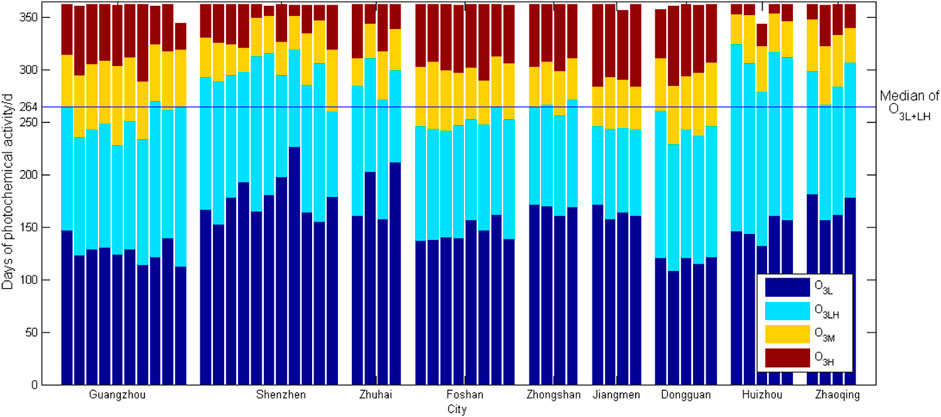
FIGURE 5. Daily distribution of photochemical activities in the PRD.
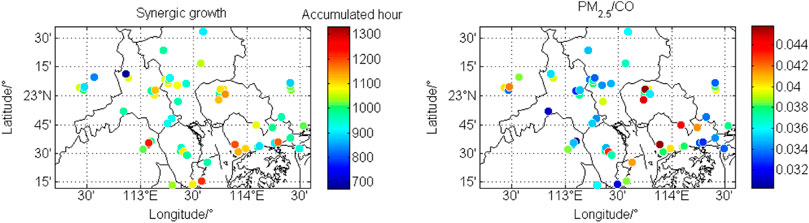
FIGURE 6. Coordinated increase time and PM2.5/CO distribution in the PRD.
Figure 7 shows the monthly averaged days of different photochemical reactivities and average hours of the coordinated increase in 2019. O3M and O3H mainly concentrate from August to November, among which the maximum O3M days appear in November (10.1 days), whereas the maximum O3H days appear in September (11.7 days). What is more, the trend of coordinated increase time is basically opposite to that of O3L days. Therefore, a coordinated increase of PM2.5 and ozone mainly occurs under more significant oxidation backgrounds.
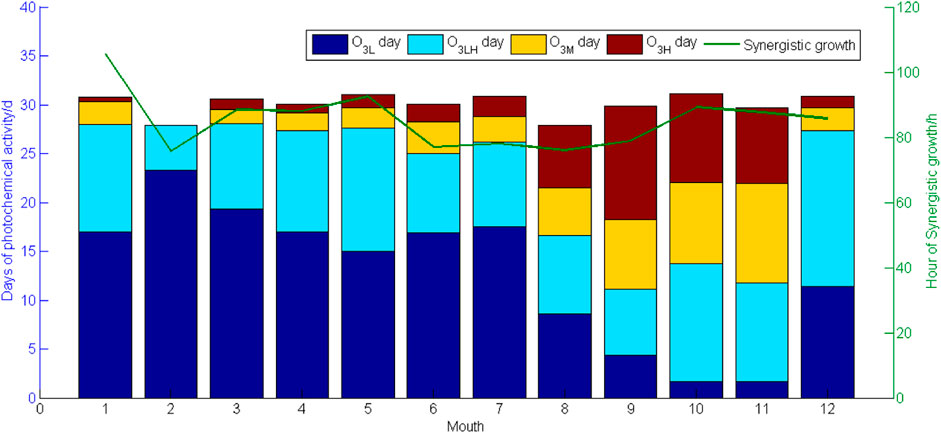
FIGURE 7. Monthly averaged days of different photochemical reactivities and the average hours of coordinated increase.
In general, photochemical reactivities in the PRD have obvious spatial and temporal variation differences. In terms of spatial variations, photochemical reactivities appear high in central and western regions but low in eastern regions and high in inland regions but low in coastal regions. In terms of seasonal variations, moderate and high levels of photochemical reactivities mainly appear in autumn. In general, higher levels of photochemical reactivities are more conducive to the coordinated increase of PM2.5 and ozone, and the proportions of secondary aerosols in PM2.5 are also higher. However, some coastal stations in Shenzhen and Zhuhai have a long-term coordinated increase or a high PM2.5/CO value, which requires further research.
Figure 8 shows the seasonal variation of the average PM2.5-sec concentration at each station. The concentration in autumn is significantly higher than that in other seasons, and the concentration varies from 6 μg/m3 to 13 μg/m3, with the maximum appearing at Jida station in Zhuhai. PM2.5-sec concentrations are the highest in autumn, during which the regional discrepancies appear the most significantly with the highest levels in the southern areas. High concentrations of PM2.5-sec and ozone occur in the southern areas in autumn, indicating that the atmospheric oxidation background promotes the formation of PM2.5-sec.
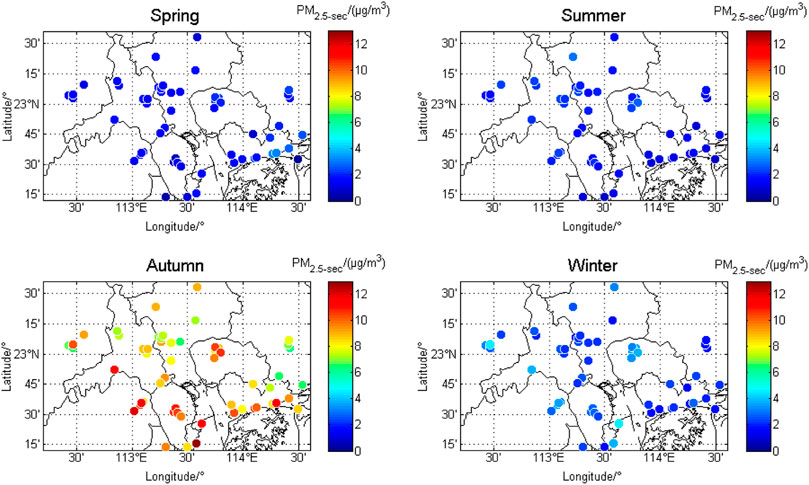
FIGURE 8. Seasonal variations of PM2.5-sec in the PRD.
In addition to seasonal differences, there are also differences in PM2.5-sec concentrations and the proportions of PM2.5-sec in PM2.5 under different photochemical reactivity backgrounds. Figure 9 shows the regional variations of PM2.5-sec under different photochemical reactivities. With the enhancement of photochemical reactivities, PM2.5-sec levels increase significantly. Under the background of O3H, the annual average PM2.5-sec concentrations at the coastal stations are generally above 13 μg/m3 with a maximum of 20 μg/m3 at some stations, whereas under the background of O3M, the concentrations at the coastal stations are basically around 10 μg/m3. Moreover, under the same photochemical reactivity background, PM2.5-sec concentrations in coastal areas are significantly higher than those in inland areas. Figure 10 shows that the proportions of PM2.5-sec in PM2.5 have similar characteristics under different photochemical reactivity backgrounds. The ratios are about 10% in O3L, 20%–30% in O3M, and 20–50% in O3H. Meanwhile, under the same photochemical background, the ratios of PM2.5-sec/PM2.5 in coastal areas are significantly higher than those in inland areas.
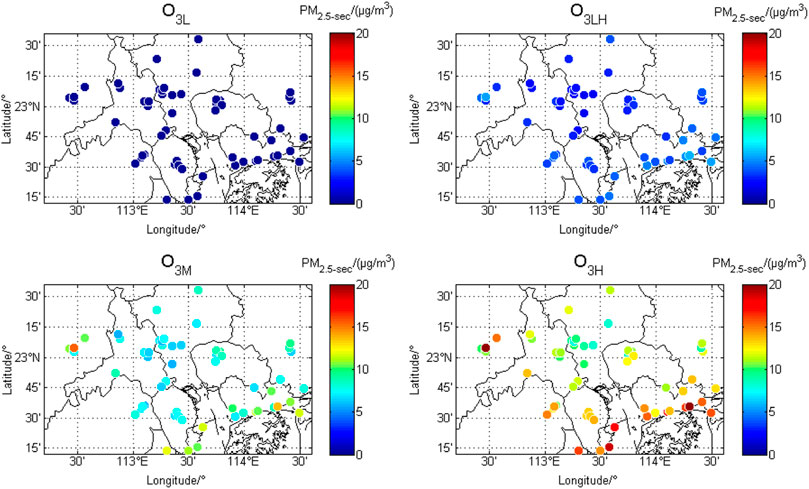
FIGURE 9. PM2.5-sec variations under different photochemical backgrounds.
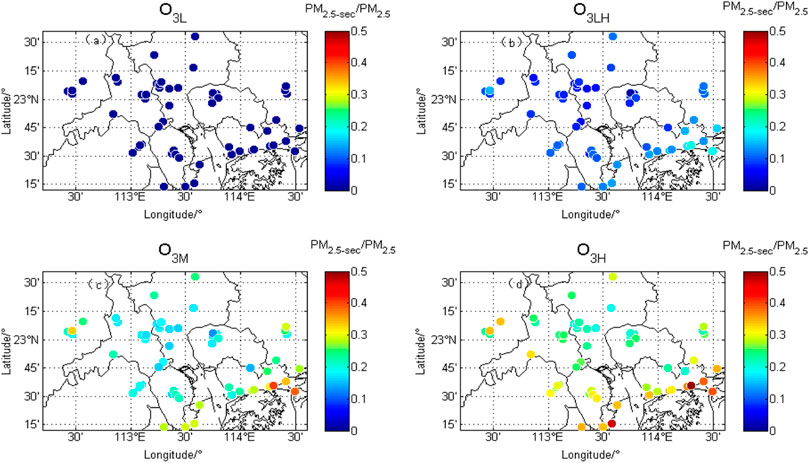
FIGURE 10. Variations of the ratios in PM2.5-sec/PM2.5 under different photochemical backgrounds.
Because the stations in the PRD are widespread with significant background discrepancies, we refer to the standard of ozone pollution in the Ambient Air Quality Standard (GB3095-2012) and take MDA8-O3 (daily maximum 8 h average value of O3) ≥ 160 μg/m3 as the classification standard. Then, the three stations with the most days exceeding the standard (located in Guangzhou, Foshan, and Dongguan) are identified as polluted stations, whereas the three stations with the least number (located in Zhuhai, Shenzhen, and Huizhou) are defined as clean stations. Finally, diurnal variations and standard deviations of PM2.5-sec and ozone are presented (Figure 11, the error bars depict the standard deviation). The concentrations of the two pollutants are higher in the daytime than at night, and their maximum concentrations for both appear at about 15:00. As for ozone, the variation at polluted stations is larger than that at clean stations because the maximum concentration of ozone at polluted stations (91 μg/m3) is higher than that at clean stations (60 μg/m3) due to the photochemical reactions of a large number of precursors in the daytime, whereas the minimum concentration of ozone in polluted stations is lower than that in clean stations due to the consumption of a large number of NO in polluted stations at night. Under the background of high-photochemical reactivities, the concentration of PM2.5-sec at polluted stations is higher than that at clean stations from 12:00 to 20:00, which further reflects the promoting effect of the atmospheric oxidation background on PM2.5-sec formation.
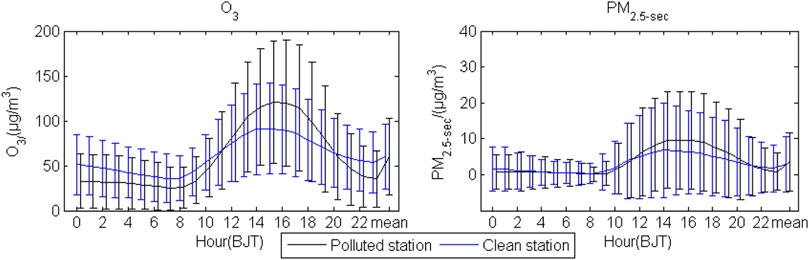
FIGURE 11. Diurnal variations of ozone and PM2.5-sec under different photochemical backgrounds.
Based on the observation data of environmental and meteorological stations in the nine cities of the PRD during 2019, the variations of PM2.5-sec and the coordinated increase of PM2.5-sec and ozone under different photochemical reactivity backgrounds in the PRD are revealed.
The trend of coordinated increase time is basically opposite to that of O3L days, meaning that the coordinated increase of PM2.5 and ozone mainly occurs under more significant oxidation backgrounds. The photochemical reactivities appear more significant in the central and western areas than in the eastern areas of the PRD and appear more significant in inland areas than in coastal areas. The days of moderate- and high-photochemical reactivities mainly appear from August to November.
The PM2.5-sec concentrations are the highest in autumn, during which the regional discrepancies appear the most significantly with the highest levels in the southern areas. With the enhancement of the photochemical reactivity background, the PM2.5-sec level at each station increases significantly, which appears significantly higher in coastal areas than that in inland areas. The ratios of PM2.5-sec/PM2.5 are as high as 30–50% under the high-photochemical reactivity background.
Both PM2.5-sec and ozone concentrations show single-peak variations, which appear higher in the daytime than at night with the peak occurring at about 15:00. As for each pollutant, the average maximum concentration appears higher for polluted stations than for clean ones, indicating that the atmospheric oxidation background is conducive to the formation of PM2.5-sec.
The original contributions presented in the study are included in the article/Supplementary Material; further inquiries can be directed to the corresponding author.
XY contributed to data processing, mapping, analysis, and writing; YZ contributed to software and mapping; NL contributed to conceptualization and check on; and SY contributed to writing and editing.
This research was funded by the Basic Research Funds of Central Public Welfare Research Institutes, under grant number 2020SYIAEZD1, the Science and Technology Project of Liaoning Province, under grant number 2019JH8/10300095, and the Key Program of Science Foundation of Liaoning Meteorological Office, under grant number D202101.
The authors declare that the research was conducted in the absence of any commercial or financial relationships that could be construed as a potential conflict of interest.
All claims expressed in this article are solely those of the authors and do not necessarily represent those of their affiliated organizations, or those of the publisher, the editors, and the reviewers. Any product that may be evaluated in this article, or claim that may be made by its manufacturer, is not guaranteed or endorsed by the publisher.
Chang, S.-C., and Lee, C.-T. (2007). Secondary Aerosol Formation through Photochemical Reactions Estimated by Using Air Quality Monitoring Data in Taipei City from 1994 to 2003. Atmos. Environ. 41, 4002–4017. doi:10.1016/j.atmosenv.2007.01.040
Fleming, Z., Doherty, R., Schneidemesser, E., Malley, C., Cooper, O., Pinto, J., et al. (2018). Tropospheric Ozone Assessment Report: Present-Day Ozone Distribution and Trends Relevant to Human Health. Elementa: Sci. Anthropocene 6, 12. doi:10.1525/elementa.273
Lai, A., Cheng, X., Liu, Y., Jiang, M., Liu, Y., Wang, X., et al. (2018). Characteristics of Complex Pollution with High Concentrations of PM2.5 and Ozone over the Pearl River Delta, China. Acta Scientiarum Naturalium Universitatis Sunyatseni 57, 30–36.
Li, H., Wang, Y., Huang, L., Liu, Z., Wang, W., Feng, J., et al. (2020). Analysis of Coordinated Increase Effects between Ozone and Secondary Aerosol in Typical Cities in China. Acta Scientiae Circumstantiae 40, 157–168.
Liu, N., Li, X., Ren, W., Li, L., Su, C., and Wang, C. (2021). Concentration Characteristics and Photochemical Reactivities of VOCs in Shenyang, China. Atmosphere 12, 1240. doi:10.3390/atmos12101240
Liu, N., Lin, W., Ma, J., Xu, W., and Xu, X. (2019). Seasonal Variation in Surface Ozone and its Regional Characteristics at Global Atmosphere Watch Stations in China. J. Environ. Sci. 77, 291–302. doi:10.1016/j.jes.2018.08.009
Mills, G., Hayes, F., Wilkinson, S., and Davies, W. J. (2009). Chronic Exposure to Increasing Background Ozone Impairs Stomatal Functioning in Grassland Species. Glob. Change Biol. 15, 1522–1533. doi:10.1111/j.1365-2486.2008.01798.x
Stoker, T., Qin, D., Plattner, G., Tignor, M., Allen, S., Boschung, J., et al. (2013). Climate Change 2013: The Physical Science Basis. Contribution of Working Group I to the Fifth Assessment Report of the Intergovernmental Panel on Climate Change. Cambridge, United Kingdom and New York, NY, USA: Cambridge University Press.
Wang, H., Miao, Q., Shen, L., Yang, Q., Wu, Y., and Wei, H. (2021a). Air Pollutant Variations in Suzhou during the 2019 Novel Coronavirus (COVID-19) Lockdown of 2020: High Time-Resolution Measurements of Aerosol Chemical Compositions and Source Apportionment. Environ. Pollut. 271, 116298. doi:10.1016/j.envpol.2020.116298
Wang, H., Pei, Y., Yin, Y., Shen, L., Chen, K., Shi, Z., et al. (2021b). Observational Evidence of Lightning‐Generated Ultrafine Aerosols. Geophys. Res. Lett. 48. doi:10.1029/2021gl093771
Wang, H., Tan, Y., Zhang, L., Shen, L., Zhao, T., Dai, Q., et al. (2021c). Characteristics of Air Quality in Different Climatic Zones of China during the COVID-19 Lockdown. Atmos. Pollut. Res. 12, 101247. doi:10.1016/j.apr.2021.101247
Wu, Y., Chen, W., Yan, F., Mao, J., Yuan, B., Wang, W., et al. (2021). Nonlinear Response Relationship between Ozone and Precursor Emissions in the Pearl River Delta Region under Different Transmission Channels. Springer.
Xing, J., Wang, J., Mathur, R., Wang, S., Sarwar, G., Pleim, J., et al. (2017). Impacts of Aerosol Direct Effects on Tropospheric Ozone through Changes in Atmospheric Dynamics and Photolysis Rates. Atmos. Chem. Phys. 17, 9869–9883. doi:10.5194/acp-17-9869-2017
Yao, Y., Wang, M., Zeng, C., Fan, L., and Ye, D. (2021). Pollution Characteristics and Interaction between PM2.5 and Ozone at Different Types of Stations in Guangzhou. China Environ. Sci. 41, 4495–4506.
Yin, Z., and Wang, X. (2020). Analysis of the Spatial and Temporal Variation Characteristics of Ozone Concentration in the Pearl River Delta Urban Agglomerations. J. Fudan Univ. (Natural Science) 59, 748–760.
Yuan, T., Remer, L., Bian, H., Jerald, R., Albrecht, R., Pickering, K., et al. (2012). Aerosol Indirect Effect on Tropospheric Ozone via Lightning. J. Geophys. Res. Atmospheres 117. doi:10.1029/2012jd017723
Zhan, S. (2018). Research on Trend and Influencing Factors of Conventional Air Pollutants in Guangdong-Hong Kong-Macao Greater Bay Area. Guangzhou: The University of Chinese Academy of Sciences.
Zhang, H., Wang, Y., Hu, J., Ying, Q., and Hu, X.-M. (2015). Relationships between Meteorological Parameters and Criteria Air Pollutants in Three Megacities in China. Environ. Res. 140, 242–254. doi:10.1016/j.envres.2015.04.004
Zhang, L., Fan, F., Jiang, W., Chao, T., Zhang, W., and Liu, J. (2017). Concentrations and Health Risk Assessment of Heavy Metals in Atmospheric PM_(2.5) in the Pearl River Delta Region. Acta Scientiae Circumstantiae 37, 370–380.
Zhang, Y., Zhao, T., Ying, C., Wang, Z., Ge, B., Liu, D., et al. (2019). Seasonal Variation of the Relationship between Surface PM2.5 and Ozone Concentrations in Xuzhou. China Environ. Sci. 39, 2267–2272.
Keywords: secondary PM2.5, ozone, photochemical reactivity, oxidation background, coordinated increase
Citation: Yu X, Zhang Y, Liu N and Yang S (2022) Characteristics of Secondary PM2.5 Under Different Photochemical Reactivity Backgrounds in the Pearl River Delta Region. Front. Environ. Sci. 10:837158. doi: 10.3389/fenvs.2022.837158
Received: 16 December 2021; Accepted: 03 January 2022;
Published: 21 January 2022.
Edited by:
Junke Zhang, Southwest Jiaotong University, ChinaReviewed by:
Jinhui Gao, Chengdu University of Information Technology, ChinaCopyright © 2022 Yu, Zhang, Liu and Yang. This is an open-access article distributed under the terms of the Creative Commons Attribution License (CC BY). The use, distribution or reproduction in other forums is permitted, provided the original author(s) and the copyright owner(s) are credited and that the original publication in this journal is cited, in accordance with accepted academic practice. No use, distribution or reproduction is permitted which does not comply with these terms.
*Correspondence: Ningwei Liu, bGl1bndAaWFlc3kuY24=
Disclaimer: All claims expressed in this article are solely those of the authors and do not necessarily represent those of their affiliated organizations, or those of the publisher, the editors and the reviewers. Any product that may be evaluated in this article or claim that may be made by its manufacturer is not guaranteed or endorsed by the publisher.
Research integrity at Frontiers
Learn more about the work of our research integrity team to safeguard the quality of each article we publish.