 Tiza Spit1,2
 Jan Peter van der Hoek1,3*Coen de Jong2
 Doris van Halem1Merle de Kreuk1Bruno Bicudo Perez1
- 1Department of Water Management, Delft University of Technology, Delft, Netherlands
- 2Department of Wastewater Treatment, Witteveen+Bos, Deventer, Netherlands
- 3Research and Innovation Program, Waternet, Amsterdam, Netherlands
At wastewater treatment plants (WWTPs), additional steps are introduced for removal of organic micropollutants (OMPs) from the treated effluents, especially pharmaceutical residues. At the same time, a new concern is emerging: antibiotic resistance (AR). This research studied the effect of ozonation, coagulation and granular activated carbon (GAC) filtration applied as tertiary treatment for the removal of OMPs and nutrients, on AR removal. Bacterial culture methods in selective media were used to screen for four different microorganisms: two faecal indicators (Escherichia coli and Enterococci) as antibiotic sensitive bacteria (ASB), and a resistant strain of each of these bacteria, namely Extended-Spectrum Beta-lactamase producing E. coli (ESBL-E.coli) and Vancomycin Resistant Enterococci (VRE) as antibiotic resistant bacteria (ARB). At laboratory scale, ozonation experiments (ozone dose 0.4–0.6 g O3/g DOC) and coagulation experiments using Polyaluminum chloride (PAX-214) and FeCl3 (coagulant dose 0.004–1 mM/L) were performed using secondary effluent from two municipal WWTPs. In addition in a pilot plant and full-scale plant ozonation (ozone dose 0.4 g O3/g DOC) and GAC filtration (empty bed contact time 15 min) were studied for AR removal. No significant differences were found between ARB and ASB removal for coagulation and ozonation which could indicate that ASB can be used as an initial proxy for ARB removal for these technologies. In the laboratory experiments, ozonation and coagulation showed a good removal of both ARB and ASB. However, the doses needed to reach 2–3 log removal were a factor 2.5–4 (ozonation) and 250 (coagulation) higher than applied for OMP removal (by ozonation) and phosphorus (P) removal (by coagulation). In the GAC filters, the risk of ARB enhancement occurred, especially in filters with a matured biology. Although these bacteria are not necessarily directly harmful, they can pass down their resistance to pathogenic bacteria via horizontal gene transfer.
Introduction
The World Health Organization (WHO) declared antibiotic resistance (AR) as one of the top five risks to global health, since antibiotics are used to save millions of human and animal lives every year (WHO, 2017). To exemplify the scope of the issue, WHO estimates that in 2018, half a million new cases of (multi-drug) resistant tuberculosis were identified globally (WHO, 2021a). Furthermore, the WHO states that yearly 700,000 deaths are caused by AR diseases, which could increase to an annual 10 million by 2050 if no action is taken (WHO, 2021b). AR puts pressure on the success of modern medicine in treating infections, including during major surgery and chemotherapy. AR leads to longer hospital stays, higher medical costs, and increased mortality (WHO, 2020). A possible route for the spread of AR is via sewage (Korzeniewska et al., 2013).
Conventional wastewater treatment plants (WWTPs) do not aim for effective removal of antibiotic resistant bacteria (ARB) and pathogens from the water but are designed to remove solids, degradable organic substances and nutrients (Ravasi et al., 2019). However, as a side effect conventional WWTPs normally obtain a 2-3 log removal of microorganisms in conventional biological treatment (Karkman et al., 2018; Sabri et al., 2020). It is to be determined if resistant and non-resistant bacteria are removed equally. This potential advantage for antibiotic resistance in the WWTP can be driven by two factors. Firstly, the concentrations of antibiotic residues are relatively high in WWTPs whilst a relatively low concentration of antibiotic residues can already select for AR. Even at a non-lethal concentration several hundred-folds below the minimum inhibitory concentration, an antibiotic can already select for resistant bacteria (Andersson and Hughes, 2014; Karkman et al., 2018). The second factor is the abundance and diversity of bacteria in the WWTP that are either suspended in the influent or grow in biofilms and flocs (Rizzo et al., 2013). In fact, in biological tanks, characterized by the continuous mixing between a large number of microorganisms and pollutants, bacteria can easily mutate and exchange antibiotic resistance genes (ARGs) (Ravasi et al., 2019). Furthermore, the co-selecting and cross-selecting residues, such as biocides and metals, positively correlate to the amount of ARB in the WWTP in both water and sludge phases (Chapman, 2003; Ashbolt et al., 2013).
Developments in the field of water management have led to the introduction of additional technologies in wastewater treatment plants. The presence of organic micropollutants (OMPs) in the aquatic environment has become an increasing concern for the quality of aquatic ecosystems and for the production of drinking water from surface water in the last decades. OMPs include pesticides, pharmaceutical residues, personal care products, artificial sweeteners and industrial compounds, amongst others. Many enter the aquatic environment via municipal wastewater treatment plants (Loos et al., 2013), as conventional WWTPs are not designed to remove these compounds (Luo et al., 2014). This issue is addressed in the European regulation. The European Water Framework Directive (WFD) (EU, 2000) listed for example “priority substances” whose concentrations should be reduced in surface waters. These priority substances include OMPs that in very low concentrations can have a relatively large impact on the downstream environment (Schwarzenbach et al., 2006). Therefore, WWTPs are being adjusted to anticipate on these developments by introducing additional treatment steps to aid in the removal of OMPs. Additional nutrient removal also increasingly receives more attention to reach the objectives of the European WFD (EU, 2000).
Typical examples of these additional treatment steps can be divided into three types. Firstly, adsorption processes such as activated carbon which can, for instance, be applied in powdered or granular form (Zietzschmann et al., 2016); secondly, oxidation processes such as ozonation (Ekblad et al., 2021); and thirdly, membrane processes such as reverse osmosis and nanofiltration (Ebrahimzadeh et al., 2021). Combinations of these also provide an option to remove OMPs from the wastewater, e.g., ozonation in combination with activated carbon filtration (Guillossou et al., 2020), sand filtration (Hollender et al., 2009) or zeolite filtration (Fu et al., 2021a; Fu et al., 2021b).
In this research the focus was on the combination of OMP oxidation by ozonation followed by adsorption on granular activated carbon. Additionally biological removal of nitrogen (nitrate) takes place through denitrification by dosing of a carbon source (methanol) to the GAC-filter and P-removal by means of coagulation, flocculation and removal of flocs in the GAC-filter. All these additional treatment steps, and their combinations, are originally designed to remove micropollutants and nutrients. However, they likely have an effect on AR removal as well. With respect to ozonation, GAC filtration and coagulation, applied in wastewater treatment, some studies have been performed.
Ozone is a strong oxidant that has shown to be effective for the inactivation of microorganisms and oxidation of inorganic ions, such as iron and ammonium, and organic pollutants (Rodríguez et al., 2008). Ozone has shown to inactivate pathogenic microorganisms resistant to conventional disinfectants such as chlorine (Rodríguez et al., 2008; Von Gunten, 2003). Ozone also has been shown to be effective for reduction of AR in wastewater effluents treated by membrane bioreactors or conventional sludge (Iakovides et al., 2021). Foroughi et al. (2022) reviewed and discussed the ozonation effect on removing AR and ARGs from aqueous solutions. Ozone dose and contact time appeared to be important operational parameters. Hiller et al. (2019) reviewed AR removal by conventional and advanced wastewater processes, and reported for ozonation ARB log removal between 1.4 and 1.8 and ARGs log removal <0.5. Ozone obtains its effectiveness against bacteria, and thus potentially ARB, by reacting with organic functional groups within the cellular wall of Gram-positive bacteria and in the wall/membrane of Gram-negative bacteria (Sizar and Unakal, 2020). Firstly, the ozone reacts with the unsaturated bonds within the membrane-bound phospholipids and lipopolysaccharides on the surface of the bacterial cell. Then, when the membranes permeability and structural integrity is disrupted, the interior gets exposed to the external conditions, resulting in cell lysis. The ozone oxidation is less effective in the removal of the inner molecular components, such as DNA, so the ARGs might remain present in the water as free-floating extracellular DNA after the ARB cell lysis (Dodd, 2012; Calderón-Franco et al., 2021). This extracellular DNA can attach to suspended particles and can persist for months whilst still being able to transform into natural competent bacteria (Zhang et al., 2018).
The granular activated carbon (GAC) filter is intended to adsorb the antibiotics, antibiotic residues and other OMPs from the water. Furthermore, by using the concept of denitrification, nitrate is removed from the water in the GAC filter. No disinfection is expected but the adsorption process can remove part (1.3 log) of the ARB (Michael et al., 2019; Sabri et al., 2020). Moreover, by applying powdered activated carbon (PAC), up to 2.5 log removal by this adsorption has been reported (Ravasi et al., 2019). However, apart from the adsorption in the GAC filter, a biofilm grows on the GAC granules for denitrification. A risk occurs that these bacteria become antibiotic resistant due to the presence of ARGs and remaining antibiotics in the water, as they are not all effectively removed by a preceding ozonation in case of a combined ozonation-GAC filtration process. In drinking water treatment, Wan et al. (2021) described that in biologically activated carbon (BAC) filters, an accumulation of ARGs could exist as a result of horizontal gene transfer (HGT). This can lead to the pollution with ARGs of the effluent of these filters as well. Most of these bacteria are not harmful for humans. However, when released into the water, HGT can potentially add to the spread of resistance to pathogens (Zhang et al., 2018).
For coagulation, two mechanisms are commonly described to add to the removal of (antibiotic resistant) bacteria: adsorption (or charge neutralization) and sweep coagulation (Dennett et al., 1996). For tertiary treatment of wastewater, the focus is on the first mechanism of coagulation where dissolved contaminants are adsorbed to the coagulant. This is because the main aim for the coagulant dosage is the removal of phosphorus (P), more specifically orthophosphate. A reaction occurs between the contaminant (P) and the coagulant, leading to the removal of P. The second mechanism refers to contaminant removal through the formation of solid precipitates (Dennett et al., 1996). Using sweep coagulation, on top of the P-removal, the coagulation may lead to the removal of more contaminants, such as (antibiotic resistant) bacteria that are removed by enmeshment or entrapment within a mass of the solid precipitate. Therefore, for the effective removal of pollutants, it is essential that the appropriate amount of coagulant is dosed. No selectivity for antibiotic sensitive bacteria (ASB) compared to resistant bacteria is expected. In previous research, ARGs log removal of 0.5–3.1 was found by applying coagulation (Li et al., 2017). A large benefit of coagulation is that the entire bacteria, including its DNA, is removed, and thus no leakage of ARGs is expected (Li et al., 2017). Bicudo et al. (2021) showed the effectiveness of low voltage electrocoagulation as a tertiary treatment of municipal wastewater for the removal of enteric pathogenic indicators and antibiotic-resistant bacteria. A 2–3 log removal was reported.
Although understanding is available about the effect of additional treatment steps on AR in wastewater treatment for OMP removal, the impact of the settings and operational conditions in which the additional treatment steps are applied for OMP removal, on ARB and ARGs, is still unknown (Hiller et al., 2019). Having great application prospects in the treatment of antibiotics and alleviation of ARGs risks, Zhu et al. (2021) stated that the combined technologies should be further investigated in the future.
The aim of this research was to determine the effect of ozonation and coagulation in a GAC filter on the removal of AR. This was done by means of batch experiments in the lab for ozonation and coagulation, and sampling of two different process schemes in the field: a full-scale activated carbon filter with coagulation and a pilot-scale ozonation-GAC filtration combination with additional coagulation. Both these treatment trains treated wastewater from an activated sludge WWTP. The research focused on the effects of an additional tertiary treatment step on the spread of ARB.
Materials and Methods
Laboratory Batch Experiments
Water Samples
All ozone lab-experiments were conducted with secondary WWTP effluent from WWTP Horstermeer (HM) and WWTP Harnaschpolder (HP), both located in Netherlands. Table 1 shows the composition of the effluent after the secondary clarifier.
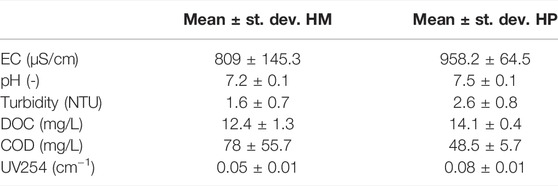
TABLE 1. Composition of effluent of the secondary clarifier of WWTP Horstermeer (HM) and WWTP Harnaschpolder (HP), based on four samples analyzed in triplicate.
pH was measured by using the inoLab_IDS multimeter with the WTW pH-Electrode Sentix 940 probe. Electric conductivity (EC) was measured by using the inoLab_IDS measurement as well but with a WTW TetrCon 324 probe. Dissolved organic carbon (DOC) was measured by using a HACH kit (LCK380 range 2–65 mg/L) for the total organic carbon (TOC) kit after the sample was filtered with a 0.45 micron filter. To improve the accuracy, the results of the HACH kit were compared with the results by using a TOC analyzer (Shimadzu TOCV CPH combined with the ASIV). Turbidity was measured by using a turbidity meter (HACH 2100N). Chemical oxygen demand (COD) was measured by using a HACH kit (LCK314 range 15–150 mg/L), analyzed in the HACH Lange DR3900 spectrophotometer. Color was measured with adsorbance using a spectrophotometer (GENESIS 10S UV-Vis) set at a wavelength of 254 nm.
Morning grab samples were taken on alternating weeks from the secondary clarifier of HM and HP in January and February 2021. In total for each of the plants, four samples were taken for the ozonation laboratory batch experiments. Additionally, two samples were taken from HM for the laboratory coagulation batch experiments. WWTP HP has a capacity of 1.3 million people equivalents and the treatment scheme comprises screening, primary settling, conventional activated sludge treatment and a secondary settling. The effluent is discharged into the sea. WWTP HM has a capacity of 180,000 people equivalents and has a similar treatment scheme as HP with a conventional activated sludge system with biological nutrient removal. The nitrification and denitrification processes take place in two anoxic tanks and an aerated tank. After the secondary clarifier, an activated carbon filter additionally removes OMPs through adsorption, and nutrients through methanol addition for N-removal (denitrification) and coagulation for P-removal. The effluent of WWTP HM is discharged into the river De Vecht. The water samples were taken after the secondary clarifier.
Coagulation experiments were conducted with ozonated water from the pilot plant located at WWTP HM (Section Pilot plant Ozonation+GAC filtration).
Ozonation Batch Experiments
Figure 1 shows the laboratory set-up for dosing the ozone gas into the samples (bubbling tank).
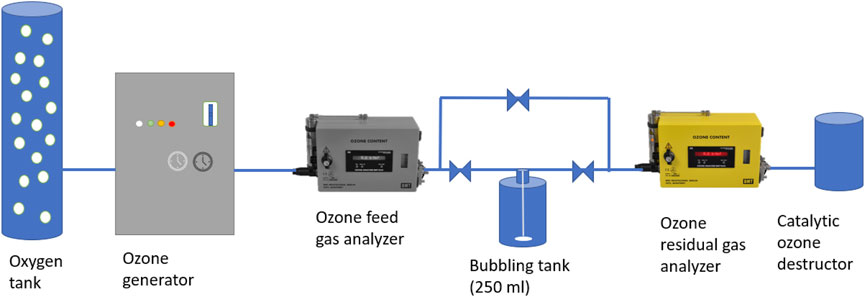
FIGURE 1. Schematic diagram of the experimental ozone set-up in the lab.
Ozone was produced from pure oxygen with an ozone generator (Wedeco, module 4c) and measured with ozone gas analyzers (Ozone analyzer BMT 964C model, RMG MESSTECH-NIK GmbH, Berlin, Germany), installed before and after the bubbling tank. The aqueous ozone stock solution was prepared by sparging ozone containing gas bubbles through an effluent sample, cooled in an ice-bath to increase the maximum solubility of ozone in the water and to avoid decomposition, during which it was stirred with a magnetic stirrer. The part of the ozone that was not dissolved nor reacted was measured before being destructed by the catalytic ozone destructor. The residual concentration of ozone measured at the outflow is the inflow concentration minus the ozone reacted or transferred to the water phase. By using the indigo colorimetric method, the ozone concentration in the stock solution was measured as described by Bader and Hoigné (1981) and the American Public Health Association (1992).
The ozone stock solution and effluent samples were used in the ozonation experiments. After the concentration of ozone in the stock solution was measured, different proportions of the stock solution were spiked to a 2-L jar filled with effluent. The amount of ozone dosed per sample was calculated after measuring the DOC of the sample. This ensured that the ratio of g O3/g DOC was consistent across all the tested samples. By controlling this variable, the effects can then be compared between samples. To match the dosage range of the ozonation-activated carbon filtration pilot plant, ozone dosages varied between 0.4 and 0.6 g O3/g DOC, based on a preliminary study to optimize the ozone dose in a combined ozonation–GAC filtration process for OMP removal from secondary effluent (Liu, 2017). Dosages of 0.38, 0.49 and 0.58 g O3/g DOC were obtained by dosing 150, 200, and 250 ml of the spike solution per liter effluent sample respectively. Due to the fast degradation of ozone, it was key to spike the ozone stock solution within seconds after preparing it. Furthermore, the samples were directly covered after dosing so most of the stock solution reacted with the sample rather than degasifying into the atmosphere. Quenching was not needed as all ozone was assumed to have reacted within a small amount of time. Water before and after ozonation was analyzed for bacteria (Section Indicator Bacteria).
Coagulation Experiments
Two different coagulants were compared. These were the coagulant used in the pilot plant, Polyaluminum chloride (PAX-214), and a chemical iron coagulant based on Fe3+ (FeCl3). All experiments were conducted in 2-L beakers containing ozonated water from the pilot plant located at WWTP HM (Section Pilot plant Ozonation+GAC filtration). The required concentrations were derived by means of the Amirtharajah diagram based upon the pH and the desired type of removal (Johnson and Amirtharajah, 1983). The diagram is split into regions of sweep coagulation and charge neutralization for turbidity removal. For sweep coagulation, at an equal pH a higher coagulant dose should be added to the water as can be seen in the Amirtharajah diagram (see Supplementary Material S1).
Both PAX-214 and FeCl3 were dosed as a concentrated solution, therefore the same procedure was followed. These diagrams also show that pH has a large influence on floc formation. Therefore, the pH was measured and adjusted by dosing NaOH to maintain a constant pH. Both the coagulant and the NaOH solution were dosed in 2-L beakers filled with ozonated water samples from the pilot plant.
After coagulant dosing, the beakers were placed into a jar set-up. For the jar tests, first rapid mixing was applied for 30 s (G = 150 s−1), then the first slow mixing for 10 min at G = 80 s−1 followed by the second slow mixing for 10 min at G = 30 s−1. Finally, the beakers were left to settle for another 100 min. The supernatant was analyzed for water quality parameters (Section Water Samples) and bacteria (Section Indicator Bacteria).
Field Experiments
Full-Scale GAC Filtration
After conventional treatment, part of the water at WWTP Horstermeer (1,550 m3/h) is treated by a granular activated carbon (GAC) filter for biological nutrient removal by denitrification and OMP removal by adsorption. This GAC filter has an Empty Bed Contact Time (EBCT) of 8 min and the type of GAC is Cabot Norit GAC 612WB. The expected lifetime of the GAC filter until regeneration is 15,000–20,000 bed volumes (Dekker and Zijlstra, 2013). However, GAC in the filter has not been regenerated during the past 8 years and therefore the remaining adsorption capacity is expected to be low. Hence, it is likely that the bed functions as a regular filter bed with biofilm for nitrate removal (denitrification) and a coagulant dosage (PAX-214, 3.1 mol Al3+/mol PO43--P) for an additional P-removal. For the denitrification methanol is dosed in a concentration of 3.9 g COD/g NO3−-N as an additional C-source. Figure 2 gives an overview of the GAC-filter and sampling locations.
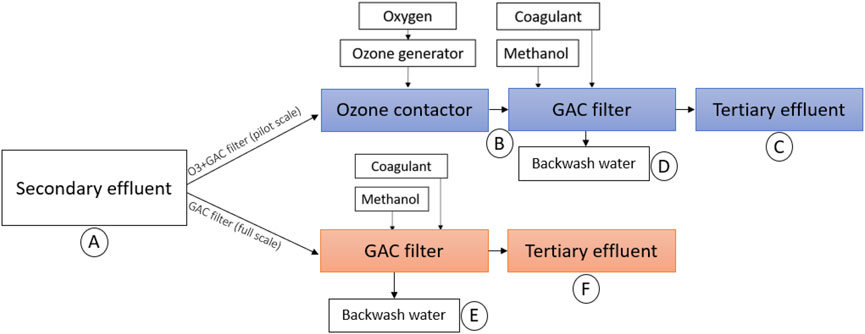
FIGURE 2. Process steps and sampling locations (A–F) in the Ozonation + GAC filtration pilot plant (top) and the full-scale GAC filter (below).
Pilot Plant Ozonation + GAC Filtration
The pilot plant is located next to the full-scale GAC filter, and treats a small part of the secondary clarifier effluent. Figure 2 gives an overview of the process steps: after the secondary clarifier, the ozone is dosed, at an ozone dose of 0.4 g O3/g DOC, in the ozone contactor with a contact time of 25 min, after which the water flows to a buffer and then to a GAC filter. The pilot is designed to treat 5 m3/h using ozonation and 3 m3/h using GAC filtration. The nominal contact time in the GAC filter is 15 min. Methanol is dosed in the influent of the GAC filter at a concentration of 3.9 g COD/g NO3−-N and an additional 1.2 g COD/g O2 to take into account the increased oxygen content due to ozonation. Furthermore, 3.1 mol Al3+/mol PO43--P is dosed for coagulation.
Field Sampling in the Full-Scale GAC Filtration and Pilot Plant ozonation + GAC Filtration
To test the micro-organisms and AR removal of both the full-scale GAC and the pilot-scale ozonation + GAC filtration process, another set of grab samples was taken at WWTP HM (april 2021). As seen in Figure 2, samples were taken from the secondary clarifier (location A), and in the pilot plant after the ozonation (location B), after the GAC filter (location C) and from the backwash water of the GAC filter (location D). Furthermore, in the full-scale plant samples were taken from the effluent (location F) and backwash water of the full-scale GAC filter (location E). The latter was done because at the moment of the research, the biofilm of the pilot plant GAC filter was not yet fully grown. All samples were analyzed immediately, or within the first 24 h, after being stored in a refrigerator below 5°C to prevent degradation and microbial activity.
Indicator Bacteria
The Gram-negative Escherichia coli (E. coli) and Gram-positive Enterococci are the most-used bacterial indicators of fecal contamination to indicate hazard and to test regulatory compliance (Holcomb and Stewart, 2020). For this research these two ASB were measured including one antibiotic resistant strain of each: Extended-Spectrum Beta-Lactamase (ESBL) producing E. coli and Vancomycin Resistant Enterococci (VRE) respectively (Zhou et al., 2017). Bacteria were not added as they were already present in the effluent of the WWTPs HP and HM. This research assessed whether the removal of ASB could be used as an initial proxy for the removal of ARB by coagulation and ozonation. Genes were outside the scope of this research.
For the assessment of ARB (ESBL and VRE), culture-based analysis were performed. By using a selective agar medium, bacteria were grown and screened including a resistant strain of each bacterium. This method is further described in Bicudo et al. (2021). By using a different agar growth medium, the ASB were distinguished from the ARB.
Clostridium perfringens and somatic coliphages were also included in the pilot plant and full-scale tests. Clostridium perfringens is a spore former and is considered a good indicator for protozoa removal. Somatic coliphages provide valuable information on the virus removal performances of the ozonation and the GAC-filter. The analytical methods are described in Bicudo et al. (2021).
Samples for microbial screening were filtered over 0.45 µm membranes, and several filtration volumes were tested for each sample in order to produce an acceptable number of colonies (30–300). Microbial screening was performed in triplicate for all samples and filtration volumes.
Statistical Analyses
Statistical differences in the removal of ARB and ASB were examined using two-way analysis of variance (ANOVA) tests. These tests were performed at the following points: after ozonation and after coagulation in the laboratory batch experiments, and in the effluents of the pilot plant ozonation–GAC filter and full-scale GAC filter. The two-way ANOVA was applied to the log of the ARB fraction as the dependent variable. The treated ARB fraction was calculated as C/C0, where C represents the bacteria concentration after treatment and C0 the concentration before treatment. Results were deemed significant below a p-value of 0.05. Statistical analyses were performed using R statistics software (www.r-project.org), specifically the ggplot2 package and AICcmodavg (Wickham, 2016; Mazerolle, 2020).
Log Removal and Concentrations
In the manuscript the effect of different treatment steps on ARB and ASB is expressed as log removal Concentrations can be found in the Supplementary Material S1.
Results
Laboratory Batch Experiments
Ozonation
Figure 3 shows the log removal for the three different concentrations of ozone (0.38, 0.47, and 0.58 g O3/g DOC) applied to secondary effluent of the WWTP HP and WWTP HM.
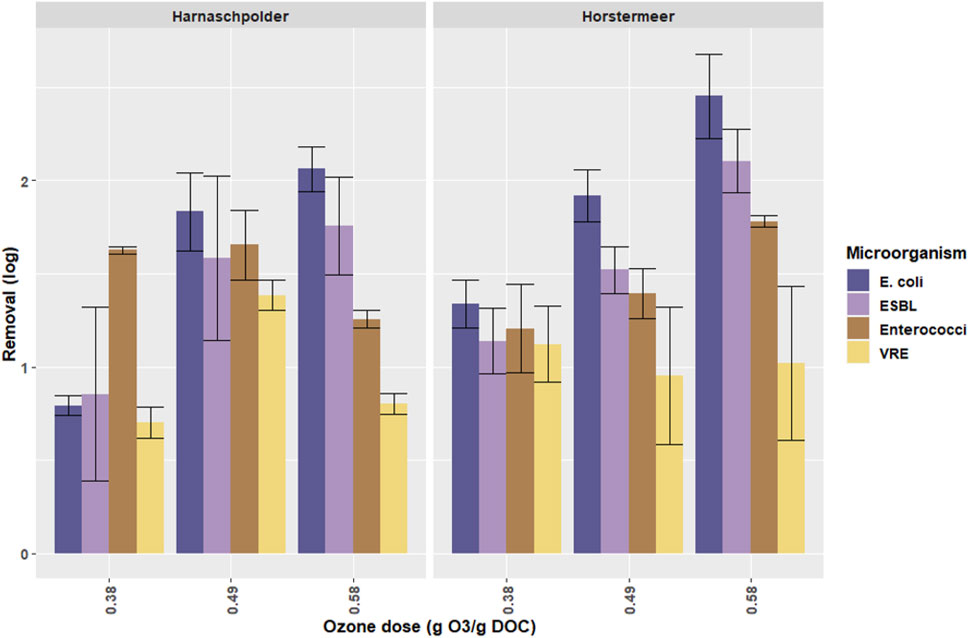
FIGURE 3. The log removal of ARB and ASB by ozonation of secondary effluent of WWTP Harnaschpolder and WWTP Horstermeer, based on four weekly grab samples per water type, measured in triplicates. The concentration of ozone is given in g O3/g DOC. Error bars indicate standard deviation.
The ANOVA showed that no significant differences were found between the removal of ARB and ASB (p = 0.65). Therefore, the ozone dose does not seem to affect removal of either group. This result shows that treatment with ozone has a similar effect on both types of bacteria and the ASB can thus be used as in indicator for the removal of resistant bacteria.
By increasing the ozone dosage, the log removal increased. This increase is significant for E. coli and ESBL. This trend was not found for Enterococci or VRE (p = 0.25). The lack of significance can either be explained by an absence of differences by higher ozone concentrations within the groups or by a limitation in data points and the large standard deviation in these groups.
Lastly, no significant differences were found between the removal of ARB and ASB from effluent of WWTP HP and WWTP HM (p = 0.66).
Coagulation
Figure 4 shows the removal of bacteria from ozonated water from the pilot plant by using two different kinds of coagulants in four different concentrations, based on the minimum and optimum Amirharajah coagulant dosage. For PAX-214 one extra concentration (0.004 mM/L) was added based on a 3.1 M ratio of the coagulant and P for the P-removal. Due to the low P-concentration at the moment of the grab sampling, resulting in a negligible low coagulant dosage, this dosage was left out for the iron experiments.
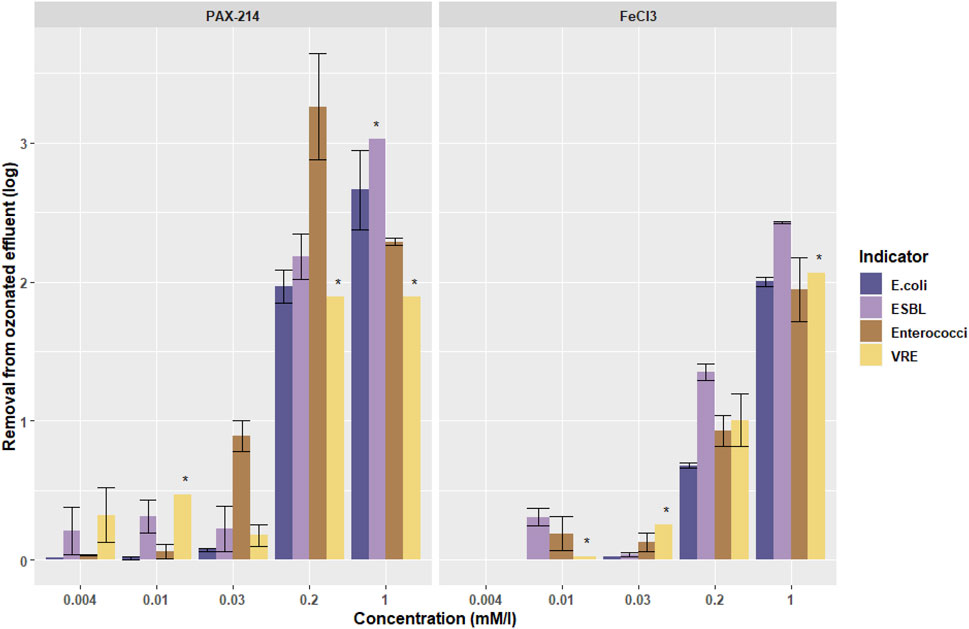
FIGURE 4. The log removal of the different indicator bacteria with different coagulants (Aluminum (PAX-214) and Iron (FeCl3) at different concentrations in ozonated water from the pilot plant (location B in Figure 2 with 0.4 g O3/g DOC). Error bars indicate standard deviation. Bars marked with an * indicate a minimum estimated removal, due to concentrations below the detection limit. The missing bar for E. coli at 0.01 mM/L FeCl3 represents an absence of removal.
For coagulation, again no significant differences were found between the removal of ARB and ASB by applying an ANOVA test (p = 0.72 for E. coli/ESBL- E. coli and p = 0.78 for Enterococci/VRE). Therefore, the ozone dose does not seem to affect removal of either group.
Figure 4 shows a larger removal by using PAX-214 than with the FeCl3 treatment. Based on the Amirtharajah diagram, the minimum and optimum dosage were chosen for as well PAX-214 as for FeCl3. The optimum dosage for aluminum is lower than for iron (0.2 and 1 mmol/L, respectively), explaining part of the higher performance for aluminum at a dosage of 0.2 mmol/L for both coagulants. However, when comparing the optimal concentration of aluminum (0.2 mmol/L) with the optimal concentration of iron (1 mmol/L), aluminum still performs better than iron when both are dosed at the optimum dosage.
Pilot Plant and Full-Scale Plant
Pilot Plant Ozonation + GAC Filtration Removal
Figure 5 shows the log removal of microorganisms in the pilot plant after ozonation (location B in Figure 2) and after ozonation + GAC filtration (location C in Figure 2). Perfringens and Coliphages are also added to the results to give an idea of the general disinfection performance in the pilot plant.
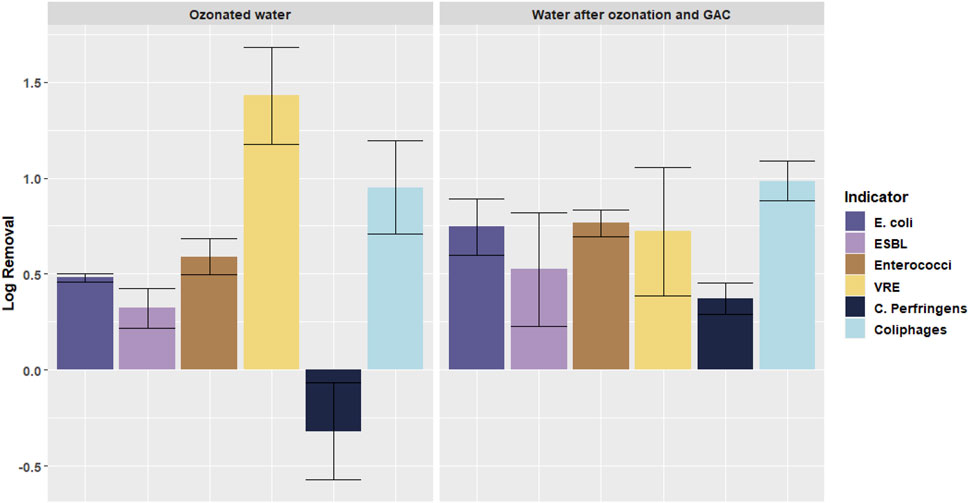
FIGURE 5. Log removal of different microorganisms in the pilot plant after different treatment steps: ozonated water after ozonation (location B) and water after ozonoation and GAC filtration (location C). Error bars indicate standard deviation.
When looking at Figure 5, a few observations can be made. First of all, it can be seen that some bacteria react better to certain types of treatment than others. Where C. Perfringens is not removed by ozonation and even an increase is seen, C. Perfringens is removed by almost 1 log during GAC filtration. For coliphages this pattern is seem the other way around: it is better removed by ozonation, whilst after GAC filtration no additional removal is obtained.
Another observation concerns the VRE/Enterococci concentrations. In the results of the pilot ozonation + GAC filter, a significant difference between the change of VRE and Enterococci was found (p = 0.0026). The ozonation did not affect the removal of VRE differently than from Enterococci, both were removed by ozonation, showing a positive log removal, when comparing the secondary effluent concentrations and ozonated water concentrations (see Supplementary Material S1). However, where after the GAC filter a removal of Enterococci of 0.1 log was found, an increase in VRE concentration of 0.7 log was noted in comparison with the concentration after ozonation. This effect (different effects on the removal of VRE and Enterococci) was not found over the complete pilot plant ozonation + GAC filtration, when comparing the concentrations in the secondary effluent (location A) and the tertiary effluent (location C).
In total, over the pilot plant ozonation + GAC filtration an average over the four indicator bacteria of 0.7 log removal was found without a significant difference between the removal of ARB and the ASB. This is significantly (p = 0.0035) smaller than the 1 log found by dosing 0.38 g O3/g DOC in the ozonation laboratory batch experiments. Some of the log removals during ozonation in the pilot plant appeared to be negative (C. Perfringens), indicating an increase of the number of microorganisms.
Full-Scale GAC Filtration Removal
Figure 6 shows the log removal of microorganisms in the full-scale GAC filtration, compared to the removal in the pilot plant ozonation + GAC filtration. In the full-scale GAC filter the different effects on the removal of VRE and Enterococci can be seen as well. A removal of Enterococci of 0.8 log was measured, whilst an increase of VRE concentrations of 0.5 log was measured. Furthermore, similar to the ozonation + GAC filter, C. Perfringens is removed by the full-scale GAC-filter whilst the coliphages are not. E. coli and ESBL E. coli are both removed by 1 log in the full-scale GAC filter.
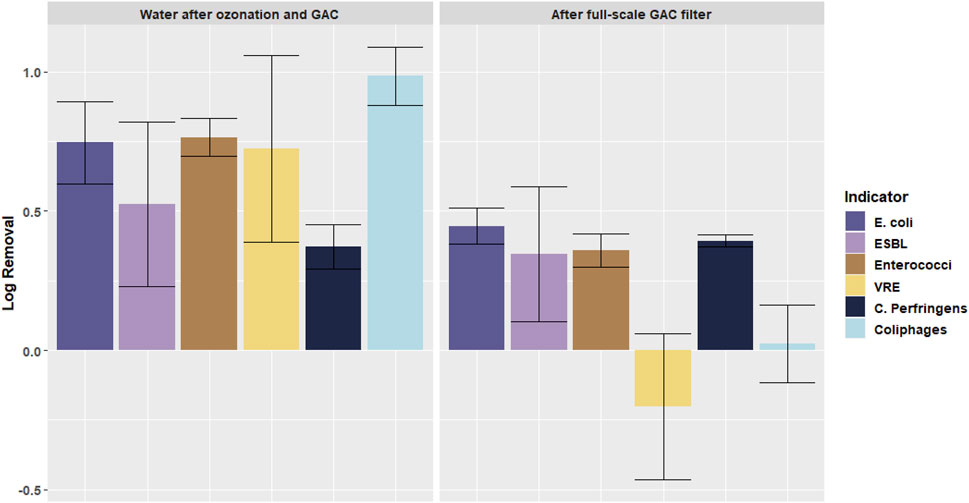
FIGURE 6. Log removal of different microorganisms in full-scale GAC filtration (location F) and in the pilot plant ozonation + GAC filtration (location C). Error bars indicate standard deviation.
Full-Scale and Pilot Plant GAC Filter: Effect of Biomass Maturity
Based on the absence of nitrate removal in the pilot plant GAC filter, it was concluded that the biology was not yet fully developed when the samples were taken. This was due to the short running time of the pilot plant (sixth months) compared to the long running time of the full-scale GAC filter (several years). To obtain information on the impact of the biofilm development in the GAC filter on the AR, the microorganisms in the backwash water of the full-scale GAC filter (biologically active) and the pilot plant GAC filter (biologically not yet active) are compared in Figure 7, which shows the increase or decrease in the backwash water related to the secondary effluent.
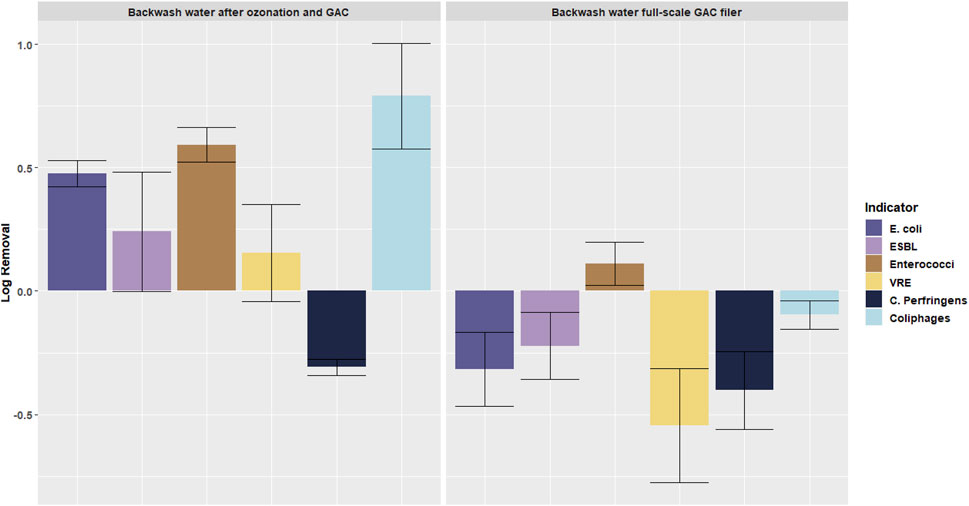
FIGURE 7. increase and decrease of microorganisms in the backwash water of the GAC filter of the pilot plant (location D) and the GAC filter of the full-scale plant (location E) related to the concentrations in the secondary effluent (location A). Error bars indicate standard deviation.
The backwash water of the pilot plant GAC filter with a not yet developed biology showed a decrease of microorganisms, except for C. Perfringens. C. Perfringens is not very sensitive for ozonation so it is flushed out during the GAC filter backwash. The backwash water of the full-scale GAC filter with a mature biomass showed an increase in the concentrations of microorganisms, related to the secondary effluent. The high increase of VRE corresponds well with the increase of VRE in the full-scale GAC filter effluent (Figure 6): it may be an indication of regrowth of VRE in the mature GAC filter, resulting also in a high concentration in the backwash water.
Discussion
No significant differences were found between the removal of ARB and ASB when applying ozonation or coagulation, suggesting that ARB behave the same towards these treatment processes as ASB. As resistant bacteria often appear in much lower concentrations that are more difficult to measure, using ASB as an initial indicator of ARB can provide a significant advantage. This is a large benefit as ARB are usually found at much lower concentrations than ASB and are therefore harder to detect. Furthermore, ASB do not require refrigeration and the specific agar used is cheaper than the agar for ARB screening. ASB analysis is a commonly used technique and as such does not require additional training or specialist expertise. The selected bacteria are standard indicator bacteria and provide information on the behavior of Gram-positive as well as Gram-negative bacteria. ESBL-E. coli and VRE have been identified by the US-CDC as health treats of high concern (Kadri, 2020). Lastly it is easy to implement, as most water quality guidelines include measures for ASB while there are no guidelines for ARB (Bicudo et al., 2021).
The removal of ARB and ASB by ozonation and coagulation, found in this study, are in line with the reported values in literature. For ozonation the log removal varied between 1 and 2, depending on the ozone dose. In a literature review Hiller et al. (2019) reported for ozonation an ARB log removal between 1.4 and 1.8. Li et al. (2017) measured the effective removal of ARGs from the effluents of WWTPs by a coagulation process using FeCl3, with a log removal between 0.5 and 3.1. At the highest FeCl3 dose in our study a log removal of ARB and ASB up to 2 was reached. Sabri et al. (2020) measured a 1.3 log reduction of ARGs in the same full-scale GAC filter in which we measured a 1 log reduction of ARB and ASB, except for VRE which showed an increase in the effluent of the full-scale GAC filter. Also Wan et al. (2021) described an increased AR in activated carbon filters, while Foroughi et al. (2022) mentioned that regrowth after ozonation cannot be avoided, especially for some ARB and ARGs variants. Although bacteria are effectively destroyed by ozonation, the ARGs stay in similar concentrations causing the ozone treatment to select for antibiotic resistance genes (Alexander et al., 2016; Calderón-Franco et al., 2021). In our study we did not observe an increase in ARB and ASB after ozonation–GAC filtration in the pilot plant, maybe due to the absence of a mature biofilm in the pilot plant. The pilot plant was in operation for less than 6 months, while the full-scale GAC filter has been in operation for several years. This affects the maturity of the biofilm in the GAC filter. When comparing the results of the pilot plant ozonation + GAC filtration with the ozonation laboratory batch experiments, an average over the four indicator bacteria of 0.7 log removal was found at an ozone dose of 0.4 g O3/g DOC, while 1 log removal was found by dosing 0.38 g O3/g DOC in the ozonation laboratory batch experiments. This may be an indication that there was already some regrowth taking place in the GAC filter after ozonation, without reaching a negative removal as in the full-scale GAC filter with a mature biofilm for VRE. After the GAC filter of the pilot plant ozonation + GAC filter (location C) the percentage of VRE in Enterococci increased to 14% whilst after ozonation this was only 2%.
The results obtained in this study have effects on the operation of tertiary treatment steps in practice, considering the purposes of these treatment steps: removal of OMPs, removal of AR or removal of nutrients.
Both ozonation and coagulation showed in previous literature (Hiller et al., 2019; Li et al., 2017) and in the laboratory batch experiments that they have the potential to obtain high removal efficiencies for ARB and ASB, up to a log removal of 3. However, the log removal of the ozonation + GAC filtration was only 0.7. The low log removal in the pilot plant ozonation + GAC filtration can be explained by the fact that the removal of OMPs require a much lower ozone dose (around 0.4 g O3/g DOC) than disinfection does (between 1 and 1.5 g O3/g DOC) and is in line with the literature (Hembach et al., 2019). Ozonation of wastewater is often designed for the removal of trace organic chemicals at which dose it cannot considered a reliable disinfection process (Hiller et al., 2019). According to this literature and the results presented in Figure 3, increasing the ozone dose will most likely result in a more effective (AR) bacteria removal. The risk of increasing the ozone dose in wastewater effluent is that more potentially (eco-)toxicological by-products, such as bromate, can be formed (Jahan et al., 2021). Especially when a relatively high bromide concentration (the precursor of bromate formation) is present in the wastewater, an increase of ozone may result in high bromate concentrations. For toxicity reasons the bromate concentration in surface water will be regulated very strict as it is considered as a compound of very high concern. The proposed risk limit in the Netherlands is 50 μg/L for surface water and 1 μg/L near drinking water abstraction points (RIVM, 2021). According to Soltermann et al. (2017), the addition of hydrogen peroxide (H2O2) can partially suppress the bromate formation during wastewater ozonation as then lower ozone concentrations are needed by obtaining the same oxidation potential. The hydrogen peroxide addition is recommended to consider in future research.
For coagulation, the coagulant dosage needs to be high to be effective for AR removal, compared to the dose for P removal. Although some removal took place with the minimum dosages of iron and aluminum, much higher results are obtained with the optimal dosages for sweep coagulation (Figure 4). Above the optimum sweep coagulation concentration, the increase in removal stagnated, implying higher concentrations are not necessarily favorable, especially as the superfluous coagulant add to the amount of sludge that should then be removed from the water. To entrap (antibiotic resistant) bacteria in the flocs, after ozonation of WWTP effluent, higher coagulant concentrations than currently dosed in the ozonation + GAC filter for P removal should thus be dosed (0.2 mmol/L for PAX-214 and 1 mmol/L for FeCl3, as shown in Figure 4). When the phosphorus concentration is low enough (below 0.15 mg P/L), which is often the case at WWTP HM, the coagulant is even not added at all and thus bacteria removal by coagulation is absent. The implication of a higher coagulant dosage is that a larger amount of sludge may be produced. This affects the GAC filter as it will most likely result in a pressure increase and accordingly an increased need for backwashing and waste production.
Another implication for practice is the increased AR in activated carbon filters. After the GAC filter of the pilot plant ozonation + GAC filter (location C) the percentage of VRE in Enterococci increased to 14% whilst after ozonation this was only 2%. This means that the ozone prevents the enhancement of antibiotic resistance in the filter, but the GAC filter has a negative impact on the relative ARB concentration in the water. For E. coli and ESBL E. coli, this relative increase is not found. With respect to the full-scale plant, the GAC filter contained a matured biofilm that in the pilot plant ozonation + GAC filter was not yet fully present but the GAC filter can be assumed to develop a biofilm over time. After the full-scale GAC-filter (location F), the percentage of VRE in comparison with Enterococci rose to 48%. In the full-scale GAC filter VRE showed an increase of 0.5 log whilst the antibiotic sensitive Enterococci was removed with 0.5 log (Figure 6). The same phenomenon of VRE increase was observed in the backwash water of the biologically active full-scale GAC filter. Over time, when a biofilm has grown over the filter, a similar relative and absolute increase in AR may occur at the pilot plant ozonation + GAC filter as well. The possible abundance of ARGs, due to cell lysis by ozonation could potentially add to the selective pressure in this filter. It is therefore recommended to monitor these changes in AR caused by the GAC-filter.
In general, tertiary treatment steps focused on the removal of OMPs and nutrients, did not achieve a high removal of AR and even a slight increase was found. In theory increase of ozone or coagulant dose are options for better bacteria removal, but there are several disadvantages as well. In secondary effluents with a relatively high bromide concentration, different techniques than ozone should be considered to remove ARB/ARGs. Several membrane techniques have proven to be effective for the removal of ARB and ARGs as well (Le et al., 2018; Hembach et al., 2019). However, membrane filtration technologies are expensive and energy consuming and it is important to come with a sufficient solution for the concentrate as these ARGs are present in increased levels in the concentrate. This shows that the selection of an extra treatment step is always a consideration of costs, energy consumption and the type of pollutant that has to be removed.
Conclusion
The purpose of this research was to test what the impact is of an additional tertiary treatment step consisting of ozonation, coagulation, granular activated carbon filtration, or combinations of these, on the spread of AR by WWTPs. Microbiological analysis focused on antibiotic resistant bacteria (ABR) and antibiotic sensitive bacteria (ASB).
Lab results showed no significant differences between the removal of ARB and ASB when applying ozonation and coagulation, implying that ASB may be used as an initial proxy for the removal of ARB during ozonation and coagulation. This is a large benefit as ARB are usually found at much lower concentrations than ASB and are therefore harder to detect. ASB is a commonly used technique as most water quality guidelines include measures for ASB and as such does not require additional training or specialist expertise. implement, Coagulation and ozonation are both effective in the removal of (AR) bacteria. However, for both coagulation and ozonation a higher dose is needed for attenuation the ARB and ASB than what is currently applied for P-removal and OMPs removal. In the tested full-scale granular activated carbon (GAC) and pilot plant ozonation + GAC, a 250 times higher coagulant dose and a 2.5–4 times higher ozone dose was necessary to achieve 2-3 log ARB and ASB removal. An increase of the ozone dose results in a higher (AR) bacteria removalBy increasing the coagulant dose, a higher bacteria removal is obtained. Furthermore, the bacteria removal by applying coagulation is limited to around 2 log. Above the optimum sweep coagulant dosage, the removal stagnated.
A GAC filter impacts Enterococci and VRE differently: there is an increase in the VRE to Enterococci ratio. In a matured, biologically active GAC filter, VRE may even increase. ARB might grow in the biofilm during the GAC filtration step and although these bacteria are not necessarily directly harmful, they can pass down their resistance to harmful bacteria using horizontal gene transfer.
Data Availability Statement
The original contributions presented in the study are included in the Supplementary Material, further inquiries can be directed to the corresponding author.
Author Contributions
TS: Investigation, experimental runs, analysis, visualisation, writing-original draft preparation; BP: Investigation, experimental runs, supervision, guidance in project steps; DH: Supervison, guidance in project steps; MK: Supervision, guidance in project steps; CJ: Supervision, guidance in project steps; JV: Supervision, guidance in project steps, writing-review and editing.
Funding
The pilot plant experiments in this research were funded by STOWA (Dutch Foundation for Applied Water Research) and the Dutch Ministry of Infrastructure and Water Management as part of the IPMV program (Innovation Program Micropollutant Removal).
Conflict of Interest
Authors TS and CJ are employed by Witteveen+Bos. Author JV is employed by Waternet.
The remaining authors declare that the research was conducted in the absence of any commercial or financial relationships that could be construed as a potential conflict of interest.
Publisher’s Note
All claims expressed in this article are solely those of the authors and do not necessarily represent those of their affiliated organizations, or those of the publisher, the editors and the reviewers. Any product that may be evaluated in this article, or claim that may be made by its manufacturer, is not guaranteed or endorsed by the publisher.
Acknowledgments
The authors want to thank water utility Waternet and regional water authority Delfland for providing water samples from the WWTP Horstermeer and WWTP Harnaschpolder.
Supplementary Material
The Supplementary Material for this article can be found online at: https://www.frontiersin.org/articles/10.3389/fenvs.2022.834577/full#supplementary-material
References
Alexander, J., Knopp, G., Dötsch, A., Wieland, A., and Schwartz, T. (2016). Ozone Treatment of Conditioned Wastewater Selects Antibiotic Resistance Genes, Opportunistic Bacteria, and Induce strong Population Shifts. Sci. Total Environ. 559, 103–112. doi:10.1016/j.scitotenv.2016.03.154
Andersson, D. I., and Hughes, D. (2014). Microbiological Effects of Sublethal Levels of Antibiotics. Nat. Rev. Microbiol. 12 (7), 465–478. doi:10.1038/nrmicro3270
Ashbolt, N. J., Amézquita, A., Backhaus, T., Borriello, P., Brandt, K. K., Collignon, P., et al. (2013). Human Health Risk Assessment (Hhra) for Environmental Development and Transfer of Antibiotic Resistance. Environ. Health Perspect. 121 (9), 993–1001. doi:10.1289/ehp.1206316
Bader, H., and Hoigné, J. (1981). Determination of Ozone in Water by the Indigo Method. Water Res. 15 (4), 449–456. doi:10.1016/0043-1354(81)90054-3
Bicudo, B., van Halem, D., Trikannad, S. A., Ferrero, G., and Medema, G. (2021). Low Voltage Iron Electrocoagulation as a Tertiary Treatment of Municipal Wastewater: Removal of Enteric Pathogen Indicators and Antibiotic-Resistant Bacteria. Water Res. 188, 116500. doi:10.1016/j.watres.2020.116500
Calderón-Franco, D., Apoorva, S., Medema, G., Van Loosdrecht, M. C. M., and Weissbrodt, D. G. (2021). Upgrading Residues from Wastewater and Drinking Water Treatment Plants as Low-Cost Adsorbents to Remove Extracellular DNA and Microorganisms Carrying Antibiotic Resistance Genes from Treated Effluents. Sci. Total Environ. 778, 146364. doi:10.1016/j.scitotenv.2021.146364
Chapman, J. S. (2003). Disinfectant Resistance Mechanisms, Cross-Resistance, and Co-resistance. Int. Biodeterioration Biodegradation 51 (4), 271–276. doi:10.1016/s0964-8305(03)00044-1
Dekker, A., and Zijlstra, W. (2013). Monitoring 1-Step Filter Horstermeer. STOWA report 35. Amersfoort, Netherlands: Foundation for applied Water Research STOWA.
Dennett, K. E., Amirtharajah, A., Moran, T. F., and Gould, J. P. (1996). Coagulation: Its Effect on Organic Matter. J. - Am. Water Works Assoc. 88 (4), 129–142. doi:10.1002/j.1551-8833.1996.tb06539.x
Dodd, M. C. (2012). Potential Impacts of Disinfection Processes on Elimination and Deactivation of Antibiotic Resistance Genes during Water and Wastewater Treatment. J. Environ. Monit. 14 (7), 1754–1771. doi:10.1039/c2em00006g
Ebrahimzadeh, S., Wols, B., Azzellino, A., Martijn, B. J., and van der Hoek, J. P. (2021). Quantification and Modelling of Organic Micropollutant Removal by Reverse Osmosis (RO) Drinking Water Treatment. J. Water Process Eng. 42, 102164. doi:10.1016/j.jwpe.2021.102164
Ekblad, M., Juárez, R., Falås, P., Bester, K., Hagman, M., and Cimbritz, M. (2021). Influence of Operational Conditions and Wastewater Properties on the Removal of Organic Micropollutants through Ozonation. J. Environ. Manage. 286, 112205. doi:10.1016/j.jenvman.2021.112205
EU (2000). Directive 2000/60/EC of the European Parliament and of the Council of 23 October 2000 - Establishing a Framework for Community Action in the Field of Water Policy. Official J. Eur. Union, L 327/1–L 327/72.
Foroughi, M., Khiadani, M., Kakhki, S., Kholghi, V., Naderi, K., and Yektay, S. (2022). Effect of Ozonation-Based Disinfection Methods on the Removal of Antibiotic Resistant Bacteria and Resistance Genes (ARB/ARGs) in Water and Wastewater Treatment: a Systematic Review. Sci. Total Environ. 811, 151404. doi:10.1016/j.scitotenv.2021.151404
Fu, M., He, M., Heijman, B., and van der Hoek, J. P. (2021a). Ozone-based Regeneration of Granular Zeolites Loaded with Acetaminophen. Separation Purif. Technology 256, 117616. doi:10.1016/j.seppur.2020.117616
Fu, M., Wang, J., Heijman, B., and van der Hoek, J. P. (2021b). Removal of Organic Micropollutants by Well-Tailored Granular Zeolites and Subsequent Ozone-Based Regeneration. J. Water Process Eng. 44, 102403. doi:10.1016/j.jwpe.2021.102403
Guillossou, R., Le Roux, J., Brosillon, S., Mailler, R., Vulliet, E., Morlay, C., et al. (2020). Benefits of Ozonation before Activated Carbon Adsorption for the Removal of Organic Micropollutants from Wastewater Effluents. Chemosphere 245, 125530. doi:10.1016/j.chemosphere.2019.125530
Hembach, N., Alexander, J., Hiller, C., Wieland, A., and Schwartz, T. (2019). Dissemination Prevention of Antibiotic Resistant and Facultative Pathogenic Bacteria by Ultrafiltration and Ozone Treatment at an Urban Wastewater Treatment Plant. Sci. Rep. 9 (1), 1–12. doi:10.1038/s41598-019-49263-1
Hiller, C. X., Hübner, U., Fajnorova, S., Schwartz, T., and Drewes, J. E. (2019). Antibiotic Microbial Resistance (AMR) Removal Efficiencies by Conventional and Advanced Wastewater Treatment Processes: A Review. Sci. Total Environ. 685, 596–608. doi:10.1016/j.scitotenv.2019.05.315
Holcomb, D. A., and Stewart, J. R. (2020). Microbial Indicators of Fecal Pollution: Recent Progress and Challenges in Assessing Water Quality. Curr. Envir Health Rpt 7 (3), 311–324. doi:10.1007/s40572-020-00278-1
Hollender, J., Zimmermann, S. G., Koepke, S., Krauss, M., McArdell, C. S., Ort, C., et al. (2009). Elimination of Organic Micropollutants in a Municipal Wastewater Treatment Plant Upgraded with a Full-Scale post-ozonation Followed by Sand Filtration. Environ. Sci. Technol. 43 (20), 7862–7869. doi:10.1021/es9014629
Iakovides, I. C., Manoli, K., Karaolia, P., Michael-Kordatou, I., Manaia, C. M., and Fatta-Kassinos, D. (2021). Reduction of Antibiotic Resistance Determinants in Urban Wastewater by Ozone: Emphasis on the Impact of Wastewater Matrix towards the Inactivation Kinetics, Toxicity and Bacterial Regrowth. J. Hazard. Mater. 420, 126527. doi:10.1016/j.jhazmat.2021.126527
Jahan, B. N., Li, L., and Pagilla, K. R. (2021). Fate and Reduction of Bromate Formed in Advanced Water Treatment Ozonation Systems: A Critical Review. Chemosphere 266, 128964. doi:10.1016/j.chemosphere.2020.128964
Johnson, P. N., and Amirtharajah, A. (1983). Ferric Chloride and Alum as Single and Dual Coagulants. J. - Am. Water Works Assoc. 75 (5), 232–239. doi:10.1002/j.1551-8833.1983.tb05122.x
Kadri, S. S. (2020). Key Takeaways from the US CDC’s 2019 Antibiotic Resistance Threats Report for Frontline Providers. Crit. Care Med. 48 (7), 939–945. doi:10.1097/ccm.0000000000004371
Karkman, A., Do, T. T., Walsh, F., and Virta, M. P. J. (2018). Antibiotic-Resistance Genes in Waste Water. Trends Microbiol. 26 (3), 220–228. doi:10.1016/j.tim.2017.09.005
Korzeniewska, E., Korzeniewska, A., and Harnisz, M. (2013). Antibiotic Resistant Escherichia coli in Hospital and Municipal Sewage and Their Emission to the Environment. Ecotoxicology Environ. Saf. 91, 96–102. doi:10.1016/j.ecoenv.2013.01.014
Le, T.-H., Ng, C., Tran, N. H., Chen, H., and Gin, K. Y.-H. (2018). Removal of Antibiotic Residues, Antibiotic Resistant Bacteria and Antibiotic Resistance Genes in Municipal Wastewater by Membrane Bioreactor Systems. Water Res. 145, 498–508. doi:10.1016/j.watres.2018.08.060
Li, N., Sheng, G.-P., Lu, Y.-Z., Zeng, R. J., and Yu, H.-Q. (2017). Removal of Antibiotic Resistance Genes from Wastewater Treatment Plant Effluent by Coagulation. Water Res. 111, 204–212. doi:10.1016/j.watres.2017.01.010
Liu, T. K. (2017). Organic Micropollutant Treatment by Pre-ozonation and Activated Carbon – O3GAC Project Research. Delft, Netherlands: Delft University of Technology, Department of Water Management. MSc thesis Available at: https://repository.tudelft.nl/islandora/object/uuid%3Ac23ee83e-1e93-42aa-ac80-0b95b59912bb (Accessed February 23, 2022).
Loos, R., Carvalho, R., António, D. C., Comero, S., Locoro, G., Tavazzi, S., et al. (2013). EU-wide Monitoring Survey on Emerging Polar Organic Contaminants in Wastewater Treatment Plant Effluents. Water Res. 47, 6475–6487. doi:10.1016/j.watres.2013.08.024
Luo, Y., Guo, W., Ngo, H. H., Nghiem, L. D., Hai, F. I., Zhang, J., et al. (2014). A Review on the Occurrence of Micropollutants in the Aquatic Environment and Their Fate and Removal during Wastewater Treatment. Sci. Total Environ. 473-474, 619–641. doi:10.1016/j.scitotenv.2013.12.065
Mazerolle, M. J. (2020). AICcmodavg: Model Selection and Multimodel Inference Based on (Q)AIC(c). R package version 2.3-1. Available at: https://cran.r-project.org/package=AICcmodavg (Accessed February 23, 2022).
Michael, S. G., Michael-Kordatou, I., Beretsou, V. G., Jäger, T., Michael, C., Schwartz, T., et al. (2019). Solar Photo-fenton Oxidation Followed by Adsorption on Activated Carbon for the Minimisation of Antibiotic Resistance Determinants and Toxicity Present in Urban Wastewater. Appl. Catal. B: Environ. 244, 871–880. doi:10.1016/j.apcatb.2018.12.030
Ravasi, D., König, R., Principi, P., Perale, G., and Demarta, A. (2019). Effect of Powdered Activated Carbon as Advanced Step in Wastewater Treatments on Antibiotic Resistant Microorganisms. Cpb 20 (1), 63–75. doi:10.2174/1389201020666190207095556
RIVM (2021). Risk Limits for Bromate in Surface Water - Determined According to the Methodology of the Water Framework DirectiveRIVM-Briefrapport 2021-0101. Bilthoven, Netherlands: National Institute for Public Health and the Environment.
Rizzo, L., Manaia, C., Merlin, C., Schwartz, T., Dagot, C., Ploy, M. C., et al. (2013). Urban Wastewater Treatment Plants as Hotspots for Antibiotic Resistant Bacteria and Genes Spread into the Environment: A Review. Sci. Total Environ. 447, 345–360. doi:10.1016/j.scitotenv.2013.01.032
Rodríguez, A., Rosal, R., PerdigónMelón, J., Mezcua, M., Agüera, A., Hernando, M., et al. (2008). “Ozone-Based Technologies in Water and Wastewater Treatment,” in Emerging Contaminants from Industrial and Municipal Waste. The Handbook of Environmental Chemistry. Editors D. Barceló, and M. Petrovic (Berlin, Heidelberg: Springer), 5/5S/5S/2. (Accessed February 23, 2022).
Sabri, N. A., Van Holst, S., Schmitt, H., Van der Zaan, B. M., Gerritsen, H. W., Rijnaarts, H. H. M., et al. (2020). Fate of Antibiotics and Antibiotic Resistance Genes during Conventional and Additional Treatment Technologies in Wastewater Treatment Plants. Sci. Total Environ. 741, 140199. doi:10.1016/j.scitotenv.2020.140199
Schwarzenbach, R. P., Escher, B. I., Fenner, K., Hofstetter, T. B., Johnson, C. A., Von Gunten, U., et al. (2006). The challenge of Micropollutants in Aquatic Systems. Science 313 (5790), 1072–1077. doi:10.1126/science.1127291
Sizar, O., and Unakal, C. G. (2020). Gram Positive Bacteria. FL: StatPearls. Available at: https://www.ncbi.nlm.nih.gov/books/NBK470553/(Accessed February 23, 2022).
Soltermann, F., Abegglen, C., Tschui, M., Stahel, S., and Von Gunten, U. (2017). Options and Limitations for Bromate Control during Ozonation of Wastewater. Water Res. 116, 76–85. doi:10.1016/j.watres.2017.02.026
Von Gunten, U. (2003). Ozonation of Drinking Water: Part II. Disinfection and By-Product Formation in Presence of Bromide, Iodide or Chlorine. Water Res. 37 (7), 1469–1487. doi:10.1016/s0043-1354(02)00458-x
Wan, K., Guo, L., Ye, C., Zhu, J., Zhang, M., and Yu, X. (2021). Accumulation of Antibiotic Resistance Genes in Full-scale Drinking Water Biological Activated Carbon (bac) Filters During Backwash Cycles. Water Res. 190, 116744.
WHO, (2020). Antibiotic Resistance. Fact Sheet Available at: https://www.who.int/newsroom/factsheets/detail/antibioticresistance (Accessed June 10, 2021).
WHO, (2021a). Antimicrobial Resistance. Switzerland: World Health Organization. Available at: https://www.who.int/news-room/fact-sheets/detail/antimicrobial-resistance (Accessed February 23, 2022).
WHO, (2017). Integrated Surveillance of Antimicrobial Resistance in Foodborne Bacteria: Application of a One Health Approach: Guidance from the WHO Advisory Group on Integrated Surveillanec of Antimicrobial Resistance (AGISAR). Available at: https://apps.who.int/iris/handle/10665/255747 (Accessed February 23, 2022).
WHO, (2021b). No Time to Wait: Securing the Future from Drug-Resistant Infections - Report to the Secretary-General of the United Nations. April 2019 [EN/AR/PT/RU/ZH] - World. ReliefWeb, Available at: https://reliefweb.int/report/world/no-time-wait-securing-future-drug-resistant-infections-report-secretary-general-united (Accessed February 23, 2022).
Wickham, H. (2016). ggplot2: Elegant Graphics for Data Analysis. New York: Springer-Verlag. ISBN 978-3-319-24277-4, Available at: https://ggplot2.tidyverse.org (Accessed February 23, 2022).
Zhang, Y., Niu, Z., Zhang, Y., and Zhang, K. (2018). Occurrence of Intracellular and Extracellular Antibiotic Resistance Genes in Coastal Areas of Bohai Bay (China) and the Factors Affecting Them. Environ. Pollut. 236, 126–136. doi:10.1016/j.envpol.2018.01.033
Zhou, X., García-Cobos, S., Ruijs, G. J. H. M., Kampinga, G. A., Arends, J. P., Borst, D. M., et al. (2017). Epidemiology of Extended-Spectrum β-Lactamase-Producing E. coli and Vancomycin-Resistant Enterococci in the Northern Dutch-German Cross-Border Region. Front. Microbiol. 8, 1914. doi:10.3389/fmicb.2017.01914
Zhu, T.-t., Su, Z.-x., Lai, W.-x., Zhang, Y.-b., and Liu, Y.-w. (2021). Insights into the Fate and Removal of Antibiotics and Antibiotic Resistance Genes Using Biological Wastewater Treatment Technology. Sci. Total Environ. 776, 145906. doi:10.1016/j.scitotenv.2021.145906
Keywords: antibiotic resistance, ozone, activated carbon, coagulation, municipal secondary effluent, tertiary treatment
Citation: Spit T, van der Hoek JP, de Jong C, van Halem D, de Kreuk M and Perez BB (2022) Removal of Antibiotic Resistance From Municipal Secondary Effluents by Ozone-Activated Carbon Filtration. Front. Environ. Sci. 10:834577. doi: 10.3389/fenvs.2022.834577
Received: 13 December 2021; Accepted: 14 March 2022;
Published: 31 March 2022.
Edited by:
Yongjun Zhang, Nanjing Tech University, ChinaCopyright © 2022 Spit, van der Hoek, de Jong, van Halem, de Kreuk and Perez. This is an open-access article distributed under the terms of the Creative Commons Attribution License (CC BY). The use, distribution or reproduction in other forums is permitted, provided the original author(s) and the copyright owner(s) are credited and that the original publication in this journal is cited, in accordance with accepted academic practice. No use, distribution or reproduction is permitted which does not comply with these terms.
*Correspondence: Jan Peter van der Hoek, Si5QLnZhbmRlckhvZWtAdHVkZWxmdC5ubA==