 Huang Tuofu
 He Qingyun1*
- 1College of Geographic Science, Hunan Normal University, Changsha, China
- 2Hunan Institute of Economic Geography, Hunan University of Finance and Economics, Changsha, China
This study takes Changsha, an emerging mega-city in China, as a sample to analyze the influence of natural amenity (NA) on housing prices during different periods. We divided the NA into four categories according to their characteristics: Green Space (GS), Wetland Park (WP), XiangRiver Scenic Belt (XR), and green ratio within a community. The housing transaction data is used to calculate the accessibility of a settlement to nearest NA via the distance. The capitalization effect of NA is investigated through a geographic weighted regression (GWR), combined with the hedonic theory. Results show that ①the impact and scope of NA on housing prices gradually expanded during years. ②As the key nature landscape of Changsha, the impact coefficient of XR has risen from 2.34% in 2012 to 5.32% in 2020. WP has a remarkable increase for affecting housing prices, rising from 1.24 to 3.65%. Effect of GS keeps in line during years, at 2.34–3.72%. And green ratio’s impact increase from 3.61 to 4.55%. ③The higher capitalization effect of NA undergoes a spatial expansion from the central area to urban fringe over time, which also implies the capitalization of NA is becoming more pronounced. ④Residential communities impacted by NA have a propensity to separate over time. This study provides a different perspective in defining the importance of natural amenities in urban habitat of modern China.
Introduction
China has experienced a world-renowned urbanization process, with the rate growing from 16.22% in 1978 to 63.89% in 2020, and the Chinese urban landscape has changed tremendously (Yibo et al., 2020; Alix-Garcia et al., 2014). Rapid urbanization and the associated increase in vehicle traffic have many negative implications, including increased air and water pollution, noise and congestion. Physiological ailments such as chronic bronchitis and pneumonia, as well as mental problems as depression and burnout syndrome, have emerged as a significant threat to public health. However, urban settings also have features that promote health and may assist in attenuating some of the negative health implications of urban life. Natural amenities (NA) is increasingly being viewed as an essential settings for health promotion to solve city residential problems (De Vries et al., 2003; Anderson and West, 2006; Rajapaksa et al., 2017). The past decades, in particular, have seen an incline in interest for ecological, nature-based health promotion initiatives in both studies and practices. The new strategy of urban planning is to create, conserve, maintain, and develop NA across urban areas (Gómez-Baggethun and Barton, 2013; Tuofu et al., 2021).
Numerous studies have found that NA offers health benefits, including recreational, fitness, and educational opportunities. NA can also provide seclusion, aesthetics, or simply the absence of negative externalities associated with residential development (Irwin 2002). Meanwhile, NA additional supplied ecological services, including climate micromodulation, urban heat island mitigation (He et al., 2021), and improved water quality. Specifically, NA has the following functions that are relevant to ecosystem services (Zhao et al., 2021; Zhao et al., 2022). First, NA provides an opportunity for physical activity, and individuals may be more motivated to exercise in these surroundings due to their visual appeal. Second, residents may socialize with their families and friends in NA because it offers an enjoyable environment, which positively impacts one’s health since it encourages social engagement (De Vries et al., 2013). Last but not least, relaxation, mental repair, and stress reduction are all made easier in natural environments (Van Herzele and de Vries, 2012; De Vries et al., 2013; Yang et al., 2021). In short, NA has positive psychological effects.
NA in the urban area is often divided into two distinct categories: blue and green spaces. In general, blue spaces are mainly covered by bodies of water, while green spaces are about vegetation. With ongoing research at NA, scholars are also concerned about the different health-promoting effects of blue and green space, and the number of comparative studies on the two NA is gradually increasing. However, research on blue space and health has been concentrated on coastal waters so far (Mak et al., 2010). Until recently, only a few researches have looked at the health effects of inland surface waters. According to these scarce findings, inland urban freshwater space availability has been shown to be connected with improved psychological and general health in studies conducted in the European country, as well as a reduced incidence of mood and anxiety disorders when measured using a validated mental health scale (Wheeler et al., 2015). Some studies have proved that urban blue has unique health-promoting properties across several conceptual therapeutic aspects, notably experiential and symbolic (Voelker and Kistemann, 2015). These studies demonstrate the unique contribution of blue space to mental health benefits.
Since visibility and accessibility are critical indicators of how NA affect the value of a property (Jim and Chen, 2006; Brander and Koetse, 2011; Czembrowski and Kronenberg, 2016), it is a critical factor for valuing NA among the urban residents. Due to various health benefits associated with NA, potential homebuyers in a competitive housing market in urban area will drive up the price of a house located near NA in order to reap these benefits, and the externalities created by proximity to NA will be capitalized into the value of residential properties. Hedonic model is often employed to value location or amenities proximity of housing price as a contribution (Yang J. et al., 2019; Yang et al., 2020a). Some existing studies that use this method investigated the value of NA and most of them found a positive capitalization effect of it. The most remarkable evidence is that property price decays with increasing distance from NA when other variables are controlled (Larson and Perrings, 2013; Sander and Zhao, 2015; Mei et al., 2018; Garrett et al., 2019). However, the extent of the effect was shown to be dramatically varied in different studies (Kelejian and Prucha, 1999; Conway et al., 2010; Liao and Wang, 2012; Xu et al., 2016; Wu et al., 2020). It may be caused by NA capitalization that has not been well categorized into blue space and green to discuss further since empirical evidence has proved blue space may functional different between green space related to health. Therefore, further studies need to analyze the capitalization effect on property price of blue and green spaces separately in urban areas.
The application of Hedonic Price Model (HPM) requires the consideration of spatial heterogeneity since the factors affecting house prices are distributed unevenly. Studies proved the existence of spatial dependence effects in properties price, and there are many related discussions in terms of the application of corresponding HPM (Anselin, 2003). Relate empirical studies also found that the effects of attributes such as NA and neighborhood amenities on house prices are heterogeneous across distributions (Ebru and Eban, 2011). The standard ordinary least squares (OLS) specification violates the assumption that residential transactions are independent in characteristic regressions, resulting in largely unstable and inefficient estimated parameters (LeSage and Pace, 2004). HPM that controls for the explicit spatial location can still have residuals of house prices that exhibit spatial dependence. To address the spatial dependence of HPM, a spatial lag model (SLM) or spatial model (SEM) are commonly added to HPM to improve the performance in the existing studies (Yuan et al., 2018; Yue et al., 2019; Wen et al., 2014). This strategy has also been employed in some articles focusing on the NA capitalization effect (Bin and Polasky, 2004; Liao and Wang, 2012; Zhang et al., 2019). However, it has certain drawbacks because the dependent lagged or error term as an explained variables component may be related to the error term, resulting in endogenous problems.
Due to the limitations of the parametric model as SLM or SEM, more non-parametric methods are introduced into HPM theory. In recent years, as Figure 1 showed, HPM studies increasingly applied Geographic Weighted Regression (GWR) theory to deal with the endogeneity due to spatial heterogeneity. GWR method proposed by Fotheringham et al., 1998 is a non-parametric model for spatial dependence dilemma, which essentially gives different parameters to different regions to solve the heterogeneity that has received attempts in recent years of spatial influences on property prices (Hu et al., 2016; Shanggang et al., 2018; Li H. et al., 2019). Since GWR considers the local effects of spatial objects, it provides a better level of accuracy (Yang et al., 2020b).
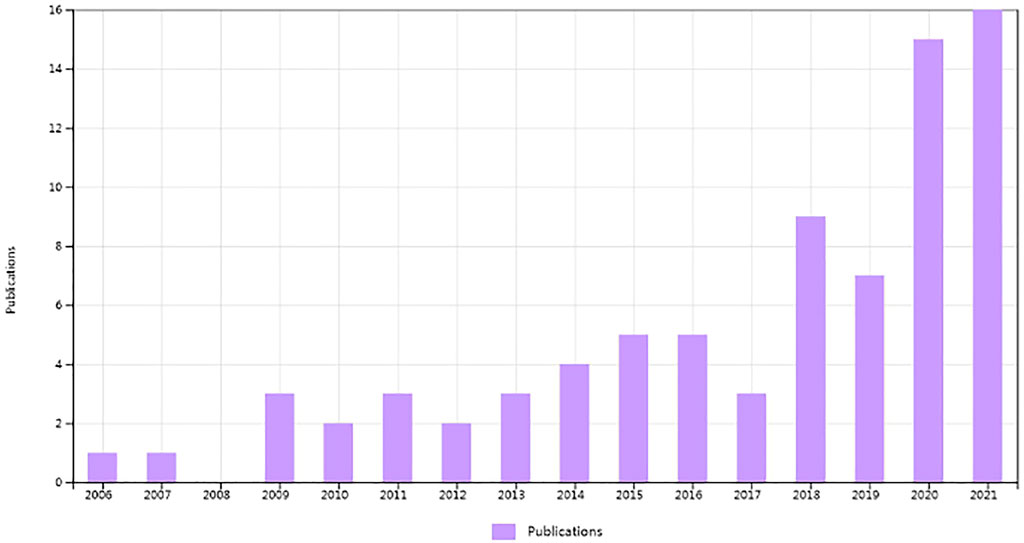
FIGURE 1. HPM applied GWR publication trend.
However, few studies have applied GWR to study the capitalization effects on housing prices of different types of NA. Moreover, GWR can draw the map of spatial heterogeneity in the estimated coefficients of different explanatory variables with different periods, which is even less common in existing research. Additionally, despite rising urbanization, most research on capitalization effect on NA has been undertaken in Europe, the United States, and Australia (Gascon et al., 2015), with few studies of similar topic on China. In general, the spatial heterogeneity of various kinds of NA impacting building values in mega-cities of China has not been adequately examined.
To fill this research gap, this study aims to reveal the capitalization effect with the temporal-spatial expanding trend of various urban blue and green spaces on housing prices. By employing a group of quality housing transaction data and Land Use Land-Cover Change (LUCC) data of Changsha, an emerging mega-city of China, we use GWR method to improve HPM to achieve our goals. Specifically, the wetlands, river, green spaces and green ratio within the communities of the research region are categorized and digitized according to their actual use functions. Then, the main explanatory variables related to housing structure, neighborhood, location and NA are selected to model GWR for valuing the capitalization effect on housing prices. All accessibility variables are calculated using Euclidean distance. This study contributes to the existing literature by systematically exploring how the capitalization effect of NA on housing value varies temporal and spatially, which is the first study to conduct this topic across urban China as far as we know. The results of this study may also give some empirical evidence for urban administrators and planners as advice for the efficient use of NA resources.
The rest part of this study is arranged as follows. Next section is method and methodology, which gives the GWR model design and the variables. Section 3 is the setting of the spatial weight matrix that varying residential areas in different time. Section 4 reveals the GWR results and further discusses their temporal-spatial impact effect. The last section is the conclusion and recommendation of this study.
Methods
Studying Region and Variables
This paper takes the urban area of Changsha as the research region, including Yuelu District, Yuhua District, Tianxin District, Kaifu District and Furong District, with a total area is about 969 square kilometers. The study area accounts for 74% of the city’s resident population, and this area is the most densely populated area in Changsha. The CBD is located on the east bank of XiangRiver, called Wuyi Square, which is also the value plateau of Changsha real estate. The urban pattern and planning scope of this study are defined mainly with reference to the Changsha Urban Planing (2017–2035). This city’s economy has grown significantly recently. From 2014 to 2019, the city’s GDP grew 10.4% annually, compared to 6.8% nationally. As China continues to shift its development focus to the Middle Region, Changsha’s future is promising.
We collected housing transaction data from Changsha’s Housing and Urban-rural Development Bureau, which included the location and market value of each house. We gathered 74,511 housing transactions and integrated the related data for residential communities. Additionally, we received community data from the same source for all 5,860 communities in the study area, including their location, plot ratio, and building age. The POI data was compiled using Baidu Map’s (map.baidu.com) service and supplemented with Google Earth satellite maps. This collection contains both private and public service amenities such as schools, retail malls, and subway stations. We plotted NA distribution in the research region using the most recent 2020 Changsha Metropolitan Area LUCC data (supplied by the Changsha Department of Environment and Natural Resources). Figure 2 shows all elements of this study.
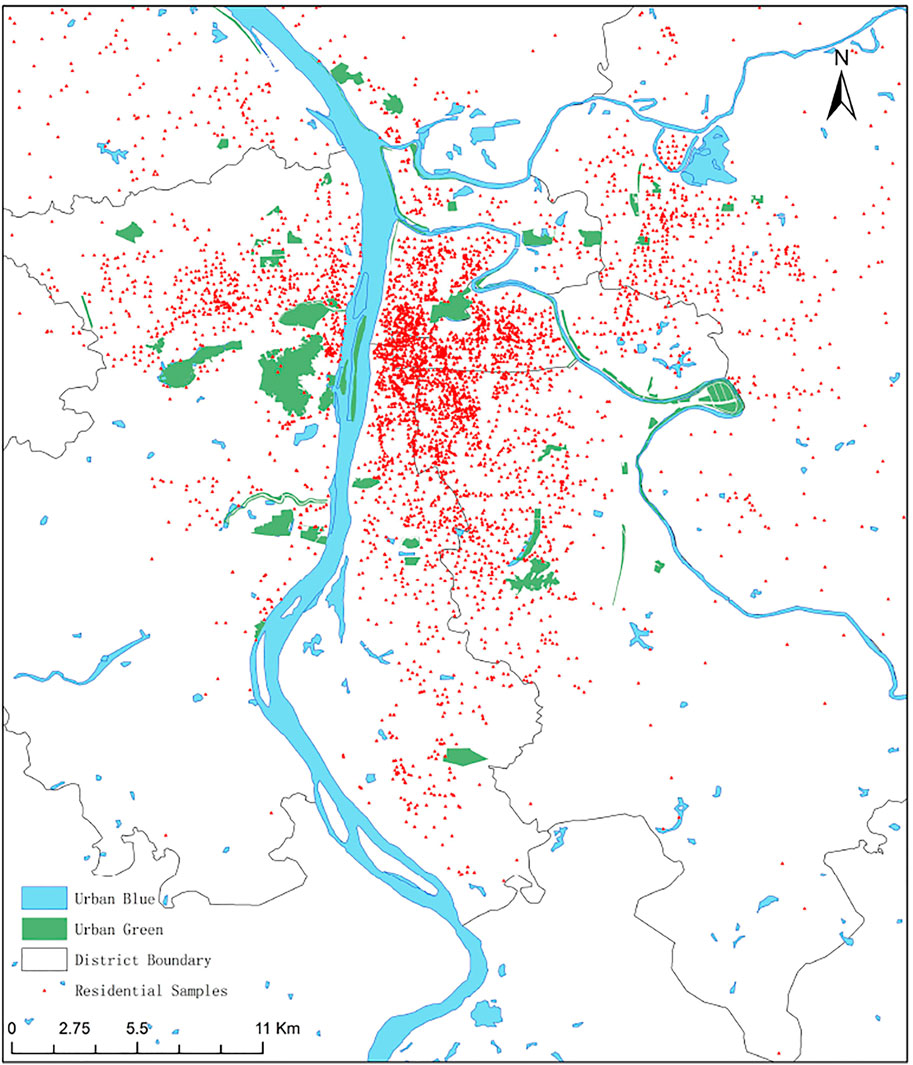
FIGURE 2. Study area and sample residential communities.
We use the logarithm community average price as the explained variable. The average price is calculated by the total sales areas and the total amount of houses sold within a community during the whole year. Explanatory variables are divided into three groups by reduced HPM: neighborhood, location, and structure. To examine house purchasers’ willingness-to-pay (WTP) for access to urban NA, we model an extra set of variables that includes access to XiangRiver scenic belt (XR), wetland park (WP), and open green spaces (GS). To analyze the WTP of buyers for inner communities NA, we use the green ratio index of a housing complex as an explanatory variable already contained in structural group variables. Variables have three forms of value. The first group includes constant numeric variables like building age. Discrete numerical variables are ranked according to their values. Dummy variables are defined by 0 and 1. The descriptions of these variables are shown in Table 2. Specific descriptions of all variables are as follows.
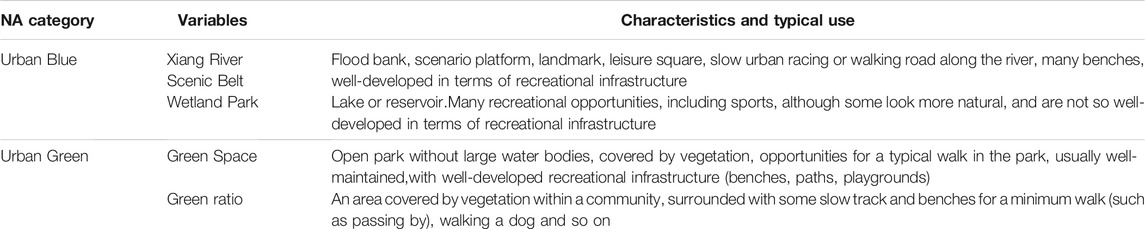
TABLE 2. NA categories in Changsha identified in this study.
Structural variables, in combination with house and community characteristics, including plot ratio, green ratio, land management and building age, play a role in determining house prices. According to previous research, plot ratio is an essential determinant of land use intensity and building quality, greatly influencing house value. The green ratio is a critical metric for determining the WTP for NA inside a community, which is what we will concentrate on more than just.
Accessibility features relate to residential communities’ geographical and environmental externalities that reflect the benefits of being near urban centers and transportation hubs (Yu et al., 2007; Schläpfer et al., 2015). Studies found that the house price gradient can diversify with the distance and direction associated with the CBD (Yue et al., 2019). Changsha’s Wuyi Square is the most central area of the city and the location of the CBD. This study uses the distance of sample residences from the Wuyi Square CBD to examine the effect of locational accessibility variables on housing prices.
XR, WP, and GS are the accessible variables of landscape studied in this paper. XR is the leading natural attraction in Changsha. The municipal government has built many scenic and recreational facilities along this river, making it an important place for residents to enjoy outdoor sports activities. The distance to XR often affects the housing price. Therefore, the Euclid distance is used to characterize the influence of XR on prices. Similarly, open spaces and natural landscapes such as wetlands, lakes, and green spaces profoundly impact housing prices. Therefore, the accessibility of WP and developed GS is also to be examined. These natural spaces are gradually becoming areas of residential concentration during the urbanization in Changsha. Some significant NAs, such as Meixi Lake and Shawan Park, are rapidly becoming sub-centers of the city, with housing values in these locations rising at an alarming rate. Since there are various wetland and green spaces in this city, we define the nearest NA to a property as the accessibility of this house for NA. Tab two shows the characteristics and typical use of NA that investigated in this study.
In terms of daily necessities, this study quantifies the number of markets and convenience stores in the vicinity of residence using the living variable to indicate the degree of convenience of living in a given community. Inequality of inner-city educational facilities has been one of the crucial determinants of heterogeneity in housing prices (Yuan et al., 2018). Therefore, two dummy variables were introduced to characterize the impact of quality primary and secondary schools near a dwelling on prices. Similarly, the proximity of a dwelling to a subway station typically represents commuting ease, which we examine with a dummy variable. The values of the neighborhood variables are all from the point-of-interest (POI) data extracted by Baidu.com. Since POI data have corresponding changes in urban construction and development, POI data at three points in time, 2012, 2016, and 2020, are used to ensure that the application of POI data is consistent with the timing of residential transactions. All abbreviations are shown in Table 1.
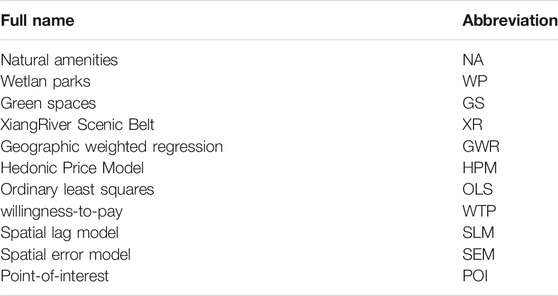
TABLE 1. Abbreviation in this study.
Hedonic GWR Model
The main limitation of most spatial econometric models such as SLM and SEM that apply Hedonic theory is giving the same parameters to all spatial locations while ignoring the spatial laws (spatial dependence) that may vary by areas. Therefore, the core modeling idea of GWR is to give different parameters to different regions within the study area to solve the heterogeneity dilemma of ignoring spatially dependence in the global model. The basic model of GWR is as follows.
Where
Performing GWR also requires the construction of a spatial weight matrix. Unlike the global model, the construction of the spatial weight matrix for GWR requires different weight relationships due to spatial heterogeneity. Therefore the kernel function is considered to join the computational process of the spatial matrix, which is estimated using the generalized least squares (GLS) method. Specifically, the GWR method is applied in three steps in this study. First, following the number of neighbors principle, housing transaction and neighborhood data are taken from each local residential sample point in Changsha to generate a different sample set for each region. Second, the spatial weight matrix is built using the distance between all sample sites and the target analysis point. Finally, using the GLS approach, each local model’s parameter estimations are solved using the spatial weight matrix. The sample-set size relies on the sparsity of the local points included in the analysis and the selected bandwidth. Adaptive bandwidth is employed, and the AICc criterion is used to calculate the bandwidth range.
Kernel Spatial Matrix
Since the GWR model is community-based, individual housing transaction prices for 3 years, 2012, 2016, and 2020 were calculated as a community’s average price for the entire year and matched to the remaining attributes of the neighborhoods. The final estimate provided 513 residential neighborhoods in 2012, 672 in 2016, and 1,013 in 2020, spatially eligible for GWR. Three components define the distance calculation formula: spatial bandwidth, kernel function, and distance calculation formula. The spatial matrix in this study is as follows.
where
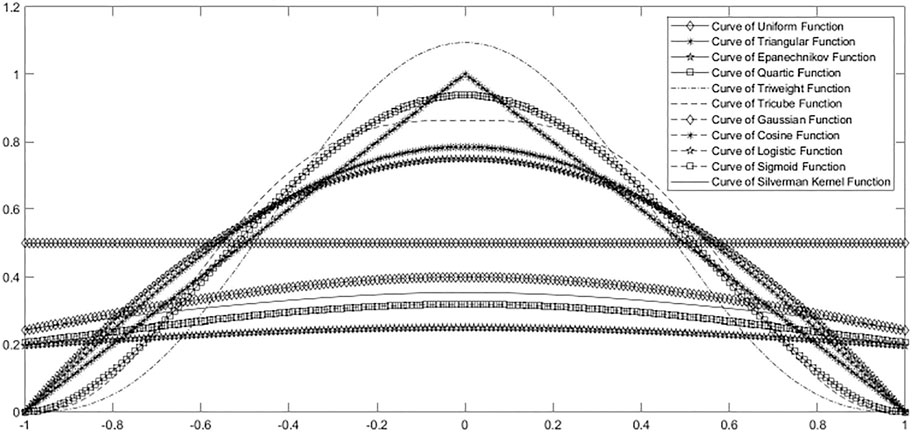
FIGURE 3. Probability density of various kernel functions.
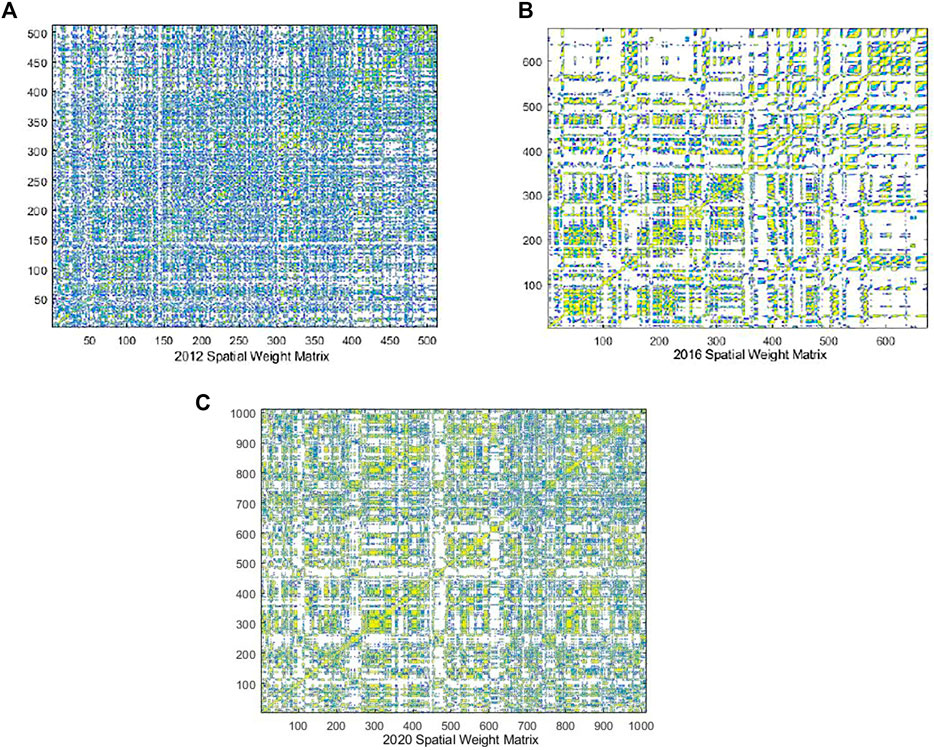
FIGURE 4. Gaussian spatial weight matrix of Changsha house prices in 2012, 2016, 2020.
Between 2012 and 2020, the number of residential community samples increased gradually from 513 in 2012 to 1,013 in 2020, showing that the number of communities with transaction records in Changsha expanded significantly. As can be observed in Figure 3, the spatial weight matrix varies significantly between years. 2012 has the highest degree of connectivity between residential neighborhoods, meaning that residential areas are often close together and have little influence on their surroundings. The density of the spatial weight matrix decreases significantly in 2016, and the matrix becomes sparser while the number of transaction neighborhoods increases, indicating that the distance between neighborhoods increases. Simultaneously, when the distance between influential cells rises, the impact between influential cells dramatically increases. By 2020, additional trading properties will arise, reducing the distance between residential neighborhoods while increasing their influence on one another. Because the spatial weight matrix directly affects the final GWR regression coefficients, variations in the density and range of spatial weights have a noticeable effect on the spatial heterogeneity of each variable’s impacts coefficients.
Results
Comparison of GWR and OLS
Despite OLS results being influenced by spatial dependence, it provides preliminary evidence of the impacts on housing prices. Table 3 shows the OLS results for the 3 years with the mean results of the GWR regression for the same year to comparison. From OLS, it can be seen that the coefficient estimates of each variable are generally consistent with the sign we expect when designing the variables. The effects of access to structural variables, neighborhood support, and central location on house prices are significant and similar to the results of other studies. We are primarily concerned with the estimated values and trends of NA variables.
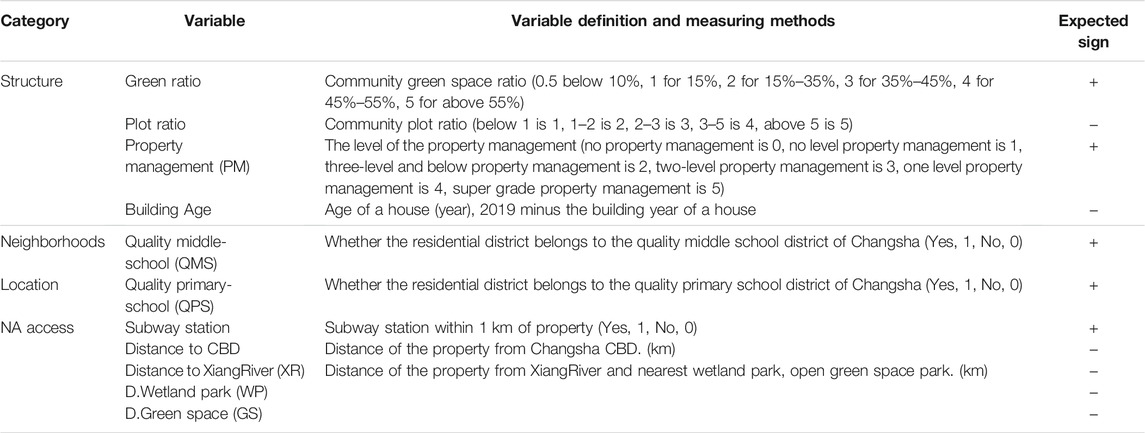
TABLE 3. Variables of residential price differentiation in Changsha.
Among the many structural factors influencing a property’s pricing, the green ratio has a long-term and growing impact. The house price can rise by 3.61% in 2012 and 4.38% in 2020 for each level increase in the green ratio. Moreover, the GWR’s estimate rate is increased even faster, from 3.04% in 2012 to 4.55% in 2020. Evidence shows that the requirements for nature amenities within a community of home buyers in Changsha have increased rapidly in the last decade.
The influence of proximity to WP, XR and GS on housing price have progressively risen, with varying rates from OLS. XR had the most significant effect on housing prices in 2012 of all NA. Each additional kilometer of distance resulted in a 3.45% decline in housing values. At the time, wetlands had a coefficient of 1.17%, while green spaces had a coefficient of 1.98%. In 2016, XR effect coefficient climbed slightly to 3.65%, but wetlands and green spaces influence on values increased more rapidly, by 1.76%t and 2.67%, respectively. WP have the most excellent effect on values in 2020, with a coefficient of 3.34%, followed by XR and GS, with coefficients of 4.08 and 3.28%, respectively. GWR mean results of wetland, XR and green spaces have the same trend, from 2012 at 1.24, 2.34, and 2.75–3.65, 5.32, and 3.72% in 2020, respectively. The increased capitalization of the three forms of NA accessibility also shows the growing awareness of residents toward the natural environment and green recreational opportunities in the immediate vicinity. Simultaneously, the mean GWR values for all three accessibility factors are higher than OLS coefficients, indicating that the sample variables are more susceptible to the effect of housing prices.
With respect to other key variables, the capitalization effects follow a different trend. CBD still determines housing prices significantly, although this influence is gradually diminishing. Each kilometer away from the CBD Wuyi square influenced 6.91% of samples’ housing prices in 2012, compared with 5.82 and 4.61% in 2016 and 2020. In GWR mean view, the results are at 8.41, 8.15, and 6.26% during the same time. The structure of Changsha city is rapidly changing, as evidenced by the fact that housing prices are decreasingly dependent on the accessibility of the city’s core. A dispersed polycentric pattern has emerged as significant NA around housing and residency are accumulating in other locations outside the core area. Neighborhood characteristics such as metro and educational institutions also have an effect on housing prices. Due to the shortage of educational facilities in China’s main cities, property ownership has become a popular market-based method of acquiring high-quality schools. Accordingly, the impact factor for quality middle schools in Changsha with GWR has increased from 3.24 to 5.72%. The metro is a major transportation route in modern China, often increasing the value of surrounding real estate. In Changsha, this impact on property prices is from 3.78% in 2012 to 4.24% in 2020. The rest variable estimates are shown with Table 4.
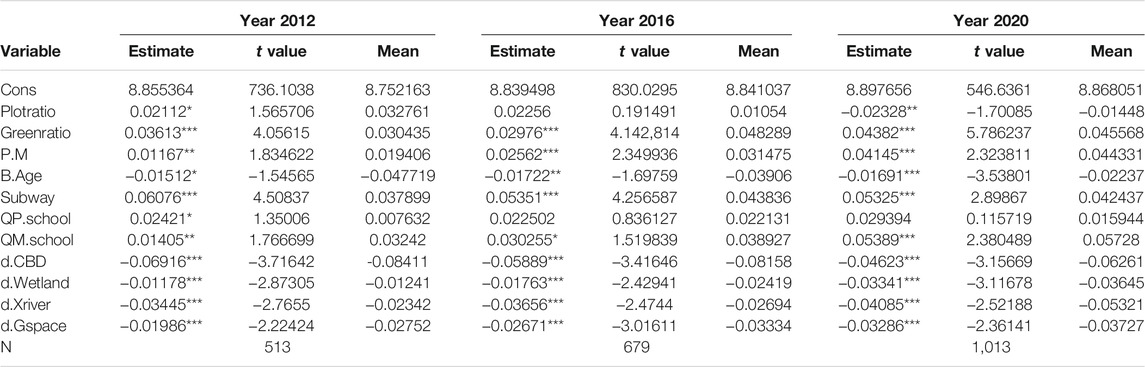
TABLE 4. 2012, 2016, 2020 Global regression results and GWR mean results.
It was easily found that statistic test values of GWR were higher for all 3 years after accounting for the spatial heterogeneity variables, indicating the advantage of GWR more suitable to deal with spatial heterogeneity. As shown in Table 5, while the R2 values of all models have fallen over time, indicating that the variables impacting housing prices are becoming more complicated. However, comparing the OLS model with the GWR model, we can see that the fitted value of GWR is much better than that of OLS, and the residual squares and standard deviations of GWR are significantly lower than those of OLS. Therefore, the GWR model fitting effect is superior to the general OLS regression effect, making it a suitable approach for analyzing the evolution of the spatial structure of residential pricing in Changsha and the evolution of heterogeneity of crucial factors.
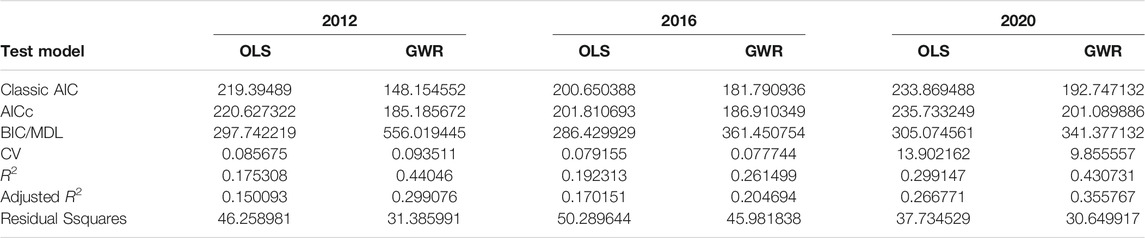
TABLE 5. Comparison test parameters of OLS model and GWR model for 2012, 2016, 2020.
The Spatial Change of Estimates
The spatial distribution of the estimated coefficients for the years 2012, 2016 and 2020 are compared to show the trend of variables. Since we focus on NA, the variables XR, WP, GS and green ratio are the main objects to study. Simultaneously, due to the accessibility to the CBD being the primary factor impacting the urban structure, we also analyze this variable. To facilitate comparison, we group the coefficient values into five average quantiles, each one covering a 20% interval in order, from the lowest to the highest.
The distribution of GWR estimate value of CBD variable is shown in Figure 5. The distance between the house sample and Changsha’s CBD Wuyi Square has a negative effect on the housing prices. In terms of the spatial and temporal evolution of the coefficient values, their spatial distribution changes more noticeably and exhibits a trend throughout the three cross-sectional years. In 2012, the CBD variable had a high value in the north of Changsha’s urban core area, notably along the XiangRiver’s north coast and in the central section of Kaifu District, with a coefficient value of lower than −29% per km. The area of a strong influence of CBD variable in 2012 is relatively small, while the impact value is large. In 2016, the high-value area of CBD expanded into the center of the city, including a part of Yuhua and Tianxin districts, the northern part of Yuelu district. Although the area has expanded, the impact values have decreased, with the value is greater than −20% per km. In 2020, the CBD high-value area was mainly around Wuyi CBD and Changsha south region, while the northern part of the city, west of XR, is less severely affected. In general, the high-value region of the CBD variable expands and then contracts, progressively shifting the impact area from the north-central to the southern section of Changsha city. This change indicates that as the overall size of the city grows and polycentric structure emerges, the correlation between CBD accessibility, as an indicator, and housing prices tends to decline. The diminishing influence of the CBD on price while the increasing impact of NA accessibility on price is a sample of the evolution toward polycentric city structure. It could be implied that the development of NA is one of the driving forces in the evolution of the urban spatial structure of Changsha.
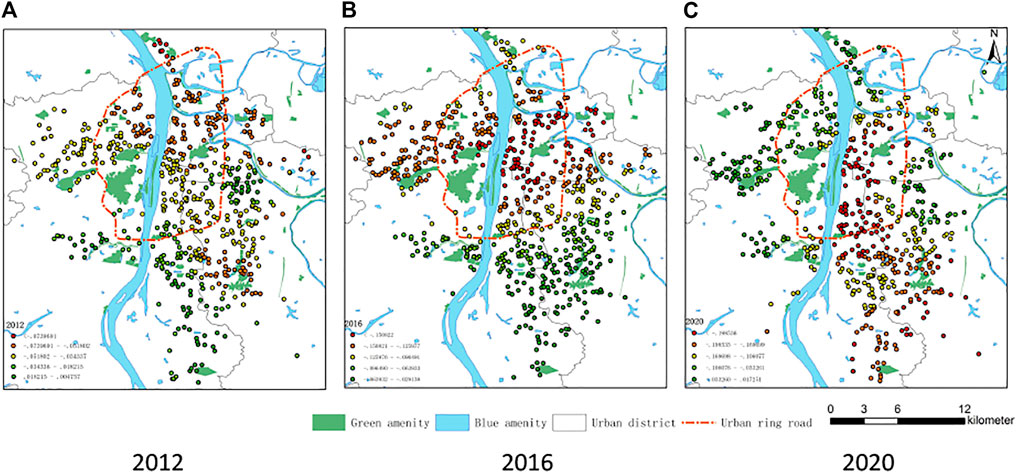
FIGURE 5. Spatial and temporal variation of CBD influence coefficients in 2012, 2016 and 2020.
The distribution of GWR estimate value of WP is shown in Figure 6. With the rapid development of wetlands amenities in Changsha, an increasing number of people are choosing to locate homes close to them, attracting more housing development with high-density. Therefore, the capitalization effect of NA on housing price increases as market develops, and this effect reflects spatial heterogeneity over time. In 2012, the high values for the variable area of wetlands were mainly in the southern part of core city, with the high value of the local capitalization coefficient being between 3 and 7%.In 2016, the range of WP’s high impacts changed to the east of the city, and the coefficient topped 12%, higher than in 2012. House prices in Changsha increased sharply from 2017 to 2020, with the extreme value of the coefficient exceeding 20% from 2020, much higher than in 2016. During this period, several well-known wetlands in Yuelu District, such as Meixi Lake and Yanghu Lake, were highly sought after by homebuyers and became a rallying point for high-priced houses, so the influence of blue on surrounding house prices increased significantly. The area of coefficient extremes is concentrated in Meixi Lake, Yanghu Lake, and the city’s east, outside the core urban area, which may imply that homebuyers are increasingly attracted to fringe blue space. Nonetheless, Yuelu district as a significant urban ecological region in Changsha has been enhanced, affecting housing prices.
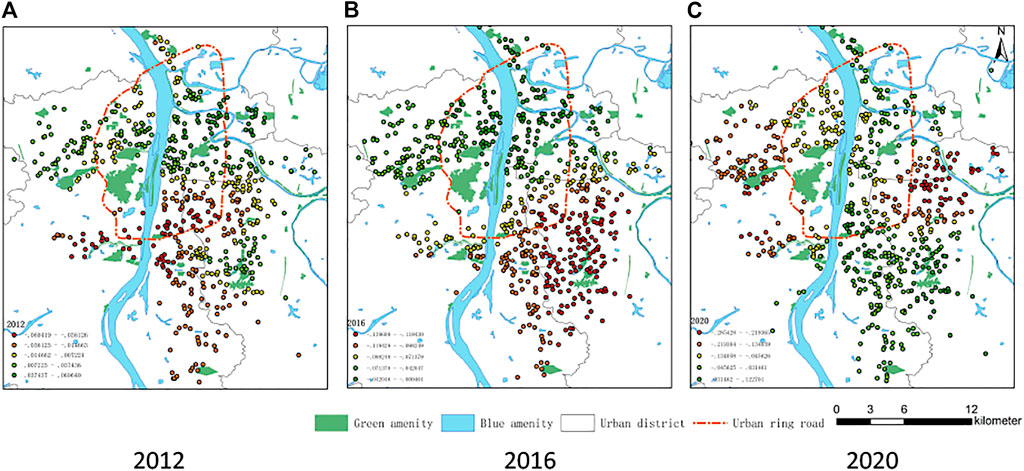
FIGURE 6. Spatial and temporal variation of WP influenced coefficients in 2012, 2016 and 2020.
XR is the traditional center of Changsha’s natural landscape, and its accessibility has a significant impact on housing prices. The spatial heterogeneity variation of this effect was found via GWR during times, as shown by Figure 7. In 2012, the main impact high value area of the variable radiated is the southern area of Yuelu District outside the western ring road, with the highest coefficient value over −20%. During this period, Yanghu New Town has been gradually developed, and its main high-end properties are located along XR, which is typical of river-view buildings. At this time, on the east bank of the river, lots of older houses with poorer scenic, which are not as sensitive to distance to this river as high-end river view houses. Only few new buildings high-rise residences along the riverbank that are more affected by the landscape of XR in this region. In 2016, the high value area spread further to the east of the river and south of the city as it expanded southward with the construction of a large number of high-rise residential buildings. The concentration of high-system value properties in the southern region increased significantly, but the impact high-value diminish to about −15%.
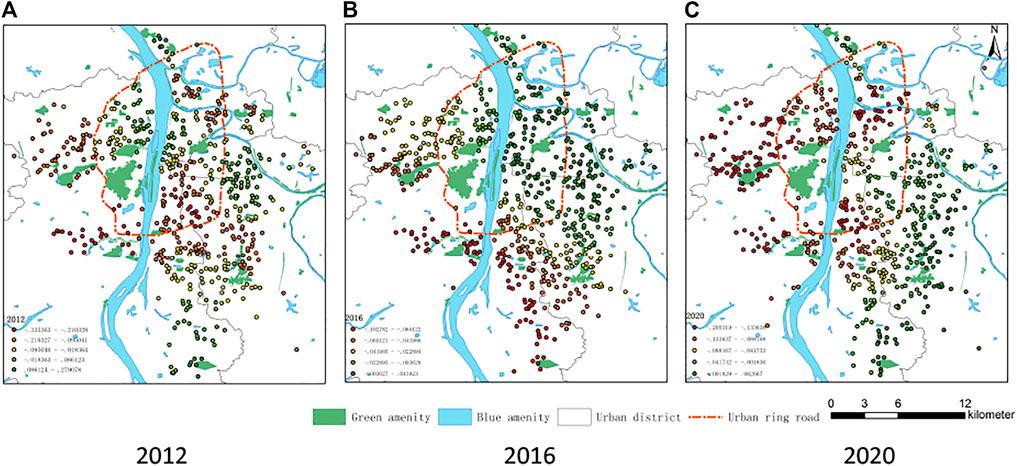
FIGURE 7. Spatial and temporal variation of XR influence coefficients in 2012, 2016 and 2020.
In 2020, the extreme value further decreased to about −10%. With the rise of a new residential area on the north side of the west bank of XiangRiver and the development of areas across the river, the high-value area of the access variables is further expanded. Overall, the residential neighborhoods whose house prices are affected by XR accessibility variable are more robust in the west of the river than in the east, and there is a higher density. Despite residential samples in the newly developed area being more affected by XiangRiver, the regression coefficients of the 3 years have decayed, indicating that the real influence of this accessibility variable has weakened.
The green ratio is an important NA within a community, and it has a profound impact on the housing price of the community. This impact also has very obvious temporal and spatial differentiation as shown in Figure 8. In 2012, the extreme impact area of greening rate on house price was mainly distributed in the core area within the east ring road of the city as well the south city area, with the high value range between 5 and 6%.Most of the development areas of good quality properties in this period were located along with XR in the core of the city, which affected the degree of community greening. Simultaneously, there is a tendency that the surrounding NA on the east ring road is lower than in west, making property purchasers more sensitive to the NA inside community. 2016, high-value area expanded to the west bank of XR and the east part of Changsha, while the impact of the south city was significantly declined. In 2020, the number of properties covered by the high-value affection in east XR was significantly reduced. The high-value areas are mainly concentrated in several large residential groups of Meixi, Yanghu Lake and north region, with a decreasing distribution pattern of coefficient values from north to south. The average value of the estimated coefficient for those 3 years has increased gradually, which is maintained between 6 and 10%.
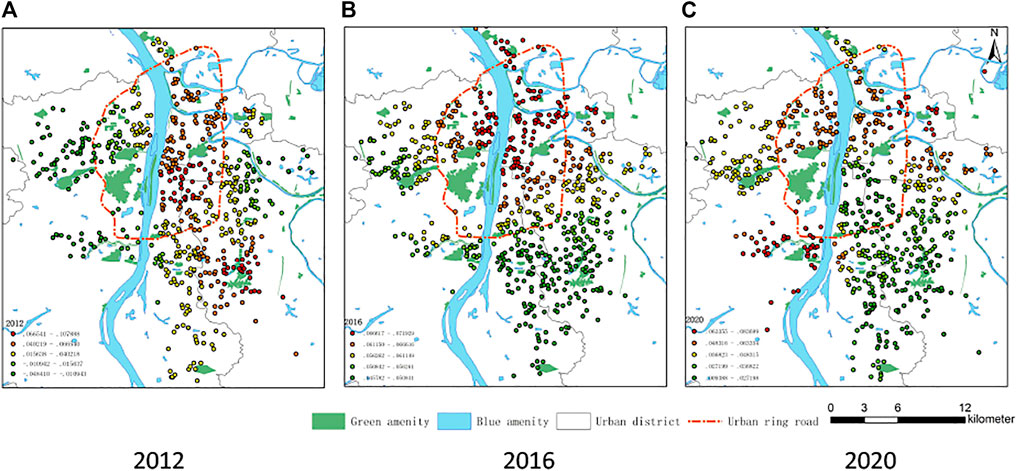
FIGURE 8. Spatial and temporal variation of green ratio influence coefficients in 2012,2016 and 2020.
As shown in Figure 9, the impact of green space on residential prices is broadly distributed in urban Changsha, and the high value has a propensity to increase over time, rising from −5% in 2012 to −10% in 2020. The highest value of this impact tends to increase over time, rising from -5% in 2012 to more than -10% in 2020. There is a clear pattern in the spatial heterogeneity of green space, with the stable impact high-value residential areas located within the ring road and the Yanghu and south city districts. The core urban areas within the ring road and the south city area have fewer open green space resources, so homebuyers demand green space more, and their WTP is more robust. The Yanghu area is an ecological new city that Changsha started to focus on developing in 2012 in which the people who settle themselves have higher expectations of the natural landscape, so they also have a strong tendency to pay a premium. With the gradual development of the Yanghu wetland park, the influence of green space on housing prices is increasing.
FIGURE 9. Spatial and temporal variation of GS influence coefficients in 2012, 2016 and 2020.
The Range of Key Variables Value
The estimated values of the estimated coefficients of the five variables in 2012 fluctuate widely. As shown in Figure 10, the variable with the most fluctuating coefficient value in 2012 is wetland, with values ranging from −10% to −5%. During this period, effect of WP is unstable, since many wetlands are still under construction and development, which could not provide corresponding ecosystem service. The green ratio is the variable with the most stat station in the value of all coefficients. All samples’ variables positively affect the housing price with the range between 2 and 5%. The coefficient value of the accessibility variables of the XR is basically below 0. Concerning the most significant impact value, most of which are between −5% and −10%. In 2012, most of the estimated value of green space accessibility decreased with distance decay, however, at a relatively low level. Meanwhile, the coefficient of CBD is between −2% and −10%, and the value of WP between 2% and −11%.
FIGURE 10. Key coefficients divergence in 2012.
The divergence in the range of coefficient changes increased in 2016, with the heterogeneity of some variables reduced while others increased, as shown in Figure 11. The impact range of the green ratio was narrowed to between 5 and 7%, which was significantly reduced compared to 2012. The remaining accessibility variables coefficients are maintained negative. Among these, the CBD’s effect on price increases dramatically, with a range of −5% to −15%. China’s urban real estate boom in 2016 has seen investment fever rise in many major cities. The CBD is preferred for residential property purchases due to its easy rent-ability and higher premiums, highlighting this investment interest. Meanwhile, homebuyer interest in XR has decreased, with the range of its accessible variable shrinking to 0 to −5%. The changes in the coefficients of the above two variables reveal that there seems to be a negative relationship between the accessibility of the natural landscape center and the location center in Changsha. The interest of homebuyers in wetland remains at a high level, with primary samples value in the interval ranging from −5% to −10%. The fluctuations in the values of green space were reduced in 2016, between 0 and −5%.
FIGURE 11. Key coefficients divergence in 2016.
As shown in Figure 12, the fluctuation range of green ratio in 2020 widens between 10 and 2%. CBD is a vital impact factor, with a value range is between 0 and −15%. The price elasticity of XR accessibility variable rises, with a value range between −5% and −15% for most samples. XiangRiver is still a critical landscape factor for homebuyers in Changsha. WP is becoming increasingly essential due to its multiple ecosystem service functions and the necessary natural landscape amenities that homebuyers consider. The 2020 sample values also reflect the growth in importance of wetland with an average accessibility impact factor of over −5%. Similarly, the influence of GS on house prices is increasing further but is still smaller than XR and WP, with a value range mainly between 0 and 8%.
FIGURE 12. Key coefficients divergence in 2020.
In general, the temporal-spatial changing trend of NA variables estimates values follows the rule of “center-fringe” expand pattern of urban sprawl process. With the change in the scale of urban land and the breakup of the dual structure between urban and rural areas (Li C. et al., 2019; Yang L. et al., 2019), urban expansion is accelerating and the trend of NA spatial with temporal changes is more obvious. Meanwhile, industry agglomeration and spatial clustering in an urban area also speed up the process of urban sprawl (Li et al., 2020), which may also affect the NA influencing spatial pattern.
Conclusion and Recommendations
By employing the GWR model and using quality housing data of Changsha, this study found the capitalization effects temporal-spatially varying across different kinds of NA. The main results are as follows.
First, all NA factors had affected housing prices increasingly in Changsha. The green ratio has a significant positive influence, increasing from 3.04% in 2012 to 4.55% in 2020. In 2012, the estimated price decline effects were 2.34, 1.24 and 2.75%, due to each kilometer away from XR, nearest WP and GS respectively. While in 2020, the attenuation coefficients concerning housing prices are increased to 5.32, 3.64 and 3.72% per kilometer. Compare with the test parameter of two methods, GWR with variables metrics outperforms than the OLS models, which provides new insights into.
Moreover, GWR then further specifies the spatial heterogeneity of the capitalization effect of NA variables on property in Changsha. During 2012–2020, the distribution of houses whose prices are affected heavily by the accessibility of XR, has moved from the east to the west of the city. At the same time, property that highly affected by WP shifted from the south to the east and west of the city. Concerning GS, in 2012, the impact of green space accessibility was concentrated in southeast Changsha. By 2020, this impact has turned to the southwest of the city. Unlike other NA variables, the green ratio of a neighborhood is an internal indicator that can directly affect the quality of living standards of residents. The highly affected residential area of the green ratio generally spread from the urban core to the fringe areas.
Besides, the range of fluctuation of the impact coefficient for different residential samples varies with time. The impact of green ratio is relatively stable at 3–5%, while other factors are more extensive than it. Nevertheless, the fluctuation range of NA is gradually decreasing and stabilizing, which implies that homebuyers are converging on the importance of landscape resources. With the improvement of living standards, NA has become one of the most important factors for residential locating. Urban managers are emphasizing landscape planning in residential areas to improve the quality of habitat.
Our study has figured out a new characteristic of the housing market in China’s emerging metropolitan areas, which is that accessibility to NA is outpacing traditional city centers. Based on these results, we propose the following recommendations.
1) Urban planners should take environmental justice more seriously during the planning process. NA gradually evolves into a scarce commodity rather than a public good and captures the wealth with high affordability, which reconstitutes the community socio-economic atmosphere adjacent. The gap to access and use NA has widened between different income group residents across urban China. Income segregation could become severe that leading to unequal accessibility to natural spaces across neighborhoods. The planning model of many mega-cities that natural resources are heavily concentrated in only a few large parks should be adjusted. City managers should emphasize embedded community nature amenities so that every housing unit will finally be located within about 500 m of a park or an open space. According to the high usage efficiency of small natural spaces, this is a valid way to enhance environmental justice.
2) It is necessary to enhance the transportation facilities, especially those surrounding the fundamental nature landscape of a city. An excellent public transport network will lift the using frequency of NA. Subway facilities enhancement is critical for transport optimization, as more subway lines and interchange stations can dramatically advance the environmental justice process.
3) Residential development around famous NA landscape needs to be further restricted. The accessibility and visibility of the landscape is essential contribution for all residents. While developers often prefer to construct high-density and height properties surrounding famous NA like XiangRiver to maximize their profits, leading to a natural resource monopoly. Therefore, the policy should shift to carry out a stricter height or density building restriction.
Data Availability Statement
The original contributions presented in the study are included in the article/Supplementary Material, further inquiries can be directed to the corresponding authors.
Author Contributions
Conceptualization, methodology, software, and writing: HT and HQ; OY acquired the data, analyzed and interpreted the data for the work.
Funding
This research was funded by the Major Program of National Social Science Foundation of China (18ZDAA040) and Natural Science Foundation of Hunan Province (2021JJ40015) and Research Foundation of Education Bureau of Hunan Province (21A0591).
Conflict of Interest
The authors declare that the research was conducted in the absence of any commercial or financial relationships that could be construed as a potential conflict of interest.
Publisher’s Note
All claims expressed in this article are solely those of the authors and do not necessarily represent those of their affiliated organizations, or those of the publisher, the editors, and the reviewers. Any product that may be evaluated in this article, or claim that may be made by its manufacturer, is not guaranteed or endorsed by the publisher.
References
Alix-Garcia, J., Schneider, A., and Zhao, N. (2014). Playing Favorites: Tax Incentives and Urban Growth in China 1978-2010[J]. Land Econ. 92 (1), 1–27. doi:10.3368/le.92.1.1
Anderson, S. T., and West, S. E. (2006). Open Space, Residential Property Values, and Spatial Context. Reg. Sci. Urban Econ. 36 (6), 773–789. doi:10.1016/j.regsciurbeco.2006.03.007
Anselin, L. (2003). Spatial Externalities, Spatial Multipliers, and Spatial Econometrics. Int. Reg. Sci. Rev. 26 (2), 153–166. doi:10.1177/0160017602250972
Bin, O., and Polasky, S. (2004). Effects of Flood Hazards on Property Values: Evidence before and after Hurricane Floyd. Land Econ. 80, 490–500. doi:10.2307/3655805
Brander, L. M., and Koetse, M. J. (2011). The Value of Urban Open Space: Meta-Analyses of Contingent Valuation and Hedonic Pricing Results. J. Environ. Manage. 92 (10), 2763–2773. doi:10.1016/j.jenvman.2011.06.019
Conway, D., Li, C. Q., Wolch, J., Kahle, C., and Jerrett, M. (2010). A Spatial Autocorrelation Approach for Examining the Effects of Urban Greenspace on Residential Property Values. J. Real Estate Finan Econ. 41 (2), 150–169. doi:10.1007/s11146-008-9159-6
Czembrowski, P., and Kronenberg, J. (2016). Hedonic Pricing and Different Urban green Space Types and Sizes: Insights into the Discussion on Valuing Ecosystem Services. Landscape Urban Plann. 146, 11–19. doi:10.1016/j.landurbplan.2015.10.005
De Vries, S., van Dillen, S. M. E., Groenewegen, P. P., and Spreeuwenberg, P. (2013). Streetscape Greenery and Health: Stress, Social Cohesion and Physical Activity as Mediators. Soc. Sci. Med. 94, 26–33. doi:10.1016/j.socscimed.2013.06.030
De Vries, S., Verheij, R. A., Groenewegen, P. P., and Spreeuwenberg, P. (2003). Natural Environments-Healthy Environments? an Exploratory Analysis of the Relationship between Greenspace and Health. Environ. Plan. A. 35 (10), 1717–1731. doi:10.1068/a35111
Ebru, Ç., and Eban, A. (2011). Determinants of House Prices in Istanbul: A Quantile Regression Approach. Qual. Quant 45 (2), 305–317. doi:10.1007/s11135-009-9296-x
Fotheringham, A. S., Charlton, M. E., and Brunsdon, C. (1998). Geographically Weighted Regression: A Natural Evolution of the Expansion Method for Spatial Data Analysis. Environ. Plan. A. 30, 1905–1927. doi:10.1068/a301905
Garrett, J. K., White, M. P., Huang, J., Ng, S., Hui, Z., Leung, C., et al. (2019). Urban Blue Space and Health and Wellbeing in Hong Kong: Results from a Survey of Older Adults. Health & Place 55, 100–110. doi:10.1016/j.healthplace.2018.11.003
Gascon, M., Triguero-Mas, M., Martínez, D., Dadvand, P., Forns, J., Plasència, A., et al. (2015). Mental Health Benefits of Long-Term Exposure to Residential Green and Blue Spaces: A Systematic Review. Ijerph 12 (4), 4354–4379. doi:10.3390/ijerph120404354
Gómez-Baggethun, E., and Barton, D. N. (2013). Classifying and Valuing Ecosystem Services for Urban Planning. Ecol. Econ. 86, 235–245. doi:10.1016/j.ecolecon.2012.08.019
He, B.-J., Zhao, D., Xiong, K., Qi, J., Ulpiani, G., Pignatta, G., et al. (2021). A Framework for Addressing Urban Heat Challenges and Associated Adaptive Behavior by the Public and the Issue of Willingness to Pay for Heat Resilient Infrastructure in Chongqing, China. Sustain. Cities Soc. 75, 103361. doi:10.1016/j.scs.2021.103361
Hu, S., Yang, S., Li, W., Zhang, C., and Xu, F. (2016). Spatially Non-stationary Relationships between Urban Residential Land price and Impact Factors in Wuhan City, China. Appl. Geogr. 68, 48–56. doi:10.1016/j.apgeog.2016.01.006
Irwin, E. G. (2002). The Effects of Open Space on Residential Property Values. Land Econ. 78 (4), 465–480. doi:10.2307/3146847
Jim, C. Y., and Chen, W. Y. (2006). Impacts of Urban Environmental Elements on Residential Housing Prices in Guangzhou (China). Landscape Urban Plann. 78 (4), 422–434. doi:10.1016/j.landurbplan.2005.12.003
Kelejian, H. H., and Prucha, I. R. (1999). A Generalized Moments Estimator for the Autoregressive Parameter in a Spatial Model. Int. Econ. Rev. 40 (2), 509–533. doi:10.1111/1468-2354.00027
Larson, E. K., and Perrings, C. (2013). The Value of Water-Related Amenities in an Arid City: The Case of the Phoenix Metropolitan Area. Landscape Urban Plann. 109 (1), 45–55. doi:10.1016/j.landurbplan.2012.10.008
LeSage, J. P., and Pace, R. K. (2004). Models for Spatially Dependent Missing Data. J. Real Estate Finance Econ. 29 (2), 233–254. doi:10.1023/b:real.0000035312.82241.e4
Li, C., Gao, X., Wu, J., and Wu, K. (2019b). Demand Prediction and Regulation Zoning of Urban-Industrial Land: Evidence from Beijing-Tianjin-Hebei Urban Agglomeration, China. Environ. Monit. Assess. 191 (7), 412. doi:10.1007/s10661-019-7547-4
Li, C., Wu, K., and Gao, X. (2020). Manufacturing Industry Agglomeration and Spatial Clustering: Evidence from Hebei Province, China. Environ. Dev. Sustain. 22 (4), 2941–2965. doi:10.1007/s10668-019-00328-1
Li, H., Wei, Y. D., Wu, Y., and Tian, G. (2019a). Analyzing Housing Prices in Shanghai with Open Data: Amenity, Accessibility and Urban Structure. Cities 91, 165–179. doi:10.1016/j.cities.2018.11.016
Liao, W.-C., and Wang, X. (2012). Hedonic House Prices and Spatial Quantile Regression. J. Housing Econ. 21 (1), 16–27. doi:10.1016/j.jhe.2011.11.001
Mak, S., Choy, L., and Ho, W. (2010). Quantile Regression Estimates of Hong Kong Real Estate Prices. Urban Stud. 47 (11), 2461–2472. doi:10.1177/0042098009359032
Mei, Y., Sohngen, B., and Babb, T. (2018). Valuing Urban Wetland Quality with Hedonic price Model. Ecol. Indicators 84, 535–545. doi:10.1016/j.ecolind.2017.09.022
Rajapaksa, D., Wilson, C., Hoang, V.-N., Lee, B., and Managi, S. (2017). Who Responds More to Environmental Amenities and Dis-Amenities? Land Use Policy 62, 151–158. doi:10.1016/j.landusepol.2016.12.029
Sander, H. A., and Zhao, C. (2015). Urban green and Blue: Who Values what and where? Land Use Policy 42, 194–209. doi:10.1016/j.landusepol.2014.07.021
Schläpfer, F., Waltert, F., Segura, L., and Kienast, F. (2015). Valuation of Landscape Amenities: a Hedonic Pricing Analysis of Housing Rents in Urban, Suburban and Periurban. Landscape Urban Plann. 141, 24. doi:10.1016/j.landurbplan.2015.04.007
Shanggang, Y., Weixuan, S., Zhifei, M., Zaijun, L., and Qiyan, W. (2018). Spatial Differentiation and Influencing Factors Analysis of Housing price in Nanjing: Based on Geographically Weighted Regression Model[J]. Hum. Geogr. 33 (03), 68–77. doi:10.13959/j.issn.1003-2398.2018.03.009
Tuofu, H., Qingyun, H., Dongxiao, Y., and Xiao, O. (2021). Evaluating the Impact of Urban Blue Space Accessibility on Housing Price: A Spatial Quantile Regression Approach Applied in Changsha, China. Front. Environ. Sci. 9, 696626. doi:10.3389/fenvs.2021.696626
Van Herzele, A., and de Vries, S. (2012). Linking green Space to Health: a Comparative Study of Two Urban Neighbourhoods in Ghent, Belgium. Popul. Environ. 34, 171–193. doi:10.1007/s11111-011-0153-1
Voelker, S., and Kistemann, T. (2015). Developing the Urban Blue: Comparative Health Responses to Blue and green Urban Open Spaces in Germany. Health & Place 35, 196–205. doi:10.1016/j.healthplace.2014.10.015
Wen, H., Bu, X., and Qin, Z. (2014). Spatial Effect of lake Landscape on Housing price: A Case Study of the West Lake in Hangzhou, China. Habitat Int. 44, 31–40. doi:10.1016/j.habitatint.2014.05.001
Wheeler, B. W., Lovell, R., Higgins, S. L., White, M. P., Alcock, I., Osborne, N. J., et al. (2015). Beyond Greenspace: An Ecological Study of Population General Health and Indicators of Natural Environment Type and Quality. Int. J. Health Geogr. 14 (1), 17. doi:10.1186/s12942-015-0009-5
Wu, P.-I., Chen, Y., and Liou, J.-L. (2020). Housing Property along Riverbanks in Taipei, Taiwan: A Spatial Quantile Modelling of Landscape Benefits and Flooding Losses. Environ. Dev. Sustainability 23 (2), 2404–2438. doi:10.1007/s10668-020-00680-7
Xu, L., You, H., Li, D., and Yu, K. (2016). Urban green Spaces, Their Spatial Pattern, and Ecosystem Service Value: The Case of Beijing. Habitat Int. 56, 84–95. doi:10.1016/j.habitatint.2016.04.005
Yang, J., Guo, A., Li, Y., Zhang, Y., and Li, X. (2019a). Simulation of Landscape Spatial Layout Evolution in Rural-Urban Fringe Areas: A Case Study of Ganjingzi District. GIScience & Remote Sensing 56 (3), 388–405. doi:10.1080/15481603.2018.1533680
Yang, J., Yang, R., Chen, M.-H., Su, C.-H., and Zhi, J. (2021). Effects of Rural Revitalization on Rural Tourism. J. Hospitality Tourism Manag. 47, 35–45. doi:10.1016/j.jhtm.2021.02.008
Yang, L., Chau, K. W., Szeto, W. Y., Cui, X., and Wang, X. (2020a). Accessibility to Transit, by Transit, and Property Prices: Spatially Varying Relationships. Transportation Res. D: Transport Environ. 85, 102387. doi:10.1016/j.trd.2020.102387
Yang, L., Chu, X., Gou, Z., Yang, H., Lu, Y., and Huang, W. (2020b). Accessibility and Proximity Effects of Bus Rapid Transit on Housing Prices: Heterogeneity across price Quantiles and Space. J. Transport Geogr. 88, 102850. doi:10.1016/j.jtrangeo.2020.102850
Yang, L., Zhou, J., Shyr, O. F., and Huo, D. (2019b). Does Bus Accessibility Affect Property Prices? Cities 84, 56–65. doi:10.1016/j.cities.2018.07.005
Yibo, Q. (2020). Evolution, Characteristics, and Direction of China's Urbanization since the Reform and Opening up: From the Perspectives of Population,Economy,And Institution[J]. Urban Plann. 44 (01), 44–51.
Yu, D., Wei, Y. D., and Wu, C. (2007). Modeling Spatial Dimensions of Housing Prices in Milwaukee, WI. Environ. Plann. B Plann. Des. 34 (6), 1085–1102. doi:10.1068/b32119
Yuan, F., Wu, J., Wei, Y. D., and Wang, L. (2018). Policy Change, Amenity, and Spatiotemporal Dynamics of Housing Prices in Nanjing, China. Land Use Policy 75, 225–236. doi:10.1016/j.landusepol.2018.03.045
Yue, X., Hui, E. C. M., and Wen, H. (2019). “Effects of Floor Level and Landscape Proximity on Housing Price: A Hedonic Analysis in Hangzhou, China.”. Habitat Int. 87, 11–26. doi:10.1016/j.habitatint.2019.03.008
Zhang, L., Zhou, T., and Mao, C. (2019). Does the Difference in Urban Public Facility Allocation Cause Spatial Inequality in Housing Prices? Evidence from Chongqing, China. Sustainability 11 (21), 6096. doi:10.3390/su11216096
Zhao, D., Arshad, M., Wang, J., and Triantafilis, J. (2021). Soil Exchangeable Cations Estimation Using Vis-NIR Spectroscopy in Different Depths: Effects of Multiple Calibration Models and Spiking. Comput. Electro. Agric. 182, 105990. doi:10.1016/j.compag.2021.105990
Keywords: natural amenities, hedonic theory, GWR, spatial expansion, Changsha city
Citation: Tuofu H, Qingyun H and Xiao O (2022) The Capitalization Effect of Natural Amenities on Housing Price in Urban China: New Evidence From Changsha. Front. Environ. Sci. 10:833831. doi: 10.3389/fenvs.2022.833831
Received: 12 December 2021; Accepted: 03 February 2022;
Published: 28 February 2022.
Edited by:
Bao-Jie He, Chongqing University, ChinaReviewed by:
Junsong Wang, South China University of Technology, ChinaJun Yang, Northeastern University, China
Copyright © 2022 Tuofu, Qingyun and Xiao. This is an open-access article distributed under the terms of the Creative Commons Attribution License (CC BY). The use, distribution or reproduction in other forums is permitted, provided the original author(s) and the copyright owner(s) are credited and that the original publication in this journal is cited, in accordance with accepted academic practice. No use, distribution or reproduction is permitted which does not comply with these terms.
*Correspondence: He Qingyun, aGVxaW5neXVuMTg0OEBnbWFpbC5jb20=; Ouyang Xiao, eGlhby5vdXlhbmdAZm94bWFpbC5jb20=