 Yiqiang Huang1,2†
 Yucheng Shen1†
 Shouzhi Zhang2Yang Li1,2Zeyu Sun1Mingming Feng1Rui Li1Jin Zhang1Xue Tian1
 Wenguang Zhang2*
- 1Jilin Provincial Joint Key Laboratory of Changbai Mountain Wetland and Ecology and CAS Key Laboratory of Wetland Ecology and Environment, Northeast Institute of Geography and Agroecology, Chinese Academy of Sciences, Changchun, China
- 2School of Geography and Marine Sciences, Yanbian University, Yanji, China
In recent years, lakes’ water quality and quantity have been affected and damaged by agricultural activities. The sensitivity of phytoplankton to the hydrological environment can effectively indicate the health of the aquatic ecosystem and the change in water quality. Understanding the changes of phytoplankton communities in lakes contaminated by agriculture may contribute to determining the directions of protection of these water bodies and provide reference cases for wider research. It is found that there are 146 species, 63 genera, and 8 phyla of phytoplankton, including 57 species of Bacillariophyta, 46 species of Chlorophyta, 17 species of Cyanobacteria and Euglenophyta. The total abundance was changed successively with Bacillariophyta (75% in June), Cyanobacteria (50% in July–August), and Chlorophyta (75% in September–October). The total biomass decreased continuously over time. The biomass of Chlorophyta is highest in October (67.4%), and diatoms contribute the most biomass in other months (76.5%). The Redundancy analysis indicated that the main environmental factors affecting phytoplankton’s dynamic change are total salt, water temperature, total phosphorus, and 5-day biochemical oxygen demand. The phytoplankton can be divided into 21 functional groups. The MP group has the highest frequency, mainly distributed in the frequently stirred and turbid shallow water. Representative functional groups indicate the high degree of eutrophication and nutrient-rich conditions and the good associated environment for phytoplankton and slow water flow rate. With the seasonal change of agricultural irrigation and drainage, the water quality of Xinmiao Lake began to deteriorate from medium pollution in July and reached serious pollution in October finally. Furthermore, this research discovered that the risk of cyanobacteria bloom is high in summer, primarily when thermal stratification occurs. This study provides necessary information for understanding and predicting the changes of the phytoplankton community caused by the increase of nutrients, human disturbance, and temperature conditions in eutrophic lakes in agricultural areas.
Introduction
Phytoplankton is regarded as one of the essential indicators of water environment because of its temporal and spatial distribution of community structure characteristics such as abundance, biomass and diversity (Kruk et al., 2010; Reynolds, 2012; Visser et al., 2016). Environmental conditions can also directly or indirectly affect the community structure of phytoplankton (Whitton, 2012). Therefore, monitoring phytoplankton community structure and diversity has become an essential water ecosystem health and water quality evaluation (Sabater et al., 2008; Nunes et al., 2018). It is feasible to predict and explain various models of phytoplankton through environmental factors. Previous studies have proved that the change characteristics of phytoplankton structure are closely related to hydrological conditions, and nitrate concentration (Negro et al., 2000), and also have a good coupling relationship with chemical oxygen demand (COD) and particulate organic matter (POM) (Lee and Kang, 2010). Similarly, it is common to use phytoplankton to indicate water quality. Reynolds first designed the phytoplankton classification system according to the classification method of plants and summarized 31 functional groups (Reynolds, 1980; Reynolds, 1984). Salmaso et al. proposed the division method of ecological functional group (MFG), and divided phytoplankton into 31 mfg groups (Salmaso and Padisák, 2007). Padisak et al. summarized 40 groups according to the sensitivity and tolerance of phytoplankton, which promoted the wide application of this method (Padisak et al., 2009). Phytoplankton pollution biological index can quantitatively analyze the state of water pollution (Chen et al., 2021). Furthermore, the phytoplankton diversity index (Spellerberg and peter, 2003), dominance index (Ignatiades, 2020), algae comprehensive index (Yang and Liu, 2020), and phytoplankton biological integrity index (Zhu et al., 2021)is commonly used to quantify the ecological status of lakes, rivers, and reservoirs in water pollution monitoring and evaluation. Therefore, understanding the relative impact of natural and artificial processes on hydrological and biochemical functions through phytoplankton diversity is essential for improving water resources management (Arab et al., 2019).
Due to the increase in agricultural production demand, the wetland ecosystem in the area faces environmental pressure, such as agricultural pollutants and water supply. The pollution from agriculture is more difficult to control than other point source pollution because of its dispersion diversity and regional (Wurtsbaugh et al., 2019). Under the current climate and human influence, agricultural reclamation increases the bioavailable P and N entering the wetland waters with increased rainfall intensity related to climate change (Glibert and Burford, 2017). High nutrient loads can promote the production of organic matter. Then the decomposition and release of regenerated ammonium in sediments provide a favorable environment for the growth of Cyanobacteria in summer (Newell et al., 2019). The consequent environmental risks (such as eutrophication and harmful water bloom outbreak) will further lead to the loss and degradation of wetlands (Mao et al., 2018). Due to the rapid economic development and population growth in recent years, many lakes in the world have been seriously eutrophized, such as the shallow agricultural lakes in the lower Mississippi River Basin (Henderson et al., 2021) in the United States (Henderson et al., 2021), Winnipeg Lake in Canada (Bunting et al., 2016), Greifensee in Switzerland (Niel et al., 2012) and 50 lakes in Western and northwest Ireland (Touzet, 2011), and the excessive investment of N and P in agricultural activities is one of the main reasons. Under these premises, it is imperative to strengthen wetland assessment, monitoring, and restoration through the comprehensive integration of human activities and climate change processes. Many scientists in China have paid more attention to the changes in phytoplankton structure in eutrophic lakes. However, most of these studies focus on the Yangtze River Basin in the subtropical region, such as Tai Lake (Paerl et al., 2011; Liu et al., 2021), Poyang Lake (Wu et al., 2013). Continental climate lakes in high latitudes, such as inland lakes in Northeast China, rarely study the coupling between phytoplankton and environmental factors. Under expanding agricultural production, lakes in these areas are prone to eutrophication. It is becoming more and more essential to study the changes of phytoplankton community structure to improve water quality assessment. The water environment of Xinmiao Lake has faced severe ecological and environmental problems such as agricultural non-point source pollution, salinization, and organic pollution (Dai and Tian, 2011), which provides a good research example. Because phytoplankton and environmental factors have high temporal and spatial heterogeneity, their relationship is usually complex and difficult to explain. For example, what factors in the lake (such as nutrition, light, temperature, etc.) regulate algae growth. Specifically, this work is devoted to clarify the correlation between phytoplankton and environmental factors in the lake adjacent to agriculture area and confirm the indicative function of the phytoplankton community on water quality.
Material and Method
Research Area
Xinmiao Lake is a typical wetland ecosystem composed of lakes, swamps, swampy meadows, and other ecosystems, with shallow lakes as the core. It is located in 124°26′E–124°31′E, 45°8′30″N–45°13′30″N, belongs to a continental monsoon semi-arid climate with an area of 31 km2, average water depth of 1.5 m, water storage about 6.5 × 10⁷ m3, and pH about 8.5 (Liu et al., 2020), which belongs to Chagan Lake National Nature Reserve in Jilin Province (Figure 1A). It is the front lake of Chagan Lake and plays an essential role in buffering and regulating about 2.3 × 10² km2 irrigation backwater from the surrounding paddy fields (Yao et al., 2010; Guo, 2012). The soil in the lake basin is alkaline, and the total salt (TS) is mainly sodium carbonate and sodium bicarbonate, so the saline-alkali soda wetland is formed (Liu et al., 2020). Affected by suspended mineral and section particles, Xinmiao Lake has a high content of suspended sediments (Guo et al., 2020). Affected by water particles, the light conditions in water droplets are poor and the transparency is low (Li et al., 2016). The winter of Xinmiao lake is from October to May, and the light is the strongest in July and August (Zhang et al., 2016). With the expansion of the Qianguo agricultural area, the contents of TN, TP (total phosphorus), TS, and alkali entering the lake will significantly increase the risk of eutrophication and water bloom (Chen et al., 2015).
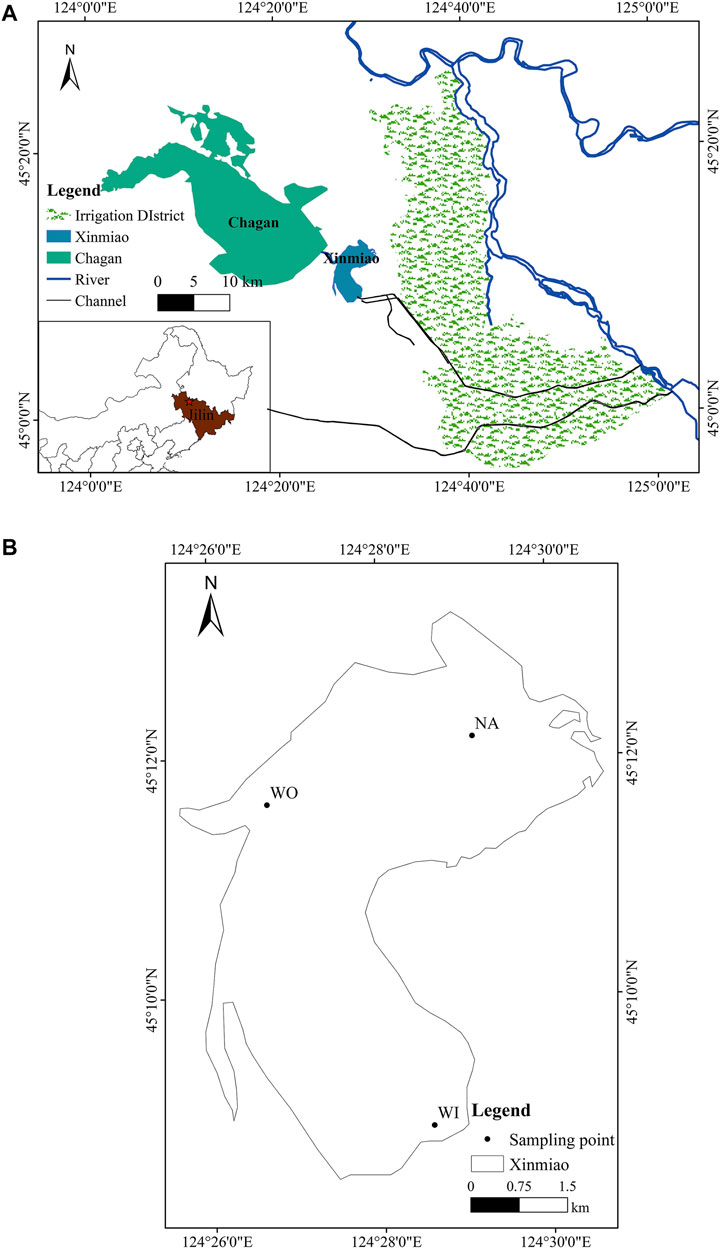
FIGURE 1. Schematic diagram of sampling points. Panels show the geographical location of XinmiaoLake (A) and the specific layout of sampling points (B).
Sample Collection
According to the natural morphological characteristics of Xinmiao Lake and the standard of sampling point setting (Tnno et al., 2021), sampling points are arranged at the inlet, outlet, and the northern area of Xinmiao Lake (abbreviated as WI, WO, NA) (Figure 1B). Both WI and NA grow reed and Potamogeton crispus L. There are almost no aquatic plants in WO. The water depth of the three sample points is the same, with an annual average of 1.5 m. The samples were taken once a month, from June to October 2020.
In terms of water environment parameter measurement, water temperature (WT) and pH are measured on-site by YSI portable multiparameter analyzer. After acid and low-temperature preservation, water samples were taken back to the analysis and testing centre of Northeast Institute of geography and Agroecology, Chinese Academy of Sciences. According to the methods for detection and analysis of water and wastewater (Fourth Edition), total nitrogen (TN), TP, total potassium (TK), TS, Dichromate Oxidizability (CODCr), and 5-day Biochemical Oxygen Demand (BOD5) were measured.
When the water depth was less than 2 m, the water sample was taken at 0.5 m underwater. When the water depth was 2 ∼ 5 m, another water sample was taken at 0.5 m from the bottom. Qualitative samples of phytoplankton were collected by plankton net 25 (aperture 64) µ m), after concentrating to 100ml, immobilizing them with 1–2 ml of Luger iodine solution. After standing for 48 h, they were concentrated to 30 ml for microscopic examination (Olympus CX21, 400×). Quantitative samples of phytoplankton were collected by a water collector. After precipitation for 48 h, it was concentrated to 50 ml with a siphon, and 4% formaldehyde solution was added for storage. Finally, 100 view fields were counted twice and the average value was taken. The abundance of phytoplankton was calculated by an optical microscope (Utermöhl, 1958). Meanwhile, the biomass of phytoplankton was estimated by biological volume (Hillebrand et al., 2010). The identification of phytoplankton species is based on “The Phytoplankton Manual” recommended by UNESCO (Sournia, 1978) and “Freshwater Algae in China-System, Classification and Ecology” (Hu and Wei, 2006).
Data Processing and Analysis
To determine the diversity of the phytoplankton community, the diversity indicators used in this study include phytoplankton dominance (
The abundance and biomass information of dominant phytoplankton species were analyzed by detrended correspondence analysis (DCA). The sorting axis gradient length (LGA) was 5.0 and 6.7, respectively, high than 4.0. It is suitable to use canonical correspondence analysis (CCA) based on linearity (Zhao et al., 2014). Environmental factors include WT, TN, TP, CODcr and BOD, and the Monte Carlo permutation test (p < 0.05) is conducted first. The phytoplankton species and codes used in CCA analysis are shown in Table 2.
Result
Water Environment
The water temperature first increases and then decreases with the season. The highest was 27.28 in July and the lowest was 9.22 in October (Table 1). From June to October, the contents of TS increased continuously from 219.17 mg L−1–363.33 mg L−1. BOD5 was the highest in July (6.78 mg L−1), and there was no significant difference in other periods, to vary between 2.51 mg L−1 and 3.61 mg L−1. The seasonal fluctuation of CODCr is apparent. The peak occurred in June (28.32 mg L−1) and August (29.12 mg L−1), which means many were reducing substances in the water body, mainly organic pollutants. The contents of TN and TP increased at first and then decreased finally. They reached the highest in August (TN: 1.61 mg L−1 and TP: 0.12 mg L−1), and the lowest in October (TN: 0.54 mg L−1 and TP: 0.07 mg L−1). TK content decreased continuously from 4.07 mg L−1–3.14 mg L−1.
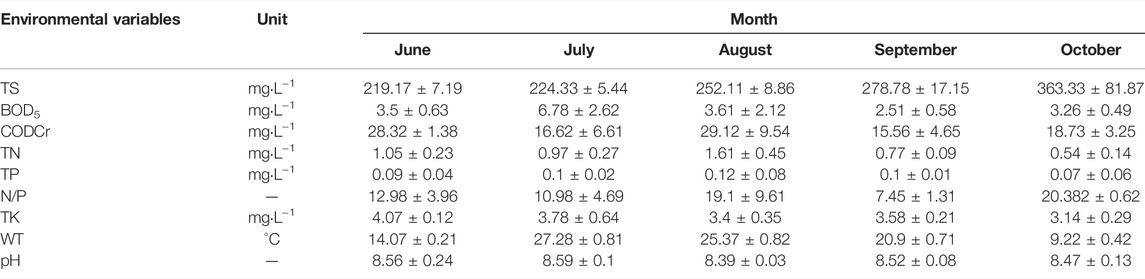
TABLE 1. Environmental factors in Xinmiao Lake during the investigation period.
Seasonal Dynamics of Phytoplankton Composition
A total of 146 species (including varieties, modification, and undetermined species) belonging to 63 genera and 8 phyla of planktonic algae were identified. Bacillariophyta (57 species) and Chlorophyta (46 species) were the most abundant, accounting for 39.04 and 31.51% of the total species, respectively Cyanobacteria (Figure 2). Bacillariophyta has the largest number of species (Figure 3A), while Chlorophyta has the largest number of genera (Figure 3B).
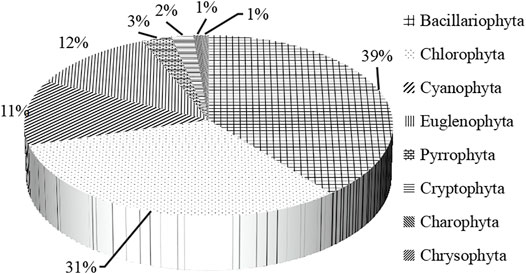
FIGURE 2. Species composition of phytoplankton.
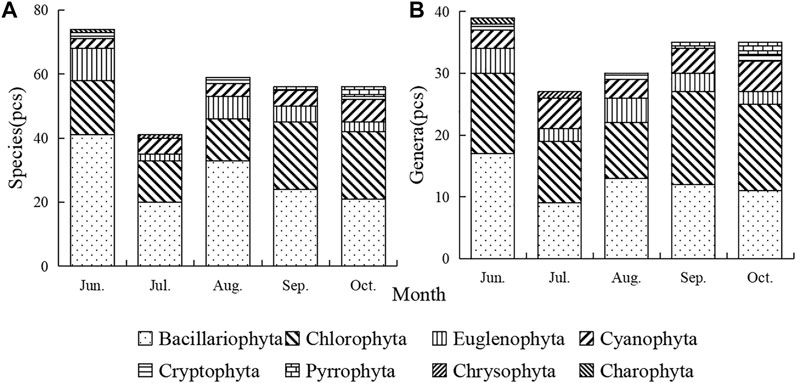
FIGURE 3. Temporal variation of phytoplankton species (A) and genera (B).
The total phytoplankton abundance rose to the highest in August (1.94 × 10⁷ ind./L) and decreased to a minimum in October (5.93 × 10⁶ ind./L) (Figure 4A). The abundance was changed successively with Bacillariophyta (about 75% in June), Cyanobacteria (about 50% in July–August), and Chlorophyta (about 75% in September–October). Phytoplankton biomass continued to decline from 17.7 mg/L to 4.4 mg/L (Figure 4B). The total phytoplankton biomass from 17.7 mg/L continuously decreased to 4.4 mg/L (Figure 4B). Bacillariophyta accounts for the most, followed by Cyanobacteria and Chlorophyta, and other algae account for a relatively small proportion.
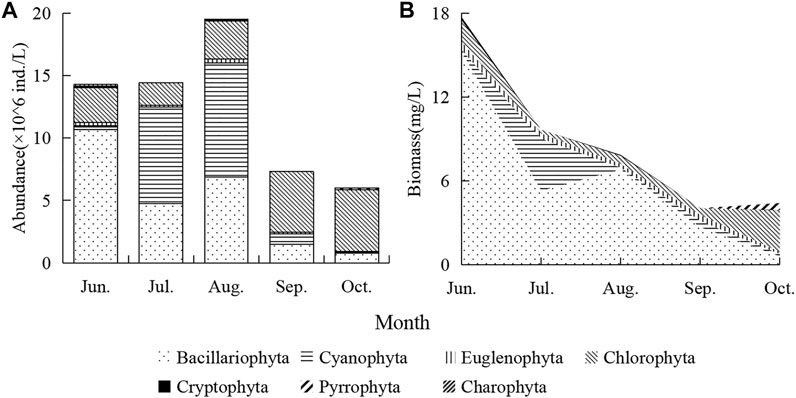
FIGURE 4. Temporal changes of phytoplankton abundance (A) and biomass (B).
19 dominant phytoplankton species belonged to 13 genera and 3 phyla were identified during the research. Among them, there were 8 species of Chlorophyta, seven species of Bacillariophyta, and four species of Cyanobacteria (Table 2). Chlorophyta dominated in September and October. The dominant species of Bacillariophyta mostly appeared in June. Cyanobacteria took up the advantages part in July and August. The algae with the highest dominance were Chlamydomonas globosa, Achnanthes minutissima, Merismopedia minima, and reach 0.247, 0.188, 0.311, respectively. Nitzschia acicularis from diatom can serve as the dominant species for the longest time, lasting 4 months. Scenedesmus quadricauda and Ankistodesmus angustus follow Chlorophyta, lasting 3 months. Other species occur only once or twice.
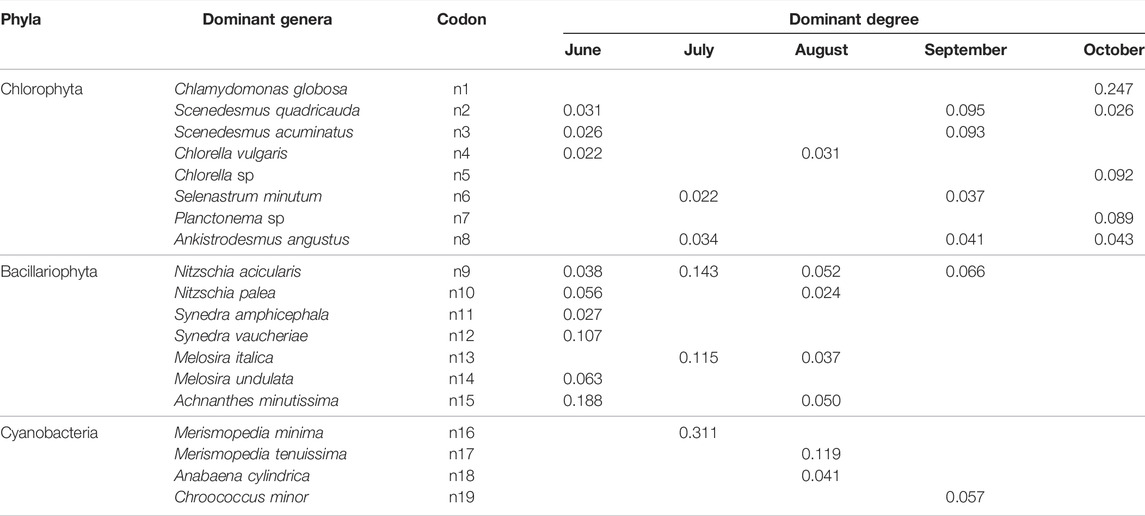
TABLE 2. List of dominant phytoplankton species in Xinmiao Lake.
The species-environment correlation coefficients of the first two axes of phytoplankton abundance and biomass ranking axis are high, which explain 41.06 and 41.95% of the cumulative percentage variation of species-environment relationship, respectively (Table 3), indicating that the species composition of phytoplankton in Xinmiao Lake is closely related to environmental factors. The environmental factors affecting the abundance of dominant species were mainly TS, WT and TP (Figure 5A), the main factors affecting the biomass of dominant species were TS, TP and BOD5 (Figure 5B).

TABLE 3. Statistical information of CCA analysis of phytoplankton community.
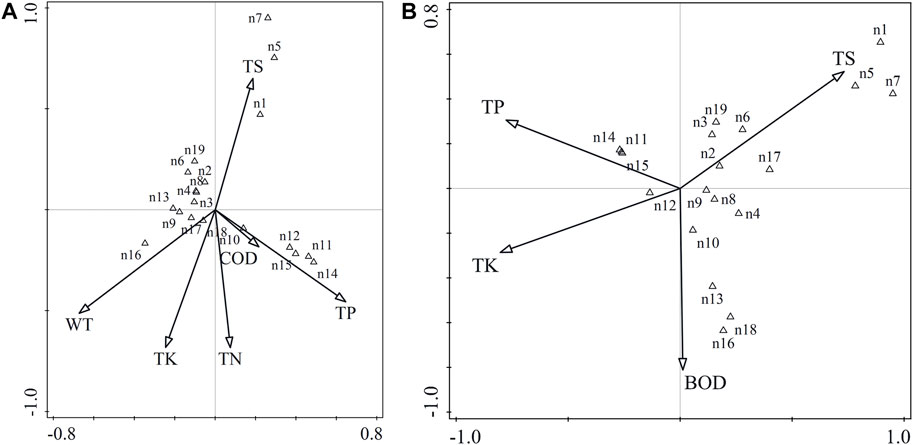
FIGURE 5. Correlation plots of the redundancy analysis (CCA) on the relationship between the environment variables and dominant species of phytoplankton. Panels show CCA between the environment variables and abundance (A), biomass (B).In this figure, the black arrow represents the environment variable, and the arrow points to the direction in which the value of the environment variable increases most sharply. The angle between the arrows indicates the correlation between the various environment variables. The black triangle represents species, and the distance between symbols is similar to the relative abundance distribution of these species in the sample measured by chi-square distance. Adjacent points correspond to species that often occur at the same time. The species symbol can be projected vertically onto the line above the arrow of a specific environmental variable. These forecasts are made according to the predicted growth order of the best value of the prediction variables.
Spatial-Temporal Dynamics of Phytoplankton Diversity and Functional Groups
The biodiversity index reflects the low pollution of water quality in June and the highest pollution in October. NA has the lowest pollution, and WO is slightly higher than WI. (Table 4). In addition, the Shannon and Pielou indexes at WI did not fluctuate violently, with the mean values of 2.11 and 0.55, respectively, and the Margalef index reached the lowest of 0.47 in September. The Shannon indices and Pielou indices of NA were the highest in June and July, reaching 3.22 and 0.67 respectively. The Margalef index fluctuated sharply, with a difference of 2.11 between the highest and lowest. However, the biodiversity trend of WO was bimodal. The Shannon and Pielou indexes were the highest in June, 2.62 and 0.63, respectively. The Margalef index peaked at 1.63 in August. The biodiversity evaluation showed that the pollution was the lowest in June and the heaviest in October and generally belonged to medium pollution.
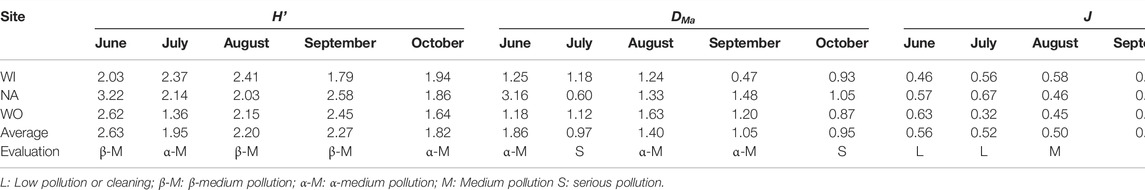
TABLE 4. Distribution of phytoplankton diversity index in Xinmiao Lake wetland.
The phytoplankton is divided into 21 groups (Table 5), and 12 groups with relative biomass greater than 10% are defined as representative functional groups (Reynolds et al., 2002; Padisák et al., 2009) (Figure 6). The species and frequency of the MP group in the whole year are the highest. At WI, the dominant relative abundances from June to October were MP (28.5%), D (34.8%), B (30.4%), J (42.1%), and X2 (41.5%). Furthermore, biomass transited from B, D, MP (about 30%) in summer to X2 (50.8%) in autumn. And the relative abundance advantage of Na changed from X1 (about 15% in summer) and MP (28.5% in Aug.) to X2 (52.7% in Oct.). Moreover, The group with the highest biomass contribution changed from TC and W2 (33.6%, and 42.1% in July) to X2 and W1 (58.7%, and 18.1% in September). The dominant groups change from Lo (64.6% in July) to J (48.4 %in September) was found in WO, and MP has contributed more than 16% of the biomass. Changes in functional group abundance and biomass are usually related, but mismatches are still found. For example, TC and W2 with less abundance contributed most of the biomass at NA, while the abundance of Lo and J with a high proportion at WO had little effect on the relative biomass.
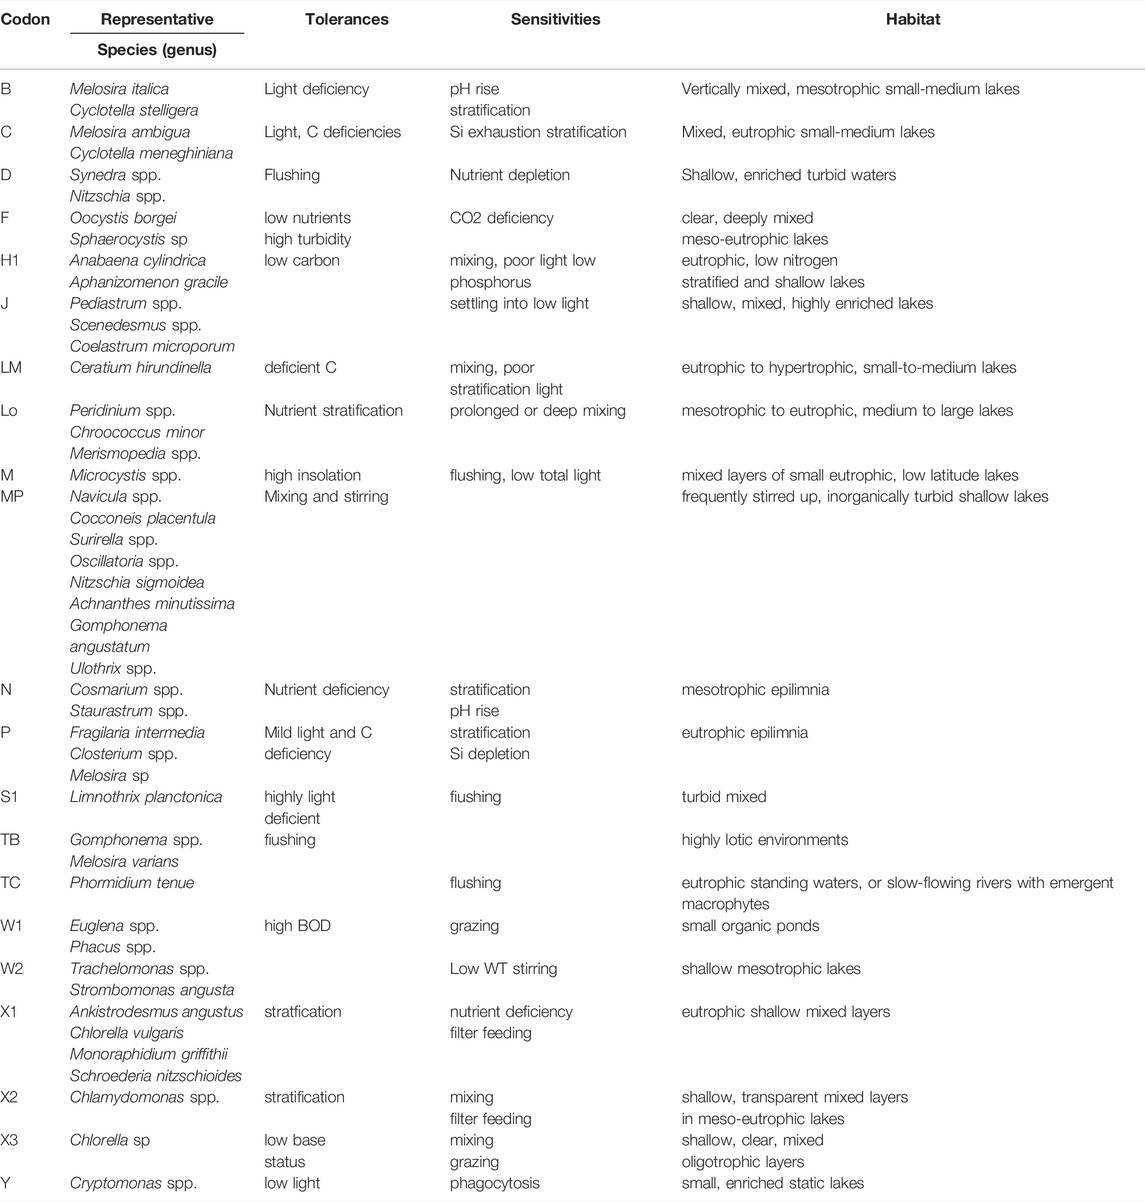
TABLE 5. Main identification characteristics and representative species of Xinmiao Lake functional group during the survey period.
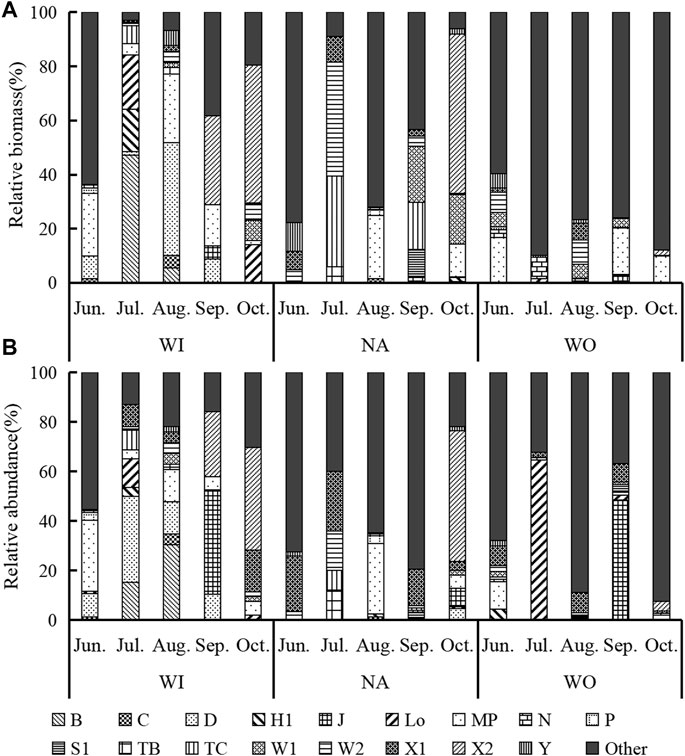
FIGURE 6. Relative biomass (A) and relative abundance (B) of phytoplankton functional groups.
Discussion
Key Factors Affecting Phytoplankton Dynamics
In order to determine the seasonal pattern of water environment, it is necessary to take into account the seasonal changes of rainfall and water temperature and the impact of agricultural activities. Agricultural activities will affect the time and intensity of water supply, thus affecting the transparency, light and nutrition level of lakes (Miao et al., 2011; Michalak et al., 2013; Liu et al., 2021). There is sufficient research proving that water temperature significantly impacts the abundance of plankton (Ho et al., 2019). CCA showed that water temperature significantly affected phytoplankton abundance but could not clearly explain the change of biomass (Figure 6). Cyanobacteria and Chlorophyta are suitable for growing in warm water, while diatoms are mostly cold-water species (Zhang Y et al., 2019). This study supports that diatom reproduction rapidly and advanced in spring with low water temperature. The Cyanobacteria will take up the advantages part in July and August because the Merismopedia minima, Merismopedia tenuissima, and Anabaena cylindrical will be high in terms of thermal stability to their DNA, protein synthesis systems, and photosynthetic systems. Therefore, it can adapt to high temperatures, and the optimal temperature is 25–35 °C (Lurling et al., 2013). The average water temperature from July to August in Xinmiao Lake is 26.33°C, suitable for the growth of Cyanobacteria. Although the abundance of Cyanobacteria was high in August, the biomass was low for the small cell size (Tian et al., 2016). The temperature changes not only directly affect the species composition of phytoplankton, but also affect the metabolism of heterotrophs (Taucher and Oschlies, 2011). Therefore, warming can control the community structure of phytoplankton from top to bottom by improving the grazing efficiency of consumption by herbivores (Winder and Sommer, 2012). The zooplankton in Xinmiao lake are mainly Rotifers and Sarcodina. These herbivores preferentially prey on small phytoplankton (Weithoff et al., 2000; Gomes et al., 2019; Sun et al., 2021). Therefore the balance change of Chlorophyta dominance from September to October may mainly be attributed to reduced competitive pressure from diatom and Cyanobacteria and higher resistance to grazing losses (Goldyn and Kowalczewska-Madura, 2008; Nolan and Cardinale, 2019). This study’s algae seasonal replacement model is similar to the Chagan Lake, the same type of lake (Li et al., 2014).
Depth reduces light availability by affecting the absorption and refraction of suspended solids and algae (Vadeboncoeur et al., 2008). High turbidity can limit light penetration into sediments, so limited light availability is usually controlled by water depth and transparency (Iachetti and Llames, 2015). The transparency of Xinmiao Lake is controlled by sediment resuspension under the influence of hydrodynamic forces. The water depth of this type of shallow turbid lake can determine light availability. In addition, the peak of algae biomass in spring is mainly due to the availability of nutrients and high light (Thamatrakoln, 2021). Meanwhile, the enormous growth of submerged plants shows that there is no photoinhibition at least before autumn. Light has no significant effect on the relative proportion of dominant species, but it can effectively change the total biomass of phytoplankton (Llames et al., 2009). The reduction of light energy input limits the net primary productivity. The loss of algae cannot be fully supplemented (Anneville et al., 2017), reducing algae biomass to an absolute minimum in winter.
In addition to the physical environment, such as water temperature and light, the steady-state phytoplankton assembly is also affected by nutrient levels and biological interactions (Rojo and Álvarez-Cobelas, 2003). TN and TP are the primary nutrients of agricultural non-point source pollution, which can affect the growth of phytoplankton in the process of lake evolution (Zhang et al., 2018). Due to the accumulation of a large number of phosphorus resources in sediment, the response of the lake ecosystem may be disturbed. The importance of N and P varies with N: P ratios in the lake, and the total biomass of phytoplankton will be strongly affected by the least supplied nutrients (Dolman et al., 2016). There is a significant positive correlation between phytoplankton and TP (Figure 5) and a complex relationship with TN. This shows that Xinmiao lake is a nitrogen-limited lake, which is also proved by nitrogen-fixing cyanobacteria in the phytoplankton community. Besides, Melosiraitalica of Bacillariophyta, Merismopedia minima, and Anabaena cylindrica of Cyanobacteria had a significant positive correlation with BOD5. Rainwater and irrigation backwater injected into the lake will receive a large number of particles, nutrients, and organic matter, which constitutes a typical feature under the influence of agriculture (Taylor et al., 2019). There is a seasonal pattern of material import: it starts in mid-May and peaks in mid-August. This model shows that it will be more effective to implement best management practices in warm summer (Lizotte et al., 2014).
Indication of Phytoplankton Functional Groups and Diversity on Water Quality
The change of phytoplankton species richness is usually the result of species extinction or invasion. In contrast, the change of biodiversity and evenness is usually related to species dominance (Hillebrand et al., 2008). Phytoplankton biodiversity is affected by different developmental stages or habitat differences of the community (Bandeira et al., 2013), so the water’s biophysical and biochemical quality will directly affect the biodiversity of the lake waters. In this study, the WI sampling site is surrounded by farmland, the rapid changes of nutrient input and physical water state weaken the stability of the phytoplankton community structure, and WO is mainly disturbed by human activities in nearby scenic spots so that the phytoplankton biodiversity is low. On the contrary, the stable water environment of NA provides better development conditions for phytoplankton community. In the early stage of phytoplankton community construction, the frequent fluctuation of the environment interfered with the competition, so the population was mainly restricted by environmental factors (Barraquand et al., 2018). The increase of nutrient level and illumination time in June satisfied the growth of phytoplankton and increased the diversity. In winter, the interference from agricultural activities almost disappeared, and the rainfall and backwater decreased, resulting in a slow flow rate. At this time, the ecological niche is separated due to competition, and competitors are inhibited by dominant species (such as Chlorophyta in this research), which reduces the diversity to the lowest level (Tilman et al., 1982). The results of the water quality evaluation based on the diversity index show that the water pollution degree of Xinmiao Lake is the lowest in June and the most serious in October. A large number of reeds grow in Xinmiao Lake (Zhang, 2015), its developed roots are more likely to produce an oxidizing environment in the water, to promote nitrification, accelerate the absorption of NO3−, NH4+, PO43- plasma in water and sediments, consequently, purify nitrogen and phosphorus pollution in paddy field irrigation backwater (Li et al., 2021). However, the purification capacity of the lake is limited, especially in the peak season of agricultural irrigation, when a large amount of N and P enter the lake with irrigation backwater. The nutrition of lakes is further risen, which increases the risk of eutrophication.
The temporal and spatial changes of dominant phytoplankton species in water can be well described by using the functional group classification method, and it can also better evaluate the response of phytoplankton to environmental changes (Salmaso et al., 2015). During the survey period, the functional group MP dominated by Bacillariophyta occupied an absolute advantage. This is due to the low transparency of Xinmiao lake and the easily mixed water body. The decrease in water transparency shows lake eutrophication (Dodds, 2006). Oscillatoria spp. from the MP group is often found on the sludge surface with rich organic matter or in shallow water ponds, consistent with the environmental characteristics of swamps and wetlands of Xinmiao Lake. Cocconeis placentula is often attached to submerged plants (Jahn et al., 2009) and may rely more on the Potamogeton crispus Linn. in Xinmiao Lake. In July, the representative functional groups of WI are B, H1 and LO. Because WI is a small and medium-sized shallow water body, and between mesotrophic to eutrophic, which is suitable for the growth of Melosiraitalica, Anabaena cylindrica and Merismopedia spp. The appearance of cyanobacteria H1 shows that the lake has a trend of thermal stratification. The representative functional groups of NA are TC and W2, because the environment of NA is mesotrophic to eutrophic, shallow water with a slow flow, and there are a large number of reeds, which are suitable for the growth of Phormidium tenue, Trachelomonas spp. and Strombomonas angusta. The D-functional group appeared on WI in August, reflecting its rich nutrient content and turbid water body. In September and October, X2, dominated by Chlamydomonas spp, is the main functional group. It grows in shallow water from mesotrophic to eutrophic, with less affected by stratification, and it is sensitive to water mixing and filtration (Raven et al., 2011), indicating that there is a low degree of stratification in the water body during this period. In addition, W1 (mainly includes Euglena spp. and Phacus spp.) at this time is dependent on the increase of BOD5 (Gani et al., 2017) which is mainly due to decomposed submerged plant in early autumn (Lin et al., 2018). Overall, the representative functional groups of phytoplankton reflect Xinmiao Lake’s high degree of eutrophication and nutrient content, slow water flow rate and low grazing pressure.
Risk Prediction of Cyanobacteria Bloom
Merismopedia sp. and Anabaena sp, which are dominant in summer, will produce water bloom under the condition of mass reproduction (Poot-Delgado et al., 2018). Nitrogen consumption is conducive to the reproduction of nitrogen-fixing algae Anabaena sp, and some species contain toxic substances (Chislock et al., 2014; Akagha et al., 2020). When the TP concentration exceeds 10 μg/L, the growth of Chlorophyta is primarily affected by physical factors, especially the stability of the water body (Steinberg and Hartmann, 2010). It has been proved that the increase of the stability of the water body, especially the surface water body, can better meet the hydrodynamic conditions for the occurrence of Cyanobacteria bloom (Zhang S et al., 2019). Moreover, the increased pH value may prolong this process in summer and prevent the diatom from recovering its dominance in autumn by inhibiting the growth rate and diatom silicon deposition (Zepernick et al., 2021). The growth rate of Cyanobacteria dominated by Microcystis will increase if the concentrations of TN and TP exceed 1.5 mg L−1 and 0.1 mg L−1. Furthermore, if TN remains above 1.0 mg L−1 and TP remains above 0.08 mg L−1, it is expected to increase the risk of water bloom (Xu et al., 2017). The average value of TN and TP in Xinmiao lake is about 0.99 mg/L and 0.10 mg/L, and the pH is often close to or greater than 8.5 in summer when the WT is higher than 25 °C (Table 1). Consequently, Xinmiao Lake has the hydrochemical environment for Cyanobacteria bloom in July and August in summer. The survey results also verify this hypothesis by the rapid increase of Cyanobacteria in July and August. Therefore, controlling the input of exogenous nitrogen and phosphorus is an important measure to reduce the risk of cyanobacteria bloom. Because the chemical environment in summer is suitable for the growth of cyanobacteria, it is imperative to accurately judge the physical environment of the water body, especially the stable state. Among the representative functional groups of phytoplankton, codon B dominated by Melosira italica and Cyclotella stelligera and codon C dominated by Melosira ambigua and Cyclotella meneghiniana are sensitive to water stratification (Table 4), which can be used to judge the stable state of water body and provide early warning for the outbreak of Cyanobacteria bloom.
Conclusion
By studying the relationship between phytoplankton and water quality in the wetland in agricultural areas, it is found that the backwater from farmland irrigation has dramatically changed the environment of phytoplankton growth by transporting nutrients, organic substances, and sediment to the lake. The reduction of interference in agricultural activities increases the competitive pressure among dominant species. When environmental factors change, it can still control the phytoplankton community structure to a great extent. Xinmiao Lake is a nitrogen-limited lake. Considering the functional groups and diversity of phytoplankton, the degree of eutrophication is deepening. Due to the increase in water temperature and nitrogen and phosphorus, the risk of cyanobacteria blooming from July to August is the highest. At this time, managers should control the input of phosphorus and pay close attention to the stable state of the water body. This study improves the understanding of the seasonal pattern of phytoplankton growth and its response to changes in environmental factors. In addition, it also provides available information for the control of Cyanobacteria bloom and the management of wetland ecosystem in agricultural areas.
Data Availability Statement
The original contributions presented in the study are included in the article/Supplementary Material, further inquiries can be directed to the corresponding author.
Author Contributions
YH designed the study under the direction and leadership of WZ, who conceived the original idea. Samples were collected and pretreated by YL, JZ, and RL. YH, MF, and ZS treated the samples together and identified the phytoplankton in them. SZ coordinates the sampling work and the experimental work in the identification process. XT and YS completed the data extraction and analysis. YH and YS completed the manuscript preparation in close consultation with WZ. All authors contributed to the article and approved the submitted version.
Funding
Class A strategic leading science and technology project of Chinese Academy of Sciences “scientific and technological innovation project of black land protection and utilization”: comprehensive regulation of water quantity and quality of irrigation area wetland system based on the healthy water cycle (XDA28020502). Biodiversity Conservation and Sustainable Land Management in the SodaSaline-Alkaline Wetlands and Agro-Pastoral Landscapes in Western Jilin (GCP/CPR/048/GEF-JL).
Conflict of Interest
The authors declare that the research was conducted in the absence of any commercial or financial relationships that could be construed as a potential conflict of interest.
Publisher’s Note
All claims expressed in this article are solely those of the authors and do not necessarily represent those of their affiliated organizations, or those of the publisher, the editors, and the reviewers. Any product that may be evaluated in this article, or claim that may be made by its manufacturer, is not guaranteed or endorsed by the publisher.
Acknowledgments
We want to thank the teachers and students of many Wetland Ecosystem Management Discipline groups who have contributed to sample collection and analysis. Specifically, thank you to Xiangqin Jin, teacher of Changchun Fisheries Research Institute, Jilin Province, who plays a vital role in phytoplankton identification. We thank the management personnel of Xinmiao Lake for their indispensable role in sample collection. We would also like to thank the analysis and testing centre of Northeast Institute of geography and Agroecology, Chinese Academy of Sciences, for their professional and timely analytical services.
References
Akagha, S. C., Nwankwo, D. I., and Yin, K. (2020). Dynamics of Nutrient and Phytoplankton in Epe Lagoon, Nigeria: Possible Causes and Consequences of Reoccurring Cyanobacterial Blooms. Appl. Water Sci. 10 (5), 1–16. doi:10.1007/s13201-020-01190-7
Anneville, O., Dur, G., Rimet, F., and Souissi, S. (2017). Plasticity in Phytoplankton Annual Periodicity: an Adaptation to Long-Term Environmental Changes. Hydrobiologia 824, 121–141. doi:10.1007/s10750-017-3412-z
Arab, S., Hamil, S., Rezzaz, M. A., Chaffai, A., and Arab, A. (2019). Seasonal Variation of Water Quality and Phytoplankton Dynamics and Diversity in the Surface Water of Boukourdane Lake, Algeria. Arab J. Geosci. 12 (2), 29. doi:10.1007/s12517-018-4164-4
Bandeira, B., Jamet, J.-L., Jamet, D., and Ginoux, J.-M. (2013). Mathematical Convergences of Biodiversity Indices. Ecol. Indicators 29, 522–528. doi:10.1016/j.ecolind.2013.01.028
Barraquand, F., Picoche, C., Maurer, D., Carassou, L., and Auby, I. (2018). Coastal Phytoplankton Community Dynamics and Coexistence Driven by Intragroup Density-Dependence, Light and Hydrodynamics. Oikos 127 (12), 1834–1852. doi:10.1111/oik.05361
Bunting, L., Leavitt, P. R., Simpson, G. L., Wissel, B., Laird, K. R., Cumming, B. F., et al. (2016). Increased Variability and Sudden Ecosystem State Change in Lake Winnipeg, Canada, Caused by 20th century Agriculture. Limnol. Oceanogr. 61 (6), 2090–2107. doi:10.1002/lno.10355
Chen, M., Zeng, G., Zhang, J., Xu, P., Chen, A., and Lu, L. (2015). Global Landscape of Total Organic Carbon, Nitrogen and Phosphorus in Lake Water. Sci. Rep. 5 (1), 15043. doi:10.1038/srep15043
Chen, X. J., Li, X., and Li, J. J. (2021). Indicator Species of Phytoplankton Pollution and Water Quality Evaluation in Wuliangsuhai. Ecol. Sci. 40 (03), 231–237. doi:10.14108/j.cnki.1008-8873.2021.03.027
Chislock, M. F., Sharp, K. L., and Wilson, A. E. (2014). Cylindrospermopsis Raciborskii Dominates under Very Low and High Nitrogen-To-Phosphorus Ratios. Water Res. 49, 207–214. doi:10.1016/j.watres.2013.11.022
Dai, X., and Tian, W. (2011). Analysis and Countermeasures on Water Pollution of lake Chagan. J. Arid Land Resour. Environ. 25 (8), 179–184. doi:10.1016/S1671-2927(11)60313-1
Dodds, W. K. (2006). Eutrophication and Trophic State in Rivers and Streams. Limnol. Oceanogr. 51, 671–680. doi:10.4319/lo.2006.51.1_part_2.0671
Dolman, A. M., Mischke, U., and Wiedner, C. (2016). Lake-type-specific Seasonal Patterns of Nutrient Limitation in German Lakes, with Target Nitrogen and Phosphorus Concentrations for Good Ecological Status. Freshw. Biol. 61 (4), 444–456. doi:10.1111/fwb.12718
Gani, M. A., Alfasane, M. A., and Khondker, M. (2017). Bloom Forming Phytoplankton and Their Comparative Limnology in Wastewater Lagoons of Bangladesh. Bangladesh J. Bot. 46 (1), 43–51. https://www.researchgate.net/publication/315492914.
Glibert, P., and Burford, M. (2017). Globally Changing Nutrient Loads and Harmful Algal Blooms: Recent Advances, New Paradigms, and Continuing Challenges. Oceanog. 30 (1), 58–69. doi:10.5670/oceanog.2017.110
Goldyn, R., and Kowalczewska-Madura, K. (2008). Interactions between Phytoplankton and Zooplankton in the Hypertrophic Swarzedzkie Lake in Western Poland. J. Plankton Res. 30 (1), 33–42. doi:10.1093/plankt/fbm086
Gomes, L. F., Pereira, H. R., Gomes, A. C. A. M., Vieira, M. C., MartinsRoitman, P. R. I., Roitman, I., et al. (2019). Zooplankton Functional-Approach Studies in continental Aquatic Environments: a Systematic Review. Aquat. Ecol. 53 (2), 191–203. doi:10.1007/s10452-019-09682-8
Guo, B. (2012). Study on the Environmental Impact of Paddy Field Pesticides in Songyuan Irrigation Area on Chagan Lake. Dissertation. Graduate School of Chinese Academy of Sciences.
Guo, W., Wang, Y., Shi, J., Zhao, X., and Xie, Y. (2020). Sediment Information on Natural and Anthropogenic-Induced Change of Connected Water Systems in Chagan Lake, North China. Environ. Geochem. Health 42 (3), 795–808. doi:10.1007/s10653-019-00280-z
Henderson, K. A., Murdock, J. N., and Lizotte, R. E. (2021). Water Depth Influences Algal Distribution and Productivity in Shallow Agricultural Lakes. Ecohydrology 14. doi:10.1002/eco.2319
Hillebrand, H., Bennett, D. M., and Cadotte, M. W. (2008). Consequences of Dominance: a Review of Evenness Effects on Local and Regional Ecosystem Processes. Ecology 89 (6), 1510–1520. doi:10.1890/07-1053.1
Hillebrand, H., DürselenPollingher, C.-D., Kirschtel, D., Pollingher, U., and Zohary, T. (1999). Biovolume Calculation for Pelagic and Benthic Microalgae. J. Phycology 35 (2), 403–424. doi:10.1046/j.1529-8817.1999.3520403.x
Ho, J. C., Michalak, A. M., and Pahlevan, N. (2019). Widespread Global Increase in Intense lake Phytoplankton Blooms since the 1980s. Nature 574 (7780), 667–670. doi:10.1038/s41586-019-1648-7
Hu, H. J., and Wei, Y. X. (2006). Freshwater Algae in China -- System, Classification and Ecology. Beijing: Science Press, 334–339. Available at: http://ir.ihb.ac.cn/handle/342005/10582.
Iachetti, C. M., and Llames, M. E. (2015). Light Limitation Helps Stabilize the Phytoplankton Assemblage Steady-State in a Temperate and Highly Turbid, Hypertrophic Shallow lake (Laguna Chascomús, Argentina). Hydrobiologia 752 (1), 33–46. doi:10.1007/s10750-014-2045-8
Ignatiades, L. (2020). Taxonomic Diversity, Size-Functional Diversity, and Species Dominance Interrelations in Phytoplankton Communities: a Critical Analysis of Data Interpretation. Mar. Biodivers. 50 (4), 1–9. doi:10.1007/s12526-020-01086-4
Jahn, R., Kusber, W.-H., and Romero, O. E. (2009). Cocconeis Pediculus EHRENBERG and C. Placentula EHRENBERG Var. Placentula (Bacillariophyta): Typification and Taxonomy. Fottea 9 (2), 275–288. doi:10.5507/fot.2009.027
Kruk, C., Huszar, V. L. M., Peeters, E. T. H. M., Bonilla, S., Costa, L., Lürling, M., et al. (2010). A Morphological Classification Capturing Functional Variation in Phytoplankton. Freshw. Biol. 55 (3), 614–627. doi:10.1111/j.1365-2427.2009.02298.x
Lee, Y. S., and Kang, C.-K. (2010). Causes of COD Increases in Gwangyang Bay, South Korea. J. Environ. Monit. 12 (8), 1537–1546. doi:10.1039/c001733g
Li, Q.-W., Liang, J.-F., Zhang, X.-Y., Feng, J.-G., Song, M.-H., and Gao, J.-Q. (2021). Biochar Addition Affects Root Morphology and Nitrogen Uptake Capacity in Common Reed (Phragmites Australis). Sci. Total Environ. 766, 144381. doi:10.1016/j.scitotenv.2020.144381
Li Ranran, 李., Zhang Guangxin, 章., and Zhang Lei, 张. (2014). Multivariate Analysis of the Relations between Phytoplankton Assemblages and Environmental Factors in Chagan Lake Wetland. Acta Eco Sin 34 (10), 11. doi:10.5846/stxb201306091545
Li, S. J., Song, K. S., Zhao, Y., Mu, G. Y., Shao, T. T., and Ma, J. H. (2016). Absorption Characteristics of Particulates and CDOM in Waters of Chagan Lake and Xinlicheng Reservoir in Autumn. Huan Jing Ke Xue 37 (1), 112–122. doi:10.13227/j.hjkx.2016.01.016112-122
Li, Y., Dong, S., Liu, S., Su, X., Wang, X., Zhang, Y., et al. (2019). Relationships between Plant Diversity and Biomass Production of alpine Grasslands Are Dependent on the Spatial Scale and the Dimension of Biodiversity. Ecol. Eng. 127, 375–382. doi:10.1016/j.ecoleng.2018.12.015
Lin, L., Zhang, T. Y., and Dong, J. W. (2018). Analysis on Annual Variation Trend and Driving Mechanism of Dissolved Oxygen in Xinmiao Lake Water Body. Jilin Water Conservancy 36 (09), 5–8+11. doi:10.15920/j.cnki.22-1179/tv.2018.09.001
Liu, X., Chen, L., Zhang, G., Zhang, J., Wu, Y., and Ju, H. (2021). Spatiotemporal Dynamics of Succession and Growth Limitation of Phytoplankton for Nutrients and Light in a Large Shallow Lake. Water Res. 194 (7), 116910. doi:10.1016/j.watres.2021.116910
Liu, X., Zhang, G., Xu, Y. J., Wu, Y., Liu, Y., and Zhang, H. (2020). Assessment of Water Quality of Best Water Management Practices in lake Adjacent to the High-Latitude Agricultural Areas, China. Environ. Sci. Pollut. Res. 27 (3), 3338–3349. doi:10.1007/s11356-019-06858-5
Lizotte, R. E., Knight, S. S., Locke, M. A., and Bingner, R. L. (2014). Influence of Integrated Watershed-Scale Agricultural Conservation Practices on lake Water Quality. J. Soil Water Conservation 69 (2), 160–170. doi:10.2489/jswc.69.2.160
Llames, M. E., Lagomarsino, L., Diovisalvi, N., Fermani, P., Torremorell, A. M., Perez, G., et al. (2009). The Effects of Light Availability in Shallow, Turbid Waters: a Mesocosm Study. J. Plankton Res. 31 (12), 1517–1529. doi:10.1093/plankt/fbp086
Lürling, M., Eshetu, F., Faassen, E. J., Kosten, S., and Huszar, V. L. M. (2013). Comparison of Cyanobacterial and green Algal Growth Rates at Different Temperatures. Freshw. Biol. 58 (3), 552–559. doi:10.1111/j.1365-2427.2012.02866.x
Mao, D., Luo, L., Wang, Z., Wilson, M. C., Zeng, Y., Wu, B., et al. (2018). Conversions between Natural Wetlands and farmland in China: A Multiscale Geospatial Analysis. Sci. Total Environ. 634, 550–560. doi:10.1016/j.scitotenv.2018.04.009
Mcnaughton, S. J. (1967). Relationships Among Functional Properties of Californian Grassland. Nature 216 (5111), 168–169. doi:10.1038/216168b0
Miao, Y., Stewart, B. A., and Zhang, F. (2011). Long-term Experiments for Sustainable Nutrient Management in China. A Review. Agron. Sust. Developm. 31 (2), 397–414. doi:10.1051/agro/2010034
Michalak, A. M., Anderson, E. J., Beletsky, D., Boland, S., Bosch, N. S., Bridgeman, T. B., et al. (2013). Record-setting Algal Bloom in Lake Erie Caused by Agricultural and Meteorological Trends Consistent with Expected Future Conditions. Proc. Natl. Acad. Sci. U.S.A. 110 (16), 6448–6452. doi:10.1073/pnas.1216006110
Negro, A. I., De Hoyos, C., and Vega, J. C. (2000). Phytoplankton Structure and Dynamics in Lake Sanabria and Valparaíso Reservoir (NW Spain). Hydrobiologia 424 (1-3), 25–37. doi:10.1007/978-94-017-3488-2_3
Newell, S. E., Davis, T. W., JohengenJohengen, T. H., Gossiaux, D., Burtner, A., Palladino, D., et al. (2019). Reduced Forms of Nitrogen Are a Driver of Non-nitrogen-fixing Harmful Cyanobacterial Blooms and Toxicity in Lake Erie. Harmful Algae 81 (JAN.), 86–93. doi:10.1016/j.hal.2018.11.003
Nolan, M. P., and Cardinale, B. J. (2019). Species Diversity of Resident green Algae Slows the Establishment and Proliferation of the Cyanobacterium Microcystis Aeruginosa. Limnologica 74, 23–27. doi:10.1016/j.limno.2018.09.002
Nunes, M., Adams, J. B., and Rishworth, G. M. (2018). Shifts in Phytoplankton Community Structure in Response to Hydrological Changes in the Shallow St Lucia Estuary. Mar. Pollut. Bull. 128 (MAR.), 275–286. doi:10.1016/j.marpolbul.2018.01.035
Odermatt, D., Pomati, F., Pitarch, J., Carpenter, J., Kawka, M., Schaepman, M., et al. (2012). MERIS Observations of Phytoplankton Blooms in a Stratified Eutrophic lake. Remote Sensing Environ. 126, 232–239. doi:10.1016/j.rse.2012.08.031
Padisák, J., Crossetti, L. O., and Naselli-Flores, L. (2009). Use and Misuse in the Application of the Phytoplankton Functional Classification: a Critical Review with Updates. Hydrobiologia 621 (1), 1–19. doi:10.1007/s10750-008-9645-0
Paerl, H. W., Xu, H., McCarthy, M. J., Zhu, G., Qin, B., Li, Y., et al. (2011). Controlling Harmful Cyanobacterial Blooms in a Hyper-Eutrophic lake (Lake Taihu, China): The Need for a Dual Nutrient (N & P) Management Strategy. Water Res. 45 (5), 1973–1983. doi:10.1016/j.watres.2010.09.018
Poot-Delgado, C. A., Okolodkov, Y. B., Aké-Castillo, J. A., and Rendón von Osten, J. (2018). Potentially Harmful Cyanobacteria in Oyster banks of Términos Lagoon, southeastern Gulf of Mexico. Acta Biol. Colomb. 23 (1), 51–58. doi:10.15446/abc.v23n1.65809
Raven, J. A., Giordano, M., Beardall, J., and Maberly, S. C. (2011). Algal and Aquatic Plant Carbon Concentrating Mechanisms in Relation to Environmental Change. Photosynth Res. 109 (1-3), 281–296. doi:10.1007/s11120-011-9632-6
Reynolds, C. S. (2012). Environmental Requirements and Habitat Preferences of Phytoplankton: Chance and Certainty in Species Selection. Botanica Marina 55 (1), 1–17. doi:10.1515/bot.2011.121
Reynolds, C. S., Huszar, V., Kruk, C., Naselli-Flores, L., and Melo, S. (2002). Towards a Functional Classification of the Freshwater Phytoplankton. J. Plankton Res. 24 (5), 417–428. doi:10.1093/plankt/24.5.417
Reynolds, C. S. (1980). Phytoplankton Assemblages and Their Periodicity in Stratifying lake Systems. Ecography 3, 141. doi:10.1111/j.1600-0587.1980.tb00721.x
Reynolds, C. S. (1984). Phytoplankton Periodicity: the Interactions of Form, Function and Environmental Variability. Freshw. Biol 14 (2), 111–142. doi:10.1111/j.1365-2427.1984.tb00027.x
Rojo, C., and Álvarez-Cobelas, M. (2003). Are There Steady-State Phytoplankton Assemblages in the Field? Hydrobiologia 502 (1-3), 3–12. doi:10.1023/B:HYDR.0000004266.79941.cc
Sabater, S., Artigas, J., Durán, C., Pardos, M., Romaní, A. M., Tornés, E., et al. (2008). Longitudinal Development of Chlorophyll and Phytoplankton Assemblages in a Regulated Large River (The Ebro River). Sci. Total Environ. 404 (1), 196–206. doi:10.1016/j.scitotenv.2008.06.013
Salmaso, N., Naselli-Flores, L., and Padisák, J. (2015). Functional Classifications and Their Application in Phytoplankton Ecology. Freshw. Biol. 60 (4), 603–619. doi:10.1111/fwb.12520
Salmaso, N., and Padisák, J. (2007). Morpho-Functional Groups and Phytoplankton Development in Two Deep Lakes (Lake Garda, Italy and Lake Stechlin, Germany). Hydrobiologia 578 (1), 97–112. doi:10.1007/s10750-006-0437-0
Shannon, C. E., Weaver, W., and Wiener, N. (1950). The Mathematical Theory of Communication. Phys. Today 3 (9), 31–32. doi:10.1063/1.3067010
Sournia, A. (1978). "Phytoplankton Manual," in Monographs on Oceanographic Methodology. Paris: UNESCO, 6, 337.
Spellerberg, I. F., and Peter, J. F. (2003). "A Tribute to Claude Shannon (1916–2001) and a Plea for More Rigorous Use of Species Richness, Species Diversity and the ‘Shannon–Wiener’ Index.". Glob. Ecol. Biogeogr. 12 (3), 177–179. doi:10.1046/j.1466-822x.2003.00015.x
Steinberg, C. E. W., and Hartmann., H. M. (1988). Planktonic Bloom-Forming Cyanobacteria and the Eutrophication of Lakes and Rivers. Freshw. Biol 20 (2), 279–287. doi:10.1111/j.1365-2427.1988.tb00452.x
Sun, T, Y., Liu, J., and Y Li, H. (2021). Biocommunity Structure of Chagan Lake. J. Jilin Agric. Univ. 43 (4), 8. doi:10.13327/j.jjlau.2019.5013
Taucher, J., and Oschlies, A. (2011). Can We Predict the Direction of marine Primary Production Change under Global Warming? Geophys. Res. Lett. 38, 1–6. doi:10.1029/2010gl045934
Taylor, J. M., Lizotte, R. E., and Testa, S. (2019). Breakdown Rates and Associated Nutrient Cycling Vary between Novel Crop-Derived and Natural Riparian Detritus in Aquatic Agroecosystems. Hydrobiologia 827 (1), 211–224. doi:10.1007/s10750-018-3766-x
Thamatrakoln, K. (2021). Diatom Ecophysiology: Crossing Signals on the Road to Recovery from Nutrient Deprivation. Curr. Biol. 31, R253–R254. doi:10.1016/j.cub.2021.01.016
Tian, W., Zhang, H., Zhao, L., Xu, X., and Huang, H. (2016). The Relationship between Phytoplankton Evenness and Copepod Abundance in Lake Nansihu, China. Ijerph 13 (9), 855. doi:10.3390/ijerph13090855
Tilman, D., Kilham, S. S., and Kilham, P. (1982). Phytoplankton Community Ecology: The Role of Limiting Nutrients. Annu. Rev. Ecol. Syst. 13 (1), 349–372. doi:10.1146/annurev.es.13.110182.002025
Tõnno, I., Talas, L., Freiberg, R., Kisand, A., Belle, S., Stivrins, N., et al. (2021). Environmental Drivers and Abrupt Changes of Phytoplankton Community in Temperate lake Lielais Svētiņu, Eastern Latvia, over the Last Post-Glacial Period from 14.5 Kyr. Quat. Sci. Rev. 263, 107006. doi:10.1016/j.quascirev.2021.107006
Touzet, N. (2011). Mesoscale Survey of Western and Northwestern Irish Lakes - Spatial and Aestival Patterns in Trophic Status and Phytoplankton Community Structure. J. Environ. Manage. 92 (10), 2844–2854. doi:10.1016/j.jenvman.2011.06.034
Utermöhl, H. (1958). Zur Vervollkommnung der quantitativen Phytoplankton-Methodik. SIL Commun. 1953-1996 9 (1), 1–38.
Vadeboncoeur, Y., Peterson, G., Vander Zanden, M. J., and Kalff, J. (2008). Benthic Algal Production across lake Size Gradients: Interactions Among Morphometry, Nutrients, and Light. Ecology 89 (9), 2542–2552. doi:10.1890/07-1058.1
Visser, P. M., Verspagen, J. M. H., Sandrini, G., StalMatthijs, L. J., Matthijs, H. C. P., Davis, T. W., et al. (2016). How Rising CO2 and Global Warming May Stimulate Harmful Cyanobacterial Blooms. Harmful Algae 54 (apr), 145–159. doi:10.1016/j.hal.2015.12.006
Wang, M. C., Liu, X. Q., and Zhang, J. H. (2002). Assessment Methods and Classification Standards of lake Eutrophication. China Environ. Monit. 18 (5), 3. doi:10.3969/j.issn.1002-6002.2002.05.018
Weithoff, G., Lorke, A., and Walz, N. (2000). Effects of Water-Column Mixing on Bacteria, Phytoplankton, and Rotifers under Different Levels of Herbivory in a Shallow Eutrophic lake. Oecologia 125 (1), 91–100. doi:10.1007/pl00008896
Whitton, B. A. (2012). Changing Approaches to Monitoring during the Period of the 'Use of Algae for Monitoring Rivers' Symposia. Hydrobiologia 695 (1), 7–16. doi:10.1007/s10750-012-1121-1
Winder, M., and Sommer, U. (2012). Phytoplankton Response to a Changing Climate. Hydrobiologia 698 (1), 5–16. doi:10.1007/s10750-012-1149-2
Wu, Z., Cai, Y., Liu, X., XuXu, C. P., Chen, Y., and Zhang, L. (2013). Temporal and Spatial Variability of Phytoplankton in Lake Poyang: The Largest Freshwater lake in China. J. Great Lakes Res. 39, 476–483. doi:10.1016/j.jglr.2013.06.008
Wurtsbaugh, W. A., Paerl, H. W., and Dodds, W. K. (2019). Nutrients, Eutrophication and Harmful Algal Blooms along the Freshwater to marine Continuum. WIREs Water 6 (5), e1373. doi:10.1002/wat2.1373
Xu, H., Paerl, H. W., Zhu, G., Qin, B., Hall, N. S., and Zhu, M. (2017). Long-term Nutrient Trends and Harmful Cyanobacterial Bloom Potential in Hypertrophic Lake Taihu, China. Hydrobiologia 787 (1), 229–242. doi:10.1007/s10750-016-2967-4
Yang, L.-z., and Liu, M. (2020). A Double-Activity (Green Algae Toxicity and Bacterial Genotoxicity) 3D-QSAR Model Based on the Comprehensive Index Method and its Application in Fluoroquinolones' Modification. Ijerph 17 (3), 942. doi:10.3390/ijerph17030942
Yao, S. C., Xue, B., and Lv, X. G. (2010). Water Quality of Lakes Evolution in Songnen Plain. Wetland Sci. 8 (2), 169–175. doi:10.13248/j.cnki.wetlandsci.2010.02.007
Zepernick, B. N., Gann, E. R., Martin, R. M., Pound, H. L., Krausfeldt, L. E., Chaffin, J. D., et al. (2021). Elevated pH Conditions Associated with Microcystis Spp. Blooms Decrease Viability of the Cultured Diatom Fragilaria Crotonensis and Natural Diatoms in Lake Erie. Front. Microbiol. 12, 1–12. doi:10.3389/fmicb.2021.598736
Zhang, L., Zhang, G. X., and Li, R. R. (2016). Water Quality Analysis and Prediction Using Hybrid Time Series and Neural Network Models. J. Agric. Sci. Tech. 18 (4), 975–983. http://hdl.handle.net/123456789/3925.
Zhang, S., Xiao, Y., Li, Z., Wang, S., Guo, J., and Lu, L. (2019). Turbulence Exerts Nutrients Uptake and Assimilation of Bloom-Forming Dolichospermum through Modulating Morphological Traits: Field and Chemostat Culture Studies. Sci. Total Environ. 671, 329–338. doi:10.1016/j.scitotenv.2019.03.328
Zhang, T. Y. (2015). Water Quality Migration and Transformation Law and Pollution Cause Analysis of Chagan Lake. Dissertation. Jilin Architecture University.
Zhang, Y., Peng, C., Wang, J., Huang, S., Hu, Y., Zhang, J., et al. (2019). Temperature and Silicate Are Significant Driving Factors for the Seasonal Shift of Dominant Diatoms in a Drinking Water Reservoir. J. Ocean. Limnol. 37, 568–579. doi:10.1007/s00343-019-8040-1
Zhang, Y., Song, C., Ji, L., Liu, Y., Xiao, J., Cao, X., et al. (2018). Cause and Effect of N/P Ratio Decline with Eutrophication Aggravation in Shallow Lakes. Sci. Total Environ. 627, 1294–1302. doi:10.1016/j.scitotenv.2018.01.327
Zhao, Z., Jiang, Y., Xia, L., Mi, T., Yan, W., Gao, Y., et al. (2014). Application of Canonical Correspondence Analysis to Determine the Ecological Contribution of Phytoplankton to PCBs Bioaccumulation in Qinhuai River, Nanjing, China. Environ. Sci. Pollut. Res. 21 (4), 3091–3103. doi:10.1007/s11356-013-2265-x
Keywords: phytoplankton, Xinmiao Lake, diversity index, functional group, Agricultural area, indicative function, Seasonal dynamics
Citation: Huang Y, Shen Y, Zhang S, Li Y, Sun Z, Feng M, Li R, Zhang J, Tian X and Zhang W (2022) Characteristics of Phytoplankton Community Structure and Indication to Water Quality in the Lake in Agricultural Areas. Front. Environ. Sci. 10:833409. doi: 10.3389/fenvs.2022.833409
Received: 11 December 2021; Accepted: 04 March 2022;
Published: 31 March 2022.
Edited by:
Guobin Fu, CSIRO Land and Water, AustraliaReviewed by:
Xin Leng, Nanjing University, ChinaElżbieta Zębek, University of Warmia and Mazury in Olsztyn, Poland
Copyright © 2022 Huang, Shen, Zhang, Li, Sun, Feng, Li, Zhang, Tian and Zhang. This is an open-access article distributed under the terms of the Creative Commons Attribution License (CC BY). The use, distribution or reproduction in other forums is permitted, provided the original author(s) and the copyright owner(s) are credited and that the original publication in this journal is cited, in accordance with accepted academic practice. No use, distribution or reproduction is permitted which does not comply with these terms.
*Correspondence: Wenguang Zhang, Wmhhbmd3ZW5ndWFuZ0BpZ2EuYWMuY24=
†These authors have contributed equally to this work