 Alishbah Syed1,2,3
 Jiquan Zhang1,2,3*
 Iman Rousta4,5
 Haraldur Olafsson6
 Safi Ullah7
 Md Moniruzzaman8Hao Zhang9
- 1Institute of Natural Disaster Research, School of Environmental Science, Northeast Normal University, Changchun, China
- 2State Environmental Protection Key Laboratory of Wetland Ecology and Vegetation Restoration, Northeast Normal University, Changchun, China
- 3Key Laboratory for Vegetation Ecology, Ministry of Education, Changchun, China
- 4Department of Geography, Yazd University, Yazd, Iran
- 5Institute for Atmospheric Sciences—Weather and Climate, University of Iceland and Icelandic Meteorological Office (IMO), Reykjavik, Iceland
- 6Institute for Atmospheric Sciences—Weather and Climate, Department of Physics, University of Iceland and Icelandic Meteorological Office (IMO), Reykjavik, Iceland
- 7Department of Atmospheric and Oceanic Sciences, Fudan University, Shanghai, China
- 8Agriculture Department, Spatial Business Integration GmbH (SBI), Darmstadt, Germany
- 9Department of Environmental Science and Engineering Jiangwan Campus, Fudan University, Yangpu, Shanghai, China
The Climate Hazard Group InfraRed Precipitation with Stations (CHIRPS) dataset was examined for its variability and performance in explaining precipitation variations, forecasting, and drought monitoring in Southeast Asia (SEA) for the period of 1981–2020. By using time-series analysis, the Standardized Precipitation Index (SPI), and the Autoregressive Integrated Moving Average (ARIMA) model this study established a data-driven approach for estimating the future trends of precipitation. The ARIMA model is based on the Box Jenkins approach, which removes seasonality and keeps the data stationary while forecasting future patterns. Depending on the series, ARIMA model annual estimates can be read as a blend of recent observations and long-term historical trend. Methods for determining 95 percent confidence intervals for several SEA countries and simulating future annual and seasonal precipitation were developed. The results illustrates that Bangladesh and Sri Lanka were chosen as the countries with the greatest inaccuracies. On an annual basis, Afghanistan has the lowest Mean Absolute Error (MAE) values at 33.285 mm, while Pakistan has the highest at 35.149 mm. It was predicted that these two countries would receive more precipitation in the future as compared to previous years.
1 Introduction
The water that falls to the ground as hail, sleet, rain, mist, or snow is referred to as precipitation (Driscoll et al., 2003; Li et al., 2021). It is an important climate parameter that’s been used to investigate the trend and variability of hydro-meteorological occurrences (DasGupta and Shaw, 2015; Rousta et al., 2017; Rousta et al., 2018). Variability in precipitation is defined as a variation in the amount of precipitation that falls naturally in a certain area. These errors occur in both space and time, providing a global risk to hydro-meteorological systems (Naheed and Rasul, 2011). Flooding occurs when there is a lot of rain, whereas a lack of rain can cause water scarcity, which can lead to drought (Seager et al., 2009; Syed et al., 2021a). As a result, heavy precipitation has the potential to have far-reaching societal consequences, including loss of life and livelihood, as well as distruction of infrastructure (Jones et al., 2004; Zhang et al., 2019a). Extreme precipitation events will become more regular as the concentration of water vapours has increased in air, according to the IPCC’s Sixth Assessment Reports (IPCC AR6), which provided the most well-known projections of the variability caused by global warming (Agenda, 2007; Rousta et al., 2016).
Globally, precipitation has fluctuated throughout the last few decades (Trenberth, 2011). In recent times, it has experienced substantial spatiotemporal variability (Kumar et al., 2010). According to the IPCC AR6 (AR6, 2021), climate change will cause substantial spatiotemporal variability in precipitation, which will increase the frequency and intensity of hydrometeorological utmost (i.e., droughts and floods) in many regions around the globe (Zhao et al., 2021). Drought has a devastating effect on the ecology as a potential hydro-meteorological disaster (Miao et al., 2022). Droughts that endure for a long time can have an adverse effect on solar and hydropower production (Al-Dousari et al., 2019). As a result, it is critical to keep track of precipitation and put in place effective control mechanisms to mitigate the effects of drought (Khan et al., 2011; Ionita et al., 2016; Higashino and Stefan, 2019). Large-scale severe droughts occurred all around the world during the turn of the twenty-first century, resulting in substantial economic losses (Du et al., 2018). Though the most crucial aspect in determining drought indices is precipitation (Khodadoust Siuki et al., 2017), drought assessment always necessitates long-term precipitation records. In-situ climatological measurements are commonly used to construct drought indicators. Nevertheless, climatological sensors are frequently placed hastily and irregularly, and in certain distant regions, they may be completely inaccessible. If enough consideration is given to their inherent mistakes and uncertainties, a number of satellite-derived precipitation products may be able to cover these gaps (Shen et al., 2014).
Short-term satellite precipitation products have been used in several studies to assess drought; nevertheless, the inaccuracy of such sparse data should be investigated further (De Jesús et al., 2016). Although most satellite-derived datasets have too short time series, they can not be used for drought monitoring because data with a time span of at least 30 years is required (Svoboda et al., 2012; Funk et al., 2015; Ullah et al., 2021). For day, month, and year periods, the most latest iteration of the CHIRPS dataset with 0.05° spatial resolution is accessible (Funk et al., 2015). The CHIRPS dataset was shown to yield good results in a comprehensive global analysis of all precipitation datasets, capable of meeting the demands of drought monitoring over a local meteorological timeframe of more than 3 decades (Beck et al., 2017). The CHIRPS dataset has been utilized for drought monitoring in recent years, with positive results in a variety of countries and areas (Habitou et al., 2020; Pandey et al., 2021). Globally there are some other studies (Salehie et al., 2021) has contributed in analyzing the precipitation extremes and its variations in other countries. Some of these studies has used CHIRPS datasets. The study by (Nashwan et al., 2020) proposed the CHIRPS is better at estimating the total amount of rainfall over Egypt. In addition, precipitation measurement has many applications in drought estimation, hydrological analyses (Ziarh et al., 2021) and studying water-related issues including erosion and quality. For example, extreme precipitation events caused warming in the coastal and inland areas of Bangladesh (Abdullah et al., 2020).
SPI has been used in several studies to anticipate drought utilizing basic but effective time series statistical approaches including Autoregressive Integrated Moving Average (ARIMA) models, deep learning, and logarithmic smoothing (Morid et al., 2007; Han et al., 2013). The ARIMA model uses a statistical approach to forecast reliable drought trends, and it has several advantages over traditional methods, including a fixed structure, time series specificity, ease of use, low computational cost, reliance on data analyst skill and experience, and the use of backward observations, to name a few. The ARIMA time series model is a well-structured empirical instrument for predicting and comprehending drought’s chaotic nature. When the time series data is stationary and linear, the Autoregressive (AR) or Moving Average (MA) or mixed Auto Regressive Moving Average (ARMA) models are utilized (Han et al., 2013). When time series data is non-linear and quasi-linear, however, differencing is done first. The purpose of this project is to determine the most accurate satellite-based precipitation product at a local scale, as well as to analyze and forecast the drought condition in the study area, so that water resource managers may develop effective management strategies and operations. The particular objectives of this studg are to look at seasonal and annual precipitation variations, forecast seasonal and annual precipitation in the next 20 years using ARIMA, and monitor droughts in Southeast Asian countries.
2 Materials and methods
2.1 Study area
This study selected 9 Southeast Asia countries that are located between longitudinal coordinates 88.5°E and 130.5°E and latitudinal coordinates 23.5°N and 14.5°S, according to their climatic history (Figure 1; Table 1) (Maharjan et al., 2020; Shahzaman et al., 2021). The Maritime Continent and Continental Southeast Asia (Myanmar, Thailand) have previously been identified as the principal causes of changes in air temperature and particulate deposition in SEA due to recurrent emission outbreaks (Ng et al., 2017). The majority of Southeast Asia is in the hot, humid tropics, with a monsoonal rains. For agriculture, the summer monsoon season is critical. Around 70% of the inhabitants in these nations work in agriculture, either directly or indirectly, and their livelihoods are strongly reliant on rainfall patterns. With 160 million hectares of agricultural land, India is the world’s second-largest and most populous country in Southeast Asia. With 23.3 million hectares of agricultural land, Pakistan is the second-largest country in Southeast Asia (Shah et al., 2019). It connects to the Hindukush Himalayan Mountains on the north side, and spans from the Pamirs to the Arabian Sea on the south (Ullah et al., 2020; Syed et al., 2021b). In Bangladesh, agriculture occupies 9.3 million hectares, while in Afghanistan, agriculture covers 8 million hectares (Lal, 2007; Zhang et al., 2019b). The other Southeast Asian countries account for a significantly lower proportion of the total. SEA has a total land size of 5.2 million km2 (Nawaz and Farooq, 2021).
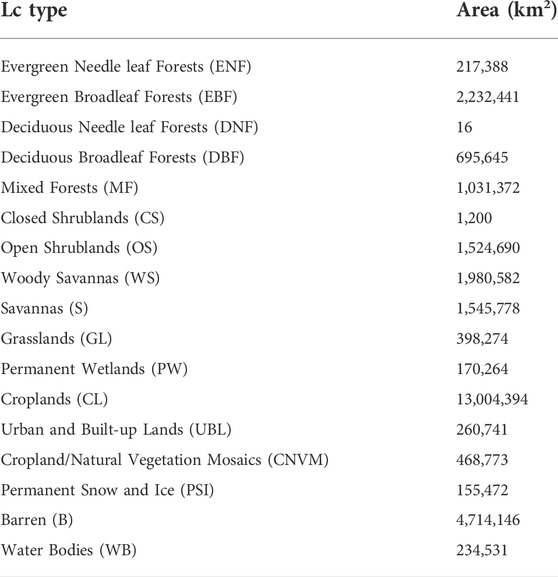
TABLE 1. Land-cover types of SEA, that were identified from MODIS (MCD12Q1) images using IGBP classifications (Syed et al., 2021a).
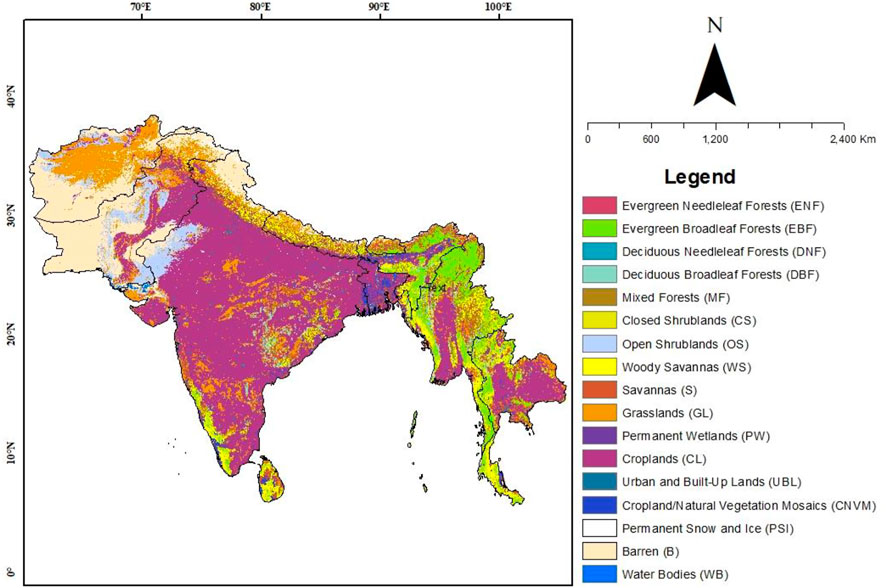
FIGURE 1. Land-cover type map of SEA, that was identified from MODIS (MCD12Q1) images using IGBP classifications.
2.2 Climate of Southeast Asia
Tropical, subtropical, rocky, moist, alpine, arid terrain, and desert areas with a lot of rain (summer and winter monsoon) regimes are all found in Southeast Asia (Lieberman and Buckley, 2012). In Southeast Asia, there are four seasons (spring, summer, autumn, and winter), as well as monsoon rains. This location is notable for its wind reversal during the monsoon rains. Monsoon rainfall patterns vary across the country on a regional and temporal basis. summer monsoons, in combination with southwesterly winds, contribute for more than 75% of annual rainfall (Ullah et al., 2018). The western disturbances due to the Mediterranean Sea and Atlantic Ocean (MSAO) continue to have an impact on these locations during the winter season (Shahzaman et al., 2021). The only subtropical climate in Southeast Asia is found in Myanmar’s northern and mountainous regions, with milder winters and temperatures as low as 20°C. The majority of the SEA experiences rainy and dry seasons due to seasonal variations in winds or monsoons. During the monsoon season, the tropical rain belt causes more rainfall. The rainforest is the world’s second-largest environment (with the Amazon rainforest being the largest) (Cardoso Da Silva and Bates, 2002). There are exceptions to this rainforest, climate, and vegetation in the northern region and on higher islands, where higher heights bring to milder temperatures (Lan et al., 2021). The Arakan Mountains’ rain shadow causes yearly rainfall to be as low as 600 mm (24 inches) in central Myanmar’s “dry zone,” where annual rainfall can be as low as 600 mm (24 inches) (24 inches) (Loo et al., 2015). This location is dry enough to be classified as semi-arid due to the current scorching temperatures. The Southeast Asia region is one of the world’s most endangered areas in regrad of climate change. Changes in rainfall and runoff will have a substantial impact on agriculture, affecting irrigation systems and, as a result, water quality and quantity (Pan and Chen, 2021). The Southeast Asian fishing sector is predicted to be severely impacted by climate change. While being one of the world’s most sensitive regions to the effects of climate change, SEA countries lag behind in terms of climate mitigation initiatives.
2.3 Monsoon rainfall
Asia’s precipitation vary dramatically throughout a wide range of time periods. Interannual variability in precipitation has long been thought to be linked to changes in the Asian monsoon circulation (Webster et al., 1998; Wang and Ho, 2002). One of the most noticeable features of the southern Asian climate is that, as is typical of monsoon climates, rainfall is heaviest in the summer season and least in the winter season. The summer monsoon in South Asia, which accounts for up to 75% of total annual rainfall in some parts of the region, is inextricably linked to more than 22% of the world’s population (Dhar and Nandargi, 2003). The vast variation in the start and duration of the summer monsoon has a significant impact on Southeast Asia’s water resources, agriculture, economy, ecosystems, and human mortality. Given the reliance of vast populations on monsoon rains, the response of South Asian monsoon dynamics to rising atmospheric greenhouse gas concentrations is a scientific and societal concern. Throughout western and central India, as well as the Tibetan Plateau’s southern hills and Bangladesh, considerable rain falls during the summer (Yao et al., 2010). The onset of the Asian summer monsoon is abrupt in late spring (Lau and Yang, 1997), while the retreat of the monsoon in autumn is relatively slow.
2.4 Data collection
A monthly CHIRPS dataset with a spatial resolution of 0.05° was used in this investigation. At monthly and daily scales, CHIRPS provides global data (50°N–50°S). This dataset combines satellite estimation with in-situ/station observation data based on cold cloud duration (CCD) data. The CHIRPS data was intended largely to track agricultural droughts (Funk et al., 2015). The monthly product version 2.0 was downloaded from https://data.chc.ucsb.edu/products/CHIRPS-2.0/(accessed on 9 February 2021) for the duration of 1981–2020. Precipitation data from the CHIRPS satellite are commonly utilised in hydrogeology and drought research (Shukla et al., 2014; Agutu et al., 2017; McNally et al., 2017). On-the-ground readings, sensor extrapolation, and global precipitation climatology are the three datasets that makeup CHIRPS. The CHIRPS dataset was created using TMPA 3B42, National Climatic Data Center (NCDC) pentad precipitation climatology, National Oceanic and Atmospheric Administration (NOAA) climate forecast system atmospheric model precipitation fields, Climate Prediction Center (CPC) Thermal Infrared (TIR) satellite observations, and SPG observations. The precipitation was measured using the IR Cold Cloud Duration (CCD) observation method, and the dataset was produced using the Inverse Distance Weightage (IDW) interpolation approach (Funk et al., 2014).
3 Methodology
3.1 Time series models
Time series models are used to fulfill the current study’s purpose. To find the best-fitting model, many performance indicators are considered. This was accomplished using the R-forecast Studio software. As a consequence, the best-fitting model has been chosen. Box and Jenkins provided a linear time series model that was used in this study (Box et al., 2015) for forecasting precipitation in SEA to analyze whether the future will going to face drought or a wet period in the coming future. ARIMA is a popular type of time series forecasting model. Over other stochastic models, the ARIMA model has a number of advantages, including exponential smoothing, better forecasting, and the ability to provide more information on time-related changes (Mishra and Desai, 2005). The ARIMA group’s non-seasonal model is composed of three constraints (p, d, q), each of which can have zero or positive integral values, and is autoregressive (AR) to order p, moving average (MA) to order q, and operates on the dth variance of the data series zt. As an example, a general non-seasonal ARIMA model could be written as follows:
where p, d, and q are three non-negative integer parameters which can be defined as “p = is the order of autoregressive,” “d = is the order of differencing” and “q = is the order of moving average model.” The performance of the different series ut can be then represented in ARIMA (p, d, q) model by Equation above. Box and Jenkins promoted the ARIMA (p, d, q) model for forecasting hydrologic variables including rainfall and streamflow.
⁃ Root Mean Square (RMSE)
The root mean square error (RMSE) error statistic is widely used in methodological approaches to assess overall distortion.
Where Oi is the total amount of observations, Si denotes anticipated values for a particular variable, and n denotes the total number of observations available for analysis. RMSE is an excellent reasonable approximation for assessing prediction errors of different models or modeling configurations for a single variable, rather than between variables, because it is scale dependant.
⁃Mean Absolute Percentage Error (MAPE)
⁃ Mean Absolute Error (MAE)
⁃ Ljung-Box Q
There are a number of statistical tests that may be used to determine whether or not something is random. In current research, the Ljung-Box Q statistic, as well as the tipping point and intervals tests, were used to assess covariances for independence (Di Lorenzo and Ljung-Box, 2013). Instead of visually inspecting the sample autocorrelations, the LjungBox Q or Q(r) statistic can be used to check independence. By selecting a level of significance, this hypothesis can be tested for convergent validity after that it can compared the value of calculated χ2 with the χ2-table critical value, the present model is adequate based on available data.
For the best models, to test the independence assumption of residuals, the Ljung-Box Q statistic has been used. Tables 3 and 4 summarize the findings of these testing.
3.2 The Standardized Precipitation Index for drought assessment
The SPI computation needs fitting a probability distribution for homogenised long-term precipitation records, such as the Pearson Type III or Gamma probability function, which generally follows the nonnormal stable distribution, in order to produce the standard normal variable. Then, using equiprobability transformation, it is transformed into a normally distributed version with a unit standard deviation and zero mean for the relevant region and period (Guttman, 1998; Khan et al., 2020). SPI was calculated on a 1, 3, 6, and 12-months time frame using the R platform to analyze meteorological drought revealed by accurate satellite precipitation data in this study. The SPI is a number that ranges from 2 to −2, with a lower value indicating drier or drought conditions and a higher value indicating wetter conditions (Table 2).
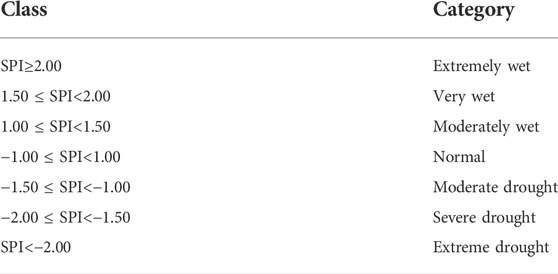
TABLE 2. Drought classification according to SPI values (Rousta et al., 2020a; Rousta et al., 2020b).
4 Results
Due to global warming, droughts have become more common and severe in recent years. According to various studies, precipitation is a predictor of the onset and persistence of meteorological and other types of droughts. As a consequence, precise precipitation observations at multiple temporal and spatial scales are essential for assessing drought risk. Satellite-based precipitation products offer an appealing alternative to rain gauge observations, with significantly higher geographical resolution and continuous spatial and temporal coverage than rain gauge data. Because they bridge data gaps in remote places where traditional rain gauge and ground radar readings are limited or unavailable, these datasets enable worldwide precipitation monitoring and are commonly used for diverse hydrological and climatic applications. The accuracy of different satellite-based precipitation products varies greatly depending on the working principle, sensor type, electromagnetic spectrum range used in product generation (microwave, infrared, visible, or combined range), number of integrated observational networks, data processing algorithms, and resampling techniques.
Drought conditions are identified using a variety of indicators based on the divergence of meteorological variables from the long-term average value. The Standardized Precipitation Metric (SPI) is a compliance index proposed by the World Meteorological Organization (WMO) for meteorological drought assessment.
4.1 Performance evaluation of satellite precipitation index
Using satellite precipitation products, a monthly precipitation time series was produced. To determine the degree of underestimation or overestimation of monthly satellite precipitation data, the yearly average difference, as well as the deviation, were computed. winter (DJF), spring (MAM), summer (JJA), and fall (SON) seasons were temporally aggregated to detect differences in seasonal inter-relationship across satellite precipitation datasets from 1998 to 2021. A set of regularly used statistical metrics such as RMSE and MAE were generated against CHIRPS data for a thorough assessment of satellite-precipitation datasets (Table 2). The average amount of predicted error between satellite precipitation was calculated using RMSE and MAE.
4.2 Time series autoregressive integrated moving average model development for precipitation forecasting
There are four main processes to building an ARIMA model: identification, estimate, diagnostic checking, and forecasting. Forecasting via time series analysis, using the autoregressive integrated moving average (ARIMA), has been identified as one of the most efficient methods for predicting climate change, and is characterised by broad use and adaptability. Furthermore, the data required by ARIMA is less onerous than that required by other approaches like as causal modelling, best fitting the situation of hydro-meteorology and CC parameters in data-sparse contexts. While ARIMA focuses simply on the data itself rather than the data generating process, the ARIMA family provides a simple and cost-effective modelling method ideal for decision makers that need swift short-term and informative forecasts.
In a propagative model, the seasonal ARIMA model comprises both non-seasonal and seasonal features. From 2021 to 2040, the best-fit ARIMA models were used to anticipate seasonal and yearly precipiaion data. From 1981 through 2020, the observed values were compared to the projected values. The expected rainfall number shows a significant result. Figures 2, 3 depict the anticipated and observed time series, as well as the 95 percent confidence level error bound.
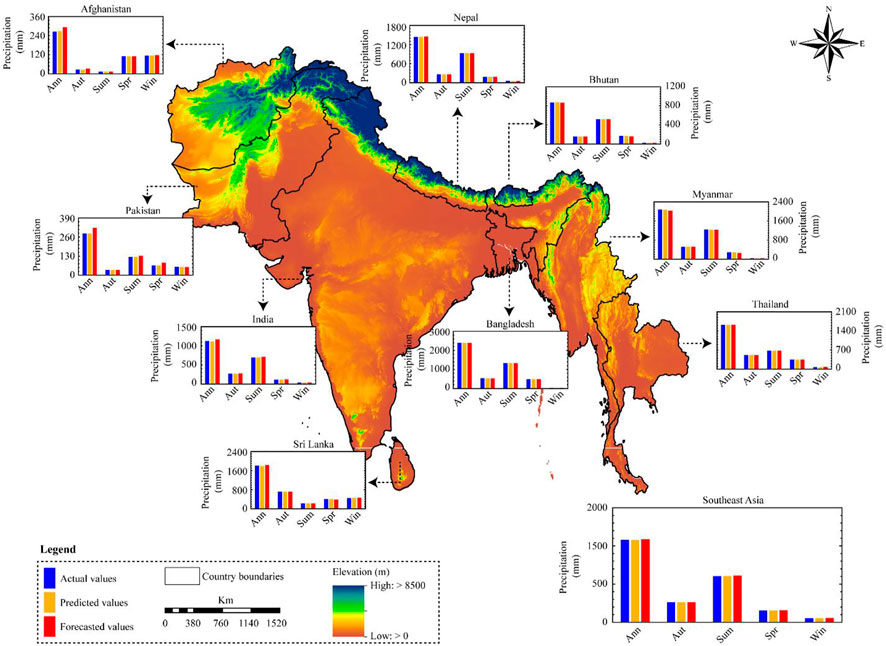
FIGURE 2. Comparison of ARIMA model results for country wise forecasting as well as for the whole SEA.
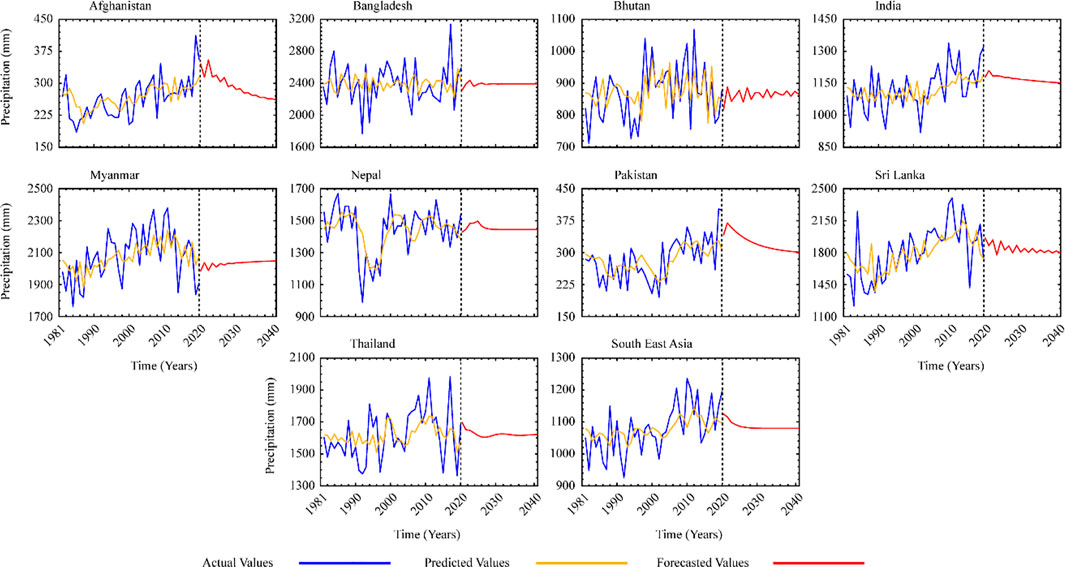
FIGURE 3. ARIMA Forecasting for time series annual mean precipitation for the study period.
Given the average monthly precipitation in the area, the ARIMA model has been used to anticipate the future. Variance was utilised to reduce linearity in a data trend while stabilising variance. The most appropriate methodology and the one that best represents the observed pattern were chosen using various ARIMA orders. Two alternative values for the moving average (q) and autoregressive (p) were determined based on ACF and PACF observations, with differencing (d) of the first and second levels. To determine which ARIMA model was the best for future prediction among the others, the t-test was used. Table 3 displays model values for various ARIMA orders for time series anticipated for the period of 1981–2020. The best-fitting ARIMA models were picked using the R-Studio forecast-package to predict future precipitation in the area. The ARIMA order (p,d,q) was incomparable for all studied countries for much of the rainy season; nevertheless, Pakistan and Afghanistan showed a significantly expanding trend in yearly precipitation for the future.
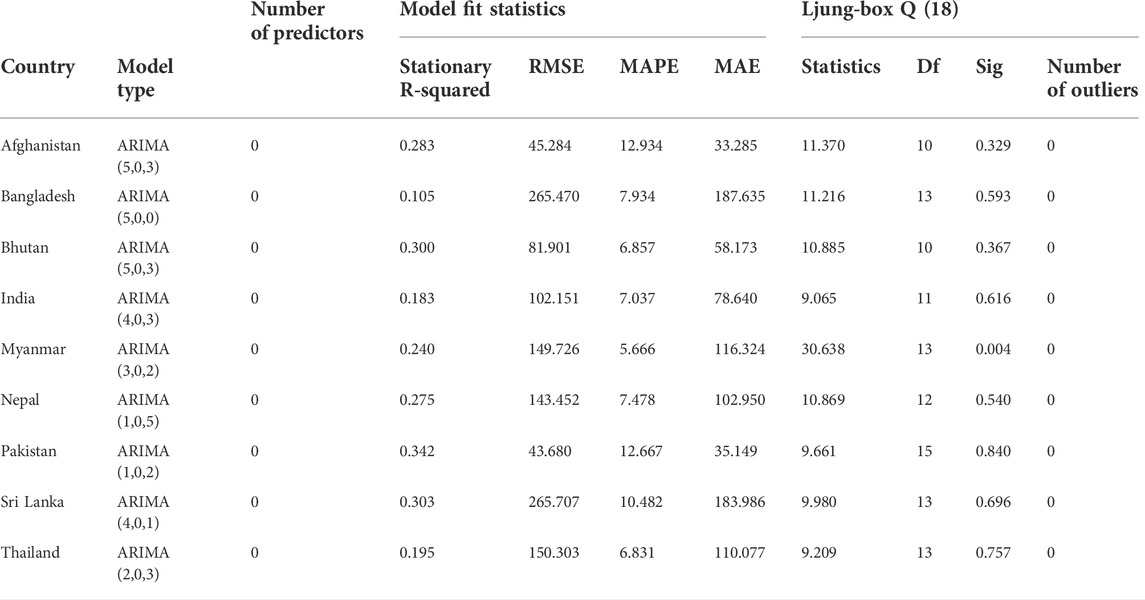
TABLE 3. Model statistics for mean annual precipitation for the countries of SEA.
The best-fit ARIMA models for yearly (Table 3) and seasonal (Table 4) precipitation were assessed using SEA and country-level information. To check that the models were operating appropriately, the scientists forecasted the already known CHIRPS precipitation datasets before projecting the precipitation. The predicted values were substantially closer to the actual data in Figure 2. Then, to improve accuracy, forecasting was done for a period of 20 years Figures 3–7 show observed and simulated precipitation time series, revealing that the modelled (ARIMA) and observed CHIRPS are very similar. The yellow line represents the expected precipitation, and the outcome shows that the forecasted data follows the same trend as the monitored data and meets the basic statistics.
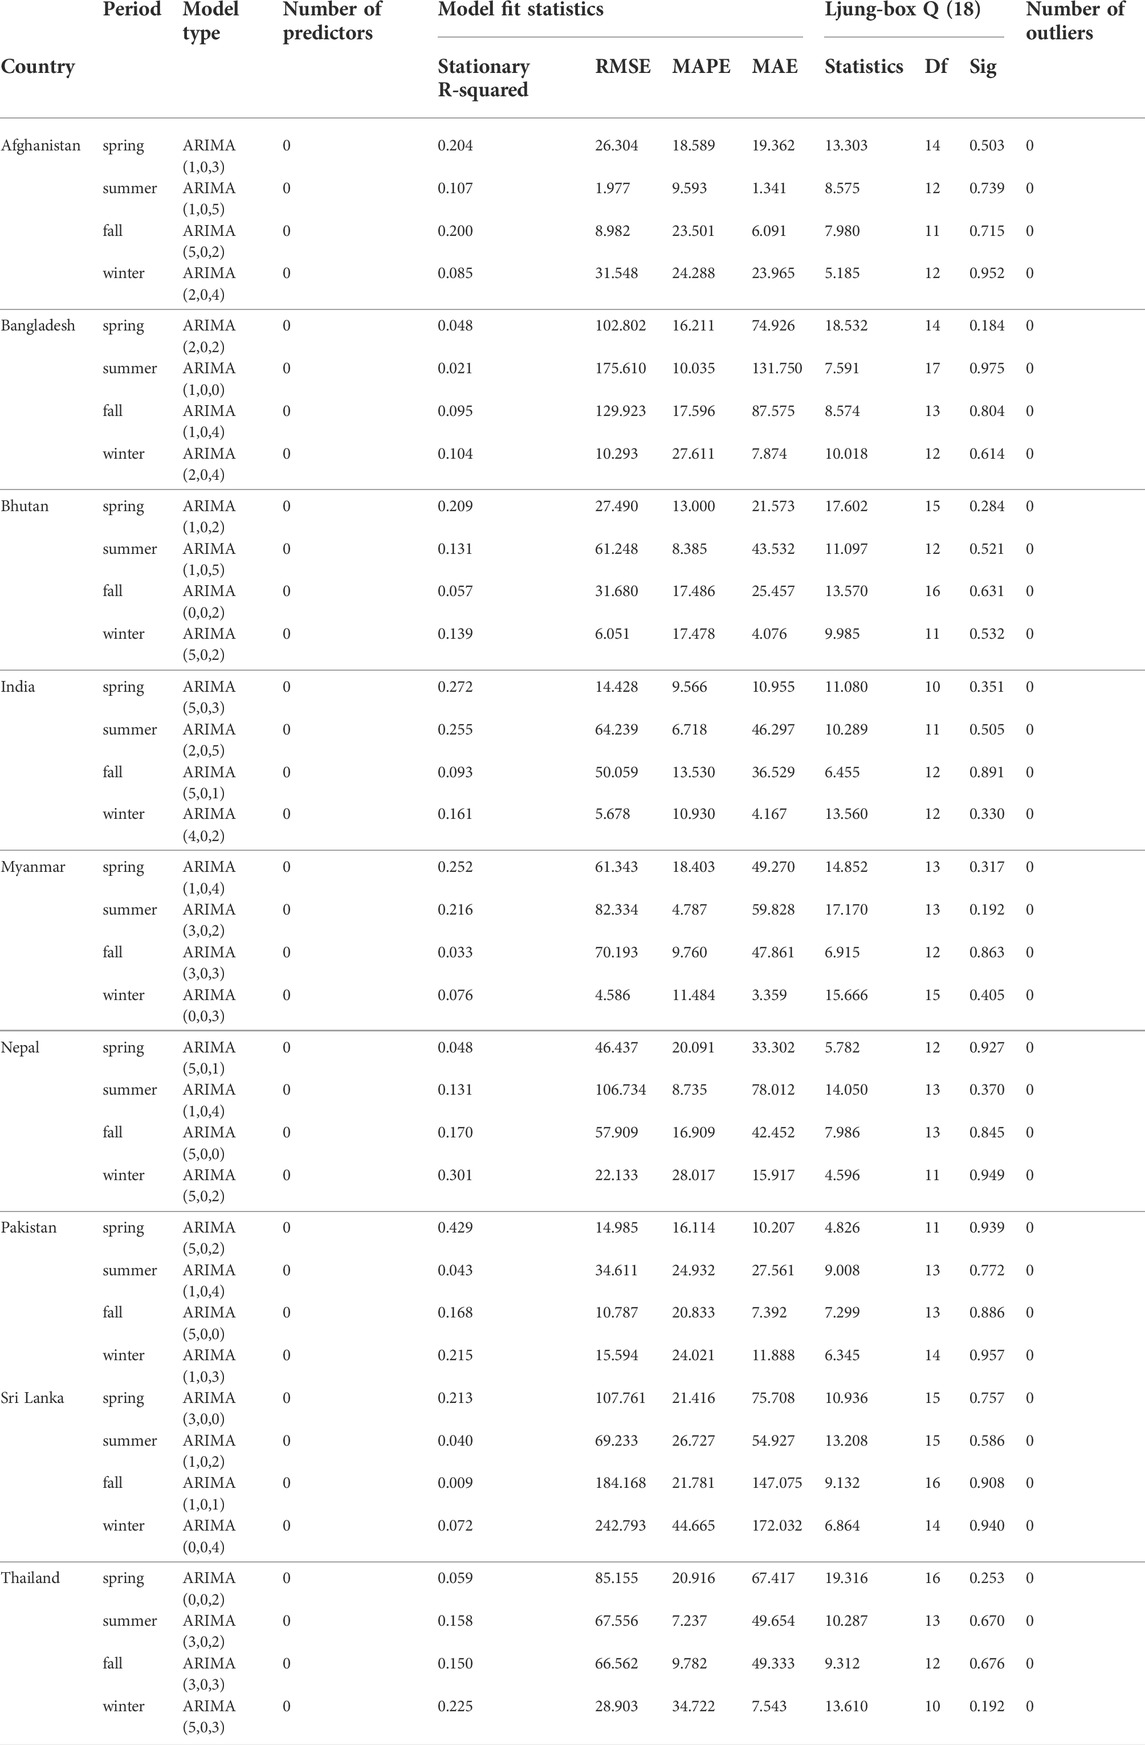
TABLE 4. Model statistics for mean seasonal precipitation for the countries of SEA.
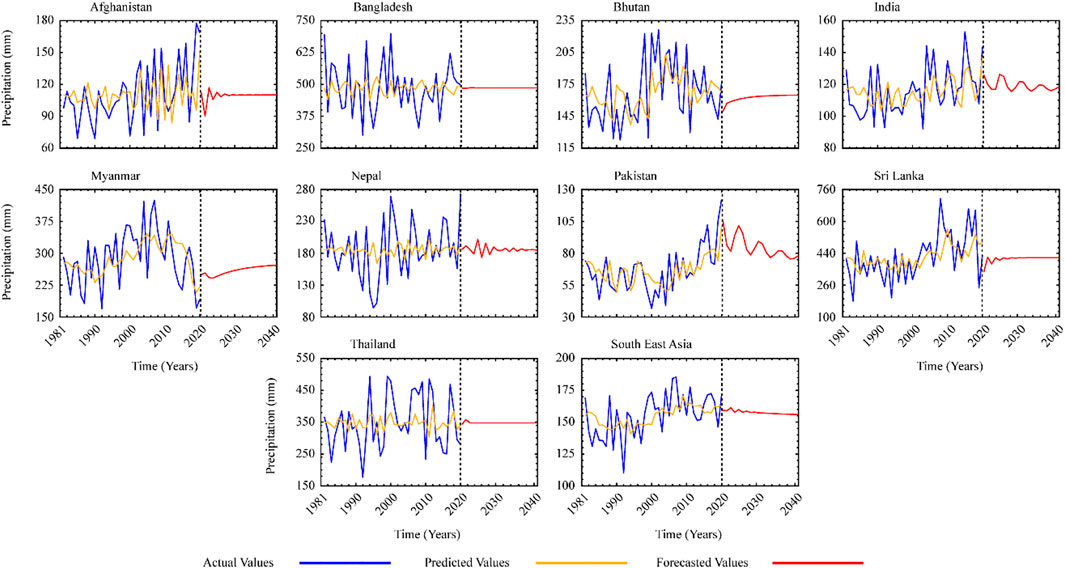
FIGURE 4. ARIMA Forecasting for time series spring mean precipitation for the study period.
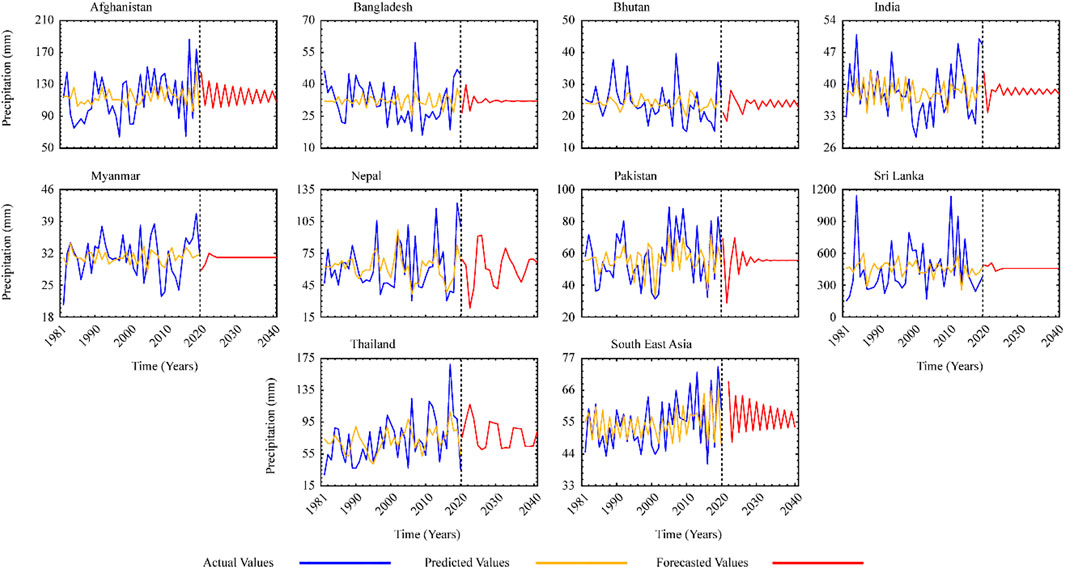
FIGURE 5. ARIMA Forecasting for time series winter mean precipitation for the study period.

FIGURE 6. ARIMA Forecasting for time series summer mean precipitation for the study period.
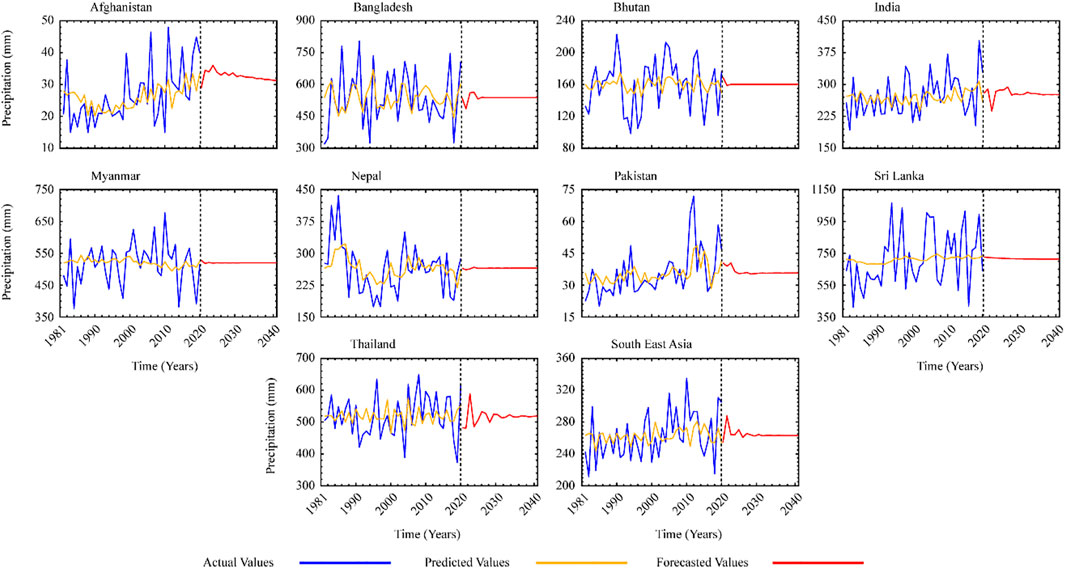
FIGURE 7. ARIMA Forecasting for time series fall mean precipitation for the study period.
4.2.1 Annual forecast
The implementation, as well as the findings achieved, are discussed in the current section. With a similar data span of 1981–2020, the study was done on an annual and seasonal basis. We were able to detect and anticipate precipitation trends using R and SPSS technologies. An ARIMA model was used to anticipate the future based on the area’s mean annual precipitation. Differencing was used to stabilize variance while removing linearity from a data trend. The most appropriate model and the one that best represents the given pattern were chosen using a variety of ARIMA orders. Table 3 shows the p values for various ARIMA orders for the anticipated time series from 1981 to 2020. All ARIMA models were significant within a 95 percent confidence interval corresponding p values, and these findings were subsequently clarified by AIC/BIC values. Models developed with the least AIC/BIC were selected to anticipate future precipitation in the area. The absolute divergence among witnessed and projected data, known as the mean absolute error, was discovered on an annual basis which lowest in Afghanistan, at 33.285 mm, and the highest in Pakistan, at 35.149 mm. It was predicted that these two countries would receive more precipitation than in previous years.
4.2.2 Seasonal forecast
As discussed earlier, ARIMA model was used to predict variations in precipitation during recorded years (1981–2020). A diagnostic testing approach in R-Studio was used to determine the right ARIMA models for seasonal precipitation. Precipitation projections for observed years validated the best-fit ARIMA models, which were then used to estimate precipitation up to 2040 by estimating the future precipitation trend. In comparison to other countries with a typical yearly precipitation trend, Maynmar’s anticipated trend shows a high level of precipitation (heavy rain) throughout the winter season.
Seasonal data reveals the several ARIMA models presented in Table 4. Bangladesh and Sri Lanka were chosen as the countries with the greatest inaccuracies. When employing mean seasonal precipitation data, the findings of the ARIMA model at various levels produced an acceptable absolute error.
5 Discussion
In this study, we analysed precipitation over Southeast Asia using a newly created, finest and high-resolution precipitation dataset. We investigated the relationships between changes in precipitation and variations in large-scale atmospheric and future changes in precipitation by depicting the properties of precipitation in different seasons. Numerous stochastic models were used to anticipate precipitation, study seasonal variability, and forecast monthly/yearly precipitation over a specific geographical area. Research about precipitation is intriguing because of the challenges it raises, such as forecasting, corrosion impacts, and climate variability, all of which have been explored in diverse literatures (Ferm et al., 2006; Tzanis and Varotsos, 2008). The study of Chin (Chin, 1977), reviewed that the daily precipitation records for 25 years at more than 100 stations across the conterminous United States, the proper Markov order characterizing the daily precipitation process must be discovered and cannot be expected a predetermined.
The study of the possible presence of chaotic behavior in precipitation time series has sparked a lot of attention recently (Sivakumar, 2001). Various scientists (Islam and Sivakumar, 2002; Khan et al., 2005) have researched mathematical techniques based on the theoretical notions underlying the methodologies for detection and modeling of dynamical and chaotic aspects within a hydrological time series. Although the precipitation event is dependent on many dynamic and coupled processes, which necessitates very complicated coupled simulation models for prediction, the ARIMA model was used to produce a simple and reliable time series analysis. The advantages of ARIMA over traditional statistical and numerical weather prediction approaches have been discussed by (Taneja et al., 2016; Kumar et al., 2021).
Much of the tropics and subtropics of the Eastern Hemisphere, as well as a significant amount of the world’s population, are influenced by the Asian monsoon circulation (Chattopadhyay, 2007). The southwest (summer) and the northeast (winter) monsoons influence weather and climate between 30 N and 30 S over the African, Indian and Asian land masses (Reddy and Salvekar, 2003). The variability in the monsoon rainfall depends heavily upon the sea surface temperature anomaly over the Indian Ocean (Clark et al., 2000). The studied region is dependent on agriculture for its major livelihood. The summer monsoon (June–August) is the most productive period in SEA with respect to its agricultural practices. Moreover, the conserved rainwater for is used for future irrigation purposes. Therefore, forecasting of annaual and seasonal precipipitation is necessary for future agricultural and irrigation modelling over SEA. The Total annual precipitation in the SEA during 1981–2020 (black bars), with the linear trend line (red dotted line) has been manifested in Figure 8.
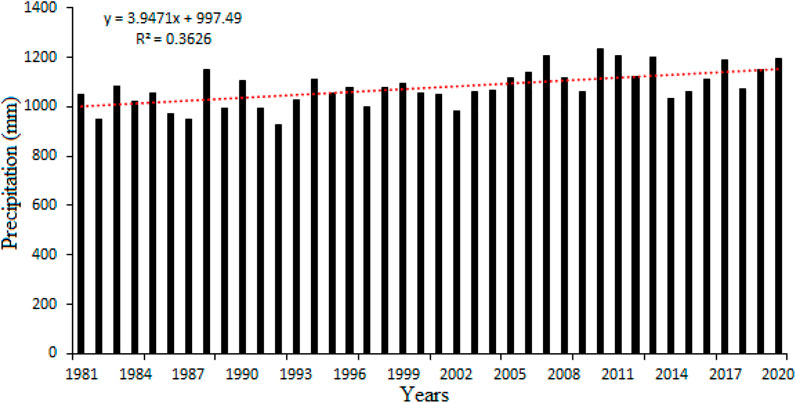
FIGURE 8. Total annual precipitation in the SEA during 1981–2020 (black bars), with the linear trend line (red dotted line).
The findings of gauge station data by Al Balasmeh et al. (2019) revealed that the future trend shows that the high level (heavy rain) is decreasing and low level (normal rain) is increasing, except in the month of December, which shows an increasing trend. This observed pattern warrants effective water management strategies for already water-stressed area of Wadi Shueib catchment in Jordan. Feng et al. (2016) used ARIMA model to predict the future pattern of annual precipitation based on monthly data, where the bestfit ARIMA model has shown horizontal line based on minimum statistical measures such as normalized to the mean of observed values.
According to the IPCC report, inter-seasonal, interdecadal, and spatial variations in precipitation have been seen across Asia in recent decades (Intergovernmental Panel on Climate Change, 2007). Even in Asia’s rainy and sub-humid regions, water scarcity is a major impediment to long-term growth. Asia, on the other hand, has a rapidly growing population, low levels of development, and limited coping capacity. Climate change, combined with other socioeconomic strains, is predicted to exacerbate Asia’s water scarcity predicament. summer precipitation is decreasing across the board in the mid-latitudes, with the exception of eastern Asia, where it is increasing. The research by Kim et al. (2011) compared the last two decades of July mean intensity of precipitation with IPCC, we observed a 28.4 mm lowering tendency for Mongolia, but a rising trend for the rest of the countries. In South Korea, the maximum trend of increasing precipitation was 71.5 mm in July.
Monthly precipitation data was being used by Wang et al. (2014), and the mean absolute value varied from 9.41 to 17.82. In the northeast areas of India Murthy et al. (2018) carried out an empirical study on seasonal monthly precipitation data. Similarly, the ARIMA model has been utilised in a number of investigations with the conclusion that it is both effective and useful (Chattopadhyay et al., 2012). The present study assessed that in spring season, India showed the MAE value at 10.955 mm and Pakistan showed 10.207 mm the lowest of all. On the other hand, Afghanistan portrayed the acceptable MAE in the summer and fall seasons.
Moreover, precipitation patterns varied across the region and were strongly linked to drought occurrences and land use changes. Precipitation changes appeared to be connected to other climate occurrences, such as EL Niño. Further, rainfall found to be the most strong force driving naturally vegetated regions and rainfed croplands, whereas land use management showed to be the most influential in irrigated agricultural areas.
This research concentrated on the key agricultural countries of Southeast Asia. India is the world’s second-largest country, behind the United States, with 160 million hectares of agricultural land, accounting for almost 60% of total land area. Pakistan has around 23.3 million hectares of agricultural land, accounting for 20% of its total land area. Bangladesh has 9.5 million hectares of agricultural land, whereas Afghanistan has 8 million hectares. Agriculture affects over 70% of the total population, either directly or indirectly. It is vital to people’s lives, livelihoods, and economies. The primary source of revenue is agronomy, which is dependent on precipitation. Agriculture contributes 29.9% of Afghanistan’s GDP, whereas Pakistan, India, and Bangladesh each contribute 21.2%, 17.7%, and 18.6%, respectively. This region has a wide variety of climatic zones, including arid, drylands, and deserts, tropical and subtropical, humid, alpine, and mountain environments.
5.1 Probability distribution function of actual and predicted precipitation values
Figures 9–13 shows the probability density function (PDF) of the precipitation at annual and seasonal scales during 1981–2020 over different countries of SEA. It has been used to estimate the positive and negaive shifts of precipitation values along time. Moreover, the density showed the occureence of vales either they have a maximum or minimum movement. The analysis was conducted on the whole period between observed and modelled values of precipitation (Ullah et al., 2019).
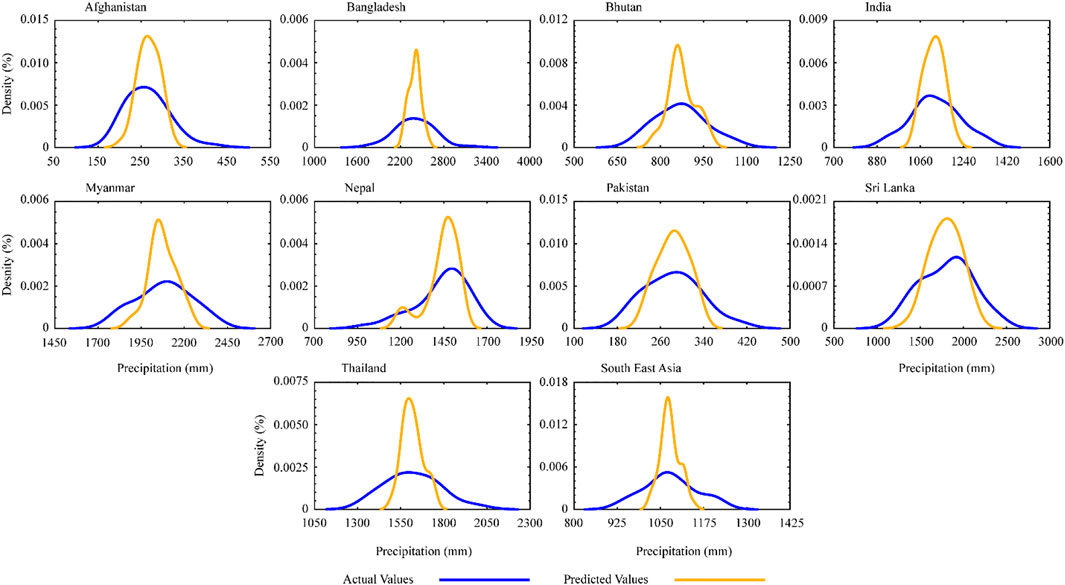
FIGURE 9. Probability distribution function of annual actual and predicted precipitation values during 1981–2020.
The PDF of annual precipitation (Figure 9) shows a major positive shift in all countries, with maximum density during the last in predicted precipitation of the study period. Interestingly, the distribution of predicted precipitation was almost similar in all regions, which indicates a uniform increase in precipitation throughout the study period. Whereas, the higher density of actual precipitation in the Afghanistan and Sri Lanka suggests that these study region has experienced a relatively higher frequency of precipitation during the studied period.
For seasonal precipitation during spring (Figure 10), the PDF followed the pattern of seasonal precipitation; however, the density moments exhibit asymmetric changes in most of the countries. The highest (lowest) density for predicted values can be found in the Pakistan and Myanmar, indicating a higher (lower) frequency of precipitation. The uneven density of precipitation in actual vales confirms that the frequency of precipitation was highly divergent during the study period. It is worth mentioning that the actual precipitation has shown a more positive movement in all countries, which indicates a higher amount of precipitation than the predicted values.
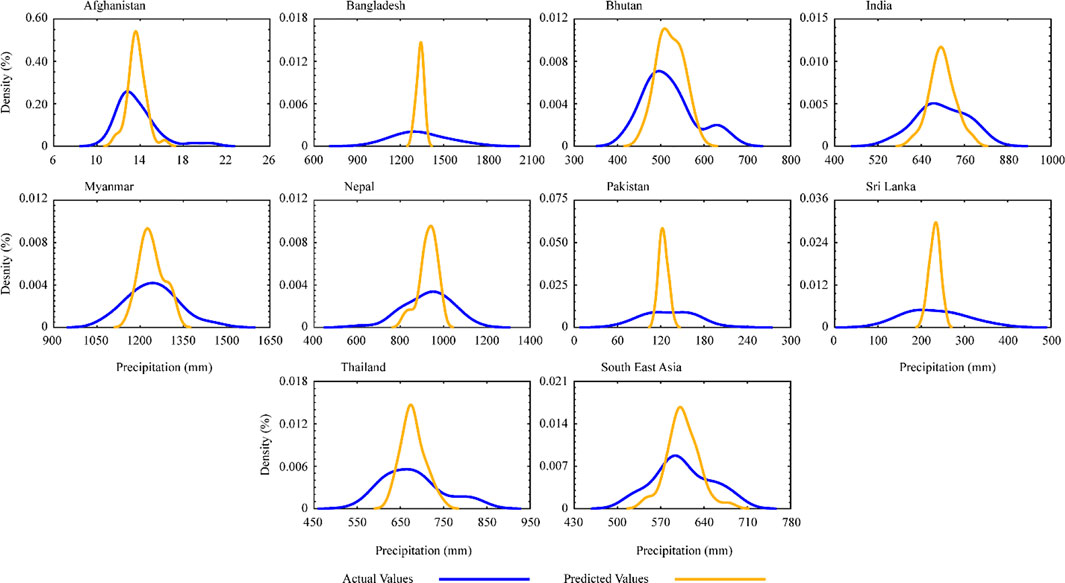
FIGURE 10. Probability distribution function of spring actual and predicted precipitation values during 1981–2020.
The PDF of summer precipitation (Figure 11) exhibits an asymmetrical pattern with the highest density in Bhutan in the predicted precipittaion, whereas, the actual precipitation shwed the low denstites and lowest density was found in Bangladesh. In terms of distribution, almost all of the actual precipittaion values have been moved toward the right side; however, the highest positive move was found in Sri Lanka and Thailand, while the predicted values showed the least positive move in almost all countries.

FIGURE 11. Probability distribution function of summer actual and predicted precipitation values during 1981–2020.
In the PDF of fall precipitation (Figure 12), the density and distribution moments of precipitation are relatively high for the predicted precipitation during the selected time period. Overall, the actual precipitation values exhibited the lowest densities along with a positive shift in all countries, which indicates that the study region experienced frequent and intense precipitation during the fall season.
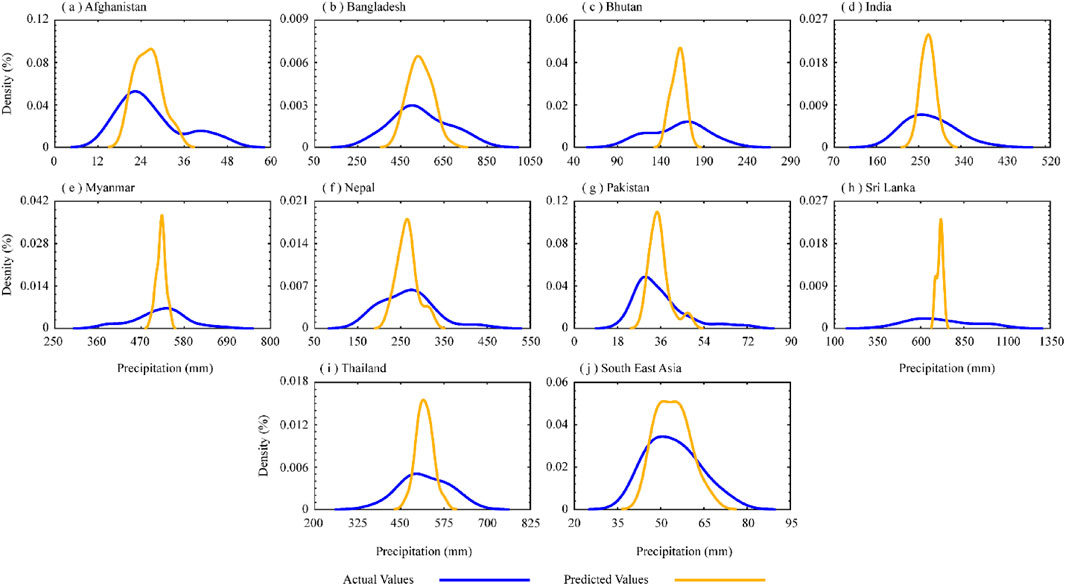
FIGURE 12. Probability distribution function of fall actual and predicted precipitation values during 1981–2020.
The PDF showed a slightly different pattern in actual precipitation values over the winter season (Figure 13). The findings reveal that the densities of the selected iterations were similar; however, their distributions were slightly different, indicating that the regions received different amounts of precipitation. In the actual values, the maximum density may be found in Nepal and India, whereas the predicted values show the highest density but a less positive shift.
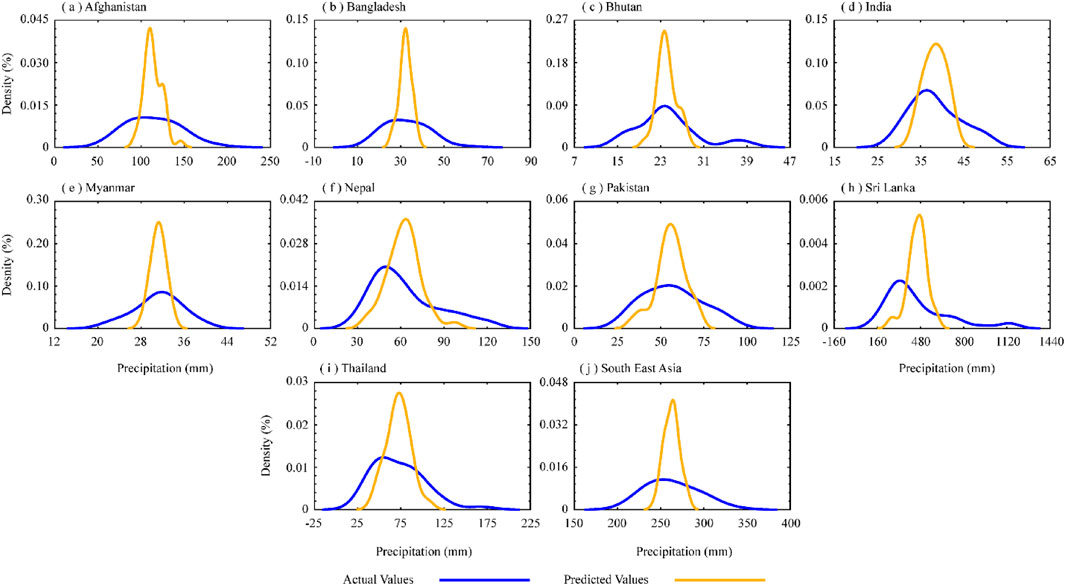
FIGURE 13. Probability distribution function of winter actual and predicted precipitation values during 1981–2020.
The overall results from Figures 9–13 show that the study region had the highest expected densities but the most positive shifts in actual precipitation values, implying that the study region had experienced numerous and severe precipitation episodes. In general, the Fall season has seen the lowest frequency of precipitation in actual values compared to predicted values, showing a decrease of model similarity. When comparing the modelled values to the observed data, the presented conclusions are useful.
5.2 Impacts of precipitation on drought
Several attempts were made to compare satellite precipitation products with data from the ground. Recently, Dandridge et al. (Dandridge et al., 2019), statistically evaluated the CHIRPS data at various temporal scales in the Lower Mekong River basin (LMRB) over SEA for drought assessment. SPI is extensively used to assess various aspects of drought events including frequency (McKee et al., 1993), intensity (Naresh Kumar et al., 2009), spatio-temporal distribution (Umran Komuscu, 1999; SIRDAŞ and Sen, 2003), and forecasting (Pandey et al., 2020).
This could be the first study in Southeast Asia to analyze precipitation products to monitor and forecast drought dangers in nine distinct countries where drought is a common phenomanon. The performance of new widely used satellite-derived precipitation products with long-term histories, such as CHIRPS, was evaluated in this work. These assessments are carried out to promote the use of satellite precipitation products in hydro-meteorological, agricultural, natural-hazards, and other studies and planning. The assessment was done monthly. The evaluation also includes a drought index, known as the Standardized Precipitation Index (SPI). The SPI-12 for SEA has shown in Figure 14 during the period 1981–2020 by using CHITPS datasets.
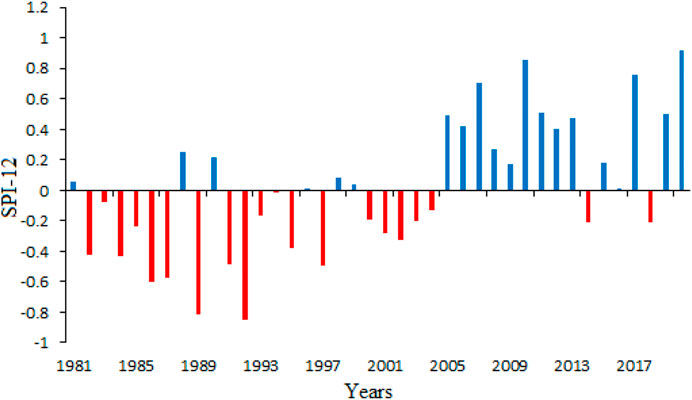
FIGURE 14. SPI-12 for SEA during 1981–2020.
The ARIMA model was used to project the SPI for drought hazard preparedness in the research region utilising the SPI time series analysis. Although the precipitation event is dependent on many dynamic and coupled processes, which necessitates very complicated coupled simulation models for prediction, the ARIMA model was used to produce a simple and reliable time series analysis. Previous research investigated the ARIMA model’s suitability for drought time series forecasting. With CHIRPS data, MAPE, and RMSE values were detected.
The relatively good results of CHIRPS are most likely owing to its higher spatial resolutions (0.05°) and integration of additional in-situ data in a two-phase process with high-resolution climatology and multi-satellite outputs in a two-phase process. Depending on the data processing technology used, it may be suggested that higher resolution data is proportionate to accuracy (Dandridge et al., 2019). This study shows that CHIRPS precipitation can be utilized as an alternative to station data for studying hydro-meteorological phenomena including long-term drought assessment at a local scale, and that it is suited for the ungagged basin.
6 Conclusion
An ARIMA model was created for this research. The presented model produces a reasonable outcome when comparing observed and predicted values with a 95 percent confidence level. As a result, this model may be useful in determining a future strategy for SEA in terms of precipitation fluctuation. According to statistical performance assessed from 1981 to 2020, the high resolution (0.05°) CHIRPS data were the most suitable for precipitation forecasting. It was discovered that SEA’s annual precipitation will rise from 2021 to 2040, as predicted. In Afghanistan and Pakistan, the annual precipitation shows a stronger trend of increasing precipitation, with RMSE values of 45.284 and 43.680 mm, respectively.
The highest fluctuating trend has been observed in the winter season of SEA precipitation in the coming years. In the spring season, India showed the MAE value at 10.955 mm and Pakistan showed 10.207 mm the lowest of all. On the other hand, Afghanistan portrayed the acceptable MAE in the summer and fall seasons. The study’s findings can be extended to other places with similar hydro-climatic circumstances for sustainable water resource management, crop planning, food security, and other watershed management-related activities. Predicting the future patterns will assist scientists and policymakers in establishing effective and efficient flood prediction, urban planning, and environmental planning techniques.
The probability density function (PDF) of precipitation at annual and seasonal scales over countries wise data in SEA was used during 1981–2020. The findings indicates that the fall season showed the lowest densities along with a positive shift in all countries in actual precipitation values. Actual values show the highest density during the winter season in Nepal and India, whereas predicted values show the highest density but a lesser positive shift.
In numerous disadvantaged drought-prone and economically poor regions, such as SEA, drought monitoring and evaluation is limited. The results of such investigations are exaggerated due to a lack of sufficient and reliable rain gauge station data. The effectiveness of satellite-derived precipitation products in monitoring and forecasting drought episodes in nine Southeast Asian countries was investigated in this study. Droughts have a significant impact on rainfed agriculture-dependent countries in Southeast Asia, which has worsened due to poor management methods and water constraint.
Data availability statement
Publicly available datasets were analyzed in this study. This data can be found here: https://data.chc.ucsb.edu/products/CHIRPS-2.0/.
Author contributions
IR proposed and AS modified the topic. The authors, AS and IR handled the data processing, data analysis. AS wrote the whole manuscript. MM and SU improved the writing. MM, SU, and HZ helped in the enhancement of the research design, data analysis, interpretation, and manuscript writing. JZ and IR finalized the manuscript. HO reviewed and edited the manuscript. All authors have read and agreed to the published version of the manuscript.
Funding
The International (Regional) Cooperation and Exchange Programs of National Natural Science Foundation of China (grant number 41961144019), National Key R&D Program of China (grant number 2018YFC1508804), the Key Scientific and Technology Research and Development Program of Jilin Province (grant number 20180201033SF), the Major Scientific and Technological Program of Jilin Province (grant number 20200503002SF), the Key Scientific and Technology Program of Jilin Province (grant number 20170204035SF), and the Science and Technology Development Planning of Jilin Province (grant number 20190303081SF).
Conflict of interest
Author MM is employed by Spatial Business Integration GmbH.
The remaining authors declare that the research was conducted in the absence of any commercial or financial relationships that could be construed as a potential conflict of interest.
Publisher’s note
All claims expressed in this article are solely those of the authors and do not necessarily represent those of their affiliated organizations, or those of the publisher, the editors and the reviewers. Any product that may be evaluated in this article, or claim that may be made by its manufacturer, is not guaranteed or endorsed by the publisher.
References
Abdullah, A. Y. M., Bhuian, M. H., Kiselev, G., Dewan, A., Hasan, Q. K., and Rafiuddin, M. (2020). Extreme temperature and rainfall events in Bangladesh: A comparison between coastal and inland areas. Int. J. Climatol. 42, 3253–3273. doi:10.1002/joc.6911
Agenda, I. C.-. (2007). Climate change 2007: The physical science basis. IPOC Change - Agenda 6, 333.
Agutu, N., Awange, J., Zerihun, A., Ndehedehe, C., Kuhn, M., and Fukuda, Y. (2017). Assessing multi-satellite remote sensing, reanalysis, and land surface models' products in characterizing agricultural drought in East Africa. Remote Sens. Environ. 194, 287–302. doi:10.1016/j.rse.2017.03.041
Al Balasmeh, O., Babbar, R., and Karmaker, T. (2019). Trend analysis and ARIMA modeling for forecasting precipitation pattern in Wadi Shueib catchment area in Jordan. Arab. J. Geosci. 12, 27–19. doi:10.1007/s12517-018-4205-z
Al-Dousari, A., Al-Nassar, W., Al-Hemoud, A., Alsaleh, A., Ramadan, A., Al-Dousari, N., et al. (2019). Solar and wind energy: Challenges and solutions in desert regions. Energy 176, 184–194. doi:10.1016/j.energy.2019.03.180
6, I. S. A. R. https://www.ipcc.ch/assessment-report/ar6/. 2021 (Accessed October 1, 2021).
Beck, H. E., Vergopolan, N., Pan, M., Levizzani, V., Van Dijk, A. I., Weedon, G. P., et al. (2017). Global-scale evaluation of 22 precipitation datasets using gauge observations and hydrological modeling. Hydrol. Earth Syst. Sci. 21, 6201–6217. doi:10.5194/hess-21-6201-2017
Box, G. E., Jenkins, G. M., Reinsel, G. C., and Ljung, G. M. (2015). Time series analysis: Forecasting and control. John Wiley & Sons.
Cardoso Da Silva, J. M., and Bates, J. M. (2002). Biogeographic patterns and conservation in the south American cerrado: A tropical savanna hotspot. BioScience 52, 225–234. doi:10.1641/0006-3568(2002)052[0225:bpacit]2.0.co;2
Chattopadhyay, G., Chakraborthy, P., and Chattopadhyay, S. (2012). Mann–Kendall trend analysis of tropospheric ozone and its modeling using ARIMA. Theor. Appl. Climatol. 110, 321–328. doi:10.1007/s00704-012-0617-y
Chattopadhyay, S. (2007). Feed forward Artificial Neural Network model to predict the average summer-monsoon rainfall in India. Acta Geophys. 55, 369–382. doi:10.2478/s11600-007-0020-8
Chin, E. H. (1977). Modeling daily precipitation occurrence process with Markov chain. Water Resour. Res. 13, 949–956. doi:10.1029/wr013i006p00949
Clark, C. O., Cole, J. E., and Webster, P. J. (2000). Indian Ocean SST and Indian summer rainfall: Predictive relationships and their decadal variability. J. Clim. 13, 2503–2519. doi:10.1175/1520-0442(2000)013<2503:iosais>2.0.co;2
Dandridge, C., Lakshmi, V., Bolten, J., and Srinivasan, R. (2019). Evaluation of satellite-based rainfall estimates in the lower mekong river basin (southeast Asia). Remote Sens. 11, 2709. doi:10.3390/rs11222709
DasGupta, R., and Shaw, R. (2015). An indicator based approach to assess coastal communities’ resilience against climate related disasters in Indian Sundarbans. J. Coast. Conserv. 19, 85–101. doi:10.1007/s11852-014-0369-1
De Jesús, A., Breña-Naranjo, J. A., Pedrozo-Acuña, A., and Alcocer Yamanaka, V. H. (2016). The use of TRMM 3B42 product for drought monitoring in Mexico. Water 8, 325. doi:10.3390/w8080325
Dhar, O., and Nandargi, S. (2003). Hydrometeorological aspects of floods in India. Nat. Hazards 28, 1–33. doi:10.1023/a:1021199714487
Driscoll, C. T., Driscoll, K. M., Mitchell, M. J., and Raynal, D. J. (2003). Effects of acidic deposition on forest and aquatic ecosystems in New York State. Environ. Pollut. 123, 327–336. doi:10.1016/s0269-7491(03)00019-8
Du, L., Mikle, N., Zou, Z., Huang, Y., Shi, Z., Jiang, L., et al. (2018). Global patterns of extreme drought-induced loss in land primary production: Identifying ecological extremes from rain-use efficiency. Sci. Total Environ. 628, 611–620. doi:10.1016/j.scitotenv.2018.02.114
Feng, G., Cobb, S., Abdo, Z., Fisher, D. K., Ouyang, Y., Adeli, A., et al. (2016). Trend analysis and forecast of precipitation, reference evapotranspiration, and rainfall deficit in the Blackland Prairie of Eastern Mississippi. J. Appl. Meteorol. Climatol. 55, 1425–1439. doi:10.1175/jamc-d-15-0265.1
Ferm, M., Watt, J., O’Hanlon, S., De Santis, F., and Varotsos, C. (2006). Deposition measurement of particulate matter in connection with corrosion studies. Anal. Bioanal. Chem. 384, 1320–1330. doi:10.1007/s00216-005-0293-1
Funk, C. C., Peterson, P. J., Landsfeld, M. F., Pedreros, D. H., Verdin, J. P., Rowland, J. D., et al. (2014). A quasi-global precipitation time series for drought monitoring. U. S. Geol. Surv. data Ser. 832, 1–12.
Funk, C., Peterson, P., Landsfeld, M., Pedreros, D., Verdin, J., Shukla, S., et al. (2015). The climate hazards infrared precipitation with stations—A new environmental record for monitoring extremes. Sci. Data 2, 1–21. doi:10.1038/sdata.2015.66
Guttman, N. B. (1998). Comparing the palmer drought index and the standardized precipitation index 1. J. Am. Water Resour. Assoc. 34, 113–121. doi:10.1111/j.1752-1688.1998.tb05964.x
Habitou, N., Morabbi, A., Ouazar, D., Bouziane, A., Hasnaoui, M. D., and Sabri, H. (2020). CHIRPS precipitation open data for drought monitoring: Application to the tensift basin, Morocco. J. Appl. Remote Sens. 14, 034526.
Han, P., Wang, P., Tian, M., Zhang, S., Liu, J., and Zhu, D. 2013. “Application of the ARIMA models in drought forecasting using the standardized precipitation index,” in Proceedings of International Conference on Computer and Computing Technologies in Agriculture, 352–358.
Higashino, M., and Stefan, H. G. (2019). Variability and change of precipitation and flood discharge in a Japanese river basin. J. Hydrology Regional Stud. 21, 68–79. doi:10.1016/j.ejrh.2018.12.003
Ionita, M., Scholz, P., and Chelcea, S. (2016). Assessment of droughts in Romania using the standardized precipitation index. Nat. Hazards (Dordr). 81, 1483–1498. doi:10.1007/s11069-015-2141-8
Islam, M., and Sivakumar, B. (2002). Characterization and prediction of runoff dynamics: A nonlinear dynamical view. Adv. water Resour. 25, 179–190. doi:10.1016/s0309-1708(01)00053-7
Jones, C., Waliser, D. E., Lau, K., and Stern, W. (2004). Global occurrences of extreme precipitation and the Madden–Julian oscillation: Observations and predictability. J. Clim. 17, 4575–4589. doi:10.1175/3238.1
Khan, B., Iqbal, M. J., and Yosufzai, M. A. K. (2011). Flood risk assessment of river Indus of Pakistan. Arab. J. Geosci. 4, 115–122. doi:10.1007/s12517-009-0110-9
Khan, I., Waqas, T., and Ullah, S. (2020). Precipitation variability and its trend detection for monitoring of drought hazard in northern mountainous region of Pakistan. Arab. J. Geosci. 13, 1–18. doi:10.1007/s12517-020-05700-4
Khan, S., Ganguly, A. R., and Saigal, S. (2005). Detection and predictive modeling of chaos in finite hydrological time series. Nonlinear process. geophys. 12, 41–53. doi:10.5194/npg-12-41-2005
Khodadoust Siuki, S., Saghafian, B., and Moazami, S. (2017). Comprehensive evaluation of 3-hourly TRMM and half-hourly GPM-IMERG satellite precipitation products. Int. J. Remote Sens. 38, 558–571. doi:10.1080/01431161.2016.1268735
Kim, B. S., Hossein, S. Z., and Choi, G. (2011). Evaluation of temporal-spatial precipitation variability and prediction using seasonal ARIMA model in Mongolia. KSCE J. Civ. Eng. 15, 917–925. doi:10.1007/s12205-011-1097-9
Kumar, P., Shah, S. F., Uqaili, M. A., Kumar, L., and Zafar, R. F. (2021). Forecasting of drought: A case study of water-stressed region of Pakistan. Atmosphere 12, 1248. doi:10.3390/atmos12101248
Kumar, V., Jain, S. K., and Singh, Y. (2010). Analysis of long-term rainfall trends in India. Hydrological Sci. J. 55, 484–496. doi:10.1080/02626667.2010.481373
Lan, Z., Zhao, Y., Zhang, J., Jiao, R., Khan, M. N., Sial, T. A., et al. (2021). Long-term vegetation restoration increases deep soil carbon storage in the Northern Loess Plateau. Sci. Rep. 11, 1–11. doi:10.1038/s41598-021-93157-0
Lau, K., and Yang, S. (1997). Climatology and interannual variability of the Southeast Asian summer monsoon. Adv. Atmos. Sci. 14, 141–162. doi:10.1007/s00376-997-0016-y
Li, X., Zhang, K., Gu, P., Feng, H., Yin, Y., Chen, W., et al. (2021). Changes in precipitation extremes in the Yangtze River Basin during 1960–2019 and the association with global warming, ENSO, and local effects. Sci. Total Environ. 760, 144244. doi:10.1016/j.scitotenv.2020.144244
Lieberman, V., and Buckley, B. (2012). The impact of climate on Southeast Asia, circa 950–1820: New findings. Mod. Asian Stud. 46, 1049–1096. doi:10.1017/s0026749x12000091
Loo, Y. Y., Billa, L., and Singh, A. (2015). Effect of climate change on seasonal monsoon in Asia and its impact on the variability of monsoon rainfall in Southeast Asia. Geosci. Front. 6, 817–823. doi:10.1016/j.gsf.2014.02.009
Maharjan, A., de Campos, R. S., Singh, C., Das, S., Srinivas, A., Bhuiyan, M. R. A., et al. (2020). Migration and household adaptation in climate-sensitive hotspots in South Asia. Curr. Clim. Change Rep. 6, 1–16. doi:10.1007/s40641-020-00153-z
McKee, T. B., Doesken, N. J., and Kleist, J. 1993. “The relationship of drought frequency and duration to time scales,” in Proceedings of proceedings of the 8th conference on applied climatology, 179–183.
McNally, A., Arsenault, K., Kumar, S., Shukla, S., Peterson, P., Wang, S., et al. (2017). A land data assimilation system for sub-Saharan Africa food and water security applications. Sci. Data 4, 170012–170019. doi:10.1038/sdata.2017.12
Miao, R., Liu, Y., Wu, L., Wang, D., Liu, Y., Miao, Y., et al. (2022). Effects of long-term grazing exclusion on plant and soil properties vary with position in dune systems in the Horqin Sandy Land. Catena 209, 105860. doi:10.1016/j.catena.2021.105860
Mishra, A., and Desai, V. (2005). Drought forecasting using stochastic models. Stoch. Environ. Res. Risk Assess. 19, 326–339. doi:10.1007/s00477-005-0238-4
Morid, S., Smakhtin, V., and Bagherzadeh, K. (2007). Drought forecasting using artificial neural networks and time series of drought indices. Int. J. Climatol. 27, 2103–2111. doi:10.1002/joc.1498
Murthy, K. N., Saravana, R., and Kumar, K. V. (2018). Modeling and forecasting rainfall patterns of southwest monsoons in North–East India as a SARIMA process. Meteorol. Atmos. Phys. 130, 99–106. doi:10.1007/s00703-017-0504-2
Naheed, G., and Rasul, G. (2011). Investigation of rainfall variability for Pakistan. Pak. J. Meteorol. 7, 25–32.
Naresh Kumar, M., Murthy, C., Sesha Sai, M., and Roy, P. 2009. On the use of Standardized Precipitation Index (SPI) for drought intensity assessment. Meteorol. Appl. 16, 381–389. doi:10.1002/met.136
Nashwan, M. S., Shahid, S., Dewan, A., Ismail, T., and Alias, N. (2020). Performance of five high resolution satellite-based precipitation products in arid region of Egypt: An evaluation. Atmos. Res. 236, 104809. doi:10.1016/j.atmosres.2019.104809
Nawaz, A., and Farooq, M. (2021). Agricultural practices and sustainable management in South asia. Life Land, 36–48.
Ng, D. H. L., Li, R., Raghavan, S. V., and Liong, S.-Y. (2017). Investigating the relationship between aerosol optical depth and precipitation over Southeast Asia with relative humidity as an influencing factor. Sci. Rep. 7, 13395–13413. doi:10.1038/s41598-017-10858-1
Pan, D., and Chen, H. (2021). Border pollution reduction in China: The role of livestock environmental regulations. China Econ. Rev. 69, 101681. doi:10.1016/j.chieco.2021.101681
Pandey, V., Srivastava, P. K., Mall, R., Munoz-Arriola, F., and Han, D. (2020). Multi-satellite precipitation products for meteorological drought assessment and forecasting in Central India. Geocarto Int. 37, 1899–1918. doi:10.1080/10106049.2020.1801862
Pandey, V., Srivastava, P. K., Singh, S. K., Petropoulos, G. P., and Mall, R. K. (2021). Drought identification and trend analysis using long-term CHIRPS satellite precipitation product in bundelkhand, India. Sustainability 13, 1042. doi:10.3390/su13031042
Reddy, P. R. C., and Salvekar, P. (2003). Equatorial east Indian ocean sea surface temperature: A new predictor for seasonal and annual rainfall. Curr. Sci., 1600–1604.
Rousta, I., Doostkamian, M., Haghighi, E., and Mirzakhani, B. (2016). Statistical-synoptic analysis of the atmosphere thickness pattern of Iran’s pervasive frosts. Climate 4, 41. doi:10.3390/cli4030041
Rousta, I., Doostkamian, M., Taherian, A. M., Haghighi, E., Ghafarian Malamiri, H. R., and Ólafsson, H. (2017). Investigation of the spatio-temporal variations in atmosphere thickness pattern of Iran and the Middle East with special focus on precipitation in Iran. Climate 5, 82. doi:10.3390/cli5040082
Rousta, I., Javadizadeh, F., Dargahian, F., Ólafsson, H., Shiri-Karimvandi, A., Vahedinejad, S. H., et al. (2018). Investigation of vorticity during prevalent winter precipitation in Iran. Adv. Meteorology 2018, 6941501–6941513. doi:10.1155/2018/6941501
Rousta, I., Olafsson, H., Moniruzzaman, M., Ardö, J., Zhang, H., Mushore, T. D., et al. (2020). The 2000–2017 drought risk assessment of the Western and southwestern basins in Iran. Model. Earth Syst. Environ. 6, 1201–1221. doi:10.1007/s40808-020-00751-8
Rousta, I., Olafsson, H., Moniruzzaman, M., Zhang, H., Liou, Y.-A., Mushore, T. D., et al. (2020). Impacts of drought on vegetation assessed by vegetation indices and meteorological factors in Afghanistan. Remote Sens. 12, 2433. doi:10.3390/rs12152433
Salehie, O., Ismail, T., Shahid, S., Ahmed, K., Adarsh, S., Asaduzzaman, M., et al. (2021). Ranking of gridded precipitation datasets by merging compromise programming and global performance index: A case study of the amu darya basin. Theor. Appl. Climatol. 144, 985–999. doi:10.1007/s00704-021-03582-4
Seager, R., Tzanova, A., and Nakamura, J. (2009). Drought in the southeastern United States: Causes, variability over the last millennium, and the potential for future hydroclimate change. J. Clim. 22, 5021–5045. doi:10.1175/2009jcli2683.1
Shah, S. I. A., Zhou, J., and Shah, A. A. (2019). Ecosystem-based Adaptation (EbA) practices in smallholder agriculture; emerging evidence from rural Pakistan. J. Clean. Prod. 218, 673–684. doi:10.1016/j.jclepro.2019.02.028
Shahzaman, M., Zhu, W., Ullah, I., Mustafa, F., Bilal, M., Ishfaq, S., et al. (2021). Comparison of multi-year reanalysis, models, and satellite remote sensing products for agricultural drought monitoring over South asian countries. Remote Sens. 13, 3294. doi:10.3390/rs13163294
Shen, Y., Xiong, A., Hong, Y., Yu, J., Pan, Y., Chen, Z., et al. (2014). Uncertainty analysis of five satellite-based precipitation products and evaluation of three optimally merged multi-algorithm products over the Tibetan Plateau. Int. J. remote Sens. 35, 6843–6858. doi:10.1080/01431161.2014.960612
Shukla, S., McNally, A., Husak, G., and Funk, C. (2014). A seasonal agricultural drought forecast system for food-insecure regions of East Africa. Hydrol. Earth Syst. Sci. 18, 3907–3921. doi:10.5194/hess-18-3907-2014
Sirdaş, S., and Sen, Z. (2003). Spatio-temporal drought analysis in the Trakya region, Turkey. Hydrological Sci. J. 48, 809–820. doi:10.1623/hysj.48.5.809.51458
Sivakumar, B. (2001). Is a chaotic multi‐fractal approach for rainfall possible? Hydrol. Process. 15, 943–955. doi:10.1002/hyp.260
Svoboda, M., Hayes, M., and Wood, D. J. W. M. O. G. (2012). Standardized precipitation index user guide, 900. Switzerland.
Syed, A., Liu, X., Moniruzzaman, M., Rousta, I., Syed, W., Zhang, J., et al. (2021). Assessment of climate variability among seasonal trends using in situ measurements: A case study of Punjab, Pakistan. Atmosphere 12, 939. doi:10.3390/atmos12080939
Syed, A., Zhang, J., Moniruzzaman, M., Rousta, I., Omer, T., Ying, G., et al. (2021). Situation of urban mobility in Pakistan: Before, during, and after the COVID-19 lockdown with climatic risk perceptions. Atmosphere 12, 1190. doi:10.3390/atmos12091190
Taneja, K., Ahmad, S., Ahmad, K., and Attri, S. (2016). Time series analysis of aerosol optical depth over New Delhi using Box–Jenkins ARIMA modeling approach. Atmos. Pollut. Res. 7, 585–596. doi:10.1016/j.apr.2016.02.004
Trenberth, K. E. (2011). Changes in precipitation with climate change. Clim. Res. 47, 123–138. doi:10.3354/cr00953
Tzanis, C., and Varotsos, C. (2008). Tropospheric aerosol forcing of climate: A case study for the greater area of Greece. Int. J. Remote Sens. 29, 2507–2517. doi:10.1080/01431160701767575
Ullah, S., You, Q., Ullah, W., and Ali, A. (2018). Observed changes in precipitation in China-Pakistan economic corridor during 1980–2016. Atmos. Res. 210, 1–14. doi:10.1016/j.atmosres.2018.04.007
Ullah, S., You, Q., Ullah, W., Hagan, D. F. T., Ali, A., Ali, G., et al. (2019). Daytime and nighttime heat wave characteristics based on multiple indices over the China–Pakistan economic corridor. Clim. Dyn. 53, 6329–6349. doi:10.1007/s00382-019-04934-7
Ullah, S., You, Q., Zhang, Y., Bhatti, A. S., Ullah, W., Hagan, D. F. T., et al. (2020). Evaluation of CMIP5 models and projected changes in temperatures over South Asia under global warming of 1.5 oC, 2 oC, and 3 oC. Atmos. Res. 246, 105122. doi:10.1016/j.atmosres.2020.105122
Ullah, W., Wang, G., Lou, D., Ullah, S., Bhatti, A. S., Ullah, S., et al. (2021). Large-scale atmospheric circulation patterns associated with extreme monsoon precipitation in Pakistan during 1981–2018. Atmos. Res. 253, 105489. doi:10.1016/j.atmosres.2021.105489
Umran Komuscu, A. (1999). Using the SPI to analyze spatial and temporal patterns of drought in Turkey, 49. Drought Network News.
Wang, B., and Ho, L (2002). Rainy season of the Asian–Pacific summer monsoon. J. Clim. 15, 386–398. doi:10.1175/1520-0442(2002)015<0386:rsotap>2.0.co;2
Wang, H., Wang, C., Lin, X., and Kang, J. (2014). An improved ARIMA model for precipitation simulations. Nonlinear process. geophys. 21, 1159–1168. doi:10.5194/npg-21-1159-2014
Webster, P. J., Magana, V. O., Palmer, T., Shukla, J., Tomas, R., Yanai, M., et al. (1998). Monsoons: Processes, predictability, and the prospects for prediction. J. Geophys. Res. 103, 14451–14510. doi:10.1029/97jc02719
Yao, C., Qian, W., Yang, S., and Lin, Z. (2010). Regional features of precipitation over Asia and summer extreme precipitation over Southeast Asia and their associations with atmospheric–oceanic conditions. Meteorol. Atmos. Phys. 106, 57–73. doi:10.1007/s00703-009-0052-5
Zhang, K., Ali, A., Antonarakis, A., Moghaddam, M., Saatchi, S., Tabatabaeenejad, A., et al. (2019). The sensitivity of North American terrestrial carbon fluxes to spatial and temporal variation in soil moisture: An analysis using radar‐derived estimates of root‐zone soil moisture. J. Geophys. Res. Biogeosci. 124, 3208–3231. doi:10.1029/2018jg004589
Zhang, K., Wang, S., Bao, H., and Zhao, X. (2019). Characteristics and influencing factors of rainfall-induced landslide and debris flow hazards in Shaanxi Province, China. Nat. Hazards Earth Syst. Sci. 19, 93–105. doi:10.5194/nhess-19-93-2019
Zhao, X., Xia, H., Pan, L., Song, H., Niu, W., Wang, R., et al. (2021). Drought monitoring over Yellow River basin from 2003–2019 using reconstructed MODIS land surface temperature in Google Earth Engine. Remote Sens. 13, 3748. doi:10.3390/rs13183748
Keywords: precipitation, Autoregressive Integrated Moving Average (ARIMA), Climate Hazard Group InfraRed Precipitation with Stations (CHIRPS), Standardized Precipitation Index (SPI), Southeast Asia (SEA)
Citation: Syed A, Zhang J, Rousta I, Olafsson H, Ullah S, Moniruzzaman M and Zhang H (2022) Statistical analysis of precipitation variations and its forecasting in Southeast Asia using remote sensing images. Front. Environ. Sci. 10:832427. doi: 10.3389/fenvs.2022.832427
Received: 09 December 2021; Accepted: 30 August 2022;
Published: 26 September 2022.
Edited by:
Chenghao Wang, University of Oklahoma, United StatesReviewed by:
Abu Reza Md. Towfiqul Islam, Begum Rokeya University, BangladeshMD Wahiduzzaman, University of Tasmania, Australia
Copyright © 2022 Syed, Zhang, Rousta, Olafsson, Ullah, Moniruzzaman and Zhang. This is an open-access article distributed under the terms of the Creative Commons Attribution License (CC BY). The use, distribution or reproduction in other forums is permitted, provided the original author(s) and the copyright owner(s) are credited and that the original publication in this journal is cited, in accordance with accepted academic practice. No use, distribution or reproduction is permitted which does not comply with these terms.
*Correspondence: Jiquan Zhang, emhhbmdqcTAyMkBuZW51LmVkdS5jbg==